Introduction
Squamous cell carcinoma of the head and neck (SCCHN)
is the sixth most common malignancy worldwide. Approximately
500,000 new cases and 320,000 deaths are reported annually
(1). Despite major technical
improvements in both surgery and radiotherapy, the 5-year survival
has not changed during the past three decades and remains at
approximately 50% (2–4). The head and neck region includes
several different sites such as the oral cavity, pharynx, larynx,
nasal cavity, paranasal sinuses and salivary glands, and the
clinical behaviour, prognosis and response to treatment varies
between tumours from different sites. Major contributing factors to
the non-improved 5-year survival are the lack of good biomarkers
for predicting treatment response and prognosis and the fact that
tumours are often detected at a late stage (4,5).
One commonly used strategy for the identification of
novel therapeutic targets and biomarkers is the investigation of
levels of gene expression in tumours compared to normal tissue, and
a number of possible targets for treatment that are overexpressed
at the mRNA level, for example EGFR and VEGF, are
currently used in clinical trials (6,7).
Quantitative real-time PCR (q-PCR) is the most
commonly used method in small scale gene expression studies due to
its rapidity, high sensitivity and good reliability (8,9). One
of the most debated and critical factors for the detection of
differences in gene expression is normalization, and errors here
may result in misinterpretation of the results (10). Even though a variety of strategies
have been employed, the normalization of results using a single
internal constitutively expressed reference gene is generally
accepted as the standard approach (9,10).
The most basic requirement on an internal reference gene is that it
is stably expressed between cells or tissues under the conditions
being investigated. In recent years, it has become clear that no
single such gene exists; instead, many of the commonly used
reference genes have been shown to vary, for example during
differentiation, cell growth and different disease states,
illustrating the need to verify the stability of a reference gene
in all tissues and under all experimental conditions used (9,11).
Archival formalin-fixed paraffin-embedded (FFPE)
patient material is a large source for research. However, due to
the fragmented nature of RNA in these samples, they have been of
limited use (12,13). Methods for the extraction and
analysis of RNA from these samples have been developed during the
last few years, and studies utilizing FFPE samples are becoming
more common (14,15). RNA from these samples is not only
fragmented but also highly modified, rendering it resistant to
reverse transcriptase reactions. Verification of proper reference
genes is therefore of great importance in these samples.
Here, we investigated the stability of eight
potential reference genes in FFPE samples from normal oral tissue
and oral squamous cell carcinomas (OSCCs). Two publicly available
software packages (GeNorm and NormFinder) were used to analyse
data, and tubulin α-6 chain (TUBA6) and ribosomal protein
S13 (RPS13) were identified as stable reference genes in
both normal and malignant oral tissue.
Materials and methods
Samples and RNA extraction
FFPE samples from 10 patients with OSCC and 10
patients with benign oral conditions, such as hyperplasia, were
available for analysis. The material comprised tissue from the
gingiva (tumour, n=5; control, n=2), hard palate (control, n=2),
tongue (tumour, n=4; control, n=4) and buccal mucosa (tumour, n=1;
control, n=2). The study was approved by the local Ethics Committee
at the Umeå University (dnr 01-057 and dnr 08-003M). FFPE samples
were cut into 5-μm sections and, depending on the size of the
sample, 3–20 sections were pooled giving an approximate total area
of 1 cm2. RNA was isolated using the High Pure RNA Paraffin kit
(Roche Diagnostics GmbH, Mannheim, Germany) according to the
manufacturer’s instructions. RNA from the pharyngeal squamous cell
carcinoma cell line FaDu was extracted by the use of TRIzol
(Invitrogen, Carlsbad, CA, USA) and used when creating standard
curves for all primers in the q-PCR reaction. The purity of the RNA
samples was evaluated by the 260/280-and the 260/230-nm absorbance
ratio.
Quantitative real-time PCR (q-PCR)
Primers were designed using Primer 3 software, and
their specificity was evaluated using the primer search in NCBI
BLAST. All amplicons were kept under 100 bp in order to optimize
the conditions for the amplification of degraded RNA and were also
designed to span an intron, to avoid the amplification of genomic
DNA (Table I) (16). First-strand cDNA was synthesised
using the Cloned AMV First-Strand cDNA Synthesis kit (Invitrogen)
using 200 ng of RNA and random primers in a 20-μl reaction mixture.
The cDNA reaction (1 μl) was used as template for the amplification
of TUBA6, S100A6, ACTB, OAZ1,
GAPDH, RPS13, RPL27 and HPRT1,
respectively. The q-PCR reaction was carried out in a 20-μl
reaction using IQ SYBR Green Supermix (BioRad, Hercules, CA, USA)
according to the manufacturer’s recommendations. Reactions were
carried out in triplicate. For a selection of genes (RPS13,
OAZ1 and RPL27) all samples having a standard
deviation (σ) > 0.3 between the three replicates were re-run at
a later occasion for the evaluation of the reproducibility of the
assay.
 | Table I.Gene and primer information. |
Table I.
Gene and primer information.
| Gene | Accession no. | Full name | Location | Primer | Size (bp) | Efficiencya |
|---|
| TUBA6 | NM_032704 | Tubulin α-6
chain | 12q12-q14 | F:
CCGGGCAGTGTTTGTAGACT | 99 | 2.04 |
| | | | R:
TTGCCTGTGATGAGTTGCTC | | |
| S100A6 | NM_014624 | S100 calcium binding
protein A6 | 1q21 | F:
ACAAGCACACCCTGAGCAAGA | 99 | 1.92 |
| | | | R:
CCATCAGCCTTGCAATTTCA | | |
| ACTB | NM_001101 | β-actin | 7p15-p12 | F:
CCAACCGCGAGAAGATGAC | 96 | 1.88 |
| | | | R:
CAGAGGCGTACAGGGATAGC | | |
| OAZ1 | NM_004152 | Ornithine
decarboxylase antizyme | 19p13.3 | F:
GAGCCGACCATGTCTTCATT | 84 | 1.99 |
| | | | R:
CAAAGCCCAAAAAGCTGAAG | | |
| GAPDH | NM_002046 |
Glyceraldehyde-3-phosphate
dehydrogenase | 12p13 | F:
CTCTGCTCCTCCTGTTCGAC | 99 | 2.00 |
| | | | R:
TTGACTCCGACCTTCACCTT | | |
| RPS13 | NM_001017 | Ribosomal protein
S13 | 11p15 | F:
CAGTCGGCTTTACCCTATCG | 95 | 1.99 |
| | | | R:
CCCTTCTTGGCCAGTTTGTA | | |
| RPL27 | NM_000988 | Ribosomal protein
L27 | 17q21.1-21.2 | F:
ATGAAACCTGGGAAGGTGGT | 90 | 2.00 |
| | | | R:
TGAGGTGCCATCATCAATGT | | |
| HPRT1 | NM_000194 | Hypoxanthine
phosphoribosyltransferase 1 | Xq21.6 | F:
TCCTTGGTCAGGCAGTATAATCC | 90 | 1.99 |
| | | | R:
GTCTGGCTTATATCCAACACTTCG | | |
Statistical analysis
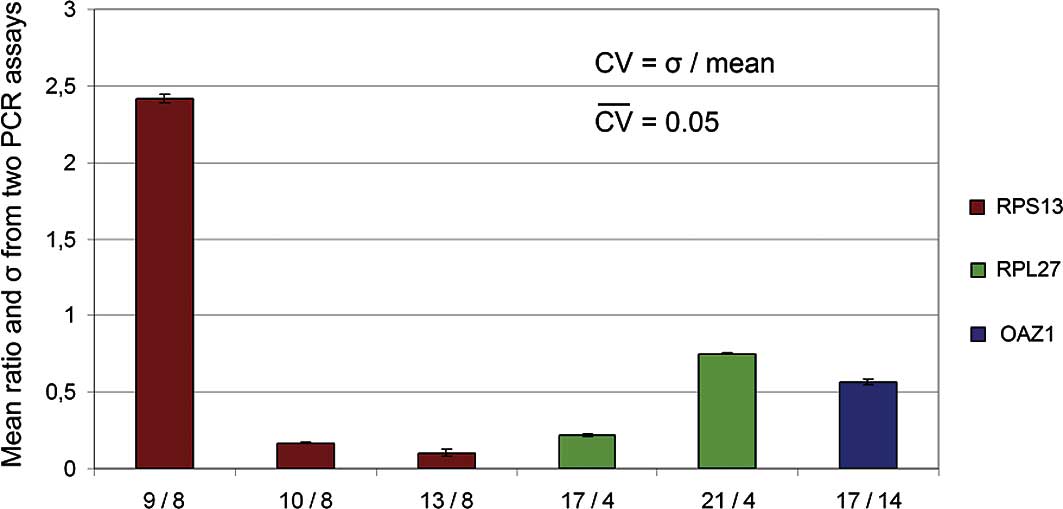
Ct values from the PCR reaction were transformed to
relative quantities using the relative standard curve method
(17). Identical PCR reactions
carried out at two different time points generate different
relative quantities, and a dimensionless dispersion parameter like
the coefficient of variation (CV) is therefore needed to evaluate
the reproducibility of the assay. CV is calculated by dividing the
σ-value by the mean. Ratios, necessary for calculating the
CV-values, were obtained by dividing samples to one arbitrarily
chosen sample analysed with the same primer and from the same run.
The σ-value and the mean for each ratio was then calculated between
the two runs and divided to calculate the CV-values.
For comparing the stabilities of the candidate
genes, two publicly available software packages, GeNorm, a Visual
Basic application tool for Microsoft Excel, and NormFinder, a
Microsoft Excel add-in, were used (18,19)
according to the developer’s instructions. In NormFinder, samples
were grouped according to the origin of tissue or the presence or
absence of malignancy. A Mann-Whitney U test was used to
pre-evaluate the stability of the genes.
Results
Selection of reference gene candidates
and design of primers
Eight genes previously described to have
housekeeping properties were selected for the investigation of
stability in FFPE samples of normal oral tissue and SCCHN. This
included a number of commonly used reference genes, e.g.,
ACTB and GAPDH, but also more recently suggested
reference genes such as OAZ1 and TUBA6 (18,20).
Genes of different functions and location in the genome were
selected in order to reduce the risk of co-regulation between
genes, which would influence particularly results from GeNorm
calculations. However, the two ribosomal genes RPL27 and
RPS13, which are likely to show correlated expression, were
included, as both were reported to have stable expression over a
large number of tissues and conditions in a recent study covering
13,629 gene expression arrays (20). Primers optimal for the
amplification of degraded RNA were designed for each gene (21). Data on selected genes and primers
are summarized in Table I.
Expression levels of the eight candidate
genes
All samples were analyzed for one gene at a time on
a single PCR plate. RNA extracted from the cell line FaDu, which
highly expresses all eight selected reference genes, was used in
parallel for obtaining standard curves. All primers showed high
efficiency (1.9-2.1) except ACTB, which had a slightly lower
efficiency of 1.88 (Table I). The
PCR reaction first included two replicates of each sample, but this
was increased to three as standard deviations >0.3 were noted
between some of the replicates. All samples run with two replicates
were re-analyzed using three replicates. To investigate the
reproducibility of the assay, all samples showing a σ > 0.3 for
three of the genes were also re-analyzed a second time, and
CV-values were calculated between the runs. The mean CV was 0.05,
showing that the use of three replicates was sufficient to provide
highly reproducible means. A bar graph over the means and σ-values
of ratios between the two runs is shown in Fig. 1.
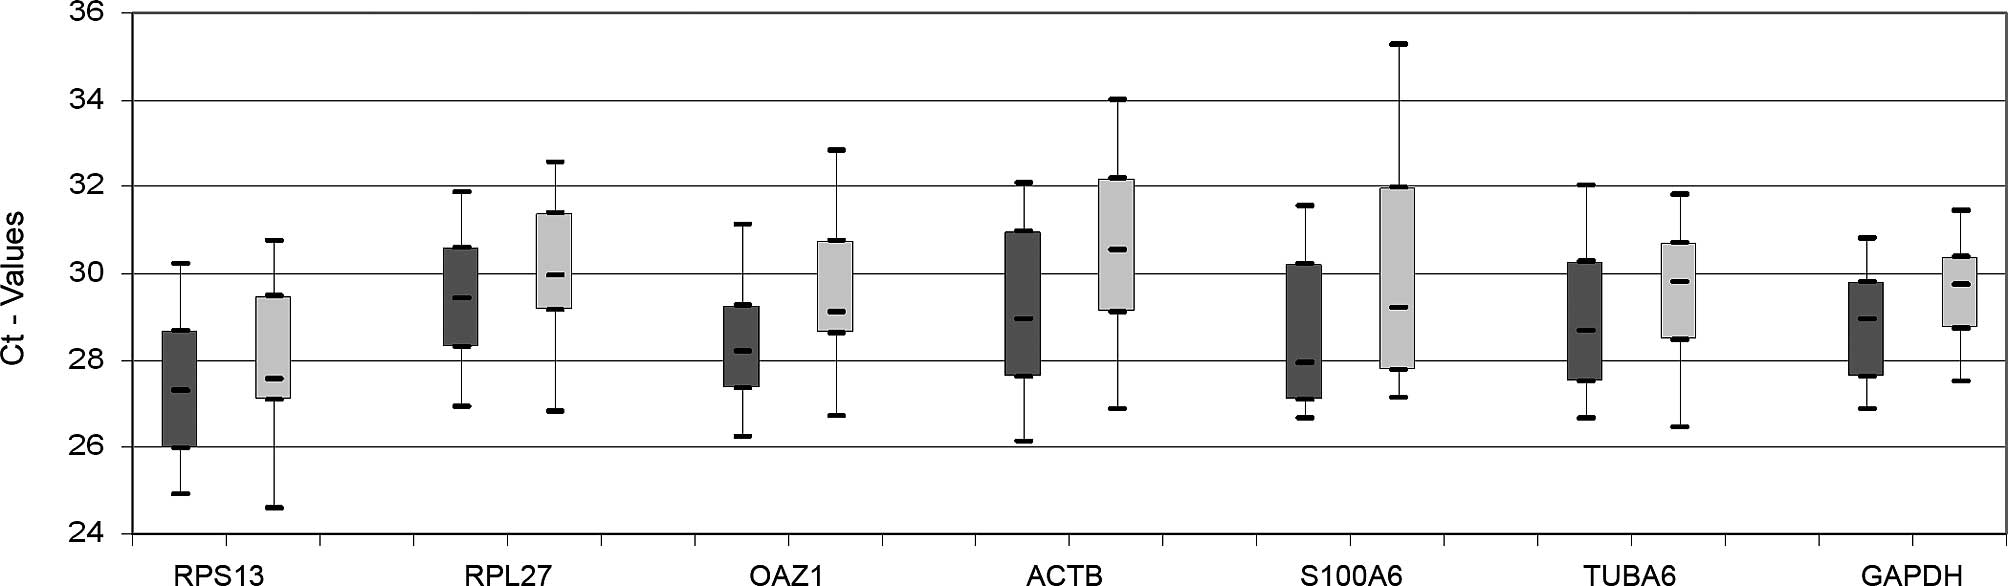
HPRT1, one of the candidate reference genes
generally showed high Ct-values and could not be detected in some
of the samples. This gene was therefore excluded from further
analysis. The other seven genes were all detected between 25–35
cycles. Data for malignant and non-malignant samples are shown as
separate box plots in Fig. 2. The
expression ranges span from 6.2 cycles (GAPDH) to 10.7
cycles (ACTB). None of the genes showed a significantly
different expression between tumours and controls using the
Mann-Whitney U test. Although a significance test could indicate a
gene’s unfitness as a reference, it is important to keep in mind
that these calculations were based on non-normalized data relying
on equal input material, which is difficult to control; hence, the
reason there is a need for good reference genes. Due to this
circular problem, a number of programs (GenNorm and NormFinder)
using alternative strategies to simple significance testing have
been developed for the evaluation of reference gene stability
(10).
Expression stability of candidate genes
in control and tumour samples
Ct-values were transformed to relative quantities
using the standard curve method and submitted to two different
software packages, GeNorm and NormFinder, for the identification of
the most stable genes. GeNorm calculates the stability of genes by
pairwise comparisons, generating M-values, and is based on the
assumption that the ratio of two proper reference genes will be
approximately similar in all samples. According to GeNorm,
RPL27 and RPL13 had the most stable expression
(Table IIA). Since GeNorm is very
sensitive to co-regulation, this could be an artefact of the two
ribosomal genes showing highly concordant expression. Data was
therefore re-analysed, sequentially excluding one of the two
ribosomal genes. Excluding RPL27 resulted in RPS13
being the most stable gene in combination with TUBA6, and
the other way around (Table
IIB).
| Table II.GeNorm. |
Table II.
GeNorm.
A, All seven genes.
|
|---|
| Gene | M-value |
|---|
| RPS13 and
RPL27 | 0.286 |
| TUBA6 | 0.385 |
| ACTB | 0.471 |
| GAPDH | 0.543 |
| OAZ1 | 0.598 |
| S100A6 | 0.763 |
B, RPL27
excluded.
|
|---|
| Gene | M-value |
|---|
| RPS13 and
TUBA6 | 0.457 |
| ACTB | 0.525 |
| GAPDH | 0.606 |
| OAZ1 | 0.648 |
| S100A6 | 0.817 |
NormFinder, which is a model-based approach that is
less sensitive to co-regulation and takes both the overall
expression variability as well as the variation between subgroups
into consideration, also suggested TUBA6 to be the most
stable reference gene, while RPS13 and RPL27 were
placed second and fifth, respectively (Table IIIA).
| Table III.NormFinder. |
Table III.
NormFinder.
A, Grouped as
malignant or non-malignant.
|
|---|
| Gene | Stability
value |
|---|
| TUBA6 | 0.161 |
| RPS13 | 0.182 |
| GAPDH | 0.187 |
| ACTB | 0.188 |
| RPL27 | 0.195 |
| OAZ1 | 0.200 |
| S100A6 | 0.314 |
B, Grouped as
gingival and palate or tongue tissue.
|
|---|
| Gene | Stability
value |
|---|
| TUBA6 | 0.114 |
| RPL27 | 0.138 |
| RPS13 | 0.139 |
| OAZ1 | 0.175 |
| ACTB | 0.194 |
| GAPDH | 0.234 |
| S100A6 | 0.289 |
Expression stability of candidate genes
in oral tissue in different sites
As NormFinder takes grouping into account, it was
also of interest to determine whether the same genes were stably
expressed between tissues at different sites in the oral cavity.
Comparing tissue from the gingival and palate (n=9) to tongue
tissue (n=8), or tissue from the gingival, palate and buccla mucosa
(n=12) to tongue tissue (n=8), TUBA6, RPL27 and
RPS13 were the three most stable genes (Table IIIB). The samples from buccal
mucosa were too few to be considered a separate group in this
comparison, as there should preferably be a minimum of eight
samples in each group.
Discussion
Employment of quantitative real-time PCR has
exploded in the last two decades, making it the golden standard in
studies of gene expression. In recent years, it has become clear
that verification of proper reference genes for each tissue and
experimental condition is essential for correct interpretation of
q-PCR expression data (9,11). This is even more important when
using FFPE tissue, as separate mRNAs in these tissues have been
shown to degrade to different extents (22). A poor overlap was also observed
when examining the stability of genes in FFPE and fresh frozen (FF)
tissue, emphasizing the importance of verifying reference genes in
FFPE tissue separately (21).
Here, we looked at eight previously identified
reference genes and investigated their stability in malignant and
non-malignant tissue from different sites in the oral cavity.
TUBA6 and RPLS13 had the most stable expression
across all samples and conditions. NormFinder and GeNorm both
placed TUBA6 and RPS13 as the two most stable
reference genes when comparing malignant and non-malignant tissue,
and NormFinder also found TUBA6 to be stably expressed
across tissues from different sites in the oral cavity. OSCCs
comprise a diverse family of tumours, where the site of the tumour
has been suggested to effect responsiveness to treatment and
clinical parameters (3).
Nevertheless, OSCC is in many studies considered one disease where
tumours from different sites in the oral cavity are grouped
together, and a reference gene verified to be stable across both
tissue and disease state is therefore essential. The commonly used
reference genes ACTB and GAPDH are generally found in
the middle of the stability list. However, when comparing tissue of
different sites they were ranked lower, indicating that these genes
may be fairly similar between cancer and controls, but less similar
between tissues. S100A6 has in a few studies been described
to significantly vary between malignant and non-malignant tissues;
it was therefore not surprising that we also found it to be the
least stable gene under all conditions (23,24).
A smaller study of four candidate genes in three cell lines (two
SCCHN cell lines and one non-malignant cell line) interestingly
found another tubulin gene (TUBB) to be stably expressed in
SCCHN cell lines (25).
Primers used on RNA from FFPE samples should span an
intron, not exceed 100 bp, preferably be located away from the 5′
end, and also be specific to the gene/splice form of interest
(21). The primer pair amplifying
ACTB was not optimal, showing a reduced efficiency of 1.88.
This was most probably caused by one of the primers having a second
perfect match to the gene ACTA1, causing competition for
primer binding and lowered PCR efficiency. This illustrates the
importance and also the difficulties in designing primers for the
amplification of RNA from FFPE material, particularly for genes of
large conserved families. The verification of the efficiency of
amplification is therefore required, though not always
performed.
Retrospective clinical studies using FFPE samples
have the potential to involve an extensive number of patients and
thus increase our understanding of neoplastic progression and
response to therapy. Identification of the appropriate reference
genes will help to better extract adequate information from these
samples. In a recent study of normal and malignant tongue FFPE, we
used TUBA6 as a reference gene in the conformational q-PCR
reactions of gene expression array data, and observed high
concordance between the two methods (26). Confirmation included both highly
and poorly expressed genes as well as large and small expression
differences, and showed that TUBA6 is a proper normaliser,
at least for tongue tissue.
Taken together, a number of studies on reference
genes in different tissues have been published lately (27–29).
However, to our knowledge this is the first study concerning
reference genes in FFPE samples from normal oral tissue and OSCC.
According to the results from this study as well as our previous
results, TUBA6 is an appropriate reference gene for FFPE
samples from the oral cavity (26).
Acknowledgements
This study was supported by grants
from the Lion’s Cancer Research Foundation, Umeå University, the
Swedish Cancer Society (contract no. 08 0371) and the Kempe
foundation.
References
|
1.
|
Shibuya K, Mathers CD, Boschi-Pinto C,
Lopez AD and Murray CJ: Global and regional estimates of cancer
mortality and incidence by site. II. Results for the global burden
of disease 2000. BMC Cancer. 2:372002. View Article : Google Scholar
|
|
2.
|
Geisler SA and Olshan AF: GSTM1, GSTT1 and
the risk of squamous cell carcinoma of the head and neck: a
mini-HuGE review. Am J Epidemiol. 154:95–105. 2001. View Article : Google Scholar : PubMed/NCBI
|
|
3.
|
Rautava J, Luukkaa M, Heikinheimo K, Alin
J, Grenman R and Happonen RP: Squamous cell carcinomas arising from
different types of oral epithelia differ in their tumor and patient
characteristics and survival. Oral Oncol. 43:911–919. 2007.
View Article : Google Scholar : PubMed/NCBI
|
|
4.
|
Bettendorf O, Piffko J and Bankfalvi A:
Prognostic and predictive factors in oral squamous cell cancer:
important tools for planning individual therapy? Oral Oncol.
40:110–119. 2004. View Article : Google Scholar : PubMed/NCBI
|
|
5.
|
Culliney B, Birhan A, Young AV, Choi W,
Shulimovich M and Blum RH: Management of locally advanced or
unresectable head and neck cancer. Oncology. 22:1152–1161.
2008.PubMed/NCBI
|
|
6.
|
Lothaire P, de Azambuja E, Dequanter D, et
al: Molecular markers of head and neck squamous cell carcinoma:
promising signs in need of prospective evaluation. Head Neck.
28:256–269. 2006. View Article : Google Scholar : PubMed/NCBI
|
|
7.
|
Shirai K and O’Brien PE: Molecular targets
in squamous cell carcinoma of the head and neck. Curr Treat Options
Oncol. 8:239–251. 2007. View Article : Google Scholar : PubMed/NCBI
|
|
8.
|
Ginzinger DG: Gene quantification using
real-time quantitative PCR: an emerging technology hits the
mainstream. Exp Hematol. 30:503–512. 2002. View Article : Google Scholar : PubMed/NCBI
|
|
9.
|
Huggett J, Dheda K, Bustin S and Zumla A:
Real-time RT-PCR normalisation; strategies and considerations.
Genes Immun. 6:279–284. 2005. View Article : Google Scholar : PubMed/NCBI
|
|
10.
|
Vandesompele J, Kubista M and Pfaffl M:
Reference gene validation software for improved normalization.
Real-Time PCR: Current Technology and Applications. 1st edition.
Logan J, Edwards K and Saunders N: Caister. Academic Press; London:
pp. 47–64. 2009
|
|
11.
|
Ruan W and Lai M: Actin, a reliable marker
of internal control? Clin Chim Acta. 385:1–5. 2007. View Article : Google Scholar : PubMed/NCBI
|
|
12.
|
Masuda N, Ohnishi T, Kawamoto S, Monden M
and Okubo K: Analysis of chemical modification of RNA from
formalin-fixed samples and optimization of molecular biology
applications for such samples. Nucleic Acids Res. 27:4436–4443.
1999. View Article : Google Scholar : PubMed/NCBI
|
|
13.
|
Von Ahlfen S, Missel A, Bendrat K and
Schlumpberger M: Determinants of RNA quality from FFPE samples.
PLoS ONE. 2:e12612007.PubMed/NCBI
|
|
14.
|
Clark-Langone KM, Wu JY, Sangli C, et al:
Biomarker discovery for colon cancer using a 761 gene RT-PCR assay.
BMC Genomics. 8:2792007. View Article : Google Scholar : PubMed/NCBI
|
|
15.
|
Penland SK, Keku TO, Torrice C, et al: RNA
expression analysis of formalin-fixed paraffin-embedded tumors. Lab
Invest. 87:383–391. 2007.PubMed/NCBI
|
|
16.
|
Rozen S and Skaletsky H: Primer3 on the
WWW for general users and for biologist programmers. Methods Mol
Biol. 132:365–386. 2000.PubMed/NCBI
|
|
17.
|
Larionov A, Krause A and Miller W: A
standard curve based method for relative real time PCR data
processing. BMC Bioinformatics. 6:622005. View Article : Google Scholar : PubMed/NCBI
|
|
18.
|
Andersen CL, Jensen JL and Orntoft TF:
Normalization of real-time quantitative reverse transcription-PCR
data: a model-based variance estimation approach to identify genes
suited for normalization, applied to bladder and colon cancer data
sets. Cancer Res. 64:5245–5250. 2004. View Article : Google Scholar
|
|
19.
|
Vandesompele J, De Preter K, Pattyn F, et
al: Accurate normalization of real-time quantitative RT-PCR data by
geometric averaging of multiple internal control genes. Genome
Biol. 3:RESEARCH0034,. 2002. View Article : Google Scholar : PubMed/NCBI
|
|
20.
|
De Jonge HJ, Fehrmann RS, de Bont ES, et
al: Evidence based selection of housekeeping genes. PLoS ONE.
2:e8982007.PubMed/NCBI
|
|
21.
|
Drury S, Anderson H and Dowsett M:
Selection of reference genes for normalization of qRT-PCR data
derived from FFPE breast tumors. Diagn Mol Pathol. 18:103–107.
2009. View Article : Google Scholar : PubMed/NCBI
|
|
22.
|
Perez-Novo CA, Claeys C, Speleman F, van
Cauwenberge P, Bachert C and Vandesompele J: Impact of RNA quality
on reference gene expression stability. Biotechniques.
39:5254562005. View Article : Google Scholar : PubMed/NCBI
|
|
23.
|
Hibbs K, Skubitz KM, Pambuccian SE, et al:
Differential gene expression in ovarian carcinoma: identification
of potential biomarkers. Am J Pathol. 165:397–414. 2004. View Article : Google Scholar : PubMed/NCBI
|
|
24.
|
Yao R, Lopez-Beltran A, Maclennan GT,
Montironi R, Eble JN and Cheng L: Expression of S100 protein family
members in the pathogenesis of bladder tumors. Anticancer Res.
27:3051–3058. 2007.PubMed/NCBI
|
|
25.
|
Campos MS, Rodini CO, Pinto-Junior DS and
Nunes FD: GAPD and tubulin are suitable internal controls for qPCR
analysis of oral squamous cell carcinoma cell lines. Oral Oncol.
45:121–126. 2009. View Article : Google Scholar : PubMed/NCBI
|
|
26.
|
Rentoft M, Laurell G, Coates P, Sjöström B
and Nylander K: Gene expression profiling of archival tongue
squamous cell carcinomas provides sub-classification based on DNA
repair genes. Int J Oncol. 35:1321–1330. 2009. View Article : Google Scholar : PubMed/NCBI
|
|
27.
|
Cicinnati VR, Shen Q, Sotiropoulos GC,
Radtke A, Gerken G and Beckebaum S: Validation of putative
reference genes for gene expression studies in human hepatocellular
carcinoma using real-time quantitative RT-PCR. BMC Cancer.
8:3502008. View Article : Google Scholar : PubMed/NCBI
|
|
28.
|
Lallemant B, Evrard A, Combescure C, et
al: Reference gene selection for head and neck squamous cell
carcinoma gene expression studies. BMC Mol Biol. 10:782009.
View Article : Google Scholar : PubMed/NCBI
|
|
29.
|
Lyng MB, Laenkholm AV, Pallisgaard N and
Ditzel HJ: Identification of genes for normalization of real-time
RT-PCR data in breast carcinomas. BMC Cancer. 8:202008. View Article : Google Scholar : PubMed/NCBI
|