Introduction
Currently, there is a worldwide epidemic of obesity,
type 2 diabetes mellitus (T2DM) and cardiovascular disease (CVD)
largely thought to be due to increased dietary caloric intake
(1-3).
A number of scientists and experts assert that the increased
consumption of sugar-sweetened beverages (SSBs) has significantly
contributed to these trends, particularly obesity, since the
worldwide consumption of sucrose has tripled over the past 50 years
(4-6).
In the USA, 77% of all calories purchased from 2005-2009 contained
sweeteners of which corn syrup, cane sugar, high-fructose corn
syrup (HCFS) and fruit juice concentrate were listed as the most
commonly used (7). A high SSB
consumption reportedly contributes to a 12% increased risk of
hypertension, 26% increased risk for T2DM and a 19% increased risk
of CVD, suggesting that further research is required regarding
dietary sources of simple sugars [mono-(glucose and fructose) and
disaccharide (sucrose)] contained in beverages, such as fruit juice
(8-10).
A conundrum exists regarding the consumption of
fruit juice. The argument in favor of 100% fruit juice as a healthy
beverage derives from the fact that Americans of all ages do not
meet their daily fruit requirement and 100% fruit juice offers most
of the nutrients of whole fruit in a less expensive, more
user-friendly form (8,11). In fact, reducing or eliminating
100% fruit juice, and consequently nutrients and fiber contained
within, could lead to unintended consequences, such as a reduced
daily fruit intake and an increased consumption of less nutritious,
calorie-dense beverages, such as soft drinks (12,13).
Moreover, numerous fruit juices are produced from exotic
‘superfruits’, such as noni, maqui, acai, goji, pomegranate, etc.,
due to their complement of beneficial bioactive, e.g., antioxidant,
compounds, which can lead to robust health benefits (14,15).
However, there is limited published information available on the
toxicity profiles of some dietary fruit juices due to their
prevalence in the food supply, common use and the general lack of
evidence that would support safety concerns. As a result, there
seems to be a misconception that fruit juices and smoothies are
also low-sugar alternatives to SSBs (4). Although fruit juices may generally be
considered safe, chronic consumption, similar to dietary
triglycerides (TG), could cause metabolic perturbations,
contributing to the risk of developing chronic diseases, such as
non-alcoholic fatty liver disease (NAFLD), e.g., liver toxicity and
renal dysfunction (16-18).
Fruit juices have been shown to induce mild to
moderate adverse effects on typical metabolic biomarkers in
different experimental models. For example, in rodent studies, the
provision of fruit juice for 48 h significantly and
dose-dependently increased liver enzyme, urea and creatinine
levels, suggesting both nephrotoxicity and hepatotoxicity (19,20).
In another study, the ingestion of pomegranate was associated with
the deaths of young cattle without prior clinical signs, although
gross subclinical pathological changes indicated hepatotoxicity
(21). In a study on noni fruit
(Morinda citrifolia), female mice fed fruit extracts for 6
months displayed chronic toxicity with clear hepatocellular
necrosis, morphological changes in liver, and death after 3 months
(22). In humans, cases of
hepatotoxicity have also been reported following the consumption of
noni juice. In two human case studies reported by Stadlbauer et
al in a single report, individuals developed sub-acute hepatic
failure and acute hepatitis following the consumption of 1.5 l
juice for 3 weeks and 2 l juice for 3 months, respectively
(23). The bottle gourd
(Lagenaria siceraria), also known as lauki, ghia or dudhi,
prescribed as part of traditional medicine, has been shown to cause
numerous signs and symptoms of gastrointestinal and hepatic injury
(24). Collectively, there are
instances where dietary and/or medicinal fruit juices have
increased the risk of hepatotoxicity.
Beverages, such as SSBs may also influence the risk
of developing kidney disease (18). In the Jackson Heart Study (n=3,003)
a higher consumption of SSBs was shown to elevate the risk of
chronic kidney disease (CKD) in a community-based cohort of
African-Americans (25). In the
Tehran Lipid and Glucose Study (n=1,690), the consumption of >4
servings of SSBs was associated with a higher prevalence and
incidence of CKD (26). In the
Atherosclerosis Risk in Communities Study (n=15,745) the
consumption of 1 SSB/day increased the prevalence of hyperuricemia
and CKD with an odds ratio of 2.59 for those consuming >1
SSB/day (17). As mentioned
previously, the consumption of star fruit juice also induces kidney
degeneration and necrosis compared to the controls, indicating
nephrotoxicity (19). In at least
one case report, an individual who consumed star fruit developed
acute kidney failure requiring dialysis (27). Thus, there are data suggesting the
potential for some dietary and/or medicinal fruit juices to cause
nephrotoxicity.
Emerging evidence supports the robust complement and
activities of bioactive molecules in functional foods, e.g., tart
cherries and beverages, such as tart cherry juice (TCJ). The
authors have conducted studies previously with TCJ investigating
the effects of consumption on inflammatory markers and uric acid in
humans, and currently report on the effects of TCJ on body
composition or metabolic parameters in at-risk individuals. The
present study enlisted overweight and obese individuals at a higher
risk for cardiometabolic abnormalities (due to increased adiposity)
compared to those with normal body weights (BMI <25.0
kg/m2) to consume 100% TCJ or the placebo beverage for 4
weeks (8 oz/day; 240 ml/day) to determine whether there were any
changes in the levels of biomarkers of renal and/or hepatic
function.
Materials and methods
Study subjects
The present study was a 10-week 2x2 crossover,
randomized, placebo-controlled dietary intervention in overweight
and obese participants (BMI ≥25.0 kg/m2) who were ≥18
years old. Respondents were excluded if they were pregnant,
diabetic, displaying unresolved infections or diseases
(inflammation, CVD, cancer, inflammatory bowel disease and liver
disease), and were current smokers (including e-cigarettes).
Histories of medication and dietary supplement use were collected,
and participants taking anti-inflammatory or lipid-lowering
medications were excluded. The respondents were screened initially
by telephone using a preliminary medical questionnaire to rule out
underlying medical conditions. All subjects provided written
informed consent. The protocols in the present study were approved
by the Institutional Review Board at Arizona State University. This
trial is registered with ClinicalTrials.gov with identifier, NCT03638362.
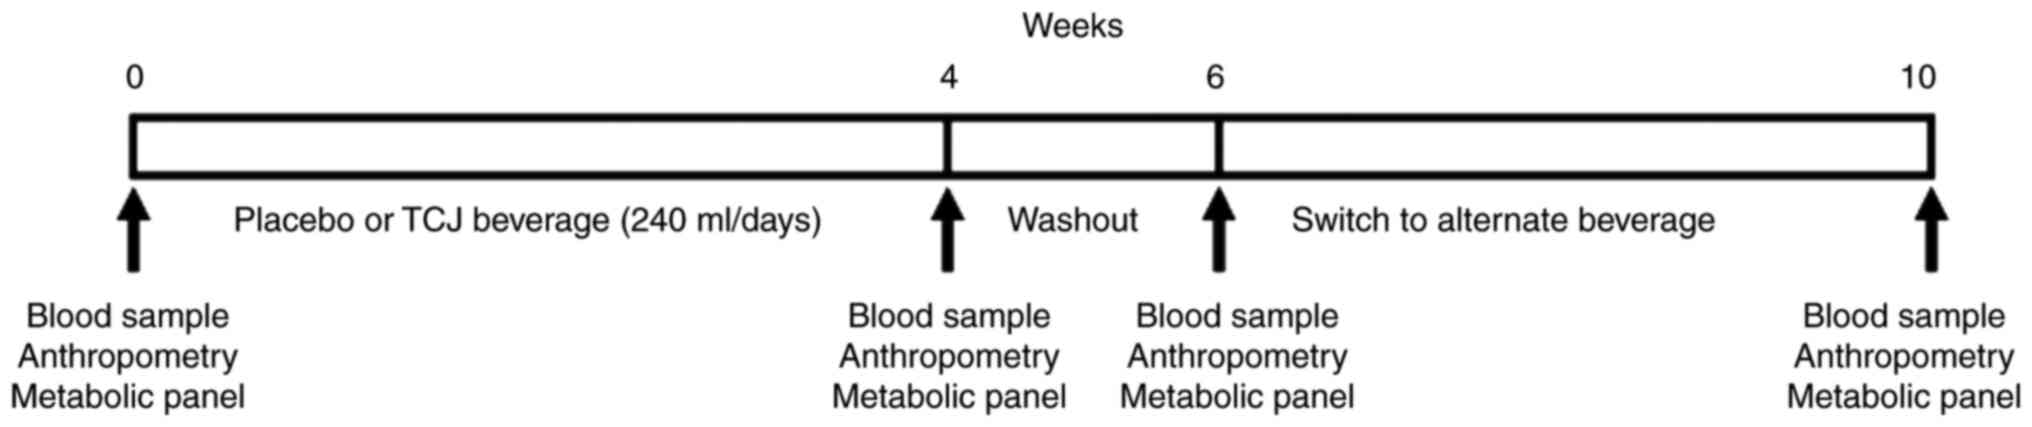
Following enrollment, the subjects were randomly
assigned to consume either 8 ounces of 100% TCJ (R.W. Knudsen) or a
generic, artificially flavored red fruit punch for 4 weeks with 5
patients per group. Following a 2-week washout period, the subjects
were switched to the alternate beverage for an additional 4 weeks
(Fig. 1). Participants were
instructed to refrain from consuming other darkly pigmented fruits
and juices during the study period, and were provided a detailed
list with specific items, i.e., cherries, to avoid. Compliance was
monitored by the review of diet records, a verbal interview and the
return of empty beverage containers.
Dietary, medical and physical activity
questionnaires and records were maintained by subjects and
collected and reviewed by study personnel. The diet record listed
all foods and beverages consumed (including placebo and tart cherry
beverages), means of preparation, time of consumption, and
amount/portion size and was analyzed using Food Processor Nutrition
and Fitness Software (ESHA, version 8.5). The medical questionnaire
included information on the use, dosage and frequency for
medication and the use of dietary supplements. Physical activity
was assessed by self-reporting using a standardized questionnaire
and overall physical activity and/or exercise determined using a
standardized scoring rubric.
Anthropometry
Following a ≥12-h fast, participants reported to the
laboratory for the measurement of body weight (via calibrated
scale), height (via calibrated stadiometer) and body composition
[body fat percentage, fat mass, fat-free mass, total body water,
basal metabolic rate (BMR)], as measured by bioelectrical impedance
(TBF 300A Tanita Body Composition Analyzer). BMI and BMR were
recalculated at each visit.
Biomedical analysis
Fasting blood samples were drawn by standard
venipuncture protocols into lithium heparin vacutainer tubes
(Thermo Fisher Scientific, Inc.). A comprehensive metabolic panel
reagent disc, which included an assay for glucose, was used to
concurrently measure biomarkers of liver function [alanine
aminotransferase (ALT), aspartate aminotransferase (AST), albumin,
total protein, total bilirubin and alkaline phosphatase (ALP)] and
nitrogen balance/kidney function [blood urea nitrogen (BUN),
creatinine and albumin], using a Piccolo Blood Chemistry Analyzer
(Abaxis Inc.). Briefly, 100 µl of whole blood was transferred from
each vacutainer (prior to centrifugation) to a reaction disc
(Piccolo Comprehensive Metabolic Panel, Abaxis, CA) with preloaded,
partitioned, test-specific reagents including diluents,
surfactants, and preservatives for each tested analyte (sodium,
potassium, total protein, total carbon dioxide, total bilirubin,
blood urea nitrogen, calcium, AST, ALP, albumin, ALT and glucose).
For a description of the specific reactions for analytes, please
refer to www.abaxis.com. Remaining blood was
centrifuged at 1,100 x g at 4˚C for 20 min and plasma
was archived in 0.5 ml aliquots at -80˚C.
Statistical analysis
All data obtained during the present study were
analyzed using the Statistical Package for the Social Sciences
(SPSS) version 17.0.2, 2009. Values are expressed as the means ±
standard deviation (SD). The sample size for the present study was
10 (5 participants began with the placebo intervention and 5
participants began with the treatment intervention). Differences in
participant electrolyte and metabolite concentrations were
considered significant at P<0.05 and considered a trend at P≥0.1
and P>0.05. All data were tested for normality and transformed
when necessary using the Friedman Test or Wilcoxon Signed Ranked
Test. The means of each paired group were analyzed using the
Student's t-test.
Results
Dietary intake and physical
activity
Dietary records were collected and analyzed at each
visit and, upon analysis; no significant differences in the dietary
intake patterns of macronutrients or total energy were observed
between the groups (Table I). The
data presented in Table I, when
expressed as the percentage of total caloric intake, e.g., kcal
from fat/total daily kcals (from carbohydrates, proteins and fats),
further indicated that the participants were consuming an average
of 68.0±1.1, 16.7±1.7 and 15.3±2.0% of kcal from carbohydrates,
proteins and fats, respectively. The Food and Nutrition Board of
the Institutes of Medicine (IOM) recommends consumption levels for
carbohydrates (45-65% of energy), proteins (10-35% of energy) and
fat (20-35% of energy), as indicated. The participants in the
present study averaged marginally above the recommended range for
carbohydrates and below the recommended levels for fat. No
significant differences were noted in either physical activity or
exercise levels and the participants as a group exhibited light to
moderate overall activity.
 | Table IMacronutrient and energy intake by
the study participants. |
Table I
Macronutrient and energy intake by
the study participants.
| Nutrient | Placebo | Treatment | P-value |
|---|
| Energy,
kcal/day | 1,816±417 | 1,782±452 | 0.685 |
|
Proteina,
g/day | 66±15 | 61±0.6 | 0.228 |
| Carbohydrate,
g/day | 257±70 | 255±69 | 0.382 |
| Total
fatb, g/day | 57±70 | 56±16 | 0.377 |
Anthropometric measurements
Data for anthropometric indices for the participants
were collected and analyzed; no significant differences were noted
between any of the parameters between the groups (data not shown)
The average body weight was 88.77±12.62 kg (195.7±27.8 pounds) and
average BMI was 32.2±4.6 kg/m2, indicating the group was
overweight (n=5; BMI 25.0-29.9 kg/m2) and obese (n=5;
≥30.0 kg/m2) (Table
II). There were 8 Caucasian females and 2 Caucasian males in
the cohort.
| Table IIPhysical characteristics and fasting
glucose levels of the study participants. |
Table II
Physical characteristics and fasting
glucose levels of the study participants.
| | Fasting glucose
(mg/dl) |
|---|
| | Placebo | TCJ |
|---|
| Participant
no. | Weight (kg) | Height (m) | BMI
(kg/m2) | Age (years) | Sex | Category | Pre | Post | Pre | Post |
|---|
| 1 | 96.16 | 1.82 | 27.3 | 40 | F | Overweight | 92 | 94 | 97 | 100 |
| 2 | 83.55 | 1.69 | 28.3 | 33 | M | Overweight | 94 | 91 | 100 | 97 |
| 3 | 85.82 | 1.74 | 28. 6 | 25 | F | Overweight | 103 | 102 | 98 | 98 |
| 4 | 106.51 | 1.60 | 29.2 | 61 | M | Overweight | 116 | 116 | 108 | 107 |
| 5 | 94.08 | 1.64 | 29.3 | 54 | F | Overweight | 89 | 94 | 93 | 94 |
| 6 | 80.38 | 1.68 | 32 | 38 | F | Obese | 97 | 99 | 98 | 96 |
| 7 | 79.29 | 1.55 | 33 | 31 | F | Obese | 99 | 103 | 106 | 113 |
| 8 | 110.86 | 1.73 | 35.1 | 47 | F | Obese | 117 | 114 | 110 | 107 |
| 9 | 75.48 | 1.54 | 37.2 | 24 | F | Obese | 105 | 109 | 103 | 108 |
| 10 | 75.57 | 1.66 | 41.6 | 28 | F | Obese | 88 | 88 | 93 | 92 |
| Mean | 88.77 | 1.66 | 32.2 | 38.1 | 8:2 | 5:5 | 100 | 101 | 100.6 | 101.2 |
| STD | 12.62 | 0.09 | 4.6 | 12.5 | F:M | ov/ob | 10.3 | 9.6 | 6 | 7 |
Biomarkers of metabolic function
As part of the comprehensive metabolic panel,
fasting glucose levels were measured at each laboratory visit. It
was observed that 7 of the 10 participants exhibited fasting blood
glucose levels ≥100 mg/dl, which is suggestive of impaired fasting
glucose and pre-diabetes (Table
II). In total, 4 of the 5 overweight individuals and 3 of the 5
obese individuals displayed glucose levels ≥100 mg/dl with no clear
association with BMI. There were no significant differences between
pre- and post-consumption glucose concentrations within groups or
between beverage groups, supporting no adverse effect of TCJ on
glycemia.
In addition, no significant differences were noted
between electrolyte levels when comparing pre- vs. post- treatment
or between the juice and placebo groups. Plasma sodium, potassium,
chloride and calcium levels were all within accepted, standardized
reference ranges, indicating no perturbation in electrolyte balance
(Table III). Following the
consumption of TCJ for 4 weeks, the hepatic enzyme levels in plasma
did not differ significantly between any of the groups. ALP, ALT
and AST, hallmark indicators of liver health, were all within
normal reference ranges, indicating no adverse effects, i.e.,
hepatotoxicity, of TCJ or the placebo beverage. Total bilirubin,
albumin and total protein (albumin + globulins) levels were also
within normal reference ranges, indicating normal liver function as
well as renal function. Normal plasma BUN and creatinine
concentrations confirmed the lack of adverse effects of TCJ
consumption on renal function under the conditions of the present
study.
| Table IIIEffects of beverage consumption on
biochemical profile. |
Table III
Effects of beverage consumption on
biochemical profile.
| | Placebo | TCJ | |
|---|
| Biochemical
parameter | Pre | Post | Pre | Post | Reference
range | P-value placebo vs.
TCJ |
|---|
| Sodium, mmol/l | 146.6±5.4 | 145.2±3.8 | 147.4±5.9 | 142.8±5.0 | 128-145 | 0.221 |
| Potassium,
mmol/l | 4.8±0.4 | 5.0±0.6 | 4.7±0.4 | 5.1±1.3 | 3.6-5.1 | 0.828 |
| Chloride,
mmol/l | 108.4±3.4 | 107.3±3.3 | 107.6±4.4 | 105.6±3.1 | 98-108 | 0.310 |
| Calcium, mg/dl | 9.4±0.5 | 9.5±0.4 | 9.5±0.5 | 9.7±1.3 | 8-10 | 0.683 |
| Blood urea
nitrogenb, mg/dl | 12.7±2.9 | 12.2±2.5 | 13.6±3.1 | 13.0±3.1 | 7-22 | 0.428 |
| Creatinine,
mg/dl | 0.9±0.2 | 0.9±0.1 | 0.9±0.2 | 0.9±0.3 | 0.2-1.6 | 0.794 |
| Alkaline
phosphataseb,
U/l | 61.2±21.4 | 60.2±12.9 | 61.9±17.4 | 65.4±25.4 | 53-128 | 0.328 |
| Alanine
transferaseb,
U/l | 23.1±9.5 | 22.4±4.4 | 22.4±6.9 | 26.5±14.1 | 10-47 | 0.439 |
| Aspartate
transferaseb,
U/l | 27.1±4.3 | 26.2±2.2 | 27.9±4.8 | 29.9±7.3 | 11-38 | 0.176 |
| Total
bilirubina,
mg/dl | 0.6±0.1 | 0.6±0.2 | 0.6±0.1 | 0.5±0.1 | 0.2-1.6 | 0.121 |
|
Albumina,
g/dl | 3.9±0.3 | 3.91±0.3 | 4.0±0.3 | 4.0±0.6 | 3.3-5.5 | 0.574 |
| Total
proteina, g/dl | 7.4±0.5 | 7.4±0.4 | 7.5±0.6 | 7.8±1.4 | 6.4-8.1 | 0.395 |
| tCO2,
mEq/l | 26.1±1.8 | 26.2±1.9 | 27.9±3.5 | 26.2±3.5 | 23-29 | 0.823 |
Discussion
Few studies have evaluated the associations between
the dietary intake of fruit juices, and intermediate biomarkers of
cardiometabolic risk, particularly in the context of hepatic and
renal function in individuals at-risk for or exhibiting metabolic
syndrome (11,28-30).
SSBs are consumed globally and have been associated with adverse
health outcomes, including weight gain, T2DM and CVD (31-34).
Other studies have reported higher systolic blood pressure
(hypertension) among those with higher SSB consumption, likely due
to associated weight gain (35-37).
A recent cohort study (n=13,440 adults ≥45 years) indicated that
each additional 355 ml (12 oz) of SSB or fruit juice beverage
consumed caused a significant 11 and 24% higher all-cause mortality
risk, respectively (38). In the
present 10-week 2x2 crossover, randomized, placebo-controlled
dietary intervention in overweight and obese participants (BMI
≥25.0 kg/m2), no significant alterations were noted in
hepatic or renal function from the start to the end of the study
when comparing the TCJ to the placebo group. Dietary intake and
physical activity levels were similar among all groups. In
addition, no changes were noted in body composition (percentage
body fat, lean body mass, etc.) or BMI after 4 weeks of beverage
consumption. It was concluded that 100% TCJ does not exacerbate
already existing risk factors, viz., elevated fasting blood
glucose, in an at-risk (for chronic disease) population or affect
adversely hepatic or renal function.
Replacing fruit juice with whole fruits is
associated with a lower risk of developing chronic diseases, i.e.,
T2DM; thus, whole fruit is the preferred dietary means of nutrient
consumption from fruits (39).
However, there are positive studies supporting the benefits of
fruit juice consumption. In children, 100% fruit juice was
associated, in part, with reaching daily values of vitamin C,
folate and vitamin K intake (12).
The consumption of deeply pigmented foods rich in polyphenolic
anthocyanins (ACNs), with marked antioxidant and anti-inflammatory
activity, has been shown to exert preventive effects against
chronic diseases. In a placebo-controlled intervention (n=57),
ACN-rich juice consumption for 9 weeks caused DNA protective and
antioxidant effects, which were also observed unexpectedly in the
placebo group (15). The authors
of that study proposed that vitamin C was responsible for the
placebo effect. Conversely, the effect of ingestion of different
white grape juices (7 µl/g body weight) on biochemical serum
profiles and oxidative stress in the liver of adult Wistar rats did
not alter biochemical parameters (40). The ingestion of both grape juices
elevated glutathione and total antioxidant capacity, with no
effects on glucose or uric acid although consumption of 480 ml of
antioxidant-rich Concord grape juice per day for 3 months increased
insulin resistance and waist circumference in overweight
individuals in a different clinical trial (41,42).
Indeed, the authors also previously demonstrated that ACN-rich TCJ
did not adversely affect blood glucose, but that serum urate (uric
acid) was significantly reduced in a population at risk for
metabolic syndrome and potentially gouty arthritis (43,44).
There has been increasing interest in ACN-rich tart
cherries and their juice due to cumulative myriad health benefits
and their purported protection against the development and
elaboration of chronic diseases, as reviewed by Kelley et al
(45). For example, investigators
have demonstrated in numerous studies that tart cherry and/or TCJ
clearly reduces potentially damaging oxidative stress, an event
thought to be involved in the etiology of several pathologies
(46-49).
Moreover, given that oxidative stress is closely linked to
inflammation, it is not unexpected that TCJ has been shown to
significantly reduce undesired inflammation in numerous studies
(45,47,50).
There is also increasing information supporting an inhibitory role
for TCJ in pro-inflammatory gouty arthritis and osteoarthritis, as
well as the capacity to reduce exercise-induced pain, soreness and
muscle damage often assumed, in large part, to be due to increased
oxidative stress (47,51-53).
Supportive evidence also suggests that tart cherries and TCJ can
modulate risk factors for diabetes and CVD, which are also linked
to oxidative stress (54-56).
For example, TCJ reduces HbA1C levels, a marker of blood glucose
control, in diabetic women with no changes in fasting glucose.
Others have demonstrated reductions in both systolic and diastolic
blood pressure presumably via, in part, the modulation of nitric
oxide levels and vasorelaxation (57,58).
Collectively, there is considerable evidence demonstrating the
health benefits from tart cherry and TCJ consumption.
There have been several reports that the dietary
consumption of some fruit juices exerts adverse effects. For
example, in female albino rats fed star fruit juice (dose range of
250-5,000 mg/kg), acute studies suggested the juice was safe up to
the highest level. However, after 48 h, liver enzyme (AST, ALT and
ALP), urea and creatinine levels were significantly higher in a
dose-dependent manner compared to the control (19). Moreover, the authors of that study
concluded that the juice of Averrhoa carambola was both
nephrotoxic and hepatotoxic in rats after 28 days (4 weeks), a time
interval used in the current study. In a different study, rats
(n=5) orally treated with juice for 14 days after initial storage
of the juice for either 0, 1, or 3 h, liver enzyme (ALT, ALP and
AST), urea and serum creatinine levels were once again
significantly elevated (19).
Damage also occurred at the hepatocellular level with significantly
increased serum ALT following the consumption of juice stored for 3
h (20). The ingestion of
pomegranates has been associated with the deaths of young cattle
without prior clinical signs, although marked weakness and
discoloration of mucous membranes were noted in one animal. Gross
pathological changes included widespread subcutaneous and serosal
hemorrhages with acute periacinar to midzonal hepatocellular
necrosis characteristic of toxicity (21). In a study on noni fruit (Morinda
citrifolia), commonly used as a functional beverage with
medicinal properties, mice were fed water extracts of fruit (two
doses each). After 6 months, the study demonstrated that the fruit
extract caused chronic toxicity at the highest dose (2 mg/ml water)
with clear hepatocellular necrosis, reduced liver length, increased
liver enzymes, i.e., AST and reduced albumin and ultimately 40%
mortality within 3 months (22).
In humans, 2 cases of hepatotoxicity following noni juice
consumption were reported by Stadlbauer et al (23). A 29-year-old male with previous
toxic hepatitis developed sub-acute hepatic failure (determined via
transjugular or percutaneous liver biopsy) following the
consumption of 1.5 l noni juice over 3 weeks, mandating urgent
liver transplantation. A 62-year-old woman without pre-existing
liver disease or dysfunction, developed acute hepatitis following
the consumption of 2 l of noni juice over a period of 3 months
(23). The bottle gourd
(Lagenaria siceraria) also known as lauki, ghia or dudhi is
prescribed as part of traditional medicine for T2DM, hypertension,
liver diseases, weight loss and other associated problems. However,
there have been reports of adverse effects after juice consumption
with complaints of abdominal pain, diarrhea, and vomiting (with
blood). Endoscopic results displayed profuse gastric bleeding with
profound, frequent ulceration of the distal esophagus, stomach and
duodenum. Liver enzymes levels were also elevated indicating
hepatic toxicity (24). While
there are a plethora of beneficial bioactive agents in fruits and
consequently fruit juices, there may also be potentially
deleterious molecules and/or precursors (59,60).
In rodent studies, the provision of juice obtained from Morinda
citrifolia (noni) fruit caused significant hepatotoxicity,
likely due to the anthraquinones in the seeds and skin, which
exhibits quinone reductase inducer activity involved in
detoxification of quinones. Studies report that anthraquinone
activity is 40-fold more effective than l-sulforaphane, a bioactive
organosulfur isothiocyanate in cruciferous vegetables (22,23).
The fructose hypothesis alleges the fructose
component common to all major caloric sweeteners and naturally
occurring sweetened fruit juice plays a unique and causative role
in the increasing rates of CVD, hypertension, T2DM, cancer and
NAFLD. One report, however, concludes that fructose intake at
normal population levels and patterns does not cause biochemical
outcomes substantially different from other dietary sugars
(61). Ounce for ounce, some 100%
fruit juices may have more sugar than SSBs, but on average, most
have a similar energy density and sugar content (62). For example, 250 ml of apple juice
typically contains 110 kcal and 26 g of sugar; 250 ml of cola
typically contains 105 kcal and 26.5 of sugar. TCJ (240 ml)
contains 159 kcal and 33 g of sugar per cup (~16-17 g fructose). An
additional consideration is that 100% fruit juices, although
nutrient-rich, contain little or no fiber which confers a higher
glycemic index to juice.
The amounts of simple sugars and the relative ratios
may also be a consideration. In a study comparing the fructose
concentration of commonly consumed beverages, 15 beverages had a
fructose-glucose ratio exceeding 55% with a mean fructose content
of 59% (63). In a study
commissioned by the International Society of Beverage
Technologists, 80 random beverages known to be sweetened with
HFCS-55 were tested. The mean fructose content of these beverages
was 55.6% (61). A number of
beverages, however, have a fructose content >55% and there may
be significant biological differences in response to differing
ratios, i.e., 50:50, 60:40, likely due to well-established
differences between glucose and fructose metabolism (62,64,65).
In short, the excessive supply of fructose to the liver enhances
hepatic de novo lipogenesis and increases lipid levels
associated with hepatic insulin resistance. A 12-week intervention
where 13% of diet energy as fructose was served in the habitual
diet of 71 men with abdominal obesity, an increased body weight,
liver fat content (steatosis) and post-prandial TG levels were
observed. Replacing energy requirement with 10% juice also
significantly increased low density lipoprotein cholesterol
(LDL-C), apolipoprotein B (apoB) and post-prandial TG levels
compared to baseline levels (63).
In a 6-month dietary intervention study, subjects consuming one
liter of SSB/day exhibited increased TG, cholesterol and liver fat
(60). In a previous study
conducted in our laboratory, individuals consuming 8 ounces TCJ per
day for 4 weeks exhibited a significant increase in erythrocyte
sedimentation rate (ESR), an indicator of chronic inflammation, but
not the TCJ suggesting the SSB was altering this biochemical
parameter (43).
There are several limitations to the current study
that may affect the interpretation of the results yet be relevant
for the design of future studies. First, the present study was a
small pilot study with 10 participants. As a result, the results
may not be applicable to larger populations and may not be relevant
all races, sexes and/or nationalities. Moreover, the small sample
number, although generally considered acceptable for a pilot study,
may have been limiting for elaborating potentially significant
effects if present. Subsequent studies should aim for larger cohort
sizes with more refined inclusion criteria as pilot studies reveal
which are most likely amenable to intervention. Another
consideration is the length of each arm and the washout period.
Chronic consumption of TCJ beyond 4 weeks may lead to different
results and although we noted no significant differences due to a
carryover effect, e.g., 2-week washout period, this may be too
short of an interval for other products. The experimental design,
however, was based on other published designs. In the present
study, a sweetened, artificially colored fruit punch was used,
which arguably may not be as effective as desired for a placebo
regarding optimal matching of astringency and the presence of
sediment although the colors of the beverages were matched as
closely as possible and the caloric and carbohydrate values were
similar. Other studies have used fruit-flavored drink mixes, e.g.,
Kool-Aid, sports beverages, water, synthetic orange-flavored
beverages, etc. supporting the placebo selection in the present
study (16,47,53).
Furthermore, in a previous meta-analysis, Wang et al
reported selections for placebo beverages in 12 studies, which
included modified sports beverages, synthetic orange-flavored
drinks, water, and a generic control drink matched for sugar
composition (66).
Important discrepancies between studies, such as the
type of fruit juice, dose, duration, study design and measured
outcomes contribute to inconsistencies in results between studies
and complicates interpretation. As a result, it becomes difficult
to provide evidence-based public recommendations regarding the
consumption of fruit juices and potential effects on metabolic
parameters (63). Given that no
association purportedly exists between 100% fruit juice and most
risk factors for CVD, including changes in glucose homeostasis,
lipid concentrations and blood pressure, the current evidence does
not suggest that 100% fruit juice consumption markedly affects the
risk of CVD (34,59,67).
Evidence exists that 100% fruit juice is associated with major
chronic diseases, but the existing body of evidence is too limited
to robustly support any expert opinion recommending changing the
current guidelines on 100% fruit juice consumption (8). Presently, the World Health
Organization (WHO) recommends reducing the intake of free sugars to
<10% and ideally <5% of the total daily energy intake
(63). More randomized,
placebo-controlled clinical trials are required to confirm the
health effects of consuming 100% fruit juice and cohort analyses
should report both energy-adjusted and energy-unadjusted
associations (8,68).
Acknowledgements
The authors wish to thank Mr. Michael Stroup
(Research Technician, Arizona State University) for providing
assistance with the phlebotomy.
Funding
The present study was supported by a grant (no.
NCT03638362) from the Cherry Marketing Institute, (Dewitt, MI,
USA). The funding source had no role in any aspect of the study
design, data collection or analysis, writing of the manuscript or
decision to publish.
Availability of data and materials
All data generated or analyzed during this study are
included in this published article or are available from the
corresponding author on reasonable request.
Authors' contributions
KRM initiated and designed the study and secured the
funding from the Cherry Marketing Institute. KRM interpreted the
data and prepared the manuscript. JB and LB recruited, screened and
provided informed consent to respondents under the supervision of
KRM, as well as collected, processed and analyzed, in part, data,
samples and questionnaires. All authors critically reviewed the
manuscript and all authors read and approved the final
manuscript.
Ethics approval and consent to
participate
The present study was approved by the Arizona State
University Institutional Review Board. Prior to entering the study,
all respondents and participants were provided written informed
consent.
Patient consent for publication
Not applicable.
Competing interests
The authors declare no competing financial and/or
personal interests.
References
|
1
|
Bo S, Fadda M, Fedele D, Pellegrini M,
Ghigo E and Pellegrini N: A critical review on the role of food and
nutrition in the energy balance. Nutrients. 12(1161)2020.PubMed/NCBI View Article : Google Scholar
|
|
2
|
Seferidi P, Millett C and Laverty AA:
Sweetened beverage intake in association to energy and sugar
consumption and cardiometabolic markers in children. Pediatr Obes.
13:195–203. 2018.PubMed/NCBI View Article : Google Scholar
|
|
3
|
Malik VS and Hu FB: Sugar-sweetened
beverages and cardiometabolic health: An update of the evidence.
Nutrients. 11(1840)2019.PubMed/NCBI View Article : Google Scholar
|
|
4
|
Gill J and Sattar N: Fruit juice: Just
another sugary drink? Lancet Diabetes Endocrinol. 2:444–446.
2014.PubMed/NCBI View Article : Google Scholar
|
|
5
|
Ruanpeng D, Thongprayoon C,
Cheungpasitporn W and Harindhanavudhi T: Sugar and artificially
sweetened beverages linked to obesity: A systematic review and
meta-analysis. QJM. 110:513–520. 2017.PubMed/NCBI View Article : Google Scholar
|
|
6
|
Odegaard AO, Koh WP, Arakawa K, Yu MC and
Pereira M: Soft drink and juice consumption and risk of
physician-diagnosed incident type 2 diabetes: The Singapore Chinese
health study. Am J Epidemiol. 171:701–708. 2010.PubMed/NCBI View Article : Google Scholar
|
|
7
|
Ng SW, Slining MM and Popkin BM: Use of
caloric and noncaloric sweeteners in US consumer packaged foods,
2005-2009. J Acad Nutr Diet 112: 1828,1834.e1-e6, 2012.
|
|
8
|
Auerbach BJ, Dibey S, Vallila-Buchman P,
Kratz M and Krieger J: Review of 100% fruit juice and chronic
health conditions: Implications for sugar-sweetened beverage
policy. Adv Nutr. 9:78–85. 2018.PubMed/NCBI View Article : Google Scholar
|
|
9
|
Chanchlani N and Russell E: Fruit
consumption and risk of type 2 diabetes: Results from three
prospective longitudinal cohort studies. Student BMJ 21, 2013.
|
|
10
|
Hirahatake KM, Jacobs DR, Shikany JM,
Jiang L, Wong ND, Steffen LM and Odegaard AO: Cumulative intake of
artificially sweetened and sugar-sweetened beverages and risk of
incident type 2 diabetes in young adults: The coronary artery risk
development in young adults (CARDIA) study. Am J Clin Nutr.
110:733–741. 2019.PubMed/NCBI View Article : Google Scholar
|
|
11
|
Lorenzoni G, Minto C, Vecchio MG, Zec S,
Paolin I, Lamprecht M, Mestroni L and Gregori D: Fruit and
vegetable concentrate supplementation and cardiovascular health: A
systematic review from a public health perspective. J Clin Med.
8(1914)2019.PubMed/NCBI View Article : Google Scholar
|
|
12
|
Byrd-Bredbenner C, Ferruzzi MG, Fulgoni VL
III, Murray R, Pivonka E and Wallace TC: Satisfying America's fruit
gap: Summary of an expert roundtable on the role of 100% fruit
juice. J Food Sci. 82:1523–1534. 2017.PubMed/NCBI View Article : Google Scholar
|
|
13
|
Vartanian LR, Schwartz MB and Brownell KD:
Effects of soft drink consumption on nutrition and health: A
systematic review and meta-analysis. Am J Public Health.
97:667–675. 2007.PubMed/NCBI View Article : Google Scholar
|
|
14
|
Chang SK, Alasalvar C and Shahidi F:
Superfruits: Phytochemicals, antioxidant efficacies, and health
effects-a comprehensive review. Crit Rev Food Sci Nutr.
59:1580–1604. 2019.PubMed/NCBI View Article : Google Scholar
|
|
15
|
Bakuradze T, Tausend A, Galan J, Groh IAM,
Berry D, Tur JA, Marko D and Richling E: Antioxidative activity and
health benefits of anthocyanin-rich fruit juice in healthy
volunteers. Free Radic Res. 53:1045–1055. 2019.PubMed/NCBI View Article : Google Scholar
|
|
16
|
Wijarnpreecha K, Thongprayoon C, Edmonds
PJ and Cheungpasitporn W: Associations of sugar- and artificially
sweetened soda with nonalcoholic fatty liver disease: A systematic
review and meta-analysis. QJM. 109:461–466. 2016.PubMed/NCBI View Article : Google Scholar
|
|
17
|
Bomback AS, Katz R, He K, Shoham DA, Burke
GL and Klemmer PJ: Sugar-sweetened beverage consumption and the
progression of chronic kidney disease in the multi-ethnic study of
atherosclerosis (MESA). Am J Clin Nutr. 90:1172–1178.
2009.PubMed/NCBI View Article : Google Scholar
|
|
18
|
Cheungpasitporn W, Thongprayoon C,
O'Corragain OA, Edmonds PJ, Kittanamongkolchai W and Erickson SB:
Associations of sugar-sweetened and artificially sweetened soda
with chronic kidney disease: A systematic review and meta-analysis.
Nephrology (Carlton). 19:791–797. 2014.PubMed/NCBI View Article : Google Scholar
|
|
19
|
Aba PE and Amadi AU: Evaluation of the
possible hepatotoxic and nephrotoxic potentials of the Averrhoa
carambola juice extract in female albino rats. J Basic Clin
Physiol Pharmacol 31, 2019.
|
|
20
|
Khoo ZY, Teh CC, Rao NK and Chin JH:
Evaluation of the toxic effect of star fruit on serum biochemical
parameters in rats. Pharmacogn Mag. 6:120–124. 2010.PubMed/NCBI View Article : Google Scholar
|
|
21
|
Hawes MH and Gill IJ: Hepatotoxicosis in
cattle associated with consumption of Punica granatum
(pomegranate). Aust Vet J. 96:408–410. 2018.PubMed/NCBI View Article : Google Scholar
|
|
22
|
Mohamad-Shalan NAA, Mustapha NM and
Mohamed S: Chronic toxicity evaluation of Morinda citrifolia
fruit and leaf in mice. Regul Toxicol Pharmacol. 83:46–53.
2017.PubMed/NCBI View Article : Google Scholar
|
|
23
|
Stadlbauer V, Fickert P, Lackner C,
Schmerlaib J, Krisper P, Trauner M and Stauber RE: Hepatotoxicity
of NONI juice: Report of two cases. World J Gastroenterol.
11:4758–4760. 2005.PubMed/NCBI View Article : Google Scholar
|
|
24
|
Indian Council of Medical Research Task
Force. Assessment of effects on health due to consumption of bitter
bottle gourd (Lagenaria siceraria) juice. Indian J Med Res.
135:49–55. 2012.PubMed/NCBI View Article : Google Scholar
|
|
25
|
Rebholz CM, Young BA, Katz R, Tucker KL,
Carithers TC, Norwood AF and Correa A: Patterns of beverages
consumed and risk of incident kidney disease. Clin J Am Soc
Nephrol. 14:49–56. 2019.PubMed/NCBI View Article : Google Scholar
|
|
26
|
Yuzbashian E, Asghari G, Mirmiran P,
Zadeh-Vakili A and Azizi F: Sugar-sweetened beverage consumption
and risk of incident chronic kidney disease: Tehran lipid and
glucose study. Nephrology (Carlton). 21:608–616. 2016.PubMed/NCBI View Article : Google Scholar
|
|
27
|
Stumpf MAM, Schuinski AFM, Baroni G and
Ramthun M: Acute kidney injury with neurological features: Beware
of the star fruit and its caramboxin. Indian J Nephrol. 30:42–46.
2020.PubMed/NCBI View Article : Google Scholar
|
|
28
|
Ferreira-Pêgo C, Babio N, Bes-Rastrollo M,
Corella D, Estruch R, Ros E, Fitó M, Serra-Majem L, Arós F, Fiol M,
et al: Frequent consumption of sugar- and artificially sweetened
beverages and natural and bottled fruit juices is associated with
an increased risk of metabolic syndrome in a mediterranean
population at high cardiovascular disease risk. J Nutr.
146:1528–1536. 2016.PubMed/NCBI View Article : Google Scholar
|
|
29
|
Yu Z, Ley SH, Sun Q, Hu FB and Malik VS:
Cross-sectional association between sugar-sweetened beverage intake
and cardiometabolic biomarkers in US women. Br J Nutr. 119:570–580.
2018.PubMed/NCBI View Article : Google Scholar
|
|
30
|
Kosova EC, Auinger P and Bremer AA: The
relationships between sugar-sweetened beverage intake and
cardiometabolic markers in young children. J Acad Nutr Diet.
113:219–227. 2013.PubMed/NCBI View Article : Google Scholar
|
|
31
|
Imamura F, O'Connor L, Ye Z, Mursu J,
Hayashino Y, Bhupathiraju SN and Forouhi NG: Consumption of sugar
sweetened beverages, artificially sweetened beverages, and fruit
juice and incidence of type 2 diabetes: Systematic review,
meta-analysis, and estimation of population attributable fraction.
BMJ. 351(h3576)2015.PubMed/NCBI View Article : Google Scholar
|
|
32
|
Jayalath V, de Souza RJ, Ha V, Mirrahimi
A, Blanco-Mejia S, Di Buono M, Jenkins AL, Leiter LA, Wolever TM,
Beyene J, et al: Sugar-sweetened beverage consumption and incident
hypertension: A systematic review and meta-analysis of prospective
cohorts. Am J Clin Nutr. 102:914–921. 2015.PubMed/NCBI View Article : Google Scholar
|
|
33
|
Kim Y and Je Y: Prospective association of
sugar-sweetened and artificially sweetened beverage intake with
risk of hypertension. Arch Cardiovasc Dis. 109:242–253.
2015.PubMed/NCBI View Article : Google Scholar
|
|
34
|
Malik VS, Popkin BM, Bray GA, Després JP
and Hu FB: Sugar-sweetened beverages, obesity, type 2 diabetes
mellitus, and cardiovascular disease risk. Circulation.
121:1356–1364. 2010.PubMed/NCBI View Article : Google Scholar
|
|
35
|
Ambrosini GL, Oddy WH, Huang RC, Mori TA,
Beilin LJ and Jebb SA: Prospective associations between
sugar-sweetened beverage intakes and cardiometabolic risk factors
in adolescents. Am J Clin Nutr. 98:327–334. 2013.PubMed/NCBI View Article : Google Scholar
|
|
36
|
Hoare E, Varsamis P, Owen N, Dunstan DW,
Jennings GL and Kingwell BA: Sugar- and intense-sweetened drinks in
Australia: A systematic review on cardiometabolic risk. Nutrients.
9(1075)2017.PubMed/NCBI View Article : Google Scholar
|
|
37
|
Malik VS, Pan A, Willett WC and Hu FB:
Sugar-sweetened beverages and weight gain in children and adults: A
systematic review and meta-analysis. Am J Clin Nutr. 98:1084–1102.
2013.PubMed/NCBI View Article : Google Scholar
|
|
38
|
Collin LJ, Judd S, Safford M, Vaccarino V
and Welsh JA: Association of sugary beverage consumption with
mortality risk in US adults: A secondary analysis of data from the
REGARDS study. JAMA Netw Open. 2(e193121)2019.PubMed/NCBI View Article : Google Scholar
|
|
39
|
Ravn-Haren G, Dragsted LO, Buch-Andersen
T, Jensen EN, Jensen RI, Németh-Balogh M, Paulovicsová B, Bergström
A, Wilcks A, Licht TR, et al: Intake of whole apples or clear apple
juice has contrasting effects on plasma lipids in healthy
volunteers. Eur J Nutr. 52:1875–1889. 2013.PubMed/NCBI View Article : Google Scholar
|
|
40
|
Kovaleski ES, Gonçalves LK, Bortolato G,
Marinho JP, Silva LFL, Russo M, Agostini F, Funchal C and Dani C:
Effects of the ingestion of different kinds of white grape juice
(Vitis labrusca) during adolescence on body weight,
biochemical parameters and oxidative stress in liver of adult
Wistar rats. Food Chem. 291:110–116. 2019.PubMed/NCBI View Article : Google Scholar
|
|
41
|
Hollis JH, Houchins JA, Blumberg JB and
Mattes RD: Effects of concord grape juice on appetite, diet, body
weight, lipid profile, and antioxidant status of adults. J Am Coll
Nutr. 28:574–582. 2009.PubMed/NCBI View Article : Google Scholar
|
|
42
|
Toaldo IM, Cruz FA, da Silva EL and
Bordignon-Luiz MT: Acute consumption of organic and conventional
tropical grape juices (Vitis labrusca L.) increases
antioxidants in plasma and erythrocytes, but not glucose and uric
acid levels in healthy individuals. Nutr Res. 36:808–817.
2016.PubMed/NCBI View Article : Google Scholar
|
|
43
|
Martin KR, Burrell L and Bopp J: Authentic
tart cherry juice reduces markers of inflammation in overweight and
obese subjects: A randomized, crossover pilot study. Food Funct.
9:5290–5300. 2018.PubMed/NCBI View Article : Google Scholar
|
|
44
|
Martin KR and Coles KM: Consumption of
100% tart cherry juice reduces serum urate in overweight and obese
adults. Curr Dev Nutr. 3(nzz011)2019.PubMed/NCBI View Article : Google Scholar
|
|
45
|
Kelley DS, Adkins Y and Laugero KD: A
Review of the health benefits of cherries. Nutrients.
10(368)2018.PubMed/NCBI View Article : Google Scholar
|
|
46
|
Traustadóttir T, Davies SS, Stock AA, Su
Y, Heward CB, Roberts LJ II and Harman SM: Tart cherry juice
decreases oxidative stress in healthy older men and women. J Nutr.
139:1896–1900. 2009.PubMed/NCBI View Article : Google Scholar
|
|
47
|
Bell PG, Walshe IH, Davison GW, Stevenson
E and Howatson G: Montmorency cherries reduce the oxidative stress
and inflammatory responses to repeated days high-intensity
stochastic cycling. Nutrients. 6:829–843. 2014.PubMed/NCBI View Article : Google Scholar
|
|
48
|
Garrido M, Espino J, González-Gómez D,
Lozano M, Cubero J, Toribio-Delgado AF, Maynar-Mariño JI, Terrón
MP, Muñoz JL, Pariente JA, et al: A nutraceutical product based on
Jerte Valley cherries improves sleep and augments the antioxidant
status in humans. E-SPEN J. 4:e321–e323. 2009.
|
|
49
|
Garrido M, Gonzalez-Gomez D, Lozano M,
Barriga C, Paredes SD and Rodriguez AB: Characterization and trials
of a Jerte Valley cherry product as a natural antioxidant-enriched
supplement. Ital J Food Sci. 25:90–97. 2013.
|
|
50
|
Lynn A, Mathew S, Moore C, Russell J,
Robinson E, Soumpasi V and Barker M: Effect of a tart cherry juice
supplement on arterial stiffness and inflammation in healthy
adults: A randomised controlled trial. Plant Foods Hum Nutr.
69:122–127. 2014.PubMed/NCBI View Article : Google Scholar
|
|
51
|
Bowtell JL, Sumners DP, Dyer A, Fox P and
Mileva KN: Montmorency cherry juice reduces muscle damage caused by
intensive strength exercise. Med Sci Sports Exerc. 43:1544–1551.
2011.PubMed/NCBI View Article : Google Scholar
|
|
52
|
Zhang Y, Neogi T, Chen C, Chaisson C,
Hunter DJ and Choi HK: Cherry consumption and decreased risk of
recurrent gout attacks. Arthritis Rheum. 64:4004–4011.
2012.PubMed/NCBI View Article : Google Scholar
|
|
53
|
Howatson G, McHugh MP, Hill JA, Brouner J,
Jewell AP, Van Someren KA, Shave RE and Howatson SA: Influence of
tart cherry juice on indices of recovery following marathon
running. Scand J Med Sci Sports. 20:843–852. 2010.PubMed/NCBI View Article : Google Scholar
|
|
54
|
Saleh FA, El-Darra N and Raafat K:
Hypoglycemic effects of Prunus cerasus L. pulp and seed extracts on
Alloxan-induced diabetic mice with histopathological evaluation.
Biomed Pharmacother. 88:870–877. 2017.PubMed/NCBI View Article : Google Scholar
|
|
55
|
Snyder SM, Zhao B, Luo T, Kaiser C,
Cavender G, Hamilton-Reeves J, Sullivan DK and Shay NF: Consumption
of quercetin and quercetin-containing apple and cherry extracts
affects blood glucose concentration, hepatic metabolism, and gene
expression patterns in obese C57BL/6J high fat-fed mice. J Nutr.
146:1001–1007. 2016.PubMed/NCBI View Article : Google Scholar
|
|
56
|
Lachin T: Effect of antioxidant extract
from cherries on diabetes. Recent Pat Endocr Metab Immune Drug
Discov. 8:67–74. 2014.PubMed/NCBI View Article : Google Scholar
|
|
57
|
Medina-Remón A, Tresserra-Rimbau A, Pons
A, Tur JA, Martorell M, Ros E, Buil-Cosiales P, Sacanella E, Covas
MI, Corella D, et al: Effects of total dietary polyphenols on
plasma nitric oxide and blood pressure in a high cardiovascular
risk cohort The PREDIMED randomized trial. Nutr Metab Cardiovasc
Dis. 25:60–67. 2015.PubMed/NCBI View Article : Google Scholar
|
|
58
|
Miranda AM, Steluti J, Fisberg RM and
Marchioni DM: Association between polyphenol intake and
hypertension in adults and older adults: A population-based study
in Brazil. PLoS One. 11(e0165791)2016.PubMed/NCBI View Article : Google Scholar
|
|
59
|
Narain A, Kwok CS and Mamas MA: Soft drink
intake and the risk of metabolic syndrome: A systematic review and
meta-analysis. Int J Clin Pract 71, 2017.
|
|
60
|
Maersk M, Belza A, Stødkilde-Jørgensen H,
Ringgaard S, Chabanova E, Thomsen H, Pedersen SB, Astrup A and
Richelsen B: Sucrose-sweetened beverages increase fat storage in
the liver, muscle, and visceral fat depot: A 6-mo randomized
intervention study. Am J Clin Nutr. 95:283–289. 2012.PubMed/NCBI View Article : Google Scholar
|
|
61
|
White JS: Challenging the fructose
hypothesis: New perspectives on fructose consumption and
metabolism. Adv Nutr. 4:246–256. 2013.PubMed/NCBI View Article : Google Scholar
|
|
62
|
White JS, Hobbs LJ and Fernandez S: Re.
‘Fructose content in popular beverages made with and without high
fructose corn syrup’. Nutrition. 31:417–418. 2015.PubMed/NCBI View Article : Google Scholar
|
|
63
|
Pepin A, Stanhope KL and Imbeault P: Are
fruit juices healthier than sugar-sweetened beverages? A review.
Nutrients. 11(1006)2019.PubMed/NCBI View Article : Google Scholar
|
|
64
|
White JS, Hobbs LJ and Fernandez S:
Fructose content and composition of commercial HFCS-sweetened
carbonated beverages. Int J Obes (Lond). 39:176–182.
2015.PubMed/NCBI View Article : Google Scholar
|
|
65
|
Walker RW, Dumke KA and Goran MI: Fructose
content in popular beverages made with and without high-fructose
corn syrup. Nutrition. 30:928–395. 2014.PubMed/NCBI View Article : Google Scholar
|
|
66
|
Wang B, Liu K, Mi M and Wang J: Effect of
fruit juice on glucose control and insulin sensitivity in adults: A
meta-analysis of 12 randomized controlled trials. PLoS One.
9(e95323)2014.PubMed/NCBI View Article : Google Scholar
|
|
67
|
Marriott BP, Olsho L, Hadden L and Connor
P: Intake of added sugars and selected nutrients in the United
States, national health and nutrition examination survey (NHANES)
2003-2006 Crit Rev Food Sci. Nutr. 50:228–258. 2010.PubMed/NCBI View Article : Google Scholar
|
|
68
|
Popkin BM, Armstrong LE, Bray GM,
Caballero B, Frei B and Willett WC: A new proposed guidance system
for beverage consumption in the United States. Am J Clin Nutr.
83:529–542. 2006.PubMed/NCBI View Article : Google Scholar
|