Introduction
Currently, global milk production is dominated by
different animal species: Dairy cattle, buffalo, goat and sheep.
Cow's milk accounts for >80% of the world's milk production. The
consumption of cow-derived dairy products prevails in numerous
cultures globally. Sheep and buffalo milk, due to their high
protein content, including casein and fats, is an excellent raw
material for processing, particularly dairy. The composition of
goat milk allows it to be used as a raw material for milk
processing (1).
The average values of the basic components of milk
(proteins, fats and lactose) also appear to be influenced by
factors, such as the breed, the feeding system, the stage of
lactation and the climatic conditions in which the animals are
reared. The energy value of milk from various animal species is
closely related to the concentration of certain compounds in the
dry matter, in particular the amount of fat (2).
In recent years, the use of milk from different
mammals in human nutrition is gaining increasing popularity
(3), mainly owing to a
cholesterol-lowering action, better bioavailability, therapeutic
properties (used in gastro-intestinal disorders) and the absence of
allergies following consumption. Milk fat is also one of the few
dietary sources of butyric acid, a potent inhibitor of cancer cell
proliferation, as well as an inducer of differentiation and
apoptosis in a number of cancer cell lines (4).
There is some evidence from epidemiological studies
and systematic reviews alike that dairy intake is inversely
associated with the risk of developing metabolic syndrome (5,6).
Recently, a greater preference for the vegan diet, as well as
increasing attention to health in general, has influenced the
selection of the type of milk consumed.
Milk is one of the foods that help maintain a
healthy nutritional state, providing energy, calcium, proteins and
vitamins, particularly during early childhood, as well as a greater
attention to one's health. Recently, the increase in allergies and
intolerances to cow's milk proteins and a growth in the vegan
population have influenced parents to frequently select cow's milk
substitutes for children, including other types of mammalian milk
and beverages with a vegetable milk base.
Marked differences have been documented in the
macronutrient composition between multiple milk sources,
particularly in terms of the protein and lipid content. For
instance, 100 g sheep milk provides a markedly greater amount of
protein (P: 5.5 g) and fat (F: 5.9 g) compared to cow (P: 3.4 g; F:
3.3 g), goat (P: 3.7 g; F: 3.8 g) and camel (P: 3.3 g; F: 4.0 g)
milk (7). Buffalo and reindeer
milks also have a notably high lipid content (7.4 g/100 g and 16.1
g/100 g, respectively) (8). In
addition, the mean lactose content varies modestly across ruminant
milks at 4.51, 4.75, 4.79 and 4.82% for 100 g goat, sheep, buffalo
and cow milk, respectively (1).
The main component of milk, which has a major impact
on its nutritional value and technological suitability, is protein
(9). It has been reported that the
content of whey proteins in human milk is in the range of 0.68 to
0.83 g/100 g, and in cow's milk, this range is 0.55 to 0.70.
Sheep's milk is the richest in whey proteins (1.02 g/100 g)
(10) and contains the highest
concentration of casein (4.18 g/100 g) (10), similar to buffalo milk, which
contains 4.0 g casein in 100 g (11). Almost half the amount of casein is
found in cow's milk (2.46 to 2.80 g/100 g) (9) and goat's milk (2.81 g/100 g)
(12). Human milk also contains
casein; however, in small amounts -0.32 to 0.42 g/100 g (9); therefore, the ratio between whey
proteins and casein is very high (2.08), as previously mentioned
(13).
The protein fraction can be broken down into soluble
and insoluble proteins. Soluble proteins, termed whey proteins,
represent 20% of the total amount, while insoluble proteins, or
caseins, account for 80% (14).
The main role attributed to caseins is the binding of minerals and
their capacity as carriers, mainly calcium and phosphorus.
Furthermore, caseins give rise to numerous bioactive peptides that
have certain benefits for human health. These include antioxidants
(15), cytomodulators,
immunomodulators (16),
antihypertensives (17) and
antithrombotic factors (18) in
the cardiovascular, nervous and immune and digestive systems.
Certain peptides, such as b-casomorphins have opioid-like actions,
functioning similar to an analgesic and tranquilizer affecting the
central nervous system (19).
Experimental studies have also demonstrated that some peptides
interfere with the gastrointestinal tract, favoring the production
of mucin, thus preventing the adhesion of the pathogen to the
intestinal surface, exerting effects on intestinal motility that
may justify a possible role in weight control through the
regulation of food intake (20).
Fat is the main substance that defines the energy
value of milk and significantly contributes to its nutritional
properties, as well as to its technological suitability.
Cholesterol is present in the milk fat globule membrane and
accounts for 95% of milk fat sterols (6).
The cardio-metabolic risk is linked to several
factors, including obesity, abnormal glucose homeostasis,
dyslipidemia and hypertension (21). A positive association has been
established between these groups of risk factors, cardiovascular
disease and type 2 diabetes, and a similar association has been
described in children and adolescents (21,22).
In addition to genetic factors, lifestyle and eating habits also
significantly contribute to this risk (5).
In this context, scientific research has focused on
understanding the role of diet in the development of
cardiometabolic risk. Previous studies have report that the intake
of dairy products protects against this risk rather than
representing a problem (23,24).
The data reported in some studies have demonstrated that, mostly in
adults, the higher dairy intake may decrease the risk of developing
increased blood pressure, obesity and hyperinsulinemia (22,25).
Some components contained in dairy products, such as
calcium, medium-chain fats and bioactive peptides, have been found
to play a crucial role in the prevention of cardio-metabolic risk
and its complications, through mechanisms that include the sense of
satiety and the regulation of insulin levels (26). While some researchers have reported
a positive association between the intake of dairy products and the
increased cardio-metabolic risk (27), others have reported conflicting
data, particularly in adolescents (26,28).
Furthermore, it has not yet been clarified whether different types
of dairy products exert the same effects on the cardio-metabolic
risk.
It should be emphasized that the introduction of a
large number of dairy products in the diet also increases the
ingestion of fats, which are particularly rich in these products,
particularly saturated fatty (29)
and cholesterol. The effects of the increased intake of these two
nutritional components are mainly two: i) An increase in low
density lipoprotein (LDL) levels, and therefore in the onset of
cardiovascular issues; and ii) an increase in the levels of
circulating estrogens.
In 1958, an American scientist (Ansel Keys) began
the project termed ‘Seven Countries Study’, a comparative analysis
of the diet of 14 groups of subjects, aged between 40 and 59 years,
for a total of 12,000 cases, in seven countries from three
continents (Finland, Japan, Greece, Italy, Holland, the United
States and Yugoslavia) (30). The
data collected demonstrated that, among the Mediterranean
populations, who consumed mainly pasta, fish, fruit and vegetables,
and used exclusively olive oil as a condiment, the percentage of
mortality from ischemic heart disease was much lower than that in
the subjects of countries, such as Finland, where the daily diet
included a notable amount of saturated fat (butter, lard, milk and
red meat).
Previous research has also suggested that high
levels of cholesterol that appear in milk have a protective role in
infants and program the metabolism of cholesterol in later life.
Therefore, mothers are advised to avoid the use of infant formulas,
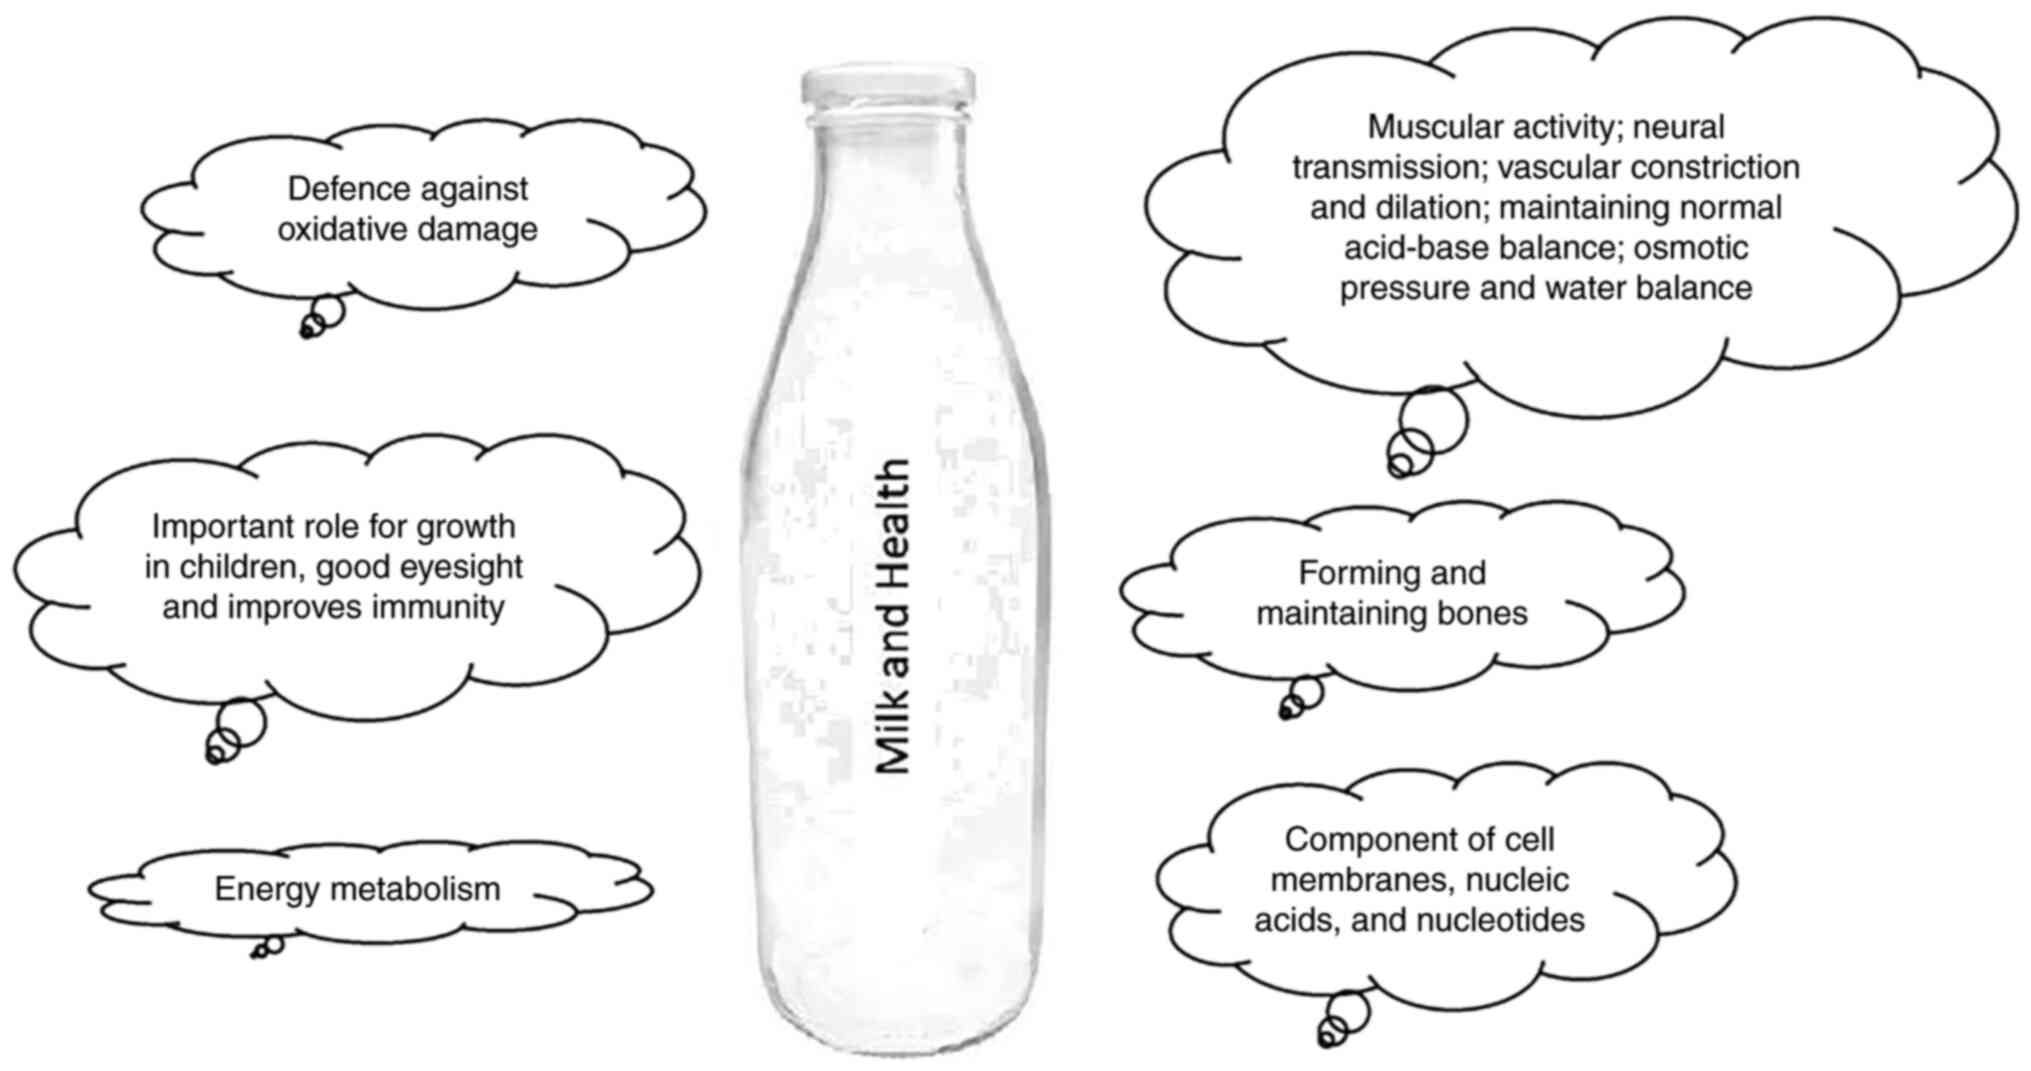
which are considered to have low cholesterol levels (31). It has been reported that saturated
acids, such as myristic and palmitic acid, tend to increase plasma
cholesterol and LDL levels, concluding that their partial
replacement in the diet with polyunsaturated fat is able to lower
cholesterol and coronary risk (27). A summary of the main benefits of
consuming milk is presented in Fig.
1.
Although there are increasing data on the health
benefits of cow's milk, whether milk from alternative (non-bovine)
sources could provide cardio metabolic protection has not yet been
reviewed, at least to the best of our knowledge. Considering that
the differences in the nutritional value of milk can be used as a
marker milk, helping to select the optimal food for human
nutrition, the aim of the present study was to compare different
components and parameters of milk (total lipids, density, lactose,
total solids, proteins, casein, freezing point, pH, electrical
conductivity and cholesterol) from different mammals.
Data and methods
Criteria for selecting the cited
articles
The cited articles were selected according to their
relevance for the purpose of the study in order to assess the state
of the milk and to compare the data obtained in the study.
Milk samples and analyses
The study was conducted on milk samples from 30
Italian Mediterranean buffaloes, 30 goats, 30 sheep and 30 cattle
at different stages of lactation and different parity levels. The
selected farms were all intensively managed. In total, of the
selected animals, 10 animals were in second lactation, 10 were in
third lactation and 10 were in fourth lactation. The milk samples
(50 ml), obtained by weighing the milk produced by milking twice
daily, were analyzed for the chemical-nutritional composition on
the same day of collection. The farms were all located in the same
region, in southern Italy and the samples were obtained during the
same period.
Milk samples from these species of zootechnical
interest were subjected to chemical-nutritional analysis and
compared with commercially available milk samples and a sample of
soymilk. These are samples of packaged milk normally present in
supermarkets, from various manufacturing companies that have been
sampled and analyzed, both for milk of animal origin and for those
of vegetable origin.
All samples were analyzed in triplicate. The
aliquots, analyzed the day after harvesting from the farm and
obtained by weighing the productions of the two-daily milking, were
subjected to the following determinations: Total lipids, density,
lactose, total solids, total proteins, casein, freezing point,
salts, pH, electrical conductivity and cholesterol.
When milking, all hygiene actions were followed, and
the samples were placed into sterile bottles. Prior to the
analysis, the milk samples were stored at a temperature of ±5˚C.
The quantitative determination of cholesterol was carried out using
a method previously described in 1995(32). The cholesterol content was analyzed
using a HP Series 1100 chromatograph (Hewlett Packard 1100 Series
HPLC System) equipped with a flame ionization detector (FID). The
analysis was performed on a glass column (C18 5 µl x ID 25 cm x
1,6). Helium was used as a carrier gas, the flow rate was 1 ml/min,
and the detector and the injector temperatures were 300 and 290˚C,
respectively.
Statistical analyses
Statistical analyses were performed using SPSS
software (2017, IBM Corp.). Data are presented as the mean ± SD.
One-way ANOVA was used to assess the differences in the milk
characteristic values from the different species. Tukey's test was
used as a post hoc test to identify the mean values that differed
significantly from each other. Values of P<0.01 and P<0.05
were considered to indicate statistically significant
differences.
Results and discussion
The chemical-nutritional characteristics of the milk
from the different mammals are presented in Table IA, and the results of statistical
analysis with the Tukey's test are presented in Table IB. The mean values of all
parameters reported in the study were like those reported in the
literature. The highest fat content (%) was found in sheep's milk
(13.72±2.51) and this differed significantly from the milk of the
other animals analyzed (cow milk, 3.40±0.55; buffalo milk,
9.86±1.80; and goat milk, 9.63±0.45). In particular, a significant
difference (P<0.01) was found for buffaloes and goats vs. sheep
and vs. cow milk. These results were similar to those reported in
previous studies (8,33).
 | Table IChemical and nutritional composition
of raw milk from different species and statistical analyses of the
differences. |
Table I
Chemical and nutritional composition
of raw milk from different species and statistical analyses of the
differences.
| A, Chemical and
nutritional composition of the milk |
|---|
| Parameter | Cow milk | Buffalo milk | Goat milk | Sheep milk |
|---|
| Fat (%) | | | | |
|
Mean | 3.40c | 9.86b | 9.63b | 13.72a |
|
SD | 0.55 | 1.80 | 0.45 | 2.51 |
| Density (˚SH) | | | | |
|
Mean | 1.031a | 1.038b | 1.032a | 1.039b |
|
SD | 0.017 | 0.02 | 0.015 | 0.015 |
| Lactose (%) | | | | |
|
Mean | 3.40e | 5.27f | 4.56e | 5.70d |
|
SD | 0.35 | 0.33 | 0.21 | 0.28 |
| RDM (g/l) | | | | |
|
Mean | 8.99f | 10.76e | 9.29f | 11.67d |
|
SD | 1.01 | 0.61 | 0.40 | 0.74 |
| Protein (%) | | | | |
|
Mean | 4.07 | 4.53 | 3.99 | 4.02 |
|
SD | 0.18 | 0.85 | 0.24 | 0.41 |
| FP (˚C) | | | | |
|
Mean | -0.528e,f | -0.629d,e | -0.46f | -0.740d |
|
SD | 0.089 | 0.155 | 0.31 | 0.063 |
| Salts (%) | | | | |
|
Mean | 0.77c | 0.92b | 0.79c | 1.01a |
|
SD | 0.09 | 0.05 | 0.03 | 0.07 |
| Casein (%) | | | | |
|
Mean | 2.91 | 3.48 | 3.07 | 3.10 |
|
SD | 0.90 | 0.99 | 0.23 | 0.38 |
| pH | | | | |
|
Mean | 6.85b | 7.00a | 6.79b | 6.85b |
|
SD | 0.05 | 0.13 | 0.12 | 0.10 |
| EC (ohm 25˚C) | | | | |
|
Mean | 11.94d | 5.39e | 13.54d | 3.70e |
|
SD | 1.19 | 2.24 | 2.03 | 0.75 |
| Cholesterol (mg/100
ml) | | | | |
|
Mean | 20.67a | 20.49a | 6.02c | 6.07b |
|
SD | 9.07 | 10.89 | 2.08 | 8.77 |
| B, Results of
statistical analysis with (ANOVA with Tukey's post hoc test) |
| | Subset for
alpha=0.05 | |
| Parameter | 1 | 2 | 3 | |
| Fat |
|
Cow | 3.40 | | | |
|
Goat | | 9.63 | | |
|
Buffalo | | 9.86 | | |
|
Sheep | | | 13.72 | |
| Density | | | | |
|
Cow | 1.031 | | | |
|
Goat | 1.032 | | | |
|
Buffalo | | 1.038 | | |
|
Sheep | | 1.039 | | |
| Lactose | | | | |
|
Cow | 3.40 | | | |
|
Goat | 4.56 | | | |
|
Buffalo | | 5.27 | | |
|
Sheep | | | 5.70 | |
| RDM | | | | |
|
Cow | 8.99 | | | |
|
Goat | 9.29 | | | |
|
Buffalo | | 10.76 | | |
|
Sheep | | | 11.67 | |
| Protein | | | | |
|
Cow | 4.07 | | | |
|
Goat | 3.99 | | | |
|
Buffalo | 4.53 | | | |
|
Sheep | 4.02 | | | |
| FP | | | | |
|
Cow | | -.528 | -.528 | |
|
Goat | | | -.460 | |
|
Buffalo | -.629 | -.629 | | |
|
Sheep | -.740 | | | |
| Salts | | | | |
|
Cow | .77 | | | |
|
Goat | .79 | | | |
|
Buffalo | | .92 | | |
|
Sheep | | | 1.01 | |
| Casein | | | | |
|
Cow | 2.91 | | | |
|
Goat | 3.07 | | | |
|
Buffalo | 3.48 | | | |
|
Sheep | 3.10 | | | |
| pH | | | | |
|
Cow | 6.85 | | | |
|
Goat | 6.79 | | | |
|
Buffalo | | 7.00 | | |
|
Sheep | 6.85 | | | |
| EC | | | | |
|
Cow | 11.94 | | | |
|
Goat | 13.54 | | | |
|
Buffalo | | 5.39 | | |
|
Sheep | | 3.70 | | |
| Cholesterol | | | | |
|
Cow | 20.67 | | | |
|
Goat | | | 6.02 | |
|
Buffalo | 20.49 | | | |
|
Sheep | | 6.07 | | |
In the present study, a higher lactose content (%)
was found in buffalo (5.27±0.33) and sheep (5.70±0.28) milk
compared with cow (3.40±0.35) and goat (4.56±0.21) milk. A
significant difference was found (P<0.05) of cows and goats vs.
buffalo vs. sheep. This finding could be justified by the rusticity
characteristics maintained by these species, as they are not
subjected to very strict selection regimes. Lactose is the main
milk sugar, and it is involved in the intestinal absorption of
minerals (calcium, magnesium and phosphorus), in the use of vitamin
D, and is a source of energy.
The highest cholesterol content (mg/100 ml) was
observed in bovine and buffalo milk (20.67±9.07 and 20.49±10.89,
respectively), and was markedly higher than that found in goat and
sheep milk. These differences were significant (P<0.01) between
cows and buffalo vs. goat and sheep. Cholesterol levels in buffalo
and cow milk were found to differ significantly compared to those
in sheep and goat milk. Similar results were observed in previous
studies (33). This peculiarity
could be justified by the of characteristics milk that are
influenced by factors endogenous and exogenous to the animal,
including ambient temperature, feeding (fibrous component of the
diet, presence of fodder, starch content of the ration, high
protein degradability), and the method of administration of the
ration (unifeed or separate administration of forages and
concentrates). Among all the factors, nutrition has a greater
weight, due both to the effects it induces at the hormonal level,
and as it allows the animal's organism to make available, for the
udder, the precursors necessary for the synthesis of the lipid
component (34). In the present
study, the managerial conditions could have influenced this
parameter, determining the observed values.
Another significant difference found, as shown in
Table IA, is related to the
electrical conductivity. This was significantly higher in cattle
and goat milk, than in buffalo and sheep milk. The conductivity of
milk is closely related to the presence of mineral electrolytes,
such as chlorides, phosphates and citrates. As shown in Table IA, when comparing the values of
electrical conductivity with the content of salts, it can be noted
that as the latter increase, the electrical transmission capacity
decreases. This is due to the fact that the content of mineral
electrolytes and colloidal ions decreases the resistance to the
passage of electric current in the water, the main constituent of
milk.
Among the peculiarities of buffalo milk there is
also a greater suitability for infant feeding, compared to cow's
milk, owing to the better ratio of calcium and phosphate contents,
compared to those of sodium and potassium (33). The density of the milk is not a
constant parameter and is strictly related to the lean residue and
the quantity of fat; with respect to the latter, there is an
inversely proportional association; moreover, it is also linked to
the temperature of the milk itself; thus, the data reported in the
literature are not always comparable with each other. In the
buffalo, where the fat content varies considerably during
lactation, this parameter is even more variable.
The proteins are the most noteworthy from an
allergological point of view, being, roughly, comprised of 80%
casein, the remainder being of whey proteins (β-lactoglobulin,
α-lactalbumin, etc. The majority of dairy-related allergies are
caused by immunoglobulins as they bind to particular amino acid
sequences, causing the allergic reaction. Yet, this allergenic
capacity is not strictly linked to the total protein content.
Indeed, from the analysis in the present study, it may seem that
buffalo milk, exhibiting a higher total protein content, is more
likely to cause allergic reactions; in reality, if the total
protein data are compared with the casein content, it can be seen
that this is higher in buffalo milk than in milk from other species
(Table IA).
Milk normally has a pH value close to neutral and is
a buffered solution, as there are acid or basic molecules that
neutralize any added bases or acids, mainly proteins carrying ionic
groups with positive or negative charges. As pH highlights the
‘current’ acidity that is an indication of the ‘state of
freshness’, in all the milk samples examined and in the different
species, the characteristics of freshness are clearly represented,
as the sampling was carried out immediately after milking. As
demonstrated in Table IA, by
comparing the electrical conductivity values with the salt content,
it is noted that the latter affect the electrical transmission
capacity.
For the completeness of the study, a
chemical-nutritional analysis of milk samples normally marketed, of
both vegetable and animal origin, was also included. The results
obtained are presented in Table
IIA.
| Table IIChemical and nutritional composition
of the normally marketed milk, for direct consumption and
statistical analyses. |
Table II
Chemical and nutritional composition
of the normally marketed milk, for direct consumption and
statistical analyses.
| A, Chemical and
nutritional composition of the normally marketed milk |
|---|
| Parameter | Goat | Oat | Rice | Soy | Cow |
|---|
| Lipids (%) | | | | | |
|
Mean | 2.85a | 1.36b | 1.06b | 1.62b | 3.36a |
|
SD | 0.47 | 0.04 | 0.06 | 0.05 | 0.37 |
| Density (˚SH) | | | | | |
|
Mean | 1.03 | 1.04 | 1.03 | 1.02 | 1.03 |
|
SD | 0.02 | 0.02 | 0.01 | 0.03 | 0.02 |
| Lactose (%) | | | | | |
|
Mean | 4.18 | 4.94 | 4.55 | 3.09 | 4.38 |
|
SD | 2.85 | 1.36 | 1.06 | 1.62 | 3.36 |
| RDM (g/l) | | | | | |
|
Mean | 8.52 | 9.92 | 9.11 | 6.26 | 8.97 |
|
SD | 0.27 | 0.31 | 0.21 | 0.30 | 0.25 |
| Protein (%) | | | | | |
|
Mean | 3.01 | 4.04 | 3.76 | 3.04 | 3.07 |
|
SD | 0.89 | 1.02 | 0.94 | 0.57 | 0.69 |
| FP (˚C) | | | | | |
|
Mean | -0.49 | -0.58 | -0.53 | -0.34 | -0.52 |
|
SD | 0.21 | 0.19 | 0.25 | 0.15 | 0.21 |
| Salts (%) | | | | | |
|
Mean | 0.72 | 0.84 | 0.77 | 0.53 | 0.76 |
|
SD | 0.08 | 0.07 | 0.08 | 0.05 | 0.07 |
| Casein (%) | | | | | |
|
Mean | 2.81 | 3.77 | 3.51 | 2.84 | 2.87 |
|
SD | 0.8 | 0.7 | 0.8 | 0.8 | 0.8 |
| pH | | | | | |
|
Mean | 6.81 | 6.05 | 7.20 | 7.55 | 6.87 |
|
SD | 0.04 | 0.04 | 0.05 | 0.04 | 0.03 |
| EC (ohm 25˚C) | | | | | |
|
Mean | 5.34 | 6.21 | 5.55 | 4.64 | 4.3 |
|
SD | 1.25 | 1.16 | 1.18 | 1.15 | 1.18 |
| Cholesterol (mg/100
ml) | | | | | |
|
Mean | 12.3 | 5.24 | 2.11 | 0 | 29.84 |
|
SD | 1.16 | 0.87 | 0.75 | 0 | 2.89 |
| B, Results of
statistical analysis with (ANOVA with Tukey's post hoc test) |
| | Subset for
alpha=0.05 | |
| Parameter | 1 | 2 | | | |
| Fat | | | | | |
|
Goat | | 2.85 | | | |
|
Milk from
oats | 1.36 | | | | |
|
Milk from
rice | 1.06 | | | | |
|
Milk from
soy | 1.62 | | | | |
|
Cow | | 3.36 | | | |
| Density | | | | | |
|
Goat | 1.03 | | | | |
|
Milk from
oats | 1.04 | | | | |
|
Milk from
rice | 1.03 | | | | |
|
Milk from
soy | 1.02 | | | | |
|
Cow | 1.03 | | | | |
| Lactose | | | | | |
|
Goat | 4.18 | | | | |
|
Milk from
oats | 4.94 | | | | |
|
Milk from
rice | 4.55 | | | | |
|
Milk from
soy | 3.09 | | | | |
|
Cow | 4.38 | | | | |
| RDM | | | | | |
|
Goat | 8.52 | | | | |
|
Milk from
oats | 9.92 | | | | |
|
Milk from
rice | 9.11 | | | | |
|
Milk from
soy | 6.26 | | | | |
|
Cow | 8.97 | | | | |
| Protein | | | | | |
|
Goat | 3.01 | | | | |
|
Milk from
oats | 4.04 | | | | |
|
Milk from
rice | 3.76 | | | | |
|
Milk from
soy | 3.04 | | | | |
|
Cow | 3.07 | | | | |
| FP | | | | | |
|
Goat | -.490 | | | | |
|
Milk from
oats | -.580 | | | | |
|
Milk from
rice | -.530 | | | | |
|
Milk from
soy | -.340 | | | | |
|
Cow | -.520 | | | | |
| Salts | | | | | |
|
Goat | .08 | | | | |
|
Milk from
oats | .07 | | | | |
|
Milk from
rice | .08 | | | | |
|
Milk from
soy | .05 | | | | |
|
Cow | .07 | | | | |
| Casein | | | | | |
|
Goat | 2.81 | | | | |
|
Milk from
oats | 3.77 | | | | |
|
Milk from
rice | 3.51 | | | | |
|
Milk from
soy | 2.84 | | | | |
|
Cow | 2.87 | | | | |
| pH | | | | | |
|
Goat | 6.81 | | | | |
|
Milk from
oats | 6.05 | | | | |
|
Milk from
rice | 7.20 | | | | |
|
Milk from
soy | 7.55 | | | | |
|
Cow | 6.87 | | | | |
| EC | | | | | |
|
Goat | 5.34 | | | | |
|
Milk from
oats | 6.21 | | | | |
|
Milk from
rice | 5.55 | | | | |
|
Milk from
soy | 4.64 | | | | |
|
Cow | 4.30 | | | | |
| Cholesterol | | | | | |
|
Goat | 12.3 | | | | |
|
Milk from
oats | 5.24 | | | | |
|
Milk from
rice | 2.11 | | | | |
|
Milk from
soy | 0 | | | | |
|
Cow | 29.84 | | | | |
The differences between the chemical and nutritional
characteristics between the different types of commercial milk were
analyzed. The samples were examined in triplicate, and only the
average values found are reported. From the results, some
differences in the chemical-nutritional composition of goat and
cow's milk with respect to the raw milk analyzed appear evident. In
particular, there was a higher percentage of lipids in goat's milk.
This peculiarity may be justified by the fact that the milk
characteristics are influenced by factors endogenous and exogenous
to the animal, including ambient temperature, feeding (fibrous
component of the diet, presence of fodder, starch content of the
ration, high protein degradability) and the method of
administration of the ration (unifeed or separate administration of
forages and concentrates).
Among all the factors, nutrition has a greater
weight, both for the effects it induces at the hormonal level, and
as it allows the animal's organism to make available, for the
udder, the precursors necessary for the synthesis of the lipid
component (34). In the present
study, the managerial conditions could have influenced this
parameter, determining the observed values.
Cow's milk had the highest cholesterol content.
However, these differences were not statistically significant, and
this may be explained by the manufacturing process the samples
undergo from the stable to the packaging industry. In this regard,
it is important to note that raw milk, compared to whole milk, at
the time of purchase has all the ‘original’ nutritional qualities
(thermolabile components, including enzymes and vitamin D) and the
protein fraction is slightly more digestible; however, the fat
micelles remain totally intact, considerably prolonging the
digestibility of the food. On the contrary, whole milk is
proportionally depleted with respect to the type of heat treatment
most commonly applied: Rapid pasteurization, or high temperature
short time (HTST, termed ‘fresh milk’, less conservable), and
ultra-high temperature treatment (UHT), termed ‘long-life’ milk;
however, owing to the homogenization of lipids, this type of milk
boasts an absolutely greater digestibility than raw milk.
From the aforementioned findings, it appears that
raw milk, in addition to having a greater palatability, is
nutritionally more integral, even if less digestible; however, this
statement is only partially acceptable. Raw milk, being only
macro-filtered, is a potentially polluted food; thus, it cannot or
should not be consumed as it is; statistically, ~1/5 of the
analyzed samples contain pathogens, and evidently, such a condition
requires the sanitation of the product (35).
In conclusion, cow's milk is the most universal raw
material for processing, resulting in the widest spectrum of
manufactured products. However, it should be emphasized that in
some regions of the world (with conditions that preclude the use of
dairy cattle), the milk obtained from these species is a valuable
source of nutrients providing an important food source. Sheep and
buffalo milk, due to its high protein and fat content, is an
excellent raw material for dairy processing.
Acknowledgements
Not applicable.
Funding
Funding: No funding was received.
Availability of data and materials
The datasets used and/or analyzed during the current
study are available from the corresponding author on reasonable
request.
Authors' contributions
AA performed all the fieldwork, undertook primary
data analysis and interpretation, prepared the draft manuscripts,
and completed the revisions. GA performed all the fieldwork and
undertook primary data analysis. FS was involved in the conception
and design of the study, technical input into the manuscript, and
the overall scientific management. AA and GA confirm the
authenticity of all the raw data. All authors have read and
approved the final manuscript.
Ethics approval and consent to
participate
Not applicable, as the milk samples were collected
in an automated milking parlor.
Patient consent for publication
Not applicable.
Competing interests
The authors declare that they have no competing
interests.
References
|
1
|
Barłowska J, Szwajkowska M, Litwińczuk Z
and Król J: Nutritional value and technological suitability of milk
from various animal species used for dairy production.
Comprehensive Reviews in Food Science and Food Safety. 10:291–302.
2011.
|
|
2
|
Hanuš O, Samková E, Křížová L, Hasoňová L
and Kala R: Role of fatty acids in milk fat and the influence of
selected factors on their variability-A review. Molecules.
23(1636)2018.PubMed/NCBI View Article : Google Scholar
|
|
3
|
Barreto IMLG, Rangel AHN, Urbano SA,
Bezerra JS and Oliveira HAA: Equine milk and its potential use in
the human diet. Food Sci Technol 39 (Suppl 1). S1–S7. 2019.
|
|
4
|
Blaško J, Kubinec R, Górová R, Fábry I,
Lorenz W and Soják L: Fatty acid composition of summer and winthe
cows' milk and butter. J Food Nutr Res. 49:169–177. 2010.
|
|
5
|
American Heart Association; National
Heart, Lung and Blood Institue. Grundy SM, Cleeman JI, Daniels SR,
Donato KA, Eckel RH, Franklin BA, Gordon DJ, Krauss RM, et al:
Diagnosis and management of the metabolic syndrome. An American
heart association/national heart, lung, and blood institute
scientific statement, executive summary. Cardiol Rev. 13:322–327.
2005.PubMed/NCBI
|
|
6
|
Parodi PW: Milk fat in human nutrition.
Aust J Dairy Tech. 59:3–59. 2004.
|
|
7
|
Balthazar CF, Pimentel TC, Ferrao LL,
Almada CN, Santillo A, Albenzio M, Mollakhalili N, Mortazavian AM,
Nascimento JS, Silva MC, et al: Sheep milk: Physicochemical
characteristics and relevance for functional food development.
Compr. Rev Food Sci Food Saf. 16:247–262. 2017.PubMed/NCBI View Article : Google Scholar
|
|
8
|
Medhammar E, Wijesinha-Bettoni R,
Stadlmayr B, Nilsson E, Charrondiere UR and Burlingame B:
Composition of milk from minor dairy animals and buffalo breeds: A
biodiversity perspective. J Sci Food Agric. 92:445–474.
2012.PubMed/NCBI View Article : Google Scholar
|
|
9
|
Guo HY, Pang K, Zhang XY, Zhao L, Chen SW,
Dong ML and Ren FZ: Composition, physicochemical properties,
nitrogen fraction distribution, and amino acid profile of donkey
milk. J Dairy Sci. 90:1635–1643. 2007.PubMed/NCBI View Article : Google Scholar
|
|
10
|
Dario C, Carnicella D, Dario M and Bufano
G: Genetic polymorphism of β-lactoglobulin gene and effect on milk
composition in Leccese sheep. Small Rumi Res. 74:270–300. 2008.
|
|
11
|
Vergnaud AC, Péneau S, Chat-Yung S, Kesse
E, Czernichow S, Galan P, Hercberg S and Bertrais S: Dairy
consumption and 6-y changes in body weight and waist circumference
in middle-aged French adults. Am J Clin Nutr. 88:1248–1255.
2008.PubMed/NCBI View Article : Google Scholar
|
|
12
|
Leitner G, Chaffer M, Shamay A, Shapiro F,
Merin U, Ezra E, Saran A and Silanikove N: Changes in milk
composition as affected by subclinical mastitis in sheep. J Dairy
Sci. 87:46–52. 2004.PubMed/NCBI View Article : Google Scholar
|
|
13
|
Shamsia SM: Nutritional and therapeutic
properties of camel and human milks. Int J Gen Mol Biol. 1:52–58.
2009.
|
|
14
|
Schaafsma G: The protein
digestibility-corrected amino acid score 1. J Nutr.
130:1865S–1867S. 2000.PubMed/NCBI View Article : Google Scholar
|
|
15
|
Zimecki M and Kruzel ML: Milk-derived
proteins and peptides of potential therapeutic and nutritive value.
J Exp Ther Oncol. 6:89–106. 2007.PubMed/NCBI
|
|
16
|
Politis I and Chronopoulou R: Milk
peptides and immune response in the neonate. Adv Exp Med Biol.
606:253–269. 2008.PubMed/NCBI View Article : Google Scholar
|
|
17
|
Jauhiainen T and Korpela R: Milk peptides
and blood pressure. J Nutr. 137 (3 Suppl 2):S825–S829.
2007.PubMed/NCBI View Article : Google Scholar
|
|
18
|
Phelan M, Aherne A, FitzGerald RJ and
O'Brien NM: Casein-derived bioactive peptides: Biological effects,
industrial uses, safety aspects and regulatory status. Int Dairy J.
19:643–654. 2009.
|
|
19
|
De Noni I, Fitzgerald RJ, Korhonen HJT,
Roux Y Le, Chris T, Thorsdottir I, et al: Review of the potential
health impact of β-casomorphins and related peptides. EFSA
Scientific Report. 231:1–107. 2009.
|
|
20
|
De Noni I and Cattaneo S: Occurrence of
β-casomorphins 5 and 7 in commercial dairy products and in their
digests following in vitro simulated gastro-intestinal digestion.
Food Chem. 119:560–566. 2010.
|
|
21
|
Morrison JA, Friedman LA, Wang P and
Glueck CJ: Metabolic syndrome in childhood predicts adult metabolic
syndrome and type 2 diabetes mellitus 25 to 30 years later. J
Pediatr. 152:201–206. 2008.PubMed/NCBI View Article : Google Scholar
|
|
22
|
Tailor AM, Peeters PH, Norat T, Vineis P
and Romaguera D: An update on the prevalence of the syndrome in
children and adolescents. Int J Pediatr Obes. 5:202–213.
2010.PubMed/NCBI View Article : Google Scholar
|
|
23
|
Pereira MA, Jacobs DR Jr, Van Horn L,
Slattery ML, Kartashov AI and Ludwi DS: Dairy consumption, obesity,
and the insulin resistance syndrome in young adults: The CARDIA
Study. JAMA. 287:2081–2089. 2002.PubMed/NCBI View Article : Google Scholar
|
|
24
|
Van Meijl LE, Vrolix R and Mensink RP:
Dairy product consumption and the metabolic syndrome. Nutr Res Rev.
21:148–157. 2008.PubMed/NCBI View Article : Google Scholar
|
|
25
|
McGrane MM, Essery E, Obbagy J, Lyon J,
Macneil P, Spahn J and Van Horn L: Dairy consumption, blood
pressure, and risk of hypertension: An evidence-based review of
recent literature. Curr Cardiovasc Risk Rep. 5:287–298.
2011.PubMed/NCBI View Article : Google Scholar
|
|
26
|
Rangan AM, Flood VL, Denyer G, Ayer JG,
Webb KL, Marks GB, Celermajer DS and Gill TP: The effect of dairy
consumption on blood pressure in mid-childhood: CAPS cohort study.
Eur J Clin Nutr. 66:652–657. 2012.PubMed/NCBI View Article : Google Scholar
|
|
27
|
Bard JM, Drouet L, Lairon D, Cazaubiel M,
Marmonier C, Ninio E, Bal Dit Sollier C, Martin JC, Boyer C and
Bobin-Dubigeon C: INNOVALAIT Study group. Effect of milk fat on LDL
cholesterol and other cardiovascular risk markes in healthy humans:
The INNOVALAIT project. Eur J Clin Nutr. 74:285–296.
2020.PubMed/NCBI View Article : Google Scholar
|
|
28
|
Bradlee ML, Singer MR, Qureshi MM and
Moore LL: Food group intake and central obesity among children and
adolescents in the Third National health and nutrition examination
survey (NHANES III). Public Health Nutr. 13:797–805.
2010.PubMed/NCBI View Article : Google Scholar
|
|
29
|
Moorman PG and Terry PD: Consumption of
dairy products and the risk of breast cancer: A review of the
literature. Am J Clin Nutr. 80:5–14. 2004.PubMed/NCBI View Article : Google Scholar
|
|
30
|
Keys A, Aravanis C, Blackburn H, van
Buchem FSP, Buzina R, Djordjevic BS, Epstein ASDFH, Fidanza F,
Karvonen MJ, Kimura N, et al: The seven countries study. A
scientific adventure in cardiovascular disease epidemiology. Daan
Kromhout, Alessandro Menotti and Henry Blackburn (eds). 1993.
|
|
31
|
Ohlsson L: Dairy products and plasma
cholesterol levels. Food Nutr Res. 54:2010.PubMed/NCBI View Article : Google Scholar
|
|
32
|
Naaemi ED, Nissar A, al-Sharrah TK and
Behbahani M: Rapid and simple method for determination of
cholesterol in processed food. J AOAC Int. 78:1522–1525.
1995.PubMed/NCBI
|
|
33
|
Pietrzak-Fiećko R and Kamelska-Sadowska
AM: The comparison of nutritional value of human milk with other
Mammals' milk. Nutrient. 12(1404)2020.PubMed/NCBI View Article : Google Scholar
|
|
34
|
Linn JG: Factors Affecting the Composition
of Milk from Dairy Cows. Designing Foods: Animal Product Options in
the Marketplace. National Academy Press, 1988.
|
|
35
|
Metza M, Sheehana J and Feng PCH: Use of
indicator bacteria for monitoring sanitary quality of raw milk
cheeses-A literature review. Food Microbiol.
85(103283)2020.PubMed/NCBI View Article : Google Scholar
|