Introduction
As a cholesterol-lowering therapy, the
administration of the 3-hydroxy-3-methylglutaryl co-enzyme
(HMG-CoA) reductase inhibitors, commonly known as statins, has
become increasingly widespread. Statins have been found to exert
biological effects at the cellular and molecular levels that
contribute not only to their cholesterol-lowering effect but also
to their cholesterol-independent pleiotropic mechanisms (1). These properties, together with the
high safety profile of statins, have fueled research into the
potential of expanding indications for statin therapy for certain
populations, such as lower-risk individuals without hyperlipidemia
but with elevated high-sensitivity C-reactive protein levels. Among
these studies, the Justification for the Use of Statins in Primary
Prevention (JUPITER) trial found that the administration of
rosuvastatin as a form of primary prevention significantly reduced
the incidence of major cardiovascular disease (2,3).
Increased research into statin therapy has initiated
a controversy that has endured for over a decade, mainly of whether
an association exists between statin use and cancer. The findings
of studies that have investigated this correlation have been
conflicting. Among them, the Simvastatin and Ezetimibe in Aortic
Stenosis (SEAS) trial reported a higher incidence of cancer in an
experimental group that underwent simvastatin-ezetimibe therapy
compared to a control group (4).
By contrast, a retrospective cohort analysis of approximately
46,000 propensity-matched pairs of 11 million adult Americans
demonstrated no statistically significant increased risk of cancer
with statin therapy (5), nor did
a study of elderly patients (6).
Interestingly, evidence that inspired our aim to determine the true
correlation between statins and cancer was based on a study that
found a correlation between lovastatin therapy and a reduction in
colorectal cancer risk in postmenopausal women (7). Compared to the conflicting clinical
results obtained by these previous studies, a number of recent
studies on human cancer cell lines and animal tumor models have
obtained more consistent results. Based on these findings, it is
hypothesized that statins possess chemopreventive properties that
arrest cell cycle progression, leading to the induction of
apoptosis (1), inhibition of cell
proliferation (8), or inhibition
of angiogenesis (9).
As the growth and metastasis of most tumors are
angiogenesis-dependent, tumor cell proliferation, as well as
endothelial cell proliferation and activity, both of which are
involved in microvasculature formation, control the progress of
tumor development (10). In order
to discover the molecular mechanism of the antitumor effect of
atorvastatin, this study conducted cell-based microarray analysis
using the EA.hy.926 human endothelial cell line to obtain a better
understanding of the possible effects of atorvastatin exposure on
endothelial cell responses and to identify the molecular mechanisms
and biological pathways associated with the anticancer effects of
atorvastatin. We applied the gene set enrichment analysis (GSEA)
(v2.07, Broad Institute), the Database for Annotation,
Visualization and Integrated Discovery (DAVID) (Bioinformatics
Resources, 6.7), and the Connectivity Map (cMap) to analyze the
microarray data. GSEA is a computational method used to determine
whether a pre-defined set of genes shows statistically significant
differences between 2 biological states (11). DAVID extracts biological features
associated with large gene lists (12). The cMap is a collection of gene
expression profiles from cultured human cell lines that are treated
with diverse bioactive small molecules. The current collection
(build 02) contains data for 6,100 treatment instances representing
1,309 discrete small molecules, which help in understanding
‘connections’ among drugs, genes and diseases, and find new uses
for existing drugs (13).
Materials and methods
Cell culture
The human umbilical vein endothelial cell line,
EA.hy926, was purchased from the Cell Bank of the Institute of
Cellular Biology at the Chinese Academy of Sciences, Shanghai,
China. Cells were cultured in Dulbecco’s modified Eagle’s medium
(DMEM) supplemented with 10% fetal bovine serum (FBS; Gibco,
Gaithersburg, MD, USA) and 1% penicillin/streptomycin at 37°C in a
humidified atmosphere containing 95% O2 and 5%
CO2. Atorvastatin (NICPBP, Beijing, China) was dissolved
in stock 10 mM dimethyl sulfoxide (DMSO; Sigma, St. Louis, MO, USA)
and added to the cells at the indicated concentrations for the
entire incubation period. The final concentration of DMSO never
exceeded 0.1%.
Analysis of differential gene
expression
After EA.hy926 cells had been collected subsequent
to incubation with atorvastatin (10 μM) or the control
(DMSO) for 24 h, the Affymetrix U133A Plus 2.0 GeneChip (CapitalBio
Corp., Beijing, China) was used to assay each group of cells 3
times to determine the gene expression profiles. Total-RNA was
extracted from 5×10⁶ cells with TRIzol®
(Invitrogen, Grand Island, NY, USA) according to the manufacturer’s
instructions and purified using RNeasy spin columns (Qiagen,
Hilden, Germany). The quality of the RNA was assessed by performing
gel electrophoresis and by determining the optical density (OD)
260/OD 280 ratio. After cDNA had been synthesized from
DNase-treated total-RNA (7 μg) using the Superscript II
double-stranded cDNA synthesis kit (Applied Biosystems, Carlsbad,
CA, USA), it was used for in vitro transcription in the
presence of biotin-labeled ribonucleotides (biotin-11-CTPs und
biotin-16-UTPs) to yield biotin-labeled cRNA. The biotin-labeled
RNA fragments were then hybridized to the probe array during 16 h
of incubation before staining the array with
streptavidin-phycoerythrin conjugate and scanning it using the
GeneChip® Scanner 3000. Finally, the hybridization
results were analyzed using the Affymetrix GeneChip Operating
Software Version 1.4.
GSEA
Based on the entire microarray profiles using
predefined gene sets, GSEA applies novel computational methods to
detect pathways that may serve as targets for novel therapeutics
(11). Two categories of
pre-defined gene sets in the Molecular Signatures Database (MSigDB)
were selected for analysis: the C4 set, a computational gene set
defined by mining large collections of cancer-oriented microarray
data that includes cancer gene neighborhoods and cancer modules,
and the C5 set, a Gene Ontology (GO) molecular function gene set
derived from the Molecular Function Ontology database (14). The gene sets included in the
analysis were limited to those that contained between 10 and 500
genes. Permutation was conducted 1,000 times according to
default-weighted enrichment statistics and by using a
signal-to-noise metric to rank genes according to their
differential expression levels across the atorvastatin and DMSO
groups. Significant gene sets were defined as those with a nominal
P-value <0.05.
DAVID
The probe sets of overexpressed and underexpressed
genes in the atorvastatin and DMSO groups were uploaded to DAVID
maintained by the National Institute of Allergy and Infectious
Diseases (NIAID) (12). Using the
DAVID functional annotation tool version 6.7, gene annotation
enrichment analysis, functional annotation clustering, BioCarta and
KEGG pathway mapping, gene-disease correlation analyses were
performed.
cMap analysis
cMap only includes gene data from Affymetrix
HG-U133A probe sets. The gene sets belonging to Affymetrix HG-U133A
Plus 2.0 probe sets, but not to Affymetrix HG-U133A probe sets were
excluded, and the remaining gene sets were further processed.
All mapped probe sets remaining after the above
exclusion process and indicating a 2-fold difference in gene
upregulation or downregulation between the atorvastatin and DMSO
groups were entered into the cMap (15). In the latest dataset version
(build 02) of the cMap, which contains 6,100 expression profiles
representing 4 cultured human cell lines (MCF7 breast cancer
epithelial cell line, PC3 prostate cancer cell line, HL60
non-epithelial leukemia cell line and SKMEL5 melanoma cell line)
treated with 1,309 bioactive small molecules (13), gene expression profiles of
instance sets are rank ordered by descending connectivity scores as
calculated by Kolmogorov-Smirnov statistics. Permutation tests were
performed to estimate the significance of the instance sets ranked
by the connectivity scores, with negative scores indicating that
treatment with a compound altered the probe sets in a manner
opposite to one if they were altered by atorvastatin treatment.
Real-time polymerase chain reaction (RT-PCR)
analysis. RNA was extracted using TRIzol and quantified by
measuring the absorbance at 260 nm for reverse transcription
analysis using the One Step RT-PCR kit (Promega, Madison, WI, USA)
according to the manufacturer’s instructions. After cDNA samples (2
μl) were amplified in 20 μl of 1X
SYBR®-Green PCR Master Mix (Applied Biosystems), RT-PCR
was performed on duplicate samples using the ABI PRISM®
7300 Real-Time PCR System (Applied Biosystems) with the following
cycling parameters: initial denaturation at 95°C for 10 min, 40
cycles of denaturation at 95°C for 15 sec, and annealing/extension
at 61°C for 31 sec. Data were normalized to human
glyceraldehyde-3-phosphate dehydrogenase (GAPDH) mRNA levels as an
endogenous control and expressed relative to the DMSO-treated
control using the 2−ΔΔCt method. The primers (Table I) were designed using Primer
Express® Primer Design Software V3.0 (Applied
Biosystems).
 | Table IPrimers for real-time quantitative
RT-PCR. |
Table I
Primers for real-time quantitative
RT-PCR.
| Gene name | Primer sequences
(F, forward; R, reverse) | Amplicon size
(bp) |
|---|
| GAPDH | F:
TGCGCAGAAAACAAGATGAG
R: CACCTTCACCGTTCCAGTTT | 114 |
| KLF2 | F:
GCAAACGCACCGCCACTCACACCT
R: CTTCCAGCCGCAGCCGTCCCAGTT | 140 |
| KLF3 | F:
GTGATTATGATGGATGCAACAAA
R: TTCATCAGACCGAGCAAACTT | 134 |
| KLF4 | F:
GCGGGCTGCGGCAAAACCTACAC
R: CATCCACAGCCGTCCCAGTCACAG | 104 |
| KLF6 | F:
AGCTCCTCTGTCACCTCCAC
R: CAGCTCCCCGGGCACGCAA | 87 |
| KLF7 | F:
GTTTTGCACGAAGCGATGAG
R: ATGTGGAGGGCAAGATGGTC | 118 |
| KLF9 | F:
GAAACACGCCTCCGAAAAG
R: TCACCTGTATGCACTCTGTAATGG | 105 |
| KLF13 | F:
TCGGGAGAATACAGCTCCGATTTCT
R: TGTCCATAAAGGTACTGAAGCTG | 112 |
| CCNB2 | F:
GCACATGGCCAAGAATGTGGTG
R: TCAGTGGGGAGGCAAGGTCTT | 149 |
| CCNB1 | F:
ACATGGTGCACTTTCCTCCTTCTC
R: GTAGAGTTGGTGTCCATTCACC | 93 |
| CCNA2 | F:
TTGCTGGAGCTGCCTTTCATTTAG
R: CCAGGGTATATCCAGTCTTTCGTA | 90 |
| CCNE2 | F:
GGATGGTACCTTTTGTCAATGTAG
R: AATTTACTTCCTCCAGCATAGCC | 116 |
Microarray analysis
To identify genes that were differentially expressed
in the atorvastatin and DMSO groups, the expression level of each
gene was transformed into a log2 base. The SAM algorithm was
applied to the gene expression arrays from the 3 replicates of each
group to perform cluster analysis using Cluster 3.0 and TreeView
software.
Results
Expression profiles of the atorvastatin
and DMSO groups
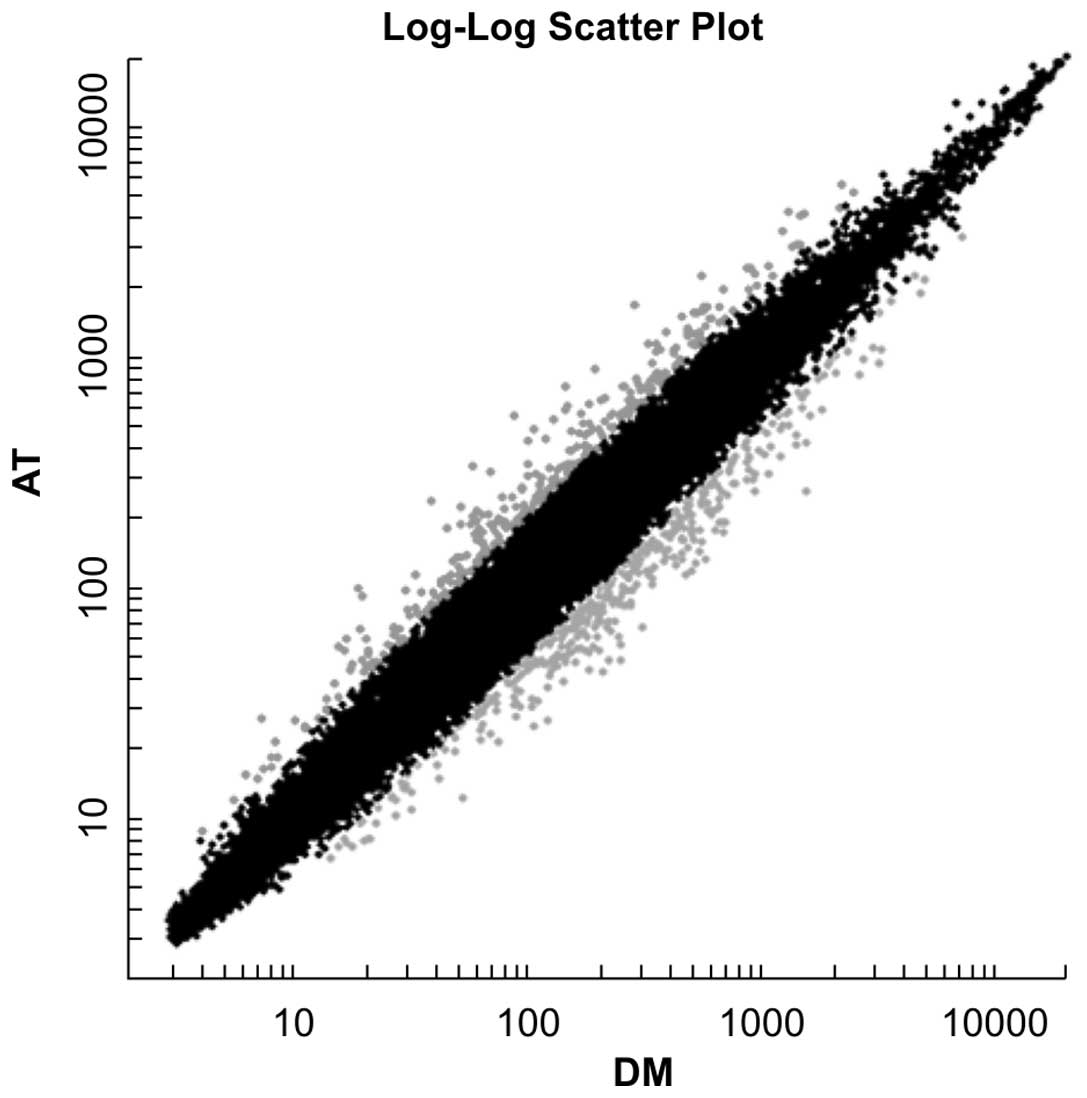
The 3 replicates within the atorvastatin group were
found with a high degree of pair-wise correlation in terms of the
log2 gene expression. By contrast, the expression profiles of the 3
replicates were found to differ dramatically from those of the DMSO
control group. Specifically, the results indicated that 295 genes
were upregulated and 354 genes downregulated by >2-fold in the
atorvastatin group compared with the DMSO group (Fig. 1).
Downregulation of cancer modules 397,
372, 485 and 438
According to the GSEA results, the gene sets in the
MSigDB C4-designated modules 397, 372, 485 and 438, all of which
are highly enriched in cancer cells compared with normal cells,
were significantly downregulated in the atorvastatin group compared
with the DMSO group (Fig. 2A and
B). According to the Stanford University module map, liver
cancer cell lines are enriched in the induced arrays of modules
397, 372, 485 and 438; B lymphoma cell lines in the induced genes
of modules 438 and 485; hematological cancer, adenocarcinoma and
breast cancer cell lines in the induced arrays of module 397; small
cell lung cancer cell lines in the upregulated genes in modules 397
and 372; and P53-positive hepatocellular carcinoma cell lines in
module 485 (16). Based on this
map and the possibility that atorvastatin may repress the
overexpression of genes in modules 397, 372, 485 and 438 compared
with the DMSO control, it was concluded that atorvastatin had
exerted an antitumor effect through these genes in the cancer
modules.
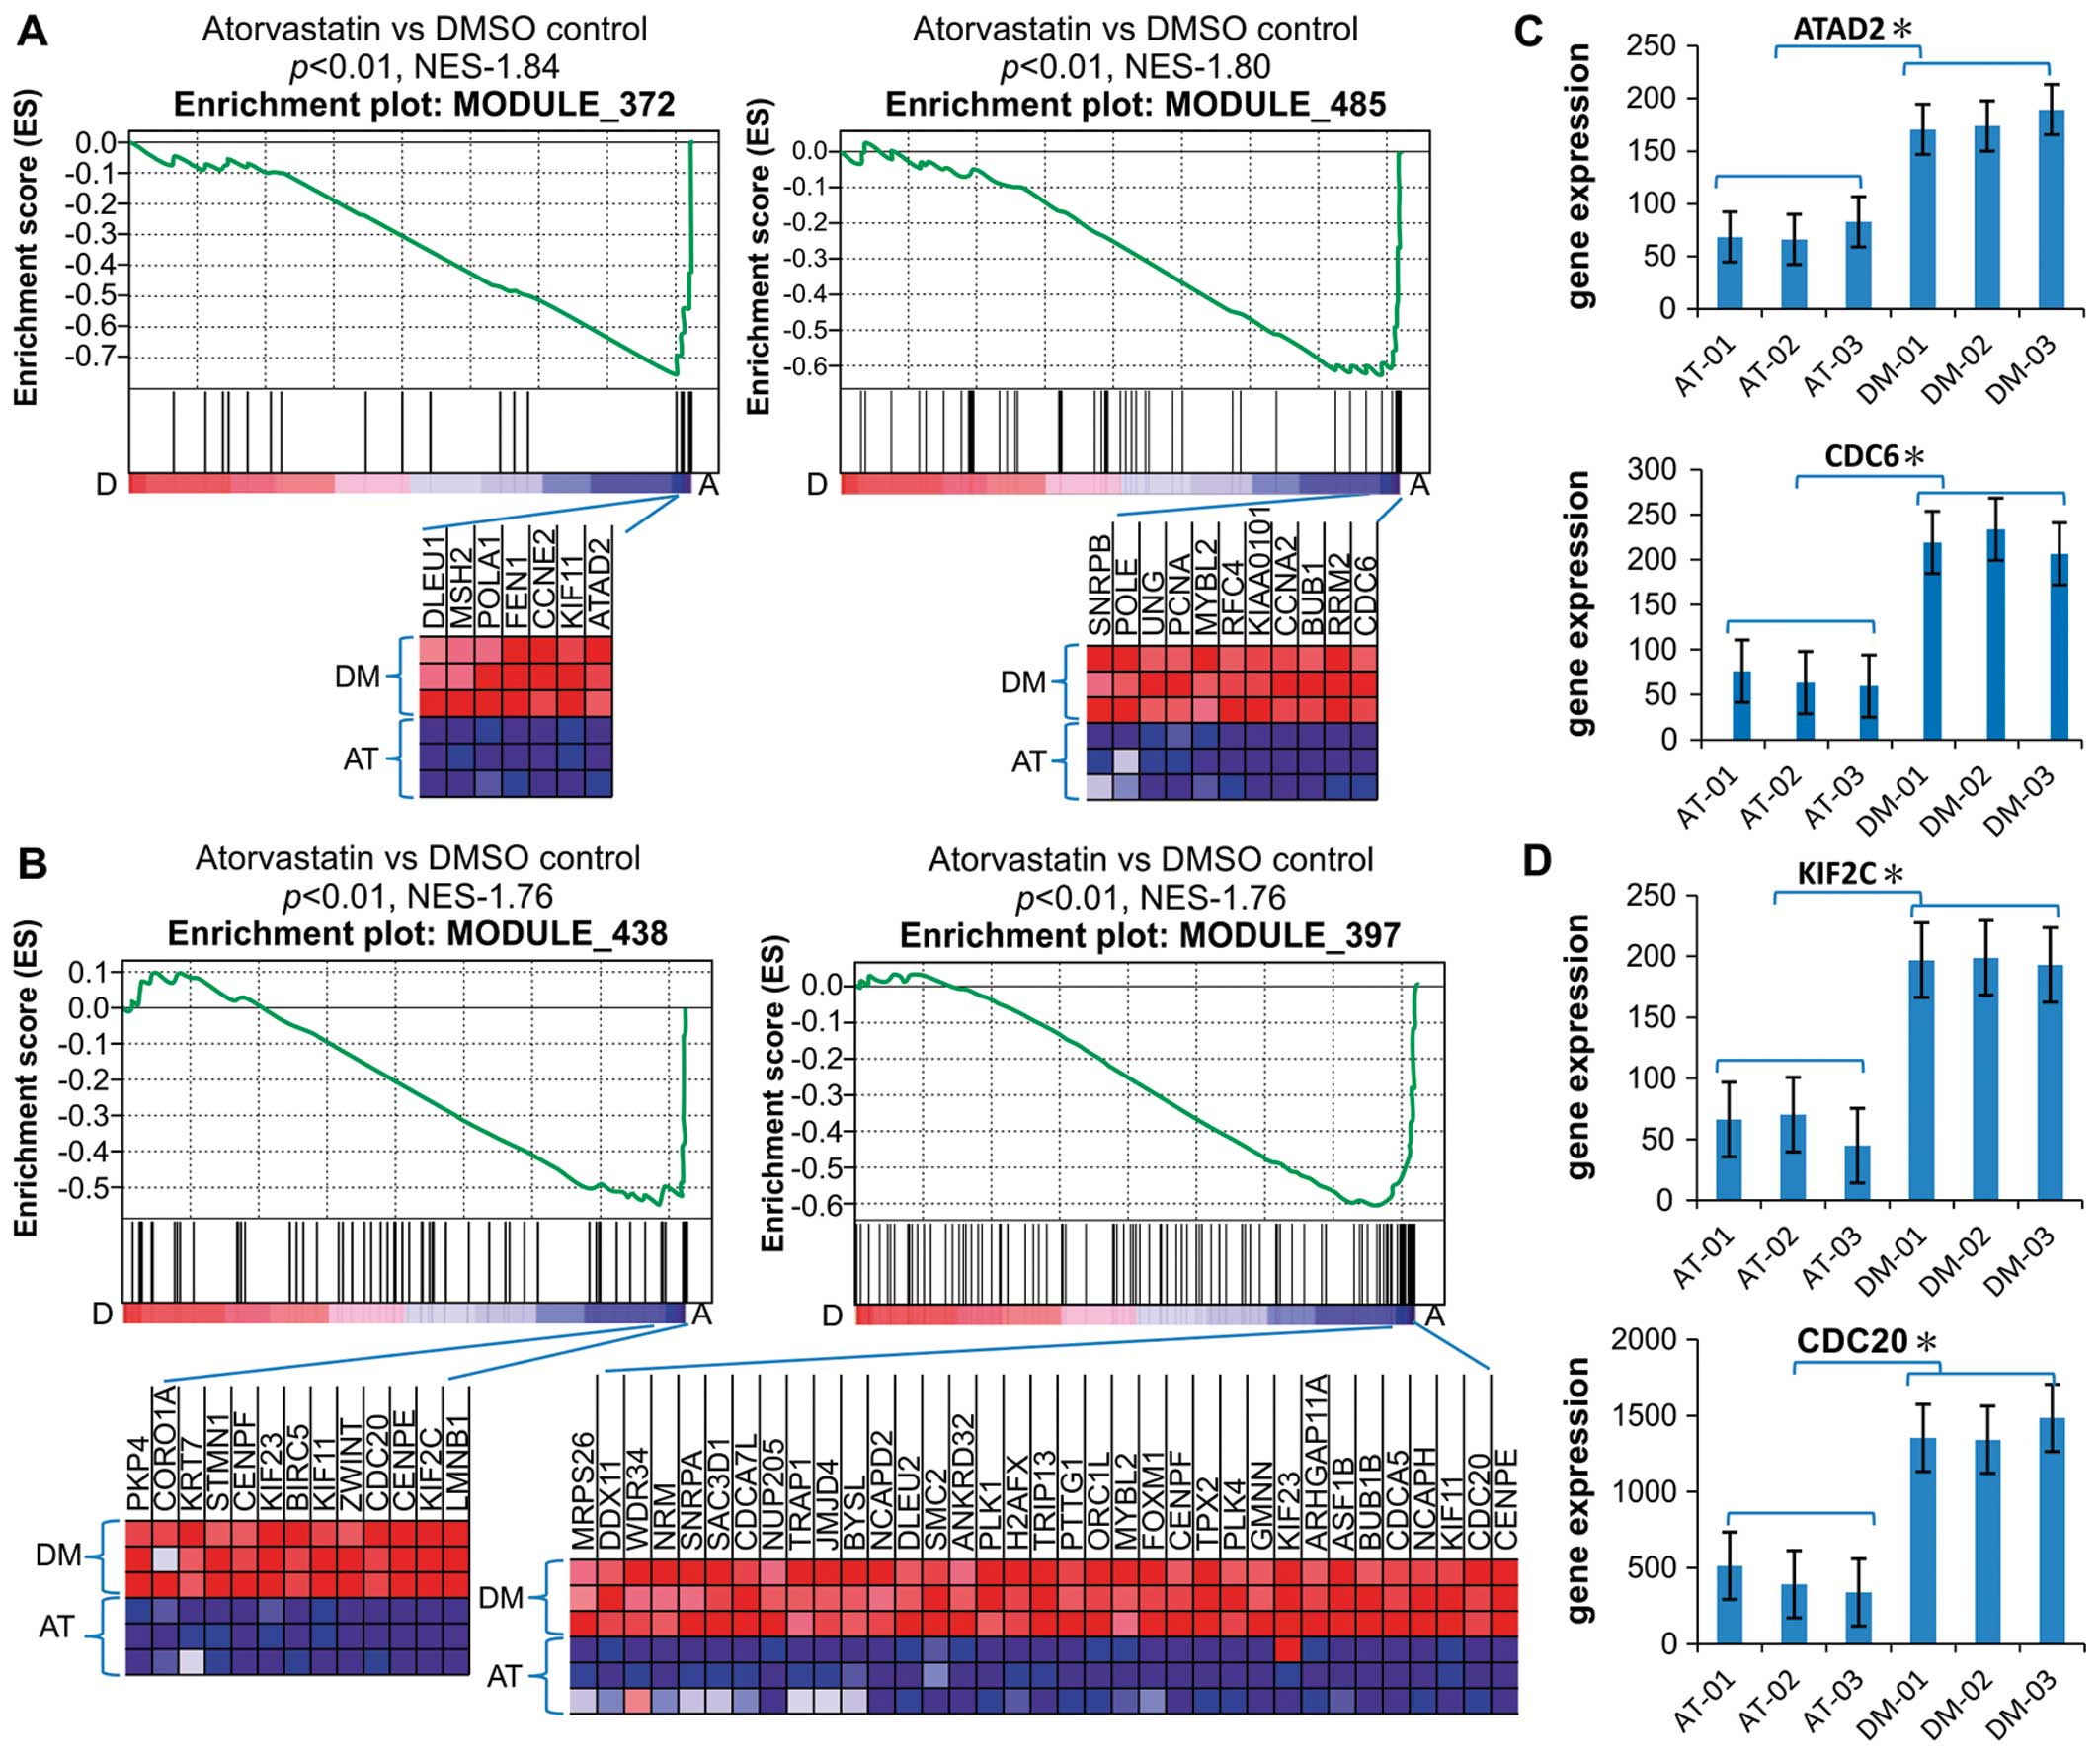 | Figure 2Downregulation of cancer modules in
EA.hy926 cells. (A and B) Gene set enrichment analysis histograms
of the gene set consisting of cancer modules 372, 485, 438 and 397.
The enrichment score (ES; y-axis) reflects the degree to which a
gene set was depressed with A, atorvastatin treatment or control
treatment with D, dimethyl sulfoxide. Each solid bar represents 1
gene within a gene set. The heat-map image illustrates the gene
expression levels of the leading edge subset. The normalized
enrichment score (NES) and the nominal P-value are indicated. (C
and D) Expression of representative genes (ATAD2, CDC6, KIF2C and
CDC20) in modules 372, 485, 438 and 397. The significance was
evaluated by the Student’s t-test, *P<0.01. Data are
the means ± SD values of the 3 arrays. AT, atorvastatin; DM,
dimethyl sulfoxide. |
The leading genes in the gene sets in the
atorvastatin and DMSO groups were compared, including ATAD2, which
is required for histone hyperacetylation and may be involved in the
estrogen-induced cell proliferation and cell cycle progression of
breast cancer cells; the cell division cycle (CDC) homolog 6 gene,
which is involved in the initiation of DNA replication; the kinesin
family member 2C gene (KIF2C), which promotes ATP-dependent removal
of tubulin dimers from microtubules and regulates the microtubule
turnover during the kinetochore and chromosome segregation that
occurs during mitosis; and CDC20, which is required for nuclear
movement prior to anaphase and chromosome separation, both of which
are microtubule-dependent processes (Fig. 2C and D). According to the GO
annotation of the cancer module gene sets, these genes are involved
in DNA replication and microtubule genesis. Therefore, there is a
possibility that atorvastatin regulates genes belonging to these
cancer modules, inhibits DNA replication, and removes tubulin
dimers from microtubules.
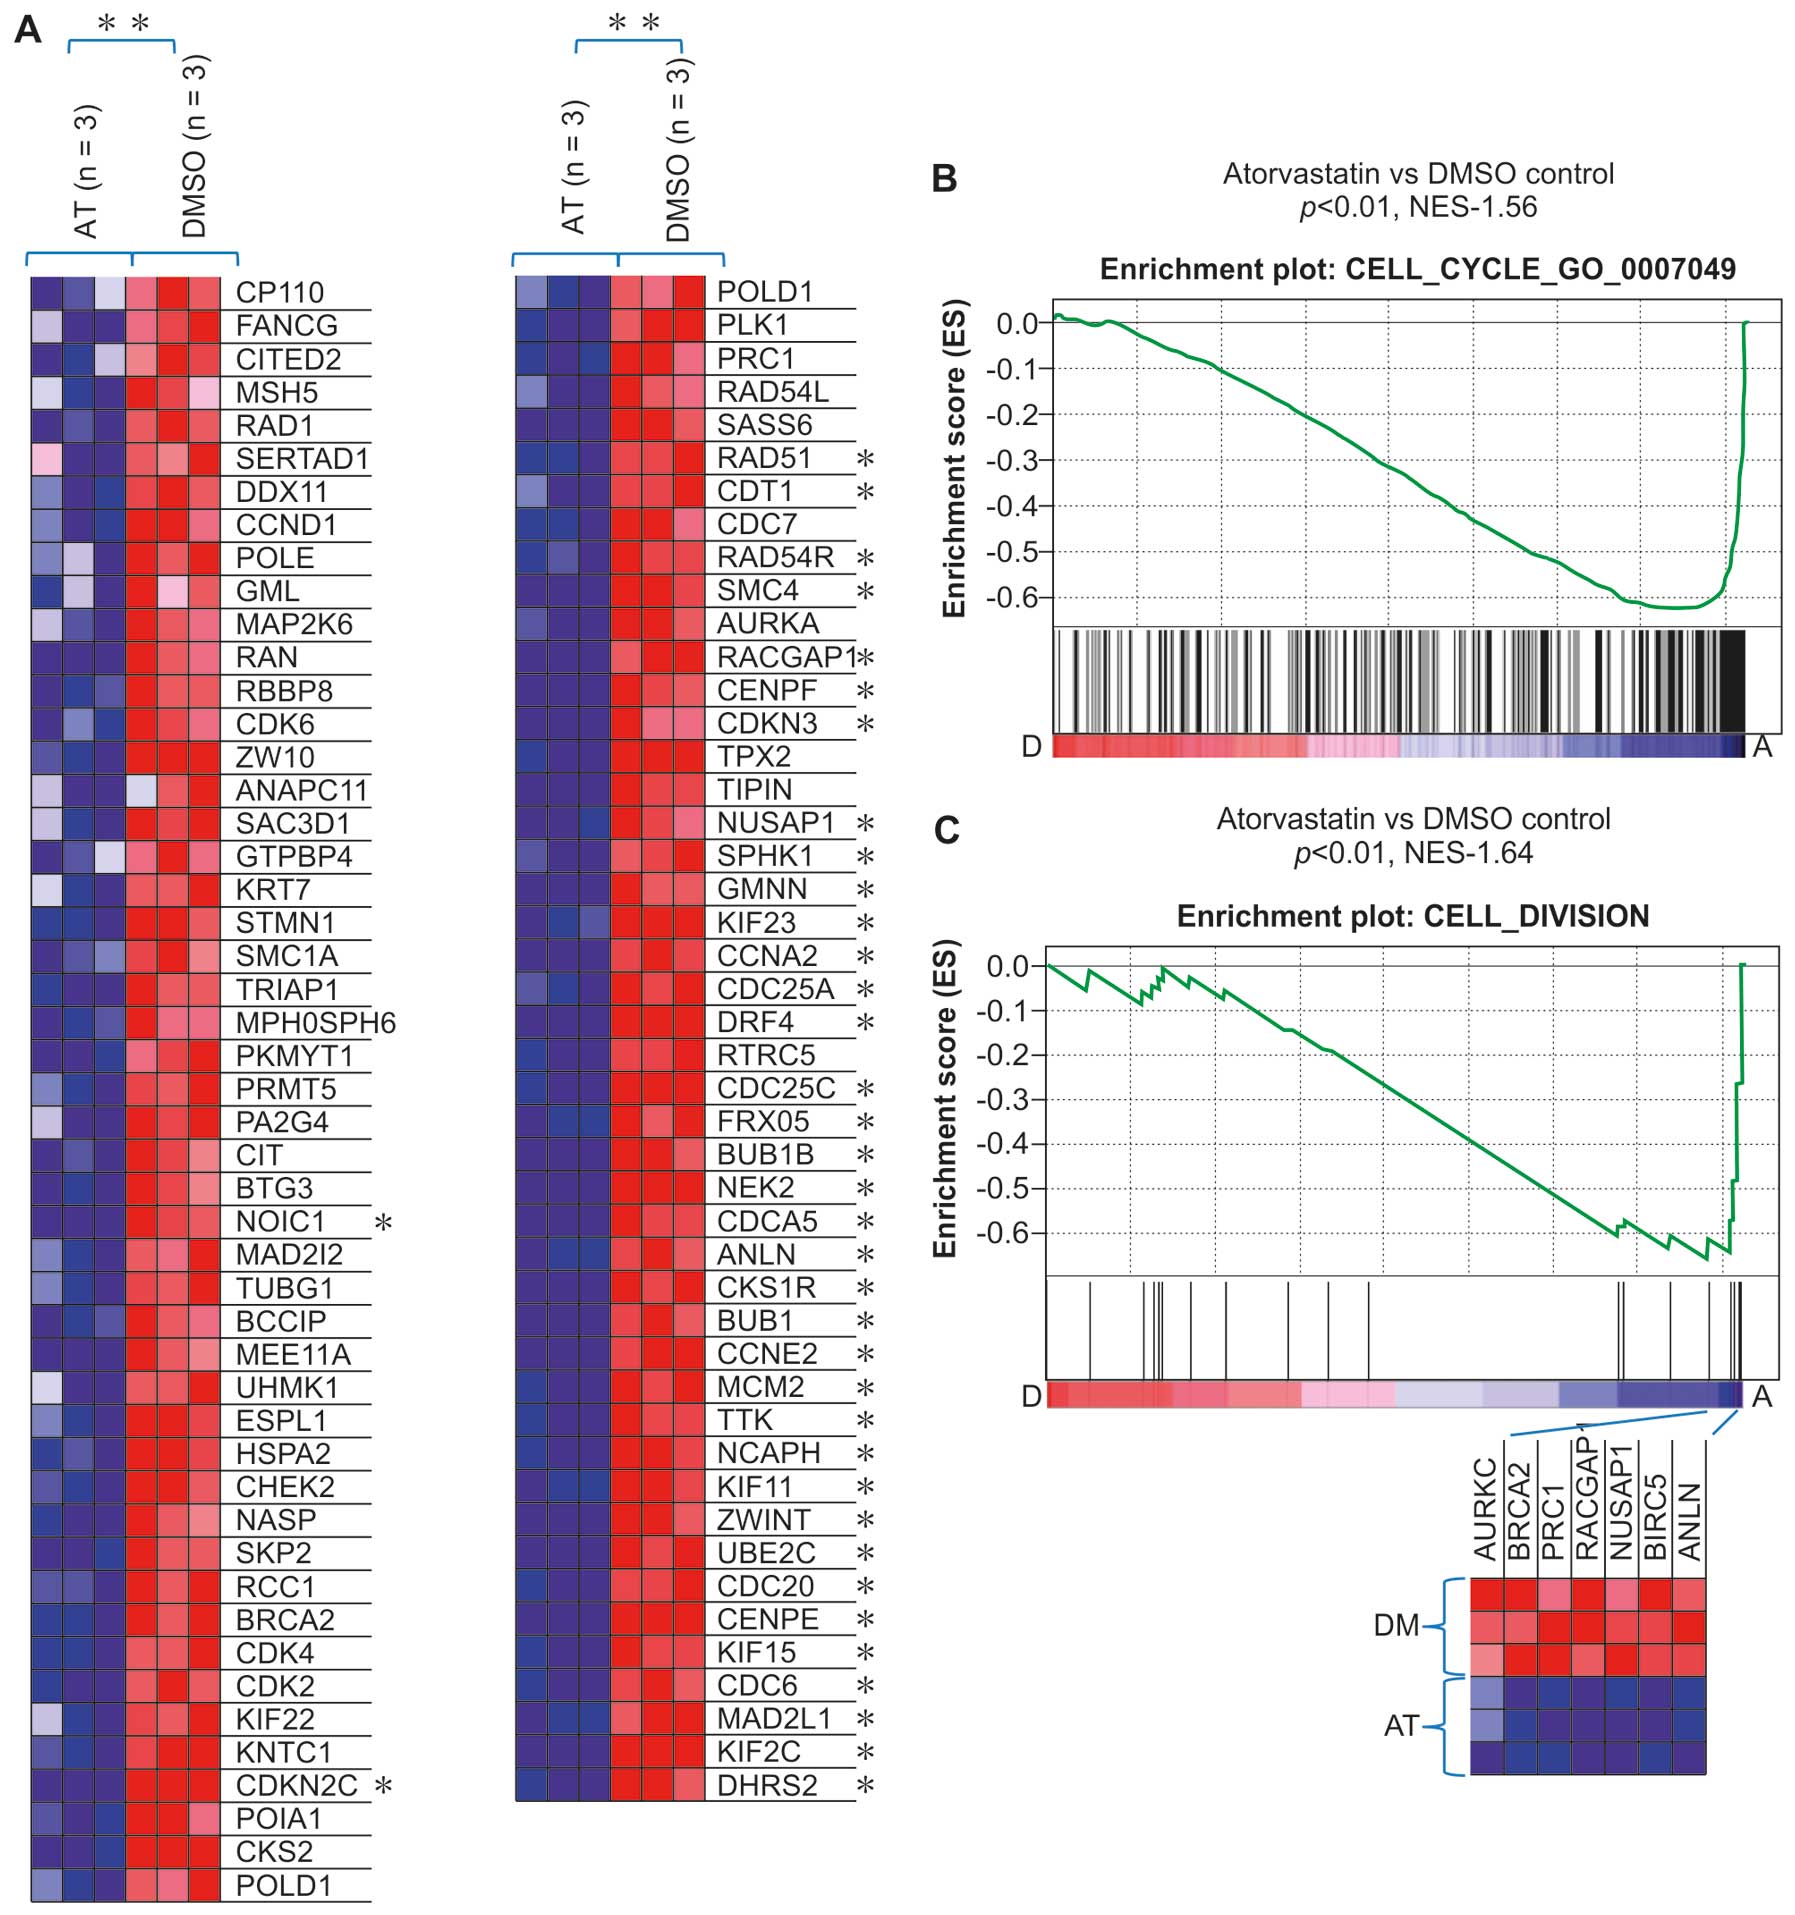
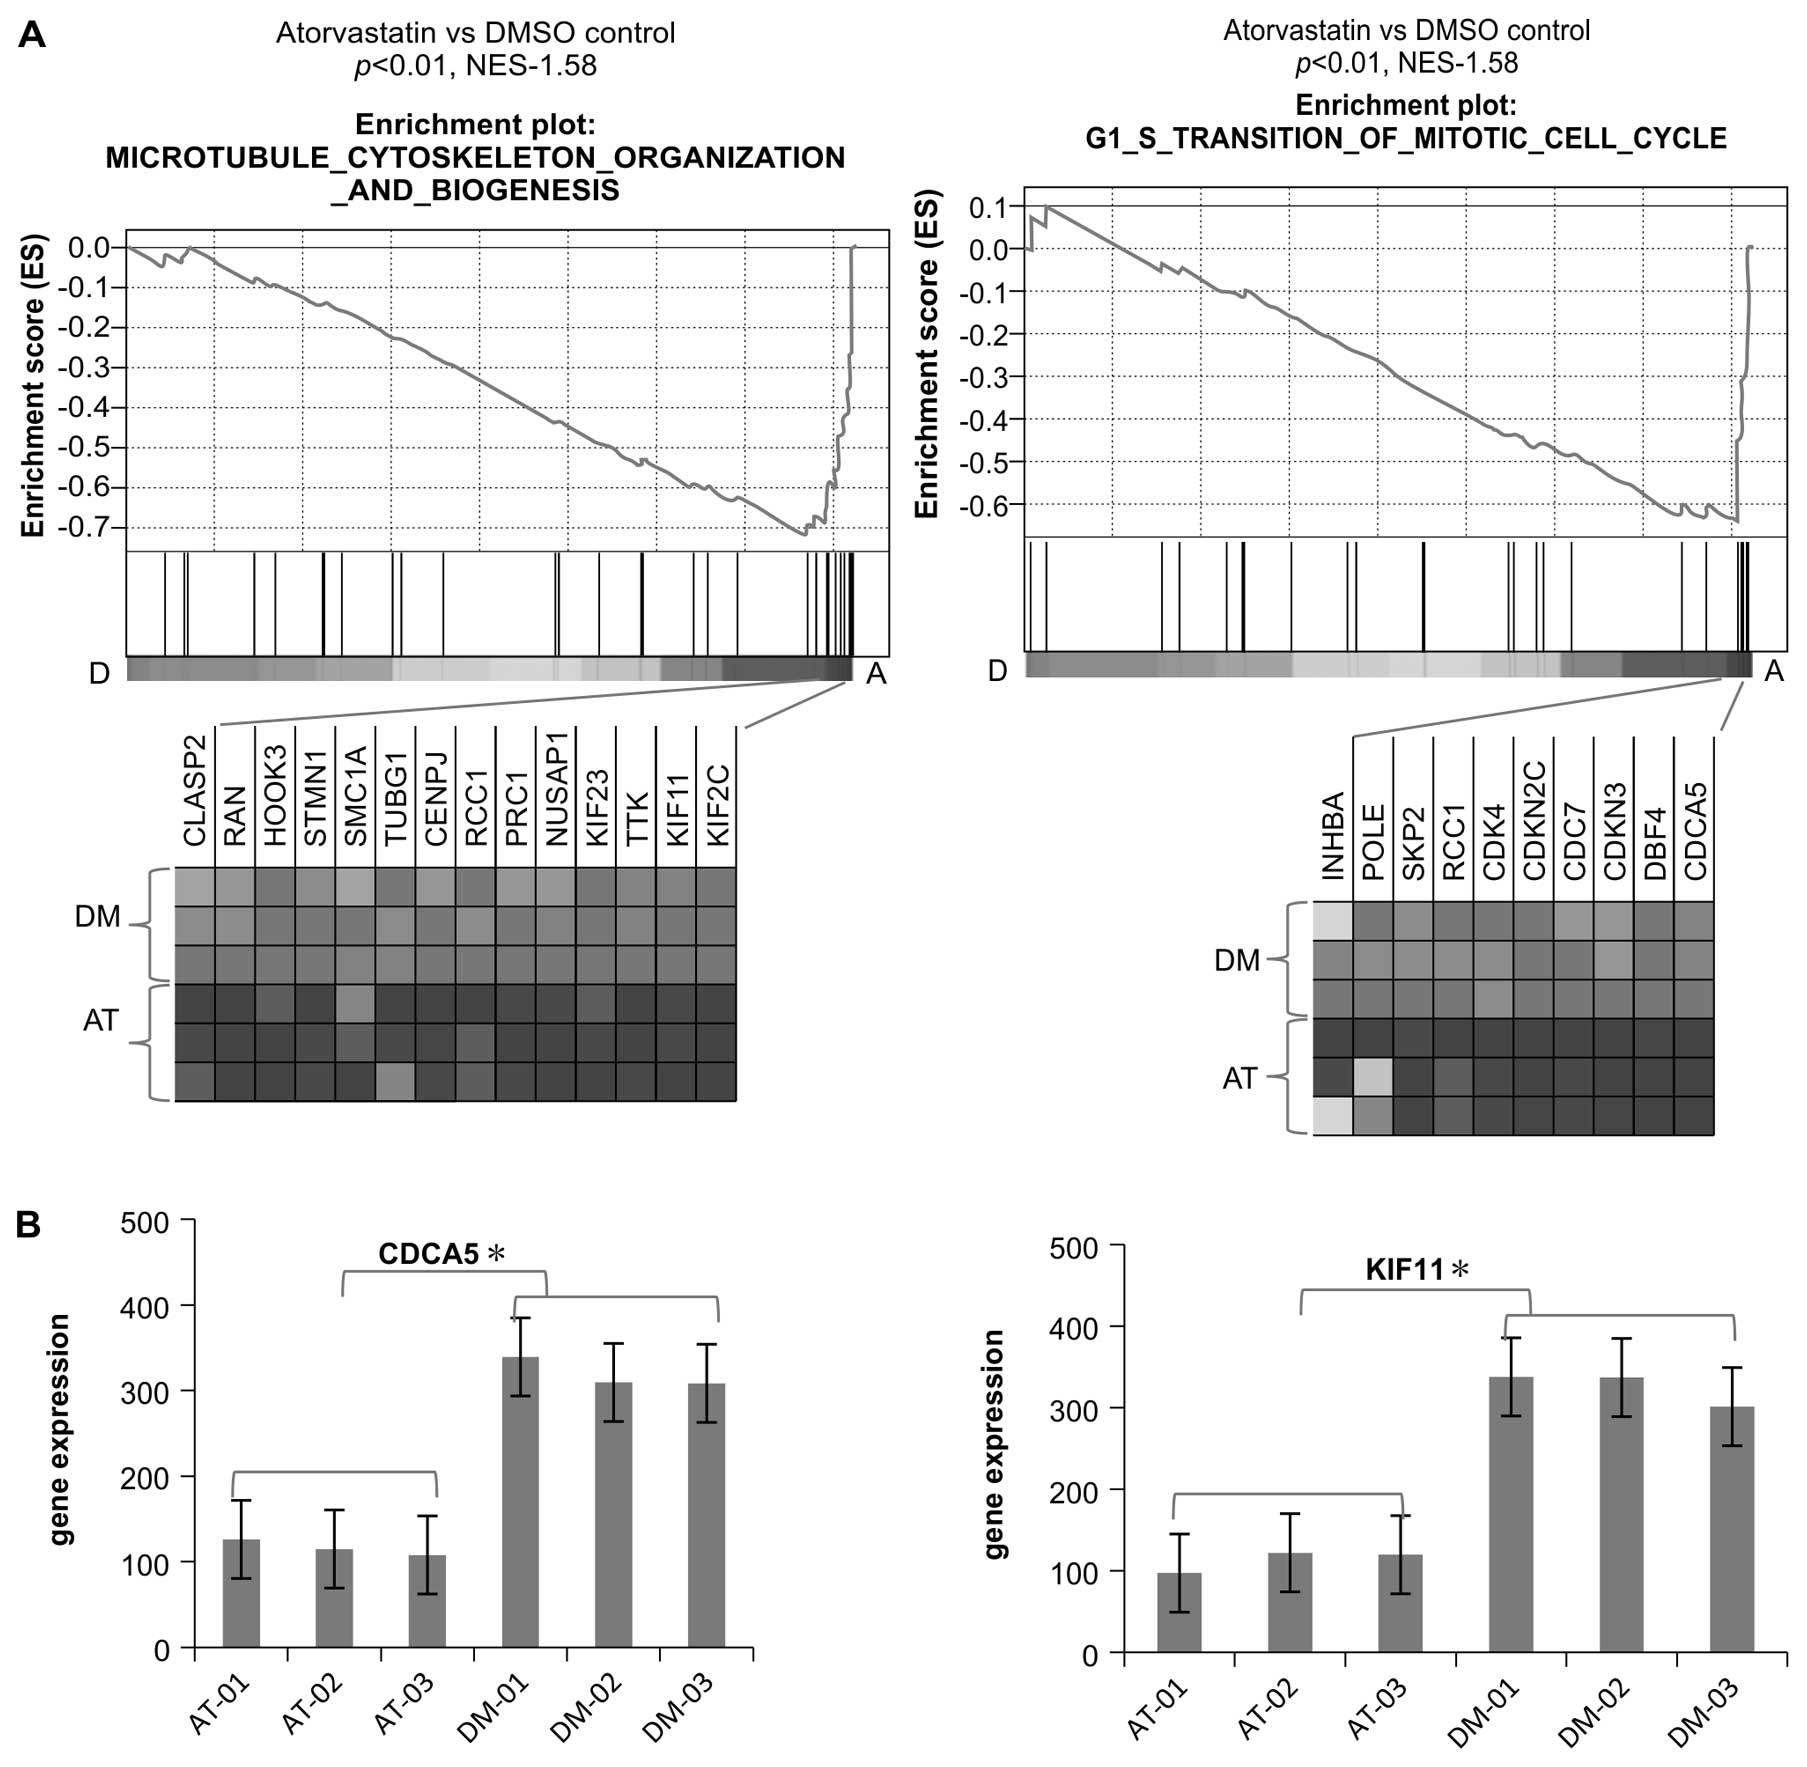
A consistent finding in the present study was that
multiple gene sets related to the cell cycle regulation in C5 GO
biological processes were also downregulated in the atorvastatin
group compared with the DMSO group. Several cell cycle regulators,
including Cdk2, Cdk4, CDC25A, CDC25C, cyclin (CCN) A2, CCNE2, CDC6,
CDC7, CDCA5 and KIF11, essential in the control and promotion of
the cell cycle at the G1/S (start) and the G2/M (mitosis)
transitions, were also found to be downregulated in the
atorvastatin group (Figs. 3A and
B and 4).
Gene annotation enrichment analysis,
BioCarta and KEGG pathway mapping
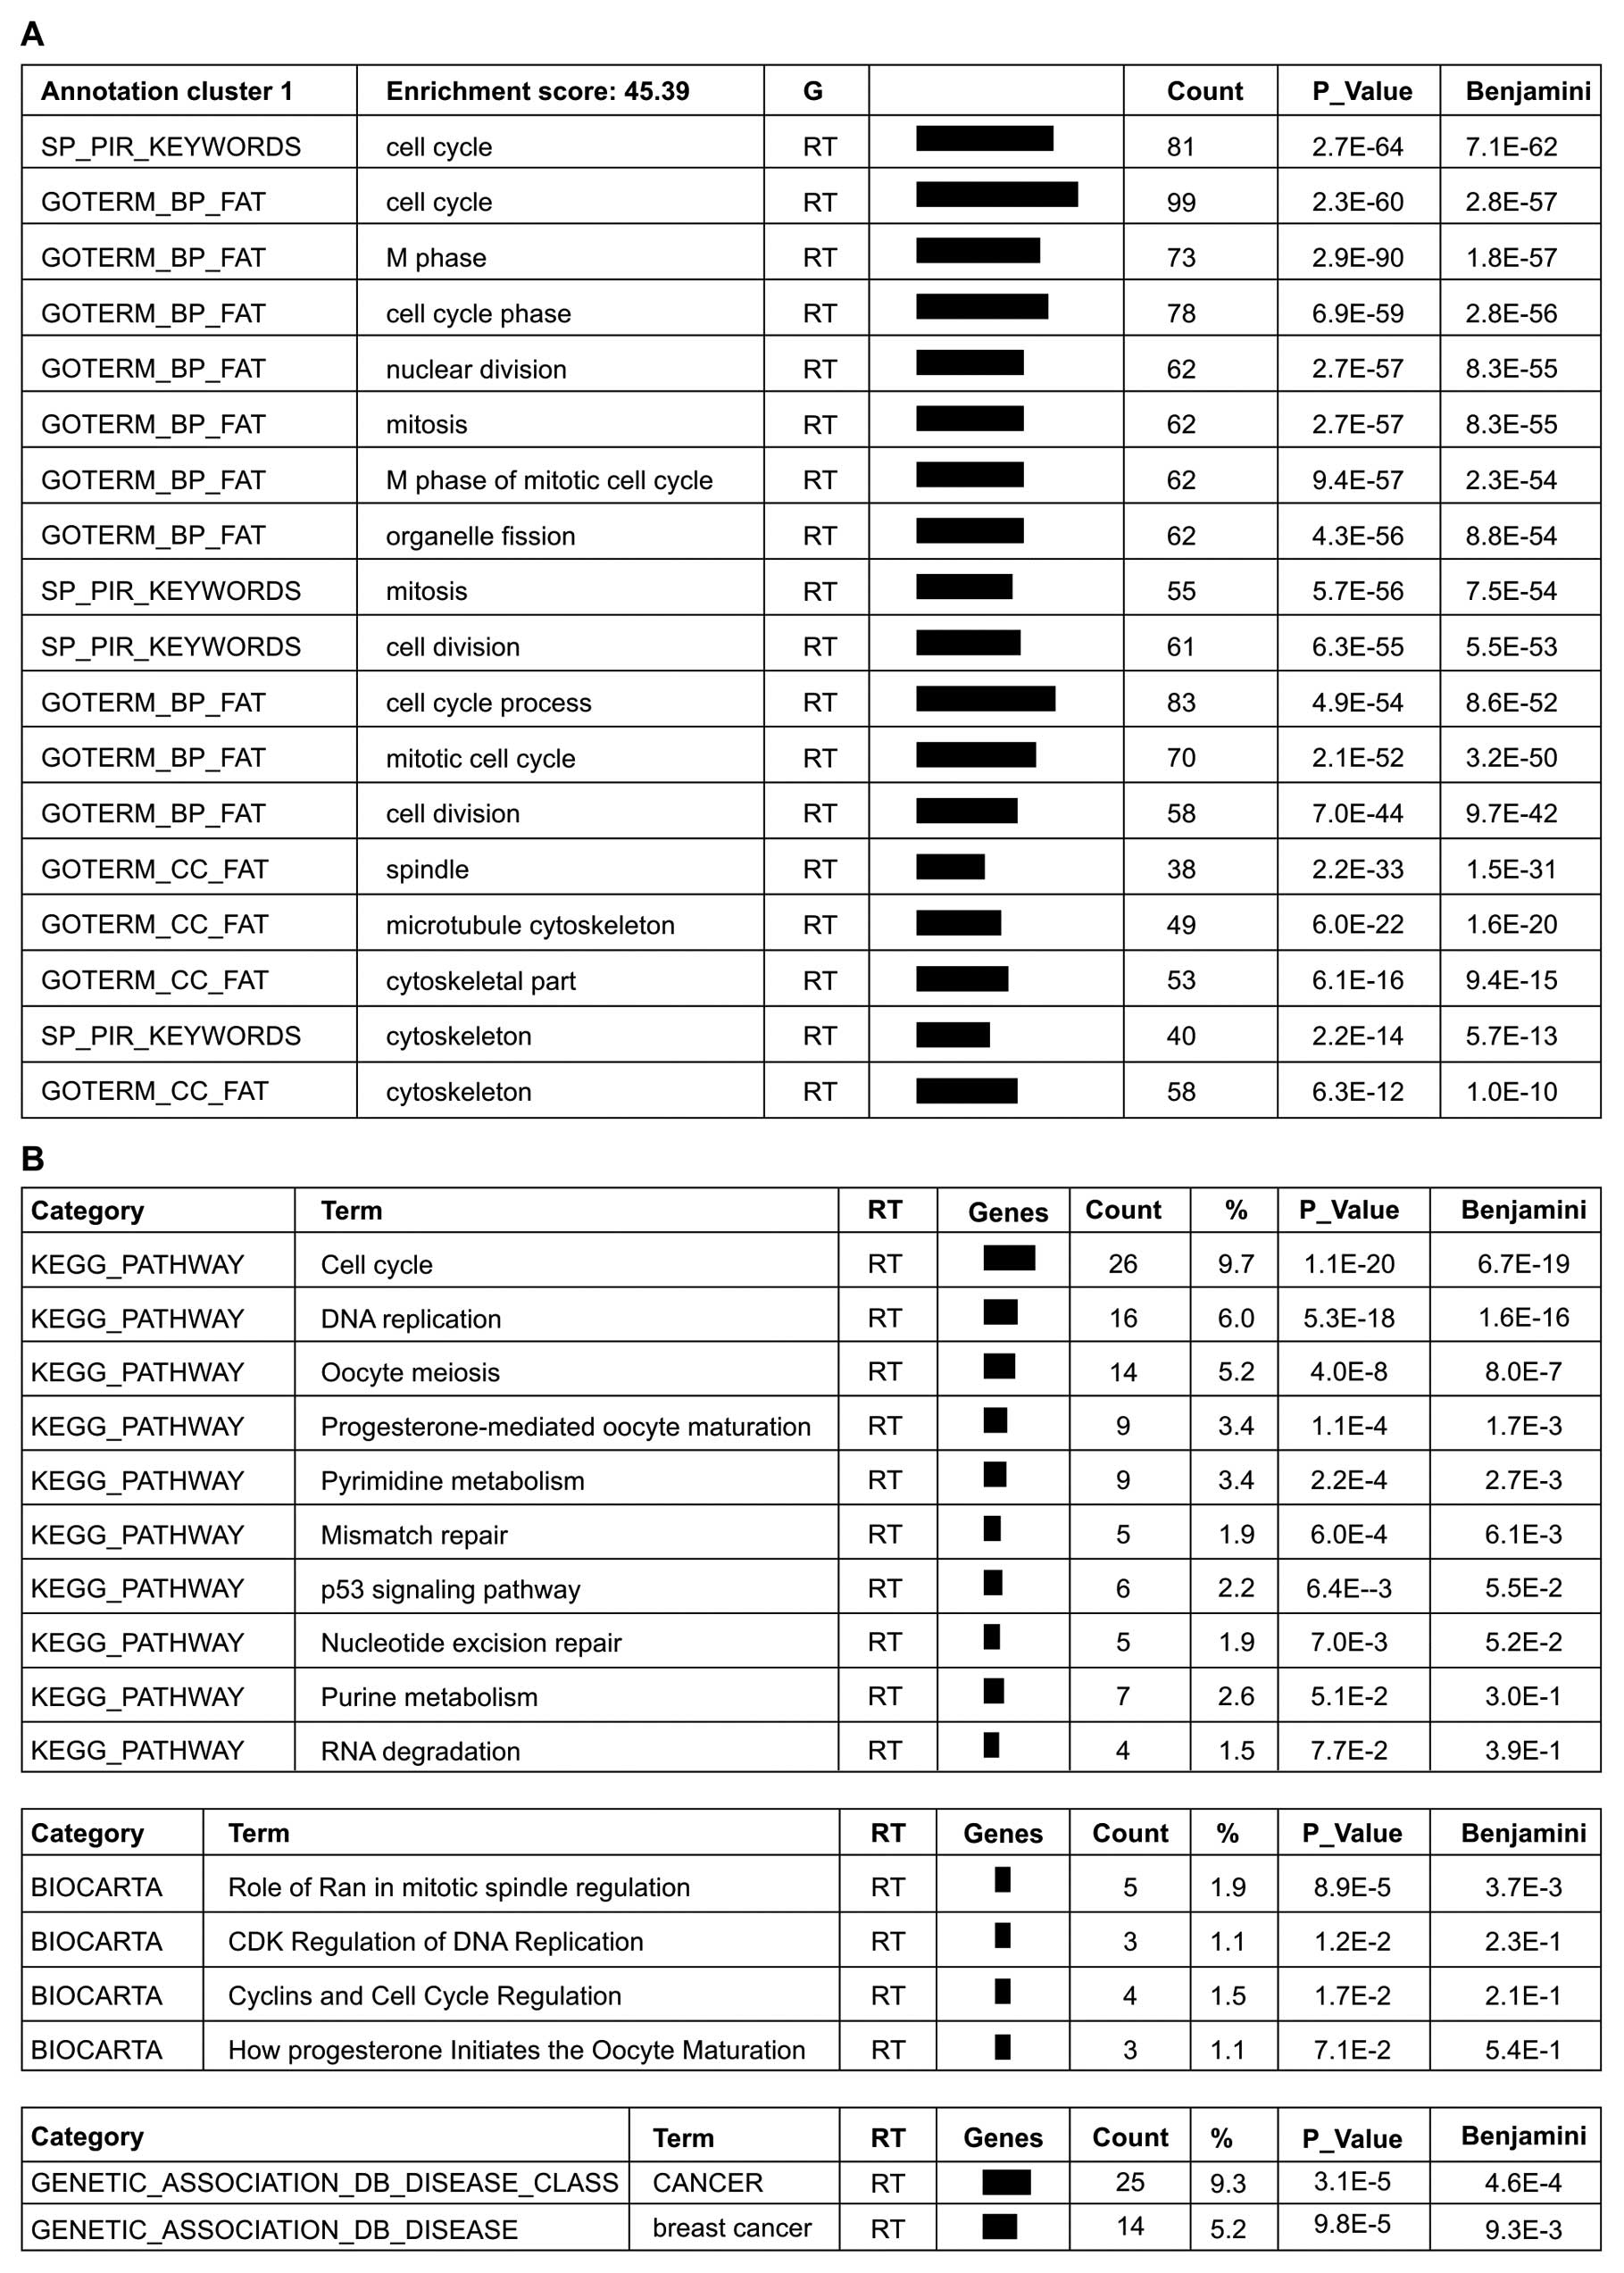
Analysis of the 354 genes downregulated by
>2-fold in the atorvastatin group compared with the DMSO group
using the DAVID functional annotation tool, revealed that the genes
in annotation cluster 1 with the highest enrichment were involved
in cell cycle regulation, cell division, microtubule cytoskeleton
formation and mitosis (Fig. 5A).
The BioCarta and KEGG pathways that were found to be significantly
impacted by atorvastatin treatment are involved in the signaling of
cancer and the regulation of the cell cycle and cell metabolism
(Fig. 5A). A comparison of the
DAVID and GSEA results indicated that the cell cycle regulation and
cyclin pathways were the most commonly affected pathways by
atorvastatin treatment, suggesting that the mechanism underlying
the anticancer pharmacological effect of atorvastatin is the
negative regulation of the cell cycle. In addition, the
gene-disease association indicated an association with cancer,
particularly breast cancer (Fig.
5B).
Analysis of the 295 genes upregulated by >2-fold
in the atorvastatin group compared with the DMSO group using the
DAVID functional annotation tool at a medium level of gene
functional classification stringency, revealed that the genes with
the highest enrichment were involved in the regulation of
transcription factors, specifically the Kruppel-like factors (KLFs)
2, 3, 4, 6, 7, 9 and 13. This finding of significant upregulation
of KLFs in the atorvastatin group compared with the DMSO group is
in accordance with recent in vitro and in vivo
research demonstrating that KLFs suppress tumor growth in certain
types of cancer (17,18).
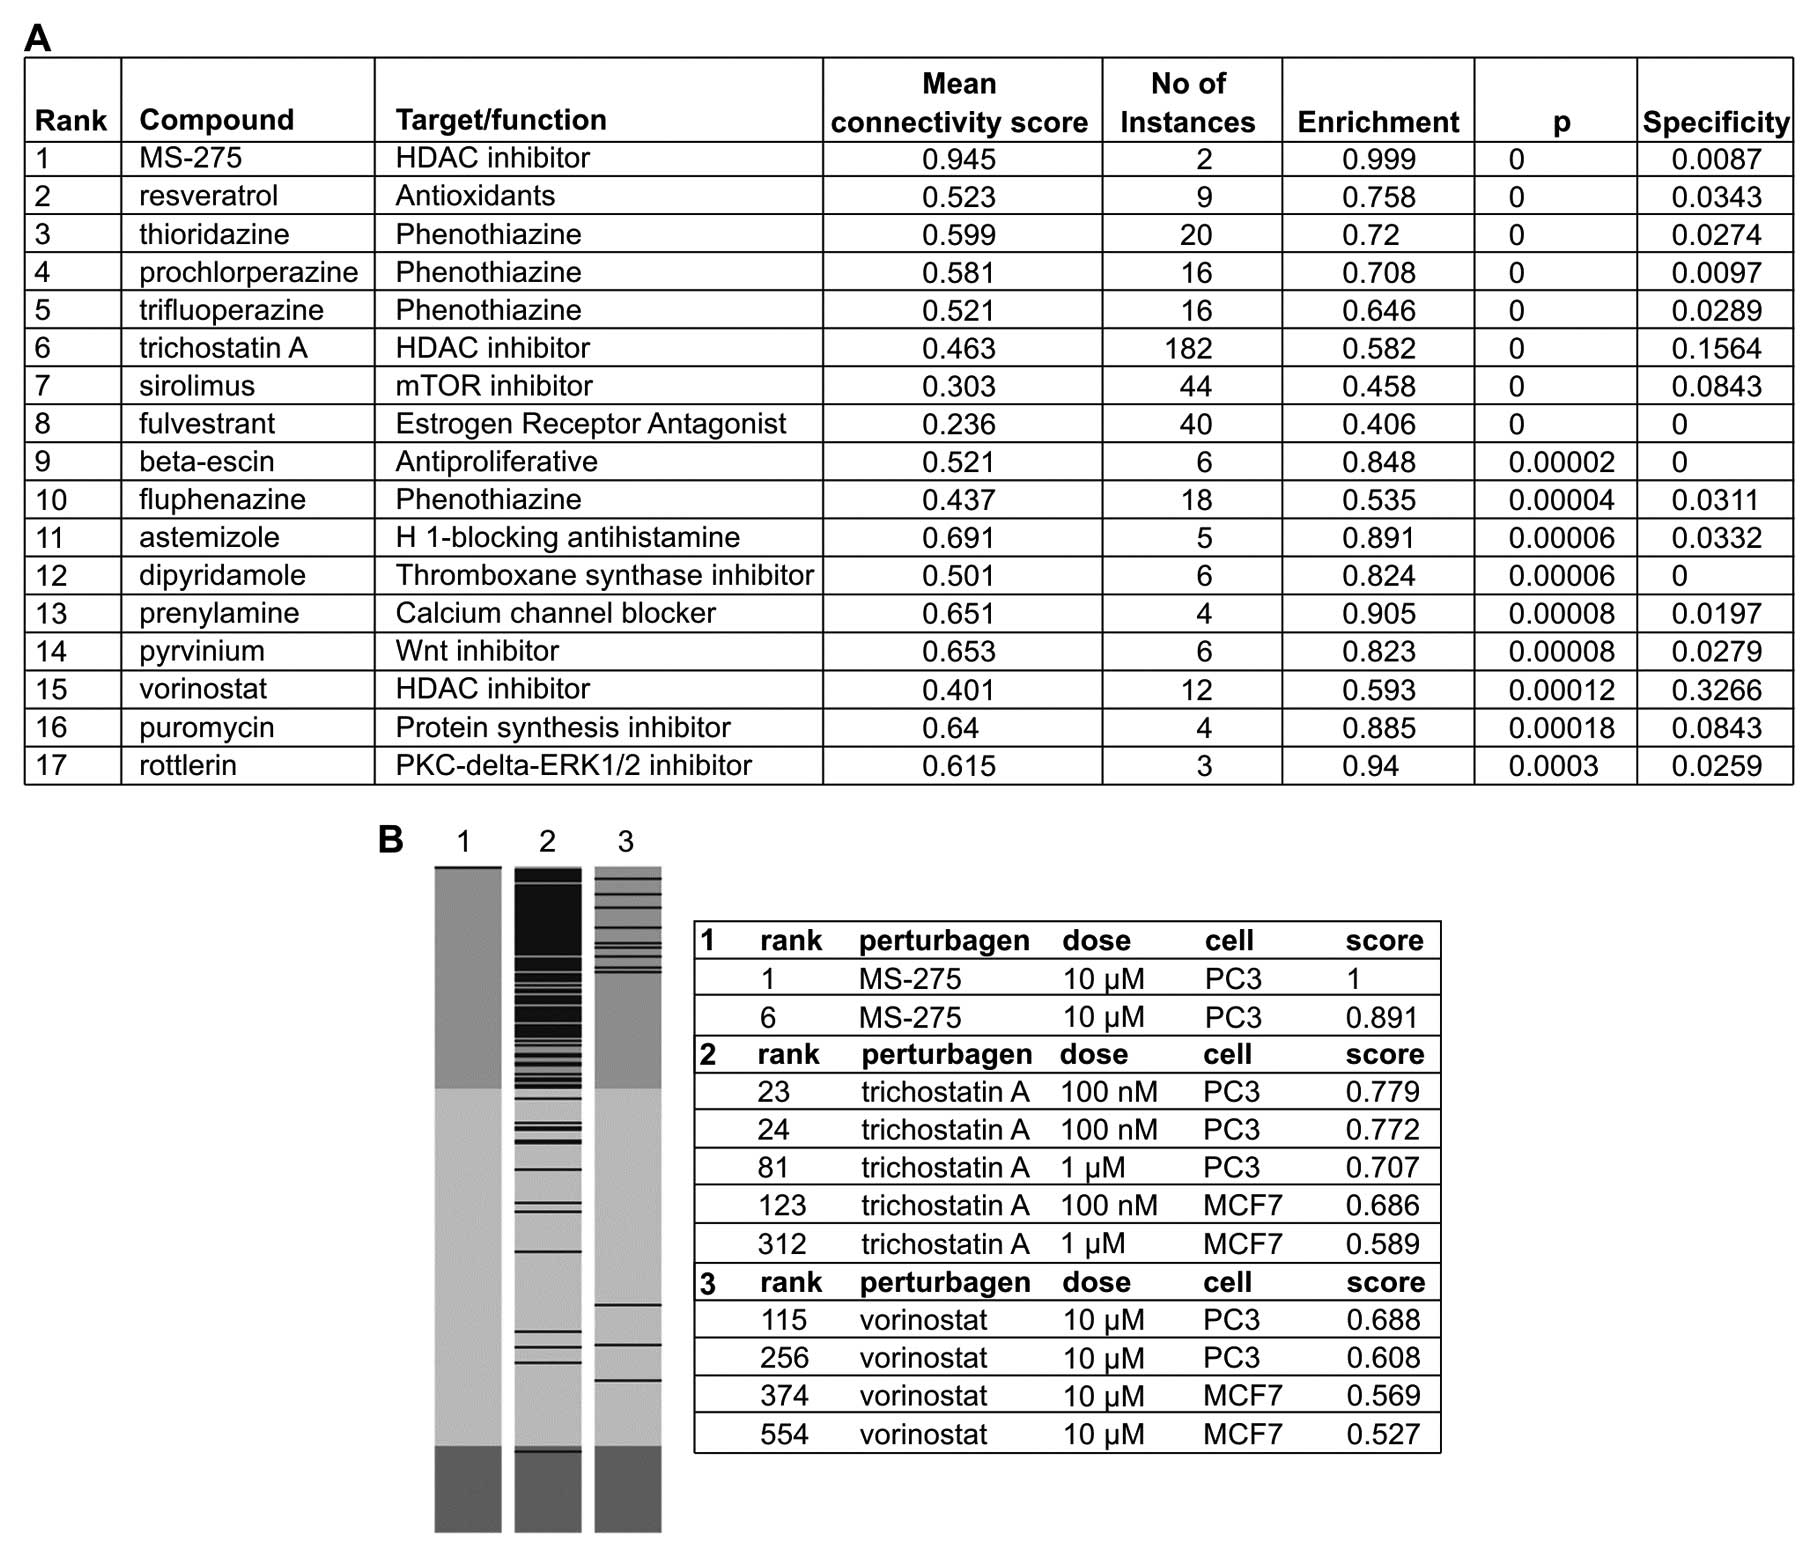
cMap analysis of related compounds
To identify related therapeutic compounds that may
exert an effect on the gene expression similar to that of
atorvastatin, gene expression analysis of 395 genes was performed,
155 of which were upregulated >2-fold and 240 of which were
downregulated >2-fold in the atorvastatin group compared with
the DMSO group. With the aim of identifying similar patterns in
gene expression changes that may explain functional connections
among drugs, genes, and diseases (19), 17 compounds whose profiles were
highly similar to those of atorvastatin (P<0.001) were
identified (Fig. 6A).
Interestingly, the profile of the histone deacetylase (HDAC)
inhibitor, MS-275, was mostly similar with the profiles of 2 other
HDAC inhibitors (trichostatin A and vorinostat), also highly
similar (Fig. 6B). In multiple
instances, the profiles of Wnt/mTOR/PKC-δ-ERK1/2 inhibitors,
resveratrol and protein synthesis inhibitors were also highly
similar to those of atorvastatin (Fig. 6A). Moreover, the results of cMap
analysis performed to examine the profiles of simvastatin and
lovastatin indicated that they positively correlated with the
profiles of trichostatin A and vorinostat, a result that accords
with that of a prior study that examined the chemical structure of
statins (20).
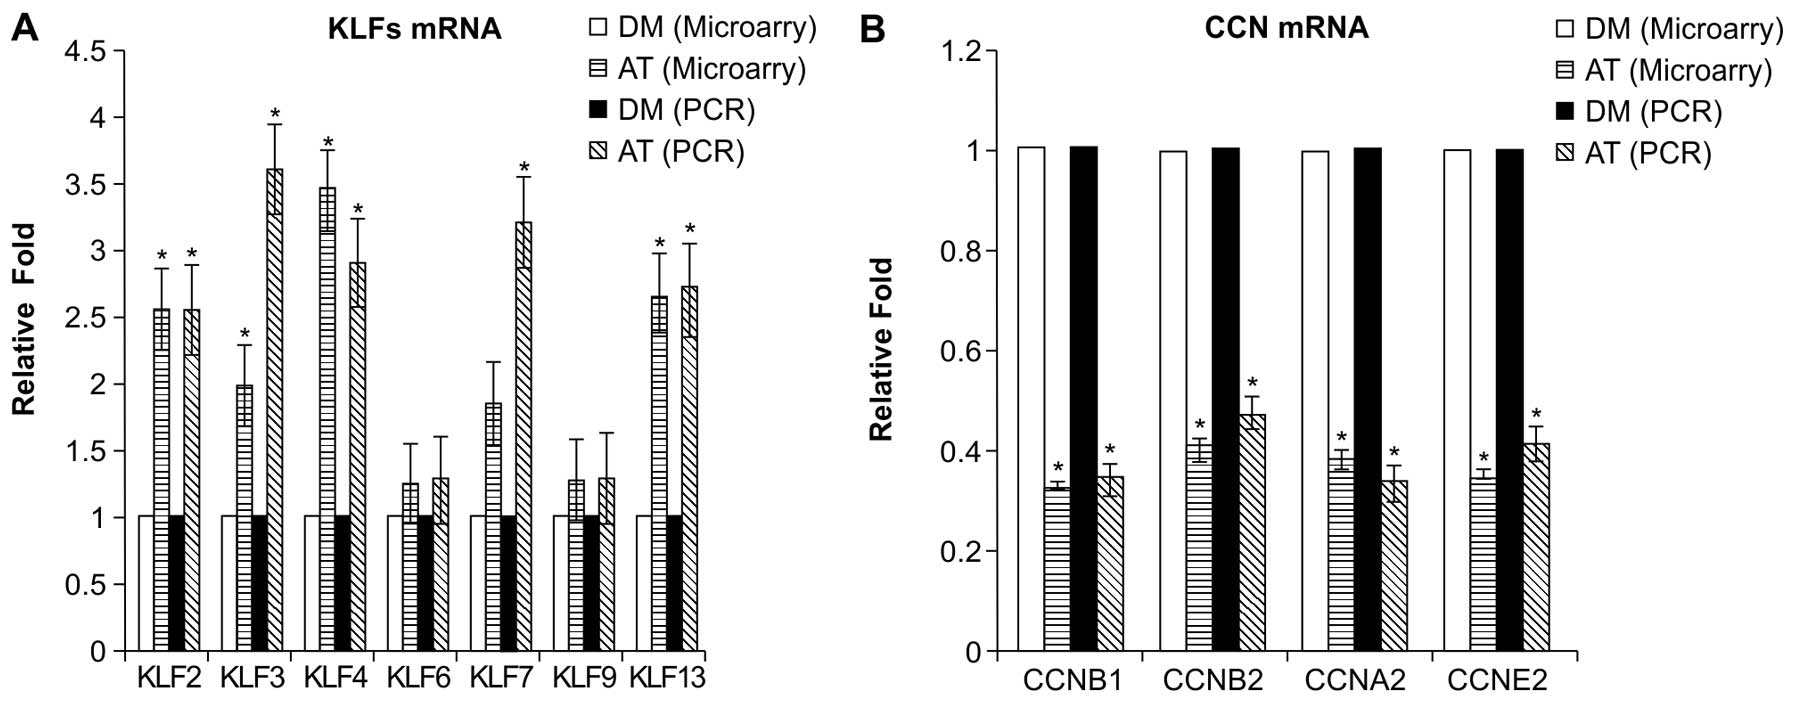
Validation of microarray gene expression
findings
The differential expression of 4 genes in the cell
cycle pathway and 7 transcription factor genes were validated by
quantitative RT-PCR on samples obtained from EA.hy926 cells that
had been treated with atorvastatin and DMSO in a separate
experiment. The selected genes were CCNB2, CCNB1, CCNA2 and CCNE2
and the selected transcription factors were KLFs 2, 3, 4, 6, 7, 9
and 13. Whereas the PCR results and the microarray analysis results
were concordant regarding the magnitude of the changes in the
expression of the genes examined (Fig. 7), the PCR results indicated that
the magnitude of the change in the expression of various
transcription factors (KLFs 2, 3, 4, 7 and 13) examined was greater
compared to the microarray analysis results.
Discussion
In recent years, statins have been widely prescribed
for middle- aged and elderly patients as part of a life-long
therapeutic regimen, calling for greater research into their safety
and toxicity. To date, most retrospective research has found no
statistically significant increase in the risk of cancer or
metastasis with statin use (21–23). Furthermore, laboratory analysis
has indicated that hydrophobic statins, such as simvastatin and
fluvastatin, but not hydrophilic pravastatin may inhibit the cancer
cell progression via alteration of the equilibrium between pro- and
anti-inflammatory cytokines (24)
or the downregulation of SATB1 (25) in colon cancer cells and the
inhibition of NFκB and Raf/MEK pathways in pancreatic cancer cells
(26).
While the results of population studies remain
controversial, the results of several clinical trials have
suggested that long-term use of statins may reduce the risk of
gastric cancer (27) and is
associated with less advanced tumor stage or lower frequency of
distant metastases in patients with colorectal cancer (28,29) or prostate cancer (30). However, the results of other
clinical trials and meta-analyses of these trials have indicated
that statin use does not prevent cancer (31–33), while the results of other trials
have suggested that statins have a dichotomous effect, being either
cancer-inhibiting or promoting in certain environments (6,34).
Several factors may account for the conflicting clinical results,
including the examination of different populations in different
studies, the use of relatively short-term follow-up periods, and
the use of a design in which the primary endpoint is not cancer
development.
As statins are widely prescribed worldwide for
increasingly longer periods, it is extremely important to
comprehensively examine the possible applications of statins in
cancer therapy. The results of recent in vitro studies,
which are relatively consistent, have indicated that statins may
exert an anticancer effect on cancer cells via multiple mechanisms.
As endothelial recruitment and endothelial interactions in the
tumor microenvironment are considered critical in tumorigenesis and
cancer metastasis (35),
examining the impact of statin therapy on endothelial cells may
reveal the anticancer mechanism of statins. To satisfy this
research requirement, the present study conducted DNA microarray
analysis and drug-induced genome-wide transcriptional mapping,
which is used to examine the action of drug targets and predict
adverse effects (36), of cell
samples taken from the endothelial cell line, EA.hy926.
The results of the microanalysis indicated that
treatment with 10 μM of atorvastatin induced the
upregulation or down-regulation of 649 genes by 2-fold compared to
treatment with DMSO, the control treatment. The results of gene
function annotation and pathway analyses using GSEA and the DAVID
functional annotation tool database were consistent, both
indicating that atorvastatin represses the expression of genes
enriched in cancer modules 397, 372, 485 and 438, which are
involved in DNA replication and microtubule cytoskeleton formation.
These genes, which include CDC6, CDC20, CDC7, CDC25A, CDC25C, CCNA2
and CCNE2, are essential in the control of the cell cycle at the
G1/S (start) and the G2/M (mitosis) transitions. These results
suggest that atorvastatin inhibits the endothelial cell cycle
through multiple targets and, since endothelial cells are widely
distributed in vivo, may play a role in tumor formation and
metastasis in many cancers. The results of PCR analysis, which was
performed to confirm the downregulation of genes involved in
regulation of the G1/S and G2/M transitions, such as CCNA2, CCNE2,
CCNB1 and CCNB2, are in agreement with the results of the
microarray analysis. Moreover, the results of both real-time PCR
and microarray analysis of the effect of atorvastatin on
transcription factors, which confirmed the reliability of the
GeneChip data, indicated that atorvastatin enhanced the expression
of several KLFs, which can both activate and repress genes that
participate in cell cycle regulation. Among the different KLFs,
KLFs 2, 4, 6, 9 and 10 have important tumor-suppressing functions
(37,38).
The cMap results indicated that the gene expression
signature of atorvastatin positively correlated with that of HDAC,
proteasome and Wnt inhibitors, and particularly with the gene
expression signatures of the HDAC inhibitors, MS-275, trichostatin
A and vorinostat, whose signatures were mostly similar to the
signature of atorvastatin. These results, which indicate that
atorvastatin may serve as an HDAC inhibitor in cancer therapy, are
supported by those of a previous study, which also performed
computational modeling, and found that the carboxylic acid moiety
of statins directly interacted with the catalytic site of HDAC2
and, in a subsequent assay, that statins inhibited HDAC2 activity,
indicating that they may exert an antitumor effect as HDAC
inhibitors (39). Although only
cancer cell lines are included in the cMap, the drug-induced gene
expression profiles have been found to be concordant across cell
lines, tissues and even organ systems, as signatures are often
conserved across diverse cell types and settings (13,36).
In conclusion, the results of this cell-based
microarray and bioinformatic analysis of atorvastatin and related
compounds using GSEA, the DAVID functional annotation tool, and the
cMap database provide great insights into the molecular mechanism
underlying the impact of atorvastatin therapy on endothelial cells
and the connection between regulatory pathways at different phases
of the cell cycle, all of which support the use of statins in
cancer therapy. Specifically, statins exert an antitumor effect by
promoting the upregulation of KLFs and the downregulation of cell
cycle-related genes, such as CCNA2, CCNE2, CCNB1 and CCNB2, which
inhibits both the G1/S and G2/M transitions and forms a network of
tumor suppressors. Detailed analysis of the differences in gene
expression between the atorvastatin and DMSO control groups
indicates that HDAC inhibitors may also exert a tumor-suppressive
effect, either when used synergistically with or as substitutes for
atorvastatin. These data may be further used to investigate the
anticancer mechanism of statins in cancer cells and animals.
Subsequent prospective clinical trials should be performed to
confirm the beneficial effects of statins in cancer therapy.
Acknowledgements
This study was supported by the
National Science and Technology Support Program (no.
2009BAI86B04).
References
|
1.
|
C SpampanatoS De MariaM
SarnataroSimvastatin inhibits cancer cell growth by inducing
apoptosis correlated to activation of Bax and down-regulation of
BCL-2 gene expressionInt J Oncol40935941201222134829
|
|
2.
|
RH SamsonDG NairInfluence and critique of
the JUPITER Trial (Statins v no statins for primary prevention of
cardiovascular events in patients with normal lipids and elevated
C-reactive protein)Semin Vasc
Surg24172179201110.1053/j.semvascsurg.2011.10.00522153029
|
|
3.
|
PM RidkerE DanielsonFA FonsecaRosuvastatin
to prevent vascular events in men and women with elevated
C-reactive proteinN Engl J
Med35921952207200810.1056/NEJMoa0807646
|
|
4.
|
AB RosseboTR PedersenK BomanIntensive
lipid lowering with simvastatin and ezetimibe in aortic stenosisN
Engl J Med35913431356200810.1056/NEJMoa080460218765433
|
|
5.
|
C MarelliC GunnarssonS RossStatins and
risk of cancer: a retrospective cohort analysis of 45,857 matched
pairs from an electronic medical records database of 11 million
adult AmericansJ Am Coll
Cardiol58530537201110.1016/j.jacc.2011.04.01521777752
|
|
6.
|
ZY ChenS RexCC TsengKruppel-like factor 4
is transactivated by butyrate in colon cancer cellsJ
Nutr134792798200415051827
|
|
7.
|
MS SimonCA RosenbergRJ
RodaboughProspective analysis of association between use of statins
or other lipid-lowering agents and colorectal cancer riskAnn
Epidemiol221727201210.1016/j.annepidem.2011.10.00622056480
|
|
8.
|
YC YangWF HuangLM ChuanIn vitro and in
vivo study of cell growth inhibition of simvastatin on chronic
myelogenous leukemia
cellsChemotherapy54438446200810.1159/00015866318824851
|
|
9.
|
K GauthamanCY FongA BongsoStatins, stem
cells, and cancerJ Cell
Biochem106975983200910.1002/jcb.2209219224538
|
|
10.
|
M UpretiNA KoonceL HenningsTC ChambersRJ
GriffinPegylated IFN-alpha sensitizes melanoma cells to
chemotherapy and causes premature senescence in endothelial cells
by IRF-1 mediated signalingCell Death
Dis1e67201010.1038/cddis.2010.4321197417
|
|
11.
|
A SubramanianP TamayoVK MoothaGene set
enrichment analysis: a knowledge-based approach for interpreting
genome-wide expression profilesProc Natl Acad Sci
USA1021554515550200510.1073/pnas.050658010216199517
|
|
12.
|
National Institute of Allergy and
Infectious DiseasesDAVID Bioinformatics Resources 6.7. http://david.abcc.ncifcrf.gov. Accessed January 13,
2012
|
|
13.
|
J LambED CrawfordD PeckThe Connectivity
Map: using gene-expression signatures to connect small molecules,
genes, and diseaseScience31319291935200610.1126/science.1132939
|
|
14.
|
Broadband InstituteMolecular Signatures
Database http://www.broadinstitute.org/gsea/msigdb/indexjsp.
Accessed January 13, 2012
|
|
15.
|
Broadband InstituteMap C. www.broadinstitute.org/cmap. Accessed January 13,
2012.
|
|
16.
|
Stanford UniversityIndex of cancer
modules. http://robotics.stanford.edu/~erans/cancer/modules.
Accessed January 13, 2012
|
|
17.
|
H TaniguchiFV JacintoA VillanuevaSilencing
of Kruppel-like factor 2 by the histone methyltransferase EZH2 in
human cancerOncogene3119881994201210.1038/onc.2011.38721892211
|
|
18.
|
JL YoriDD SeachristE JohnsonKruppel-like
factor 4 inhibits tumorigenic progression and metastasis in a mouse
model of breast cancerNeoplasia13601610201121750654
|
|
19.
|
M ZimmerJ LambBL EbertThe connectivity map
links iron regulatory protein-1-mediated inhibition of
hypoxia-inducible factor-2a translation to the anti-inflammatory
15-deoxy-delta12,14-prostaglandin J2Cancer
Res7030713079201010.1158/0008-5472.CAN-09-287720354189
|
|
20.
|
YC LinJH LinCW ChouYF ChangSH YehCC
ChenStatins increase p21 through inhibition of histone deacetylase
activity and release of promoter-associated HDAC1/2Cancer
Res6823752383200810.1158/0008-5472.CAN-07-580718381445
|
|
21.
|
K PandyaD DonzeTM TownesNovel
transactivation domain in erythroid Kruppel-like factor (EKLF)J
Biol Chem27682398243200110.1074/jbc.M00845720011092887
|
|
22.
|
AP FunnellCA MaloneyLJ ThompsonErythroid
Kruppel-like factor directly activates the basic Kruppel-like
factor gene in erythroid cellsMol Cell
Biol2727772790200710.1128/MCB.01658-0617283065
|
|
23.
|
B HuangYT AhnL McPhersonC ClaybergerAM
KrenskyInteraction of PRP4 with Kruppel-like factor 13 regulates
CCL5 transcriptionJ
Immunol17870817087200710.4049/jimmunol.178.11.708117513757
|
|
24.
|
E O’GradyH MulcahyC AdamsJP MorrisseyF
O’GaraManipulation of host Kruppel-like factor (KLF) function by
exotoxins from diverse bacterial pathogensNat Rev
Microbiol5337341200717435789
|
|
25.
|
S FischS GrayS HeymansKruppel-like factor
15 is a regulator of cardiomyocyte hypertrophyProc Natl Acad Sci
USA10470747079200710.1073/pnas.070198110417438289
|
|
26.
|
AM PilonDG NilsonD ZhouAlterations in
expression and chromatin configuration of the alpha
hemoglobin-stabilizing protein gene in erythroid Kruppel-like
factor-deficient miceMol Cell
Biol2643684377200610.1128/MCB.02216-0516705186
|
|
27.
|
SP WangHJ ZhouXP ChenLoss of expression of
Kruppel-like factor 6 in primary hepatocellular carcinoma and
hepatoma cell linesJ Exp Clin Cancer Res26117124200717550140
|
|
28.
|
S ChanchevalapMO NandanBB
McConnellKruppel-like factor 5 is an important mediator for
lipopolysaccharide-induced proinflammatory response in intestinal
epithelial cellsNucleic Acids
Res3412161223200610.1093/nar/gkl014
|
|
29.
|
S MukaiT HiyamaS TanakaM YoshiharaK
ArihiroK ChayamaInvolvement of Kruppel-like factor 6 (KLF6)
mutation in the development of nonpolypoid colorectal
carcinomaWorld J
Gastroenterol1339323938200710.3748/wjg.v13.i29.393217663506
|
|
30.
|
MC VelardeZ ZengJR McQuownFA SimmenRC
SimmenKruppel-like factor 9 is a negative regulator of
ligand-dependent estrogen receptor alpha signaling in Ishikawa
endometrial adenocarcinoma cellsMol
Endocrinol2129883001200710.1210/me.2007-0242
|
|
31.
|
ZY ChenX WangY ZhouG OffnerCC
TsengDestabilization of Kruppel-like factor 4 protein in response
to serum stimulation involves the ubiquitin-proteasome
pathwayCancer
Res651039410400200510.1158/0008-5472.CAN-05-205916288030
|
|
32.
|
XL ZhangD ZhangFJ MichelJL BlumFA SimmenRC
SimmenSelective interactions of Kruppel-like factor 9/basic
transcription element-binding protein with progesterone receptor
isoforms A and B determine transcriptional activity of
progesterone-responsive genes in endometrial epithelial cellsJ Biol
Chem2782147421482200310.1074/jbc.M212098200
|
|
33.
|
JL ShieZY ChenMJ O’BrienRG PestellME LeeCC
TsengRole of gut-enriched Kruppel-like factor in colonic cell
growth and differentiationAm J Physiol Gastrointest Liver
Physiol279G806G814200011005769
|
|
34.
|
AM GhalebBB McConnellMO NandanJP KatzKH
KaestnerVW YangHaploinsufficiency of Kruppel-like factor 4 promotes
adenomatous polyposis coli dependent intestinal tumorigenesisCancer
Res6771477154200710.1158/0008-5472.CAN-07-130217671182
|
|
35.
|
SL SchoberCT KuoKS SchlunsL LefrancoisJM
LeidenSC JamesonExpression of the transcription factor lung
Kruppel-like factor is regulated by cytokines and correlates with
survival of memory T cells in vitro and in vivoJ
Immunol16336623667199910490960
|
|
36.
|
M IskarM CampillosM KuhnLJ JensenV van
NoortP BorkDrug-induced regulation of target expressionPLoS Comput
Biol6e1000925201010.1371/journal.pcbi.1000925
|
|
37.
|
H GuanL XieF LeithauserKLF4 is a tumor
suppressor in B-cell non-Hodgkin lymphoma and in classic Hodgkin
lymphomaBlood11614691478201010.1182/blood-2009-12-25644620519630
|
|
38.
|
C BureauN HanounJ TorrisaniJP VinelL
BuscailP CordelierExpression and Function of Kruppel Like-Factors
(KLF) in CarcinogenesisCurr
Genomics10353360200910.2174/13892020978892101020119532
|
|
39.
|
E ChnariJS NikitczukKE UhrichPV
MogheNanoscale anionic macromolecules can inhibit cellular uptake
of differentially oxidized
LDLBiomacromolecules7597603200610.1021/bm050690516471936
|