Introduction
Ulcerative colitis (UC), a type of inflammatory
bowel disease (IBD), is a complex clinical entity in which genetic,
environmental and microbial factors interact to determine the
susceptibility response of immune and non-immune cellular systems
mediating inflammation (1–3).
Although the precise mechanisms of pathogenesis remain unclear,
studies using radiolabeled leukocytes (4) or immunohistochemical techniques
(5) have revealed evidence of the
recruitment of circulating leukocytes to the affected bowel. During
active disease, newly migrated leukocytes from the circulation may
be exposed to bacteria in the gut lumen, which may further activate
these cells and result in severe mucosal damage. The removal of
circulating leukocytes was therefore speculated to be an attractive
approach for treating UC.
Trials of therapeutic leukofiltration from the
peripheral circulation, otherwise known as leukocytapheresis
(LCAP), have been performed using a veno-venous extracorporeal
apheresis device coupled to a leukofiltration device (6,7).
In several trials, LCAP appeared to attenuate inflammation in
patients with UC (8–11) as well as patients with Crohn's
disease (12), rheumatoid
arthritis (13,14) and rapidly progressive
glomerulonephritis (15), without
provoking severe complications. Summarizing the results of previous
clinical reports, Ortolano et al (8) concluded that 76% of 115 patients
with IBD who were treated using LCAP entered remission, obviating
the need for ongoing corticosteroid or cytoablative support.
However, the mechanisms underlying these therapeutic effects have
not been fully clarified.
As a breakthrough technology in the development of
modern functional research in the field of human genome-based
science, complementary DNA (cDNA) microarrays have become a
powerful and sensitive technique that can be broadly applied to
both basic and clinical research. This method makes it practical to
quantitatively and simultaneously measure the expression levels of
a large number of genes and has been successfully used to observe
alterations and variations in gene expression in a variety of cells
and tissues. In three previous studies, gene expression in IBD
tissue, either from patients with UC or Crohn's disease, was
compared with that in non-inflamed or inflamed control tissue using
cDNA microarrays (16–18). These experiments resulted in the
identification of a large number of genes that are differentially
expressed in the mucosa of patients with IBD, including genes that
have been previously associated with IBD as well as candidate genes
that have not been previously associated with IBD (16).
In the present study, we used cDNA microarrays to
investigate, for the first time, the global gene expression
profiles of whole blood cells from patients with UC who had
received LCAP. Our results suggest a basis for the molecular
mechanisms leading to the therapeutic effects of LCAP and indicate
new therapeutic targets, providing important prognostic
information.
Materials and methods
Characteristics of subjects
The characteristics of the normal subjects and
patients examined in this study are shown in Table I. Six patients with active UC were
enrolled (3 men, 3 women; mean age, 27.5 years; mean disease
duration, 6.2 years). Patients had either left-sided colitis (n=3)
or pancolitis (n=3) and were classified into the moderate (n=3) or
severe (n=3) attack categories, according to the Truelove and Witts
criteria (19). All patients
received standard medical therapy with aminosalicylates and/or
corticosteroids. Patients with any of the following features were
excluded from the study: an age <18 or >80 years, a serum
hemoglobin <8 g/dl, a total leukocyte count <4,000/μl, or
coagulation abnormalities, bleeding diathesis, pregnancy or
unsuitable peripheral venous access for apheresis. The apheresis
procedure was well tolerated by all the patients. No severe
complications occurred during the procedure. Informed consent was
obtained from all the patients prior to undergoing LCAP. Blood
samples from age- and gender-matched healthy volunteers were
examined as normal controls.
 | Table ICharacteristics of the UC patients
providing samples for the cDNA microarray assay. |
Table I
Characteristics of the UC patients
providing samples for the cDNA microarray assay.
| | | | | Concomitant
medications (mg/day) |
|---|
| | | | |
|
|---|
| Patient no. | Age (years)/
gender | Disease duration
(years) | Disease extent | Disease
activitya | Prednisolone | 5-Aminosalicylic
acid |
|---|
| 1 | 18/F | 0.3 | Entire colon | Severe | 40 | 2000 |
| 2 | 22/M | 1 | Left-side
colon | Severe | 10 | 1250 |
| 3 | 23/F | 7 | Left-side
colon | Moderate | 10 | 2250 |
| 4 | 25/M | 5 | Entire colon | Moderate | 15 | 2250 |
| 5 | 31/F | 9 | Left-side
colon | Severe | 30 | 2250 |
| 6 | 46/M | 15 | Entire colon | Moderate | 5 | 2250 |
LCAP procedure
LCAP was performed using a Cellsorba E column (Asahi
Kasei Medical, Tokyo, Japan) installed in the extracorporeal
circulation system (Plasauto LC; Asahi Kasei Medical) (6,7).
For apheresis, venous access was secured via two large peripheral
veins, and the blood was anticoagulated with nafamostat mesilate
(Torii Pharmaceutical, Tokyo, Japan), a protease inhibitor that
inhibits the activity of coagulation factors and platelet
aggregation (6,7,9–15).
Heparin was not used, since its use has been associated with
respiratory distress and palpitations (20). With a flow rate of 30–50 ml/min
for 60 min, a total of ~3 liters of blood was treated during each
session. In principle, the LCAP procedure was carried out weekly
for 5 weeks.
Preparation of RNA from blood
Samples (2.5 ml ×2) of whole blood were drawn into
PAXgene Blood RNA tubes (Qiagen, Hilden, Germany), and total RNA
was extracted and purified according to the manufacturer's
instructions. The quantity of RNA obtained from the extraction step
was assessed using a NanoDrop ND-1000 instrument (NanoDrop
Technologies, Wilmington, DE). The quality of the extracted RNA was
determined using a Bioanalyser 2100 (Agilent Technologies, Palo
Alto, CA, USA). A ribosomal RNA 28S/18S ratio above 1.3 was
verified for all experiments.
Preparation of the cDNA microarray
We designed and prepared a low-density cDNA
microarray for mRNA expression profiling in whole blood. Genes for
this microarray were selected from the public database of SAGE
results (http://133.11.248.12/; homepage of
Department of Molecular Preventative Medicine, School of Medicine,
University of Tokyo) prepared from activated blood cells, such as T
cells, dendritic cells, monocytes, and macrophages (21–24). As described previously (24), a total of 776 genes were spotted
onto SuperAmine (Telechem International, Sunnyvale, CA, USA) in
quadruplicate, along with positive and negative control genes. For
most of the genes, each cDNA was designed to be ~500 to 600 bp and
to be within ~1 kb from the 3′-poly(A) tail. In addition, all cDNAs
for the microarray probe were cloned into the pGEM vector (Promega,
Madison, WI, USA). All clones for the capture probe were sequenced
and validated by comparison with the GenBank sequence. In some
cases, the 776 genes were divided into 20 groups based on their
functional relatedness: lymphokine/cytokine/chemokine-related, cell
surface antigen/immune response-related, kinase/kinase
inhibitor-related, apoptosis/stress-related,
matrix-related/membrane-bound-related, metal-related,
oncogene/suppressor-related, cell cycle/transcription
factor-related, DNA/RNA-binding protein-related,
energy/metabolism-related, drug metabolism-related,
protease-related, serum protein/anti-coagulation-related,
proteasome-related, autoimmune system-related, general
enzyme-related, receptor-related, ribosomal protein-related,
miscellaneous, and control, according to the Atlas cDNA Expression
Arrays (Clontech Laboratories, Palo Alto, CA, USA).
Reference RNA
Reference RNA was established from a mixture of
whole blood (drawn into PAXgene tubes) samples obtained from
healthy volunteers. The extracted total RNA, which was certified to
be of sufficient quality using the Agilent RNA chip, was amplified
using the MessageAmp aRNA kit (Ambion, Austin, TX, USA) to generate
amplified RNA (aRNA). External non-human artificial RNA (C.
elegans Y49G5B fragment) was spiked into the reference aRNA to
distinguish it from the sample aRNA.
Preparation of sample RNA, labeling,
hybridization and scanning
Total RNA (1 mg) from subjects was transcribed and
amplified into aRNA using the MessageAmp aRNA kit, according to the
manufacturer's instructions. Next, an external control RNA mixture
[λ DNA (LD)], the baculovirus glycoprotein gene (GP), and the
Renilla luciferase gene (RL); 9 mg each) were added to both
the sample and reference aRNAs. The sample and reference aRNAs were
then labeled with Cy5-dUTP and Cy3-dUTP (Perkin-Elmer, Boston, MA),
respectively, using a SuperScript II kit (Invitrogen, Carlsbad, CA,
USA) together with random hexamers (Takara, Kyoto, Japan).
Competitive hybridization of the Cy3-labeled reference and the
Cy5-labeled sample cDNAs on the microarray was carried out using a
chamber system (Agilent Technologies), according to the method
described by Khodursky et al (25). Slides were scanned five times at
five different power ranges using a ScanArray 5000 (Perkin-Elmer).
For further statistical analysis, the data was converted from tiff
image data to signals using ImaGene software (Biodiscovery, Inc.,
El Segundo, CA, USA). The data files for the five scans were merged
to establish a single representative data set for each gene
(subject pending PCT/JP03/06677). The Cy5 (subject sample)/Cy3
(reference sample) ratio for each mRNA signal was calculated using
global Lowess normalization (26).
Statistical analysis
The statistical analysis was performed using a
t-test or paired t-test. Results were expressed as the mean and SD.
P-values of <0.05 were considered to indicate a statistically
significant result.
Results
Peripheral white blood cell count
Table II shows
the peripheral white blood cell count in the six normal subjects
and the six UC patients before and after LCAP. The absolute number
and proportion of leukocyte subsets were similar between the UC
patients and the normal subjects. Interestingly, the proportion of
neutrophils increased and the proportion of lymphocytes and
monocytes decreased in UC patients after LCAP.
| Table IICell counts in the peripheral blood
of the normal subjects and the patients with ulcerative
colitis. |
Table II
Cell counts in the peripheral blood
of the normal subjects and the patients with ulcerative
colitis.
| | | Ulcerative colitis
(n=6) |
|---|
| | |
|
|---|
| | Normal subjects
(n=6) | Before LCAP | After LCAP |
|---|
| Leukocytes | (/μl) | 5283±987 | 5900±1173 | 8550±4142 |
| Neutrophils | (/μl) | 3093±1067 | 3780±1708 | 6970±4392d |
| (%) | 57.3±12.0 | 61.8±17.9 | 78.2±11.2a,d |
| Eosinophils | (/μl) | 123±54 | 172±182 | 124±112 |
| (%) | 2.4±1.2 | 3.5±4.1 | 2.1±2.0 |
| Basophils | (/μl) | 59±47 | 36±40 | 41±65 |
| (%) | 1.2±1.1 | 0.7±0.7 | 0.4±0.5 |
| Lymphocytes | (/μl) | 1760±601 | 1608±550 | 1285±553 |
| (%) | 34.3±11.8 | 28.7±11.8 | 17.8±9.4a,d |
| Monocytes | (/μl) | 240±120 | 292±193 | 123±78 |
| (%) | 4.6±2.1 | 5.2±3.4 | 1.5±1.1a,d |
| Platelets |
(104/μl) | 19±4 | 30±11a | 16±5e |
| Erythrocytes |
(104/μl) | 479±21 | 378±52b | 330±41c,e |
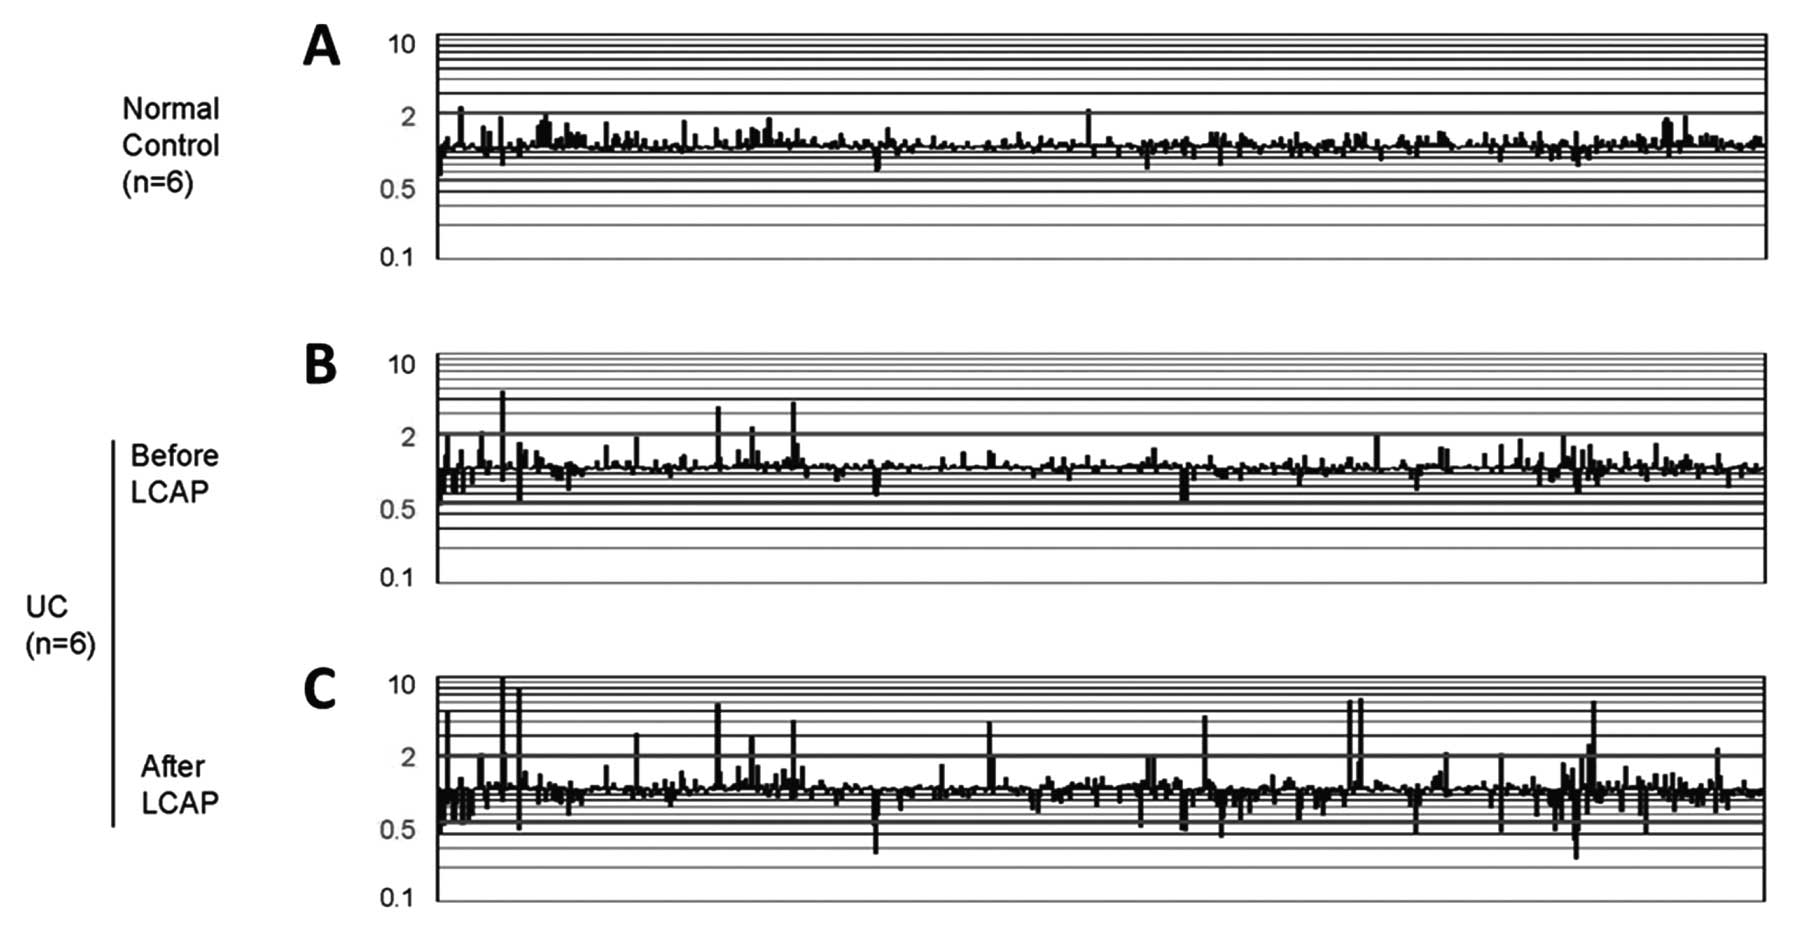
Overall gene expression profiles
The cDNA microarray analyses of whole blood cells
from normal subjects, UC patients before LCAP, and the same UC
patients after treatment repeatedly showed heterogeneous signals
(Fig. 1). Two genes were uniquely
upregulated by >2-fold and no genes were uniquely downregulated
by >2-fold in normal subjects, whereas five genes were uniquely
upregulated and two genes were uniquely downregulated in UC
patients before LCAP, and 19 genes were uniquely upregulated and 18
genes were uniquely downregulated after LCAP.
Gene expression profiles
UC patients vs. normal subjects
Fig. 2A shows the
gene expression profiles of whole blood cells from UC patients vs.
those from normal subjects. The genes that were upregulated by
>2-fold in the UC patients are summarized in Table III. These genes include
galactoside-binding 3 (galectin 3), immunoglobulin heavy constant
γ3, human mRNA for calcium-binding protein in macrophages (MRP-14),
γ-G globin (HBG2), and interleukin-1 receptor type II (IL-1R2). In
contrast, none of the genes were downregulated by >2-fold in the
UC patients. Fig. 2B shows the
expression profiles of the genes based on their functional
classifications. Compared with normal subjects, gene expression in
a variety of functional groups was altered in patients with UC.
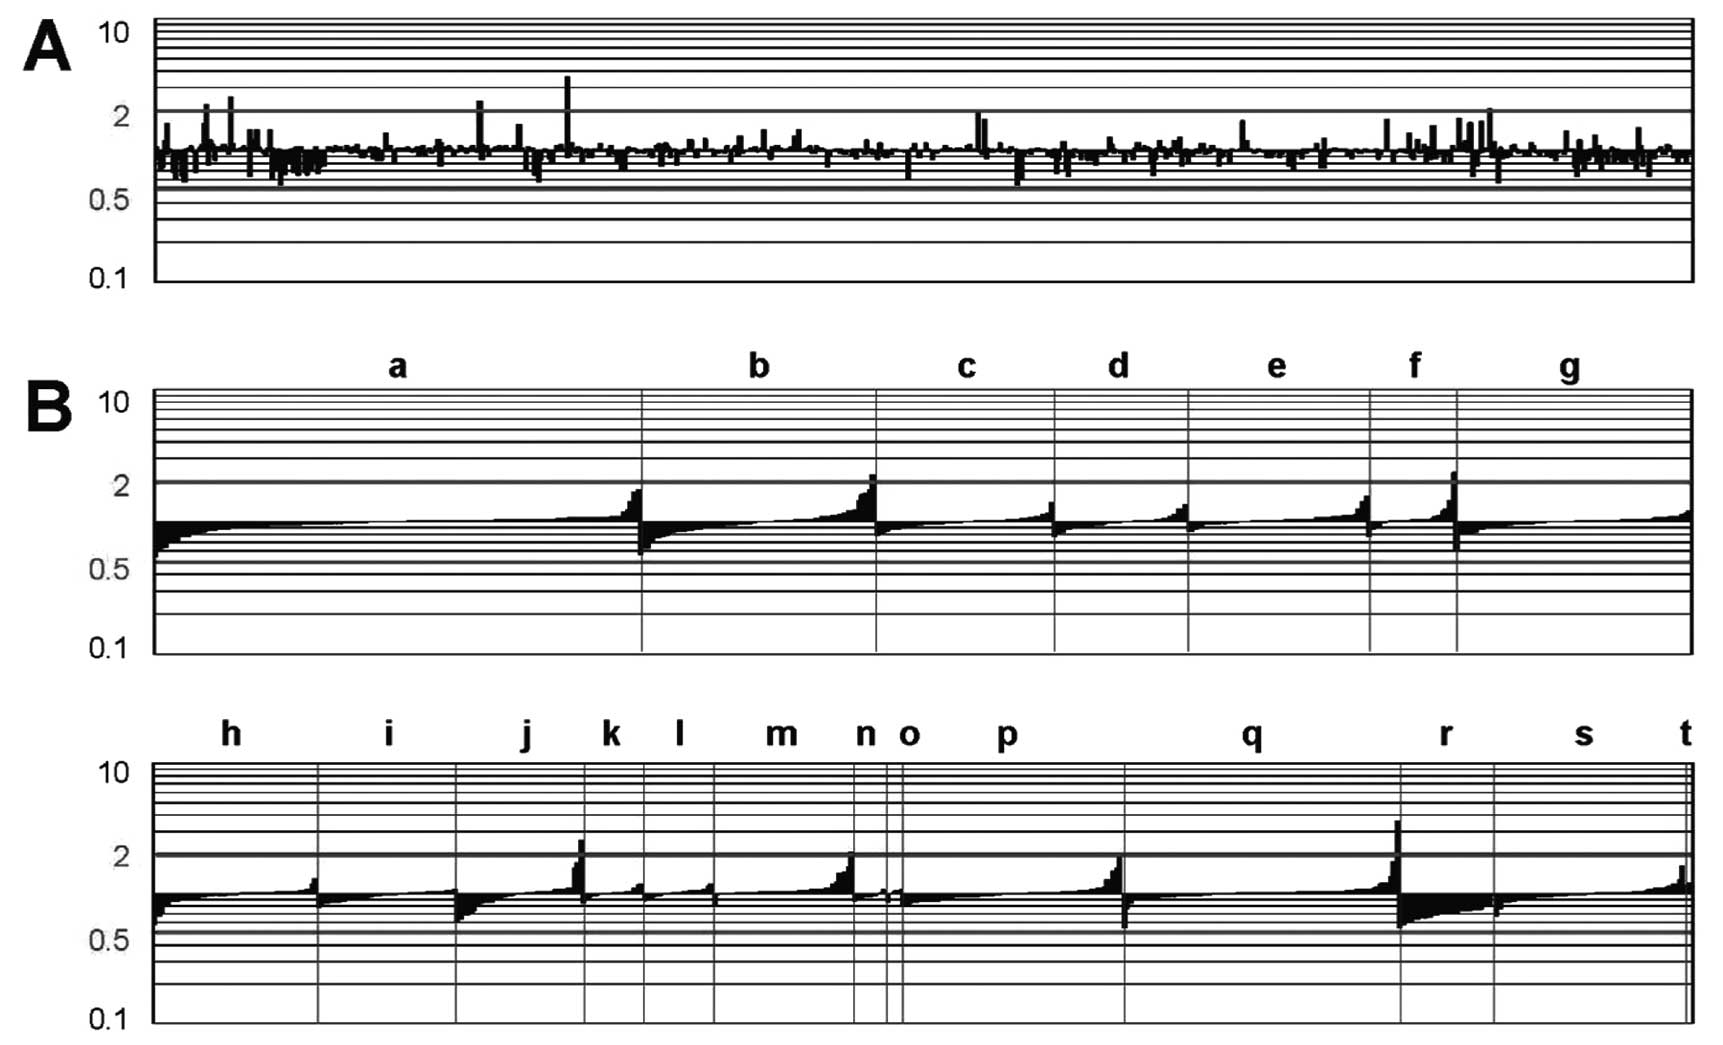 | Figure 2Gene expression profiles in UC
patients, compared with normal subjects. The vertical bars indicate
an increase or decrease in gene expression in patients with UC,
compared with gene expression in control subjects, at a 2-fold
level of the Cy5/Cy3 ratio of the UC sample divided by the Cy5/Cy3
ratio of the normal sample. ‘Downregulated’ designates genes that
are downregulated, compared with the control profile, at a 2-fold
level; ‘upregulated’ indicates genes that are upregulated, compared
with the control profile, at a 2-fold level. ‘No significant
change’ indicates genes that are expressed within the 2-fold level.
(A) Expression profiles of 776 genes based on the JGS ID number.
(B) Expression profiles of genes based on their functional
classifications. The 776 genes were divided into 20 groups based on
their functional relatedness: lymphokine/cytokine/chemokine (a,
n=134), cell surface antigen/immune (b, n=65), kinase/kinase
inhibitor (c, n=49), apoptosis/stress (d, n=37),
matrix-related/membrane-bound (e, n=50), metal (f, n=24),
oncogene/suppressor (g, n=65), cell cycle/transcription factor (h,
n=49), DNA/RNA-binding protein (i, n=42), energy/metabolism (j,
n=38), drug metabolism (k, n=18), protease (l, n=21), serum
protein/anti-coagulation (m, n=42), proteasome (n, n=10),
autoimmune (o, n=5), general enzyme (p, n=66), receptor (q, n=83),
ribosomal protein (r, n=29), miscellaneous (s, n=57), and control
(t, n=2). Since a single gene occasionally belongs to more than one
group, the total number of genes indicated on the x-axis was
886. |
| Table IIIGenes upregulated >2-fold in whole
blood cells of UC patients vs. normal subjects. |
Table III
Genes upregulated >2-fold in whole
blood cells of UC patients vs. normal subjects.
| Gene | GenBank no. | Group | Mean |
|---|
| Galactoside-binding
3 (galectin 3); IgE-binding protein (ɛ-BP) | M57710 | m | 2.1 |
| Immunoglobulin
heavy constant γ3 | J00230 | b | 2.2 |
| Calcium binding
protein in macrophages (MRP14) | X06233 | f | 2.3 |
| γ-G globin
(HBG2) | X55656 | j | 2.5 |
| Interleukin-1
receptor, type II (IL-1R2) | U74649 | q | 3.6 |
Gene expression profiles
UC patients before LCAP vs. after
LCAP
Fig. 3A shows the
gene expression profiles of whole blood cells from UC patients
before LCAP vs. those from the same patients after LCAP. The
expression of several genes was altered following LCAP. Table IV displays several genes that
were either upregulated or downregulated by >2-fold in UC
patients who underwent LCAP. The downregulated transcripts included
human leukocyte antigen (HLA)-DRβ1, HLA-DP light chain, CD74, CD97,
and mangano-superoxide dismutase (Mn-SOD). In contrast, the
upregulated transcripts included neutrophil gelatinase-associated
lipocalin (NGAL), haptoglobin α1S, α1-acid glycoprotein, fos,
matrix metalloproteinase 8 (MMP8), and the putative lymphocyte
G0/G1 switch gene. Fig. 3B shows
the expression profiles of the genes based on their functional
classification. As a result of LCAP, widespread functional groups
of genes were either upregulated or downregulated.
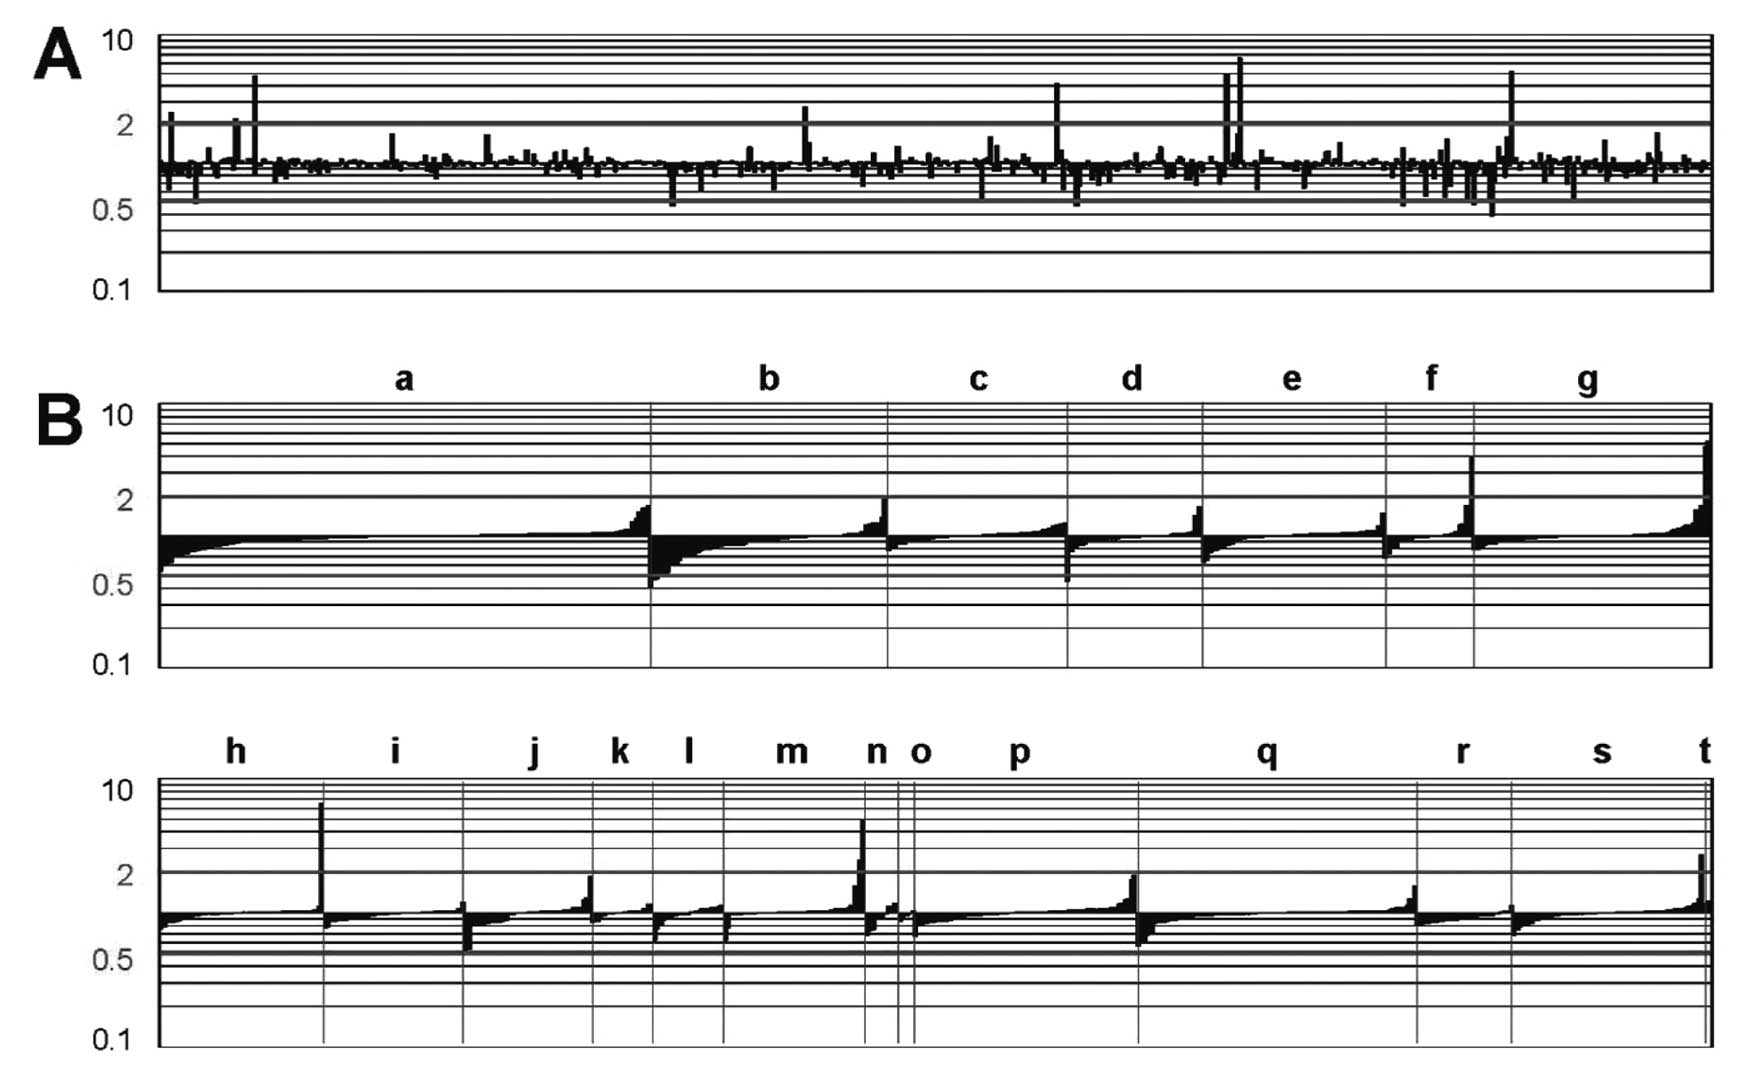 | Figure 3Gene expression profiles in UC
patients after LCAP, compared with those before LCAP. The vertical
bars indicate an increase or decrease in gene expression in UC
patients after LCAP, compared with gene expression in UC patients
before LCAP, at a 2-fold level of the Cy5/Cy3 ratio of the UC
sample divided by the Cy5/Cy3 ratio of the normal sample.
‘Downregulated’ designates genes that are downregulated, compared
with the control profile, at a 2-fold level; ‘upregulated’
indicates genes that are upregulated, compared with the control
profile, at a 2-fold level. ‘No significant change’ indicates genes
that are expressed within the 2-fold level. (A) Expression profiles
of 776 genes based on the JGS ID number. (B) Expression profiles of
genes based on their functional classification. The 776 genes were
divided into 20 groups based on their functional relatedness:
lymphokine/cytokine/chemokine (a, n=134), cell surface
antigen/immune (b, n=65), kinase/kinase inhibitor (c, n=49),
apoptosis/stress (d, n=37), matrix-related/membrane-bound (e,
n=50), metal (f, n=24), oncogene/suppressor (g, n=65), cell
cycle/transcription factor (h, n=49), DNA/RNA-binding protein (i,
n=42), energy/metabolism (j, n=38), drug metabolism (k, n=18),
protease (l, n=21), serum protein/anti-coagulation (m, n=42),
proteasome (n, n=10), autoimmune (o, n=5), general enzyme (p,
n=66), receptor (q, n=83), ribosomal protein (r, n=29),
miscellaneous (s, n=57), and control (t, n=2). Since a single gene
occasionally belongs to more than one group, the total number of
genes indicated on the x-axis was 886. |
| Table IVGenes upregulated or downregulated
>2-fold in whole blood cells of pre-LCAP vs. post-LCAP UC
patients. |
Table IV
Genes upregulated or downregulated
>2-fold in whole blood cells of pre-LCAP vs. post-LCAP UC
patients.
| Gene | GenBank no. | Group | Mean | SD |
|---|
| Downregulated
genes |
| Human leukocyte
antigen (HLA)-DRβ1 | M20430 | b | 0.4 | 0.1 |
| Mangano-superoxide
dismutase (Mn-SOD) | X14322 | d | 0.5 | 0.1 |
| HLA-DP light
chain | M57466 | b | 0.5 | 0.1 |
| CD74 | BC018726 | b | 0.5 | 0.1 |
| CD97 | U76764 | b | 0.5 | 0.1 |
| Upregulated
genes |
| α-1 acid
glycoprotein (orosomucoid-1) | M13692 | m | 2.5 | 1.0 |
| Matrix
metalloproteinase 8 (neutrophil collagenase) | J05556 | f | 3.9 | 2.7 |
| Fos | BC004490 | g | 4.7 | 3.3 |
| Haptoglobin
α1S | X00637 | m | 5.0 | 3.4 |
| Neutrophil
gelatinase-associated lipocalin (NGAL) | X83006 | g | 5.2 | 3.3 |
| Putative
lymphocyte G0/G1 switch gene | M72885 | h | 6.5 | 4.5 |
Discussion
The development of microarray techniques has
recently provided new tools capable of providing a more
comprehensive image of the gene expression profiles underlying
disease states. Using this innovative approach, we hoped to
identify the cellular expression patterns of UC patients treated
with LCAP. Circulating blood is composed of heterogeneous and
changing cell populations. The interactions of immune cell
populations with non-immune cellular components of the blood and,
occasionally, precursor cells are thought to be pivotal to the
pathophysiology of UC. Therefore, we chose to use RNA from whole
blood cells, which comprises heterogeneous cell types, with the
specific purpose of gaining a global and representative insight
into all cellular changes associated with LCAP. Furthermore, we
used freshly obtained peripheral blood samples, and the RNA was
immediately stabilized in Pax-Gene tubes. This protocol is critical
because it has been previously shown that even short-term ex
vivo incubations of blood cells can alter expression profiles
(27).
We first compared the gene expression profiles of
whole blood cells from UC patients with those from normal subjects.
Our results identified several upregulated genes including IL-1R2,
an IL-1R that antagonizes IL-1-mediated events (28), and MRP-14, a calcium-binding
protein expressed during chronic inflammation (29). Several genes that have not been
previously linked to UC, such as HBG2 (30), galectin 3 (31), and immunoglobulin heavy constant
γ3 (32), were also upregulated.
The widespread upregulation of these genes involved in receptor
(IL-1R2), metal (MRP-14), energy/metabolism (HBG2), serum
protein/anti-coagulation (galectin 3), and cell surface
antigen/immune (immunoglobulin heavy constant γ3) processes may
indicate a major disruption in cellular homeostasis in UC. Further
studies are needed to elucidate whether the gene expression profile
observed in this study is specific to UC or merely a secondary
event associated with intestinal inflammation.
LCAP is a therapeutic strategy involving
extracorporeal immunomodulation that has been used to treat several
immunological disorders including UC (8–11)
and Crohn's disease (12). A
multicenter, randomized controlled trial of UC patients showed that
the efficacy of LCAP was significantly superior to that of
high-dose steroid therapy (9).
Recent research has revealed that LCAP preferentially attenuates
inflammatory and immune responses through the downregulation of
proinflammatory mediators, such as IL-1, tumor necrosis factor-α or
adhesion molecules, or the upregulation of anti-inflammatory
mediators, such as IL-4 or IL-10 (33–35). In the present study, we focused
on, for the first time, the effect of LCAP on the gene expression
profiles of whole blood cells from UC patients.
LCAP downregulated the expression of proinflammatory
genes that belong to the cell surface antigen/immune response
group, including CD97, CD74, HLA-DRβ1 and HLA-DP light chain. CD97
has an essential role in the migration of neutrophils by
facilitating the binding of chemokines (36). In fact, the homing of adoptively
transferred neutrophils to the colon was delayed when the cells
were preincubated with anti-CD97 monoclonal antibodies in
experimental colitis (37). CD74,
a cell surface binding protein for macrophage migration inhibitory
factor (MIF), is required for the MIF-induced activation of the
extracellular signal-regulated kinase-1/2 kinase cascade, cell
proliferation, and prostaglandin E2 production (38). Moreover, MIF, the ligand for CD74,
plays a key role in the development of IBD (39). The downregulation of HLA-related
genes, such as HLA-DRβ1 and HLA-DP light chain, may imply an
improvement in the abnormal immune regulation observed in UC
(40).
Notably, LCAP upregulated the expression of natural
antimicrobial NGAL, a neutrophil lipocalin that may bind the
proinflammatory bacterial tripeptide
N-formylmethionyl-leucyl-phenylalanine (41). In situ hybridization and
immunohistochemical studies have shown strong NGAL expression in
colonocytes and neutrophils in patients with UC (42). Since enteric flora plays an
important role in the pathogenesis of UC, the upregulation of such
genes lends particularly strong support to the effectiveness of
LCAP. Moreover, several acute phase protein genes, including
haptoglobin α1S and α1-acid glycoprotein, were upregulated after
LCAP. Previous studies have shown that haptoglobin, found in
chronic inflammatory conditions, can aid in tissue repair by
stimulating angiogenesis (43).
Furthermore, α1-acid glycoprotein can prevent neutrophil activation
during inflammatory processes (44). Therefore, the LCAP-induced
upregulation of these three genes seems to play a protective role
in patients with UC. The functional roles of the upregulation of
Mn-SOD (45), the putative
lymphocyte G0/G1 switch gene (46), fos (47) and MMP8 (48) remain unclear.
How does LCAP alter these cellular gene expression
profiles? During LCAP, most of the leukocytes are removed by a
filter during extracorporeal circulation. This treatment is
associated with rebound leukophilia in response to transient
leukopenia (49,50), indicating a rapid cell release
response from the reticuloendothelial system. Therefore, this
drastic change in gene expression may be partly explained by the
replacement of activated leukocytes with new and naïve ones
originating from the marginated pool and/or bone marrow. We cannot
completely exclude the possibility that some of the identified
differences in gene expression before and after LCAP may be the
result of a distinct composition of leukocyte subsets, since the
proportion of neutrophils increased and the proportion of
lymphocytes and monocytes decreased after LCAP.
Medical therapies for IBD are predominantly directed
at attenuating inflammatory and immune processes using
glucocorticoids, immunosuppressants, and/or cytokine inhibitors
(51,52). New therapeutic approaches that may
change the enteric flora, promote tissue repair, or enhance the
anti-inflammatory aspects of the disease have also been employed
(53,54). Since the analyses in the present
study were conducted using only six samples obtained from patients
after their first session of LCAP, we could not clarify whether the
change in the cellular gene expression profiles directly
contributed to the positive clinical outcomes after a full course
of LCAP. However, taking into consideration the evidence presented
here, we speculate that LCAP preferentially downregulates genes
related to disease progression and upregulates those related to
disease amelioration.
In conclusion, we identified, for the first time,
the gene expression profile of whole blood cells from patients with
UC and the transcriptional events following LCAP. After LCAP, the
gene expression profile shifted toward one indicating disease
improvement. These results suggest a basis for the molecular
mechanisms leading to the therapeutic effects of LCAP as well as
indicating new therapeutic targets, thereby providing important
prognostic information.
Acknowledgements
This study was supported in part by Grants-in-Aid
from the Japanese Ministry of Education, Culture, and Science; and
the Japanese Ministry of Health and Welfare. We thank Ms. Ritsuko
Seki and Ms. Asako Hitomi, Mr. Tomoshige Nogami and Mr. Hiroshi
Shibata for their help during the study.
References
|
1
|
Podolsky DK: Inflammatory bowel disease. N
Engl J Med. 347:417–429. 2002. View Article : Google Scholar
|
|
2
|
Bamias G, Nyce MR, De La Rue SA and
Cominelli F; American College of Physicians; American Physiological
Society. New concepts in the pathophysiology of inflammatory bowel
disease. Ann Intern Med. 143:895–904. 2005. View Article : Google Scholar : PubMed/NCBI
|
|
3
|
Targan SR and Karp LC: Defects in mucosal
immunity leading to ulcerative colitis. Immunol Rev. 206:296–305.
2005. View Article : Google Scholar : PubMed/NCBI
|
|
4
|
Grimm MC, Pullman WE, Bennett GM, Sullivan
PJ, Pavli P and Doe WF: Direct evidence of monocyte recruitment to
inflammatory bowel disease mucosa. J Gastroenterol Hepatol.
10:387–395. 1995. View Article : Google Scholar : PubMed/NCBI
|
|
5
|
Rugtveit J, Brandtzaeg P, Halstensen TS,
Fausa O and Scott H: Increased macrophage subset in inflammatory
bowel disease: apparent recruitment from peripheral blood
monocytes. Gut. 35:669–674. 1994. View Article : Google Scholar : PubMed/NCBI
|
|
6
|
Kondoh T, Hidaka Y, Katoh H, Inoue N and
Saito S: Evaluation of a filtration lymphocytapheresis (LCP) device
for use in the treatment of patients with rheumatoid arthritis.
Artif Organs. 15:180–188. 1991. View Article : Google Scholar : PubMed/NCBI
|
|
7
|
Sawada K, Ohnishi K, Fukui S, et al:
Leukocytapheresis therapy, performed with leukocyte removal filter,
for inflammatory bowel disease. J Gastroenterol. 30:322–329. 1995.
View Article : Google Scholar : PubMed/NCBI
|
|
8
|
Ortolano GA, Capetandes A and Wenz B: A
review of leukofiltration therapy for decreasing the morbidity
associated with cardiopulmonary bypass and acute inflammatory bowel
disease. Ther Apher. 6:119–129. 2002. View Article : Google Scholar : PubMed/NCBI
|
|
9
|
Sawada K, Muto T, Shimoyama T, et al:
Multicenter randomized controlled trial for the treatment of
ulcerative colitis with a leukocytapheresis column. Curr Pharm Des.
9:307–321. 2003. View Article : Google Scholar : PubMed/NCBI
|
|
10
|
Yajima T, Takaishi H, Kanai T, et al:
Predictive factors of response to leukocytapheresis therapy for
ulcerative colitis. Ther Apher. 2:115–119. 1998. View Article : Google Scholar : PubMed/NCBI
|
|
11
|
Sasaki M, Tsujikawa T, Fujiyama Y and
Bamba T: Leukocytapheresis therapy for severe ulcerative colitis.
Ther Apher. 2:101–104. 1998. View Article : Google Scholar
|
|
12
|
Kosaka T, Sawada K, Ohnishi K, et al:
Effect of leukocytapheresis therapy using a leukocyte removal
filter in Crohn's disease. Intern Med. 38:102–111. 1999. View Article : Google Scholar
|
|
13
|
Hidaka T, Suzuki K, Matsuki Y, et al:
Filtration leukocytapheresis therapy in rheumatoid arthritis: a
randomized, double-blind, placebo-controlled trial. Arthritis
Rheum. 42:431–437. 1999. View Article : Google Scholar : PubMed/NCBI
|
|
14
|
Ueki Y, Yamasaki S, Kanamoto Y, et al:
Evaluation of filtration leucocytapheresis for use in the treatment
of patients with rheumatoid arthritis. Rheumatology. 39:165–171.
2000. View Article : Google Scholar : PubMed/NCBI
|
|
15
|
Furuta T, Hotta O, Yusa N, Horigome I,
Chiba S and Taguma Y: Lymphocytapheresis to treat rapidly
progressive glomerulonephritis: a randomised comparison with
steroid-pulse treatment. Lancet. 352:203–204. 1998. View Article : Google Scholar : PubMed/NCBI
|
|
16
|
Dieckgraefe BK, Stenson WF, Korzenik JR,
Swanson PE and Harrington CA: Analysis of mucosal gene expression
in inflammatory bowel disease by parallel oligonucleotide arrays.
Physiol Genomics. 4:1–11. 2000.PubMed/NCBI
|
|
17
|
Lawrance IC, Fiocchi C and Chakravarti S:
Ulcerative colitis and Crohn's disease: distinctive gene expression
profiles and novel susceptibility candidate genes. Hum Mol Genet.
10:445–456. 2001.
|
|
18
|
Heller RA, Schena M, Chai A, et al:
Discovery and analysis of inflammatory disease-related genes using
cDNA microarrays. Proc Natl Acad Sci USA. 94:2150–2155. 1997.
View Article : Google Scholar : PubMed/NCBI
|
|
19
|
Truelove SC and Witts LJ: Cortisone in
ulcerative colitis; final report on a therapeutic trial. Br Med J.
2:1041–1048. 1955. View Article : Google Scholar : PubMed/NCBI
|
|
20
|
Nagase K, Sawada K, Ohnishi K, Egashira A,
Ohkusu K and Shimoyama T: Complications of leukocytapheresis. Ther
Apher. 2:120–124. 1998. View Article : Google Scholar
|
|
21
|
Hashimoto S, Suzuki T, Dong HY, Yamazaki N
and Matsushima K: Serial analysis of gene expression in human
monocytes and macrophages. Blood. 94:837–844. 1999.PubMed/NCBI
|
|
22
|
Hashimoto S, Suzuki T, Dong HY, Nagai S,
Yamazaki N and Matsushima K: Serial analysis of gene expression in
human monocyte-derived dendritic cells. Blood. 94:845–852.
1999.PubMed/NCBI
|
|
23
|
Hashimoto SI, Suzuki T, Nagai S, Yamashita
T, Toyoda N and Matsushima K: Identification of genes specifically
expressed in human activated and mature dendritic cells through
serial analysis of gene expression. Blood. 96:2206–2214. 2000.
|
|
24
|
Nagai S, Hashimoto S, Yamashita T, et al:
Comprehensive gene expression profile of human activated T(h)1- and
T(h)2-polarized cells. Int Immunol. 13:367–376. 2001. View Article : Google Scholar : PubMed/NCBI
|
|
25
|
Khodursky AB, Peter BJ, Cozzarelli NR,
Botstein D, Brown PO and Yanofsky C: DNA microarray analysis of
gene expression in response to physiological and genetic changes
that affect tryptophan metabolism in Escherichia coli. Proc
Natl Acad Sci USA. 97:12170–12175. 2000. View Article : Google Scholar : PubMed/NCBI
|
|
26
|
Yang YH, Dudoit S, Luu P, et al:
Normalization for cDNA microarray data: a robust composite method
addressing single and multiple slide systematic variation. Nucleic
Acids Res. 30:e152002. View Article : Google Scholar : PubMed/NCBI
|
|
27
|
Baechler EC, Batliwalla FM, Karypis G, et
al: Expression levels for many genes in human peripheral blood
cells are highly sensitive to ex vivo incubation. Genes Immun.
5:347–353. 2004. View Article : Google Scholar : PubMed/NCBI
|
|
28
|
Rauschmayr T, Groves RW and Kupper TS:
Keratinocyte expression of the type 2 interleukin 1 receptor
mediates local and specific inhibition of interleukin 1-mediated
inflammation. Proc Natl Acad Sci USA. 94:5814–5819. 1997.
View Article : Google Scholar : PubMed/NCBI
|
|
29
|
Odink K, Cerletti N, Bruggen J, et al: Two
calcium-binding proteins in infiltrate macrophages of rheumatoid
arthritis. Nature. 330:80–82. 1987. View
Article : Google Scholar : PubMed/NCBI
|
|
30
|
Cui XF, Li HH, Goradia TM, et al:
Single-sperm typing: determination of genetic distance between the
G gamma-globin and parathyroid hormone loci by using the polymerase
chain reaction and allele-specific oligomers. Proc Natl Acad Sci
USA. 86:9389–9393. 1989. View Article : Google Scholar
|
|
31
|
Robertson MW, Albrandt K, Keller D and Liu
FT: Human IgE-binding protein: a soluble lectin exhibiting a highly
conserved interspecies sequence and differential recognition of IgE
glycoforms. Biochemistry. 29:8093–8100. 1990. View Article : Google Scholar
|
|
32
|
Takahashi N, Ueda S, Obata M, Nikaido T,
Nakai S and Honjo T: Structure of human immunoglobulin gamma genes:
implications for evolution of a gene family. Cell. 29:671–679.
1982. View Article : Google Scholar : PubMed/NCBI
|
|
33
|
Mitsuyama K, Suzuki A, Matsumoto S, et al:
Diminished cytokine signalling against bacterial components in
mononuclear leucocytes from ulcerative colitis patients after
leukocytapheresis. Clin Exp Immunol. 141:130–140. 2005. View Article : Google Scholar
|
|
34
|
Andoh A, Ogawa A, Kitamura K, et al:
Suppression of interleukin-1beta- and tumor necrosis
factor-alpha-induced inflammatory responses by leukocytapheresis
therapy in patients with ulcerative colitis. J Gastroenterol.
39:1150–1157. 2004. View Article : Google Scholar : PubMed/NCBI
|
|
35
|
Noguchi M, Hiwatashi N, Hayakawa T and
Toyota T: Leukocyte removal filter-passed lymphocytes produce large
amounts of interleukin-4 in immunotherapy for inflammatory bowel
disease: role of bystander suppression. Ther Apher. 2:109–114.
1998. View Article : Google Scholar
|
|
36
|
Gray JX, Haino M, Roth MJ, et al: CD97 is
a processed, seven-transmembrane, heterodimeric receptor associated
with inflammation. J Immunol. 157:5438–5447. 1996.PubMed/NCBI
|
|
37
|
Leemans JC, te Velde AA, Florquin S, et
al: The epidermal growth factor-seven transmembrane (EGF-TM7)
receptor CD97 is required for neutrophil migration and host
defense. J Immunol. 172:1125–1131. 2004. View Article : Google Scholar : PubMed/NCBI
|
|
38
|
Leng L, Metz CN, Fang Y, et al: MIF signal
transduction initiated by binding to CD74. J Exp Med.
197:1467–1476. 2003. View Article : Google Scholar : PubMed/NCBI
|
|
39
|
Ohkawara T, Nishihira J, Takeda H, et al:
Amelioration of dextran sulfate sodium-induced colitis by
anti-macrophage migration inhibitory factor antibody in mice.
Gastroenterology. 123:256–270. 2002. View Article : Google Scholar : PubMed/NCBI
|
|
40
|
Salomon P, Pizzimenti A, Panja A, Reisman
A and Mayer L: The expression and regulation of class II antigens
in normal and inflammatory bowel disease peripheral blood monocytes
and intestinal epithelium. Autoimmunity. 9:141–149. 1991.
View Article : Google Scholar : PubMed/NCBI
|
|
41
|
Kjeldsen L, Johnsen AH, Sengelov H and
Borregaard N: Isolation and primary structure of NGAL, a novel
protein associated with human neutrophil gelatinase. J Biol Chem.
268:10425–10432. 1993.PubMed/NCBI
|
|
42
|
Nielsen BS, Borregaard N, Bundgaard JR,
Timshel S, Sehested M and Kjeldsen L: Induction of NGAL synthesis
in epithelial cells of human colorectal neoplasia and inflammatory
bowel diseases. Gut. 38:414–420. 1996. View Article : Google Scholar : PubMed/NCBI
|
|
43
|
Cid MC, Grant DS, Hoffman GS, Auerbach R,
Fauci AS and Kleinman HK: Identification of haptoglobin as an
angiogenic factor in sera from patients with systemic vasculitis. J
Clin Invest. 91:977–985. 1993. View Article : Google Scholar : PubMed/NCBI
|
|
44
|
Laine E, Couderc R, Roch-Arveiller M,
Vasson MP, Giroud JP and Raichvarg D: Modulation of human
polymorphonuclear neutrophil functions by alpha 1-acid
glycoprotein. Inflammation. 14:1–9. 1990. View Article : Google Scholar : PubMed/NCBI
|
|
45
|
Wispe JR, Clark JC, Burhans MS, Kropp KE,
Korfhagen TR and Whitsett JA: Synthesis and processing of the
precursor for human mangano-superoxide dismutase. Biochim Biophys
Acta. 994:30–36. 1989. View Article : Google Scholar : PubMed/NCBI
|
|
46
|
Russell L and Forsdyke DR: A human
putative lymphocyte G0/G1 switch gene containing a CpG-rich island
encodes a small basic protein with the potential to be
phosphorylated. DNA Cell Biol. 10:581–591. 1991. View Article : Google Scholar : PubMed/NCBI
|
|
47
|
Warburton G, Nares S, Angelov N, Brahim
JS, Dionne RA and Wahl SM: Transcriptional events in a clinical
model of oral mucosal tissue injury and repair. Wound Repair Regen.
13:19–26. 2005. View Article : Google Scholar : PubMed/NCBI
|
|
48
|
Pirila E, Ramamurthy NS, Sorsa T, Salo T,
Hietanen J and Maisi P: Gelatinase A (MMP-2), collagenase-2
(MMP-8), and laminin-5 gamma2-chain expression in murine
inflammatory bowel disease (ulcerative colitis). Dig Dis Sci.
48:93–98. 2003. View Article : Google Scholar : PubMed/NCBI
|
|
49
|
Yamaji K, Yang K, Tsuda H and Hashimoto H:
Fluctuations in the peripheral blood leukocyte and platelet counts
in leukocytapheresis in healthy volunteers. Ther Apher. 6:402–412.
2002. View Article : Google Scholar : PubMed/NCBI
|
|
50
|
Sawada K, Ohnishi K, Kosaka T, et al:
Leukocytapheresis with leukocyte removal filter as new therapy for
ulcerative colitis. Ther Apher. 1:207–211. 1997. View Article : Google Scholar : PubMed/NCBI
|
|
51
|
Danese S: New therapies for inflammatory
bowel disease: from the bench to the bedside. Gut. 61:918–932.
2012. View Article : Google Scholar : PubMed/NCBI
|
|
52
|
Rutgeerts P, Vermeire S and Van Assche G:
Biological therapies for inflammatory bowel diseases.
Gastroenterology. 136:1182–1197. 2009. View Article : Google Scholar : PubMed/NCBI
|
|
53
|
Mitsuyama K and Sata M: Gut microflora: a
new target for therapeutic approaches in inflammatory bowel
disease. Expert Opin Ther Targets. 12:301–312. 2008. View Article : Google Scholar : PubMed/NCBI
|
|
54
|
Duijvestein M, van den Brink GR and Hommes
DW: Stem cells as potential novel therapeutic strategy for
inflammatory bowel disease. J Crohns Colitis. 2:99–106. 2008.
View Article : Google Scholar : PubMed/NCBI
|