Introduction
Hematological abnormalities are frequently observed
in patients with liver cirrhosis (LC). It has been reported that
84% of patients with the same type of LC and graded as Child-Pugh
A/B for liver function suffer from hematological abnormalities,
among which 32% of patients suffer from decreases in several types
of blood cells, and the remainder are mainly patients with
thrombocytopenia or combined thrombocytopenia and granulocytopenia
(1). Moreover, these may lead to
serious complications and may thus affect the prognosis of
patients. They may be the limiting factors in corresponding
invasive surgeries, such as liver puncturation, liver biopsy,
endoscopy or surgical treatments. Leucopenia may increase the risk
of infection following surgery. Thrombocytopenia may increase the
risk of esophageal variceal hemorrhage and hemorrhage during and
after surgery, while anemia may lead to even more complications
after hemorrhagic events (2).
Some studies have reported the incidence of these abnormal
situations, such as hypersplenia and a decrease in thrombopoietin
in the liver, which further leads to aleukia (3). Portal hypertension causes alimentary
tract hemorrhaging, hemolysis and the loss of hematopoietic
substances, such as ferrum, folic acid and other substances, which
further leads to anemia of organisms (4). Moreover, hepatitis B and C viruses,
excessive alcohol abuse and drug intake induce the formation of LC
and subsequently impair hematopoietic functions in bone marrow due
to bone marrow depression (5,6).
Apart from these reasons, the inhibitors in LC serum which include
intestinal endotoxin, inflammatory cytokines, collagen, antibodies
and other factors can affect the function of BM. We found in our
preliminary experiments that the gradually accumulated LC related
humoral inhibitors in vivo affected bone marrow endothelial
cells (BMECs) and caused ultrastructural damage that was positively
associated with the serious degree of LC (7).
The bone marrow microenvironment is the habitat of
hematopoietic stem/progenitor cells (HSPCs) and it is where they
proliferate and differentiate. BMECs are important components of
the bone marrow microenvironment. They constitute a mechanical
barrier between peripheral blood and the bone marrow
microenvironment (8). Due to this
special histological position, they not only function as
cytoskeletal components supporting adhesion, migration and other
activities of HSPCs, but also secrete cytokines to the bone marrow
microenvironment (9,10). A number of studies have
demonstrated that these cytokines have important functions in
regulating the directed homing, proliferation and differentiation
of HSPCs (11–14). If BMECs are damaged, this results
in dysfunction and the hematopoietic function of the bone marrow
may therefore also be damaged. In addition, in a previous study, we
found that the ultrastructure of BMECs was damaged by a humoral
inhibitors in the sera of patients with LC (7).
Therefore, we hypothesized that the humoral
inhibitors in the sera of patients with LC may induce damage and
abnormal cytokine secretion by BMECs. This would then lead to a
disturbance in the bone marrow microenvironment and the dysfunction
of HSPCs. In order to verify this hypothesis and investigate what
changes occur in BMECs and whether they abnormally secrete
cytokines in LC, we cultured human BMECs with medium supplemented
with 20% pooled sera from healthy volunteers or patients with LC,
and the abnormally expressed signaling pathways and cytokines were
screened using whole genome expression profiling, Human Cytokines
RT2 Profiler™ PCR array and in vitro
experiments.
Materials and methods
Patients and serum collection
A total of 26 hospitalized patients (aged 35–62
years; mean age, 52.12±7.03 years) from the First Affiliated
Hospital of Harbin Medical University, Harbin, China were selected
to participate in this study from September 2011 to May 2012. The
patients had been diagnosed with cholestatic LC and their liver
functions were graded as Child-Pugh A/B (A=9, B=17). They were all
male patients without viral hepatitis, alcoholic liver disease,
other liver diseases and diseases in other systems, and peripheral
blood samples were collected from the patients pior to the
treatments. A total of 10 healthy male volunteers (aged 34–65
years; mean age, 52.90±8.39 years) were selected after performing a
physical examination, and their blood samples were collected to
obtain the sera for the healthy control group. The study protocol
was approved by the Ethics Committee of Harbin Medical University
and informed consent was obtained from all patients, as per the
guidelines of the World Medical Association Declaration of
Helsinki. Serum specimens were obtained by standard clinical
laboratory processing with serum separated typically <1 h after
blood collection. Sera were heat inactivated for 40 min at 56°C and
sterile filtered through 0.22-μm filters (Millex, Millipore Corp.,
Bedford, MA, USA). After processing, the serum samples were stored
in a refrigerator of −20°C for further use, as previously described
(15). Additionally, the data of
the hematological parameters of the patients with LC and the
healthy volunteers were obtained from the Medical Examination
Center of the First Affiliated Hospital of Harbin Medical
University (Table I).
 | Table IHematological parameters in the
healthy group of volunteers and patients with liver cirrhosis
(LC). |
Table I
Hematological parameters in the
healthy group of volunteers and patients with liver cirrhosis
(LC).
| Group | N | Age | Hemoglobin
(g/l) | Leukocytes
(×109/l) | Platelets
(×109/l) |
|---|
| Healthy
volunteers | 10 | 52.90±8.39 | 146.8±6.8 | 7.9±1.1 | 213.6±20.2 |
| Patients with
LC | 26 | 52.12±7.03 | 137.6±9.5 | 6.8±1.9 |
120.6±57.0a |
Cell lines and cell culture
conditions
Human BMECs (China Center for Type Culture
Collection, Shanghai, China) were cultured in RPMI-1640 medium
(Sigma, St. Louis, MO, USA) containing antibiotics (100 U/ml of
penicillin and 100 mg/ml of streptomycin) and incubated in 5%
CO2. In order to evaluate the effects of the humoral
inhibitors in the sera of patients with LC on BMECs, this medium
was modified to 20% pooled sera content with either the pooled sera
of healthy controls (n=10) or the pooled sera of patients with LC
(n=26); the other culture conditions were not changed. TRIzol
reagent (Invitrogen Corp., Camarillo, CA, USA) was used to isolate
the RNA after the human BMECs were treated for 48 h, as previously
described (15).
Apoptosis assay
After the BMECs were treated with medium
supplemented with 20% pooled sera from patients with LC or healthy
volunteers as the control group for 48 h, 1×10⁶ cells
were collected and washed twice with ice-cold PBS, suspended in
binding buffer (100 μl) (BD Biosciences, San Jose, CA, USA),
treated with Annexin V and propidium iodide (PI) (BD Biosciences),
and incubated in the dark for 15 min; another 300 μl binding buffer
were then added and flow cytometry analysis was performed within 1
h to measure the rate of apoptosis (%).
RNA extraction
Total RNA was extracted and isolated using TRIzol
reagent (Invitrogen Corp.) following the manufacturer’s
instructions. RNA quantity and quality were measured using the
NanoDrop ND-1000 spectrophotometer (NanoDrop Technologies, Inc.,
Wilmington, DE, USA). RNA integrity was assessed by standard
denaturing agarose gel electrophoresis. For spectrophotometry, the
OD A260/A280 ratio should be close to 2.0 for pure RNA (ratios
between 1.8 and 2.1 are acceptable). The OD A260/A230 ratio should
be >1.8.
Whole genome microarray analysis
The Human 12×135K Gene Expression array was
manufactured by Roche NimbleGen (Madison, WI, USA). A total of
45,033 genes were collected from authoritative data sources,
including NCBI. Double-stranded cDNA (ds-cDNA) was synthesized from
total RNA using an Invitrogen SuperScript ds-cDNA synthesis kit in
the presence of 100 pmol oligo(dT) primers. ds-cDNA was cleaned and
labeled in accordance with the NimbleGen Gene Expression Analysis
protocol. The purified cDNA was quantified using a NanoDrop ND-1000
spectrophotometer. For Cy3 labeling of cDNA, the NimbleGen
One-Color DNA labeling kit was used according to the manufacturer’s
instructions. ds-cDNA (1 μg) was incubated for 10 min at 98°C with
1 OD of Cy3–9mer primer. Subsequently, 100 pmol of deoxynucleoside
triphosphates and 100 U of the Klenow fragment (New England
Biolabs, Ipswich, MA, USA) were added and the mixture was incubated
at 37°C for 2 h. Microarrays were hybridized at 42°C for 16–20 h
with 4 μg of Cy3 labeled ds-cDNA in NimbleGen hybridization
buffer/hybridization component A in a hybridization chamber
(Hybridization System, NimbleGen Systems, Inc.). After being washed
in an ozone-free environment, the slides were scanned using the
Axon GenePix 4000B microarray scanner (Molecular Devices, LLC.
Sunnyvale, CA, USA). Scanned images (TIFF format) were then
imported into NimbleScan software (version 2.5) for grid alignment
and expression data analysis. Expression data were normalized
through quantile normalization and the Robust Multichip Average
algorithm included in the NimbleScan software. All gene level files
were imported into Agilent GeneSpring GX software (version 11.5.1;
Agilent Technologies, Inc., Santa Clara, CA, USA) for further
analysis. Differentially expressed genes were identified through
fold change filtering.
Human Cytokines RT2 Profiler™
PCR array
We used the Human Cytokines RT2 Profiler
PCR array (SuperArray Bioscience Corp., Frederick, MD, USA)
according to the manufacturer’s instructions to perform
quantitative reverse transcription PCR (qRT-PCR) in the ABI PRISM
7900-HT machine (Applied Biosystems, Foster City, CA, USA). RNA
isolation, DNase treatment and RNA clean-up were performed
according to the manufacturer’s instructions and as previously
described (16). The Human
Cytokines RT2 Profiler PCR array profiles the expression
of 84 important cytokine genes. This array includes interferons
(IFNs), interleukins (ILs), bone morphogenetic proteins (BMPs) and
members of the transforming growth factor (TGF)B family. Also
represented are platelet-derived and vascular endothelial growth
factors. Tumor necrosis factors (TNFs) are included, as well as
other cytokine-related genes (Table
II). It also contains 12 internal control genes, including a
panel of 5 housekeeping genes (B2M, HPRT1, RPL13A, GAPDH, ACTB), 3
reverse transcription controls, 3 positive PCR controls and human
genomic DNA contamination (HGDC). After the preparatory detection,
the expression of ACTB was comparatively constant, and we selected
ACTB as the final control gene to control for variability in cDNA
quantity, integrity and individual primer efficiency in the whole
RT-PCR reaction, and presented the data normalized to ACTB
expression. Data normalization was based on correcting all Ct
values for the average Ct values of several constantly expressed
housekeeping genes present on the array, as previously described
(17).
| Table IIGene table for 84 important cytokine
genes. |
Table II
Gene table for 84 important cytokine
genes.
|
Category/family | Genes |
|---|
| Interferons | IFNA1, IFNA2,
IFNA4, IFNA5, IFNA8, IFNB1, IFNK, IFNG |
| Interleukins | IL10, IL11, IL12A,
IL12B, IL13, IL14, IL15, IL16, IL17, IL17B, IL17C, IL17E, IL18,
IL19, IL1A, IL1B, IL1F10, IL1F5, IL1F6, IL1F7, IL1F8, IL1F9, IL2,
IL9, IL20, IL21, IL22, IL24, IL3, IL4, IL5, IL6, IL7, IL8 |
| Bone morphogenetic
proteins (BMPs) | BMP1, BMP2, BMP3,
BMP4, BMP5, BMP6, BMP7, BMP8B, GDF10 (BMP3B), and TGF-beta family
GDF11 (BMP11), GDF2 (BMP9), GDF3, GDF5, GDF8, GDF9, INHA, INHBA,
NODAL, TGFA, TGFB1, TGFB2, TGFB3 |
| PDGF/VEGF
family | FIGF (VEGFD),
PDGFA |
| TNF
superfamily | FASLG (TNFSF6), LTA
(TNFB), LTB, TNF, TNFRSF11B, TNFSF13B, TNFSF10, TNFSF11, TNFSF12,
TNFSF13, TNFSF13B, TNFSF14, TNFSF4, TNFSF7, TNFSF8 |
| Other growth
factors/cytokines | CSF1 (MCSF), CSF2
(GMCSF), LEFTY2 (EBAF), FAM3B |
qRT-PCR
To validate the whole genome microarray data,
qRT-PCR was performed using the SYBR® PrimeScript™
RT-PCR kit in the LightCycler System (Roche Diagnostics, Lewes, UK)
for 13 supplementary cytokine genes. Samples were selected from the
original microarray experiments for further qRT-PCR testing based
on sufficient RNA remaining. Total RNA was extracted from the serum
samples using TRIzol reagent (Invitrogen Corp.) containing RNAsafe
(Tiangen Biotech Co., Ltd., Beijing, China) and converted to
first-strand cDNA according to the manufacturer’s instructions.
Glyceraldehyde-3-phosphate dehydrogenase (GAPDH) expression was
used as an internal control and the relative expression of each
gene was determined by the fold change (2−ΔΔCt) method,
comparing the expression of the test gene to an average GAPDH, and
then comparing the LC group versus the healthy control group. The
primers used for cDNA amplification are presented in Table III.
| Table IIIPrimers used for quantitative
PCR. |
Table III
Primers used for quantitative
PCR.
| Gene | Forward primer | Reverse primer |
|---|
| CCL28 |
5′-CAGAGAGGACTCGCCATCGT-3′ |
5′-TGTGAAACCTCCGTGCAACA-3′ |
| GDNF |
5′-CCAAAGCGTCCGAGACTG-3′ |
5′-ACAAACGACCAAGACAGATCAGAG-3′ |
| THBS2 |
5′-AGCTCGGCAGAGGCAGGATG-3′ |
5′-ATACCATGCTCGATTTTCACTCC-3′ |
| THBS3 |
5′-CTGCCTGCCAGGGGTAGTGAG-3′ |
5′-TTAGAACTTTATGGCAACGTGCTG-3′ |
| LIF |
5′-ACTTCCCGCCCTTCCACGC-3′ |
5′-GGGAGGTGCCAAGGTACACGACT-3′ |
| MST1 |
5′-GGTACGGGTAATGACACAGTCCTAAATG-3′ |
5′-GTTGTGGGTAAAGCAGGCAAGTGG-3′ |
| IGF1 |
5′-ACCGACATGCCCAAGACCCA-3′ |
5′-TTCAGCATTTCTACTTCCAATCTCCCT-3′ |
| MMP15 |
5′-CATGGAAACAACCTCTTCCT-3′ |
5′-CTTGAAGTTGTCAACGTCCT-3′ |
| MMP3 |
5′-CTGTTGATTCTGCTGTTGAG-3′ |
5′-AAGTCTCCATGTTCTCTAACTG-3′ |
| FGF22 |
5′-GGCCCCGCCCTTGTACTG-3′ |
5′-TCAGGAGACCAGGACGGGCAG-3′ |
| SLIT2 |
5′-CACCTCGTACAGCCGCACTT-3′ |
5′-TGTGGACCGCTGAGGAGCAA-3′ |
| CCL4L2 |
5′-ACAGGACACAGCTAGGTTC-3′ |
5′-GCATTTTATTTTAAAGTTTTATTATG-3′ |
| VTN |
5′-GAGCAAACAGAGCAGCAGAAAAG-3′ |
5′-TTTAAACTCGGGGCTAAGGGACC-3′ |
| GAPDH |
5′-TCAATGACAACTTTGTCAAGCTCA-3′ |
5′-GTGGGTGGTCCAGGGTTTCTTACT-3′ |
Statistical analysis
Patient data are expressed as the means ± standard
deviation (SD). Comparisons were made using the Student’s t-test.
In the process of screening differentially expressed genes in the
whole genome microarray and the Human Cytokines RT2
Profiler PCR array, a ≥2-fold change indicated a significant change
in gene expression based on the microarray manufacturer’s
recommendations. Categorical variables are given as numbers and
percentages; Fisher’s exact test was used to test their
associations. Statistical analyses were set with a significance
level of 0.05 and were performed using SPSS 15.0 statistical
software (SPSS Inc., Chicago, IL, USA).
Results
Whole genome microarray analysis
We investigated the gene expression profiles in
BMECs treated with sera from patients with LC or sera from healthy
volunteers using whole genome microarray. To identify
differentially expressed genes, we performed a fold change
filtering between the 2 samples. The threshold is a fold change
≥2.0 or ≤-2.0. The results revealed that there were 1,106
upregulated genes and 766 downregulated genes in the BMECs treated
with sera from patients with LC. Only genes with p<0.05 and a
fold change ≥2.0 for upregulation and ≤-2.0 for downregulation were
considered for expression analysis.
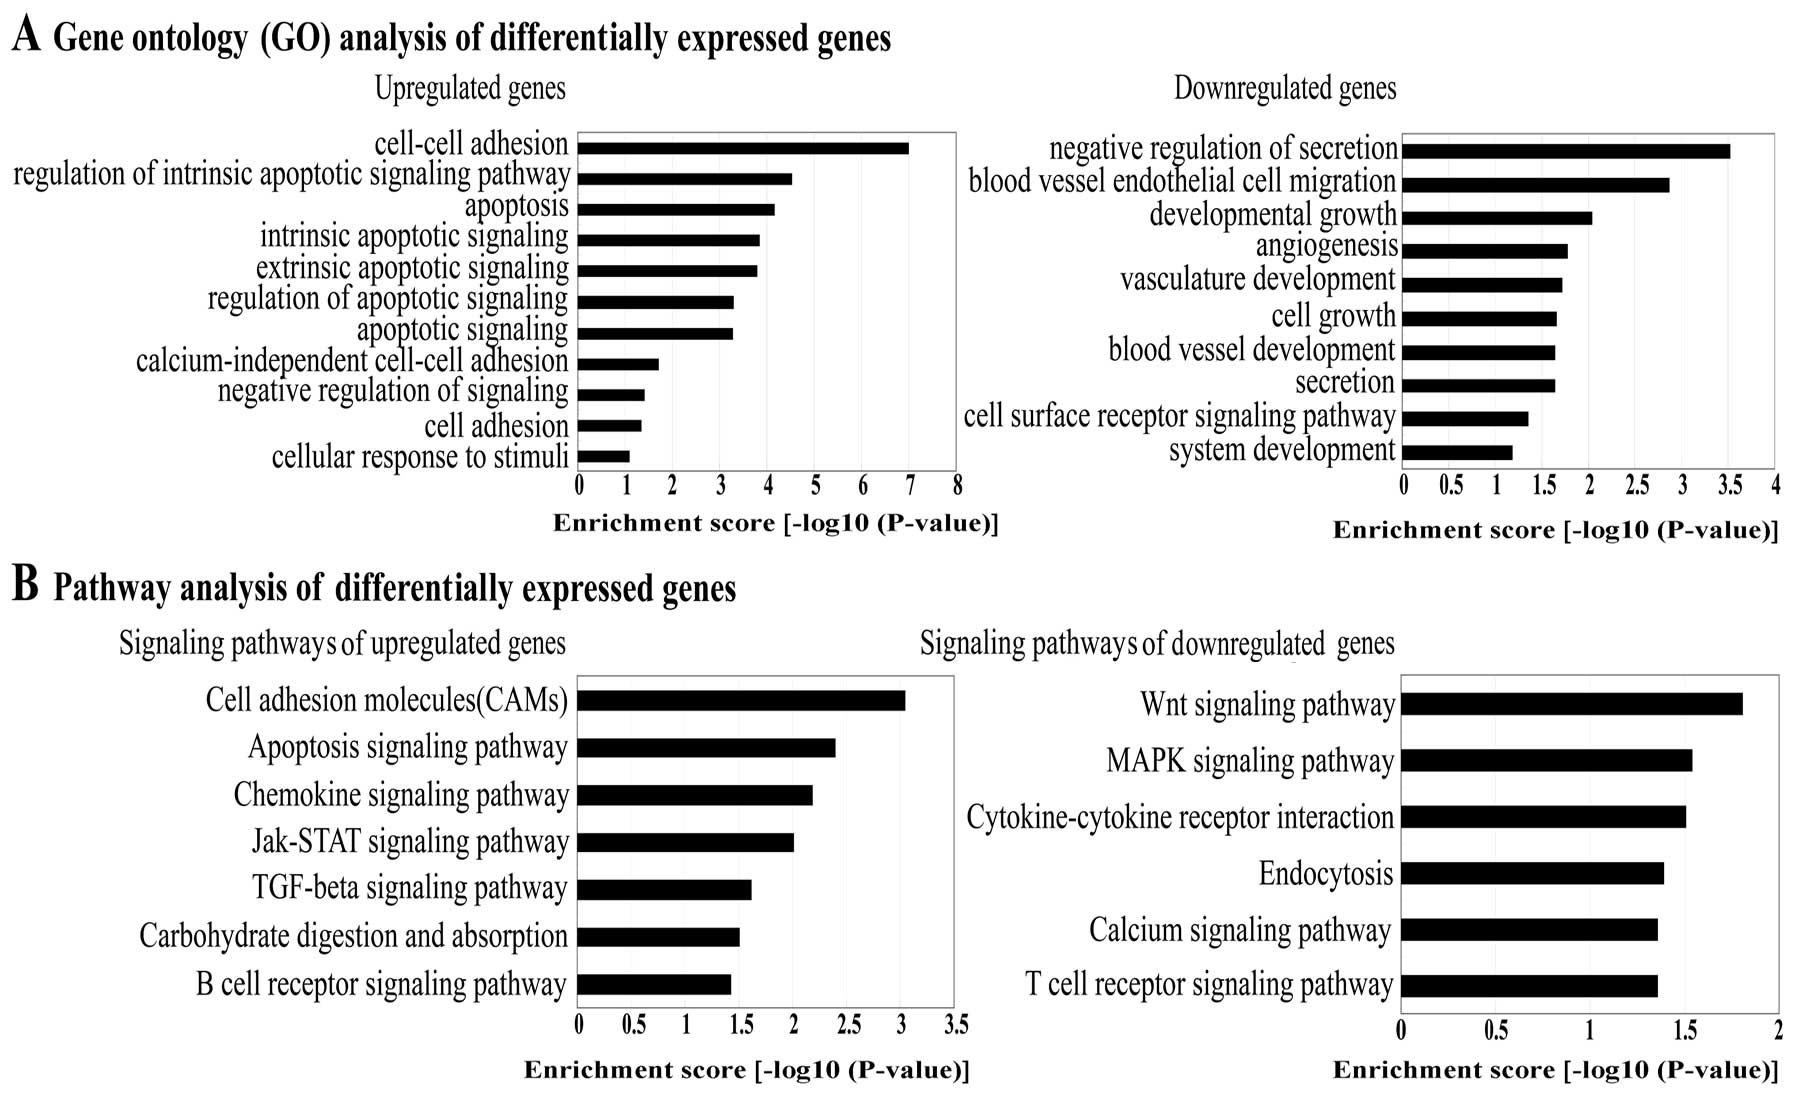
Gene Ontology (GO) analysis and signaling
pathway analysis of differentially expressed genes
In order to identify the activated pathways present
in BMECs treated with sera from patients with LC, functional
categories of the differentially expressed genes were identified
using GO analysis. The GO categories are derived from Gene Ontology
(www.geneontology.org), which comprises 3
structured networks of defined terms to describe gene product
attributes. An enrichment score which is equal to -log10 p-value
denotes the significance of GO term enrichment in the
differentially expressed gene list. The lower the enrichment score
is, the more significant the GO term (p<0.05). The most
significant functional categories of the genes were as follows: a
large number of upregulated genes were involved in processes, such
as cell-cell adhesion, apoptosis and cellular response to stimuli
and the downregulated genes were involved in the negative
regulation of secretion, angiogenesis, blood vessel development and
cell growth (Fig. 1A).
Based on the latest Kyoto Encyclopedia of Genes and
Genomes (KEGG) database, we carried out pathway analysis of the
differentially expressed genes. The results revealed the pathways
with the highest enrichment scores as follows: the upregulated
genes were either cell adhesion molecules, or involved in the
chemokine signaling pathway, Jak-STAT signaling pathway, TGFB
signaling pathway, carbohydrate digestion and absorption and the B
cell receptor signaling pathway. The downregulated genes were
involved in the Wnt signaling pathway, MAPK signaling pathway,
cytokine-cytokine receptor interaction, endocytosis, calcium
signaling pathway and the T cell receptor signaling pathway
(Fig. 1B). The upregulated genes
were either cell adhesion molecules, or involved in the apoptotic
signaling pathway (Table IV) and
the downregulated genes were involved in the Wnt signaling pathway
and MAPK signaling pathway (Table
V) which had the highest enrichment scores and greatest
statistical significance (p<0.05).
| Table IVPathways of upregulated genes |
Table IV
Pathways of upregulated genes
| Gene name | Gene ID | Description | Fold change | Function (GO
analysis) |
|---|
| Cell adhesion
molecules |
| ALCAM | 214 | Activated leukocyte
cell adhesion molecule | 2.11 | Cell adhesion |
| ICAM1 | 3383 | Intercellular
adhesion molecule 1 | 3.18 | Cell-cell
adhesion |
| CDH1 | 999 | Cadherin 1, type 1,
E-cadherin | 2.41 | Cell adhesion |
| CDH3 | 1001 | Cadherin 3, type 1,
P-cadherin | 4.66 | Cell adhesion,
response to stimuli |
| CDH5 | 1003 | Cadherin 5, type 2,
VE-cadherin | 2.39 | Cell adhesion |
| CLDN1 | 9076 | Claudin 1 | 2.00 | Calcium-independent
cell-cell adhesion |
| CLDN14 | 23562 | Claudin 14 | 2.35 | Calcium-independent
cell-cell adhesion |
| CLDN3 | 1365 | Claudin 3 | 2.13 | Calcium-independent
cell-cell adhesion |
| CLDN4 | 1364 | Claudin 4 | 2.04 | Calcium-independent
cell-cell adhesion |
| CLDN7 | 1366 | Claudin 7 | 3.11 | Calcium-independent
cell-cell adhesion |
| CLDN9 | 9080 | Claudin 9 | 2.44 | Calcium-independent
cell-cell adhesion |
| SELPLG | 6404 | Selectin P
ligand | 3.17 | Cell adhesion |
| HLA-DQB1 | 3119 | Major
histocompatibility complex, class II, DQ beta 1 | 2.11 | Cell adhesion |
| HLA-DRB1 | 3123 | Major
histocompatibility complex, class II, DR beta 1 | 2.15 | Cell adhesion,
immune response |
| ICOSLG | 23308 | Inducible T-cell
co-stimulator ligand | 4.26 | Cell adhesion,
defense response |
| NCAM2 | 4685 | Neural cell
adhesion molecule 2 | 2.67 | Cell adhesion |
| PVRL2 | 5819 | Poliovirus
receptor-related 2 | 2.04 | Cell adhesion |
| Apoptotic signaling
pathway |
| AKT1 | 207 | v-akt murine
thymoma viral oncogene homolog 1 | 2.68 | Cell apoptosis |
| PIK3R1 | 5295 |
Phosphoinositide-3-kinase, regulatory
subunit 1 | 2.18 | Immune
response |
| PIK3R2 | 5296 |
Phosphoinositide-3-kinase, regulatory
subunit 2 | 2.15 | Negative regulation
of anti-apoptosis |
| PIK3R3 | 8503 |
Phosphoinositide-3-kinase, regulatory
subunit 3 | 3.05 | Response to
stimuli |
| DFFB | 1677 | DNA fragmentation
factor, beta polypeptide | 2.52 | Cell apoptosis |
| MYD88 | 4615 | Myeloid
differentiation primary response gene (88) | 5.12 | Cell apoptosis |
| PRKACA | 5566 | Protein kinase,
cAMP-dependent, catalytic, alpha | 3.47 | Protein amino acid
phosphorylation |
| TRADD | 8717 | TNFRSF1A-associated
via death domain | 2.22 | Cell apoptosis |
| Table VPathways of downregulated genes. |
Table V
Pathways of downregulated genes.
| Gene name | Gene ID | Description | Fold change | Function (GO
analysis) |
|---|
| Wnt signaling
pathway |
| CSNK2A1 | 1457 | Casein kinase 2,
alpha 1 polypeptide | −2.06 | Regulation of
signaling |
| PLCB2 | 5330 | Phospholipase C,
beta 2 | −3.10 | Signal
transduction |
| PORCN | 64840 | Porcupine
homolog | −2.80 | Signal
transduction |
| PPP3CA | 5530 | Protein phosphatase
3, catalytic subunit, alpha isoform | −2.34 | Cellular
developmental process |
| PPP3R1 | 5534 | Protein phosphatase
3, regulatory subunit B, alpha isoform | −2.05 | Blood vessel
development |
| PPP3R2 | 5535 | Protein phosphatase
3, regulatory subunit B, beta isoform | −2.59 | Blood vessel
development |
| PSEN1 | 5663 | Presenilin 1 | −2.17 | Cellular
developmental process |
| TCF7 | 6932 | Transcription
factor 7 | −2.25 | Cellular
developmental process |
| WNT11 | 7481 | Wingless-type MMTV
integration site family, member 11 | −2.02 | Blood vessel
development |
| WNT3 | 7473 | Wingless-type MMTV
integration site family, member 3 | −2.12 | Cellular
developmental process |
| MAPK signaling
pathway |
| CACNA1G | 8913 | Calcium channel,
voltage-dependent, alpha 1G subunit | −2.62 | Cellular
developmental process |
| DUSP6 | 1848 | Dual specificity
phosphatase 6 | −2.14 | Developmental
growth |
| DUSP8 | 1850 | Dual specificity
phosphatase 8 | −3.23 | Signal
transduction |
| EGFR | 1956 | Epidermal growth
factor receptor | −2.01 | Signal
transduction |
| FGF22 | 27006 | Fibroblast growth
factor 22 | −2.09 | Cellular
developmental process |
| IL1A | 3552 | Interleukin 1,
alpha | −2.04 | Blood vessel
development |
| MOS | 4342 | v-mos Moloney
murine sarcoma viral oncogene homolog | −15.86 | Cell cycle |
| NF1 | 4763 | Neurofibromin
1 | −2.91 | Blood vessel
development |
| NTRK1 | 4914 | Neurotrophic
tyrosine kinase, receptor, type 1 | −4.27 | Blood vessel
development |
| PLA2G2F | 64600 | Phospholipase A2,
group IIF | −2.73 | Cellular lipid
metabolic process |
| RASGRP1 | 10125 | RAS guanyl
releasing protein 1 | −2.61 | Cellular lipid
metabolic process |
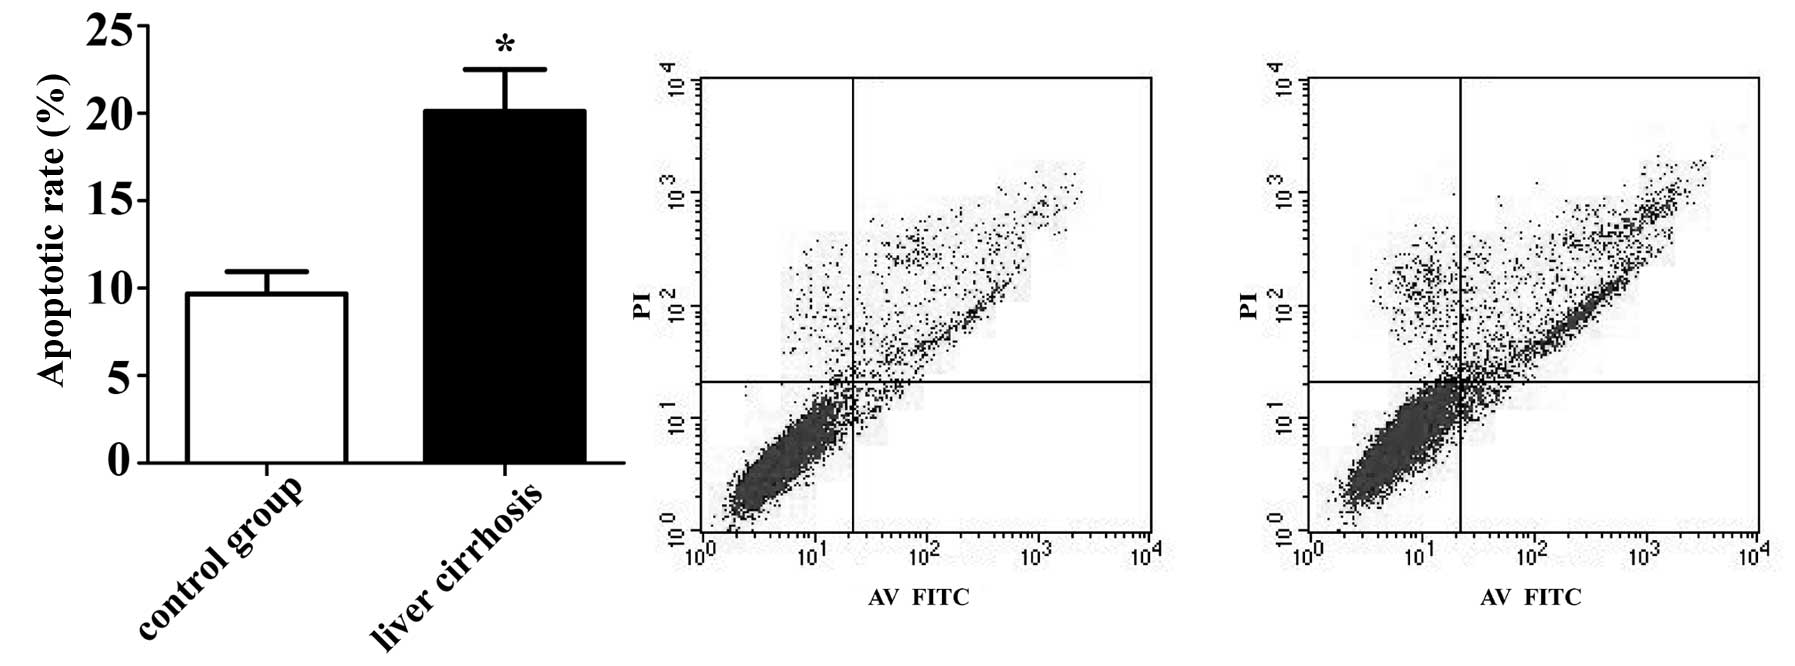
Apoptosis assay of BMECs treated with
sera from patients with LC
The results of flow cytometry analysis revealed that
the BMECs treated with sera from patients with LC had a higher
percentage of apoptosis (20.12±2.39%) compared with the control
group (9.68±1.28%) following cultured for 48 h (p<0.05)
(Fig. 2). These results suggest
that serum from patients with LC induces BMEC apoptosis, which
confirms the accuracy of bioinformatic analysis.
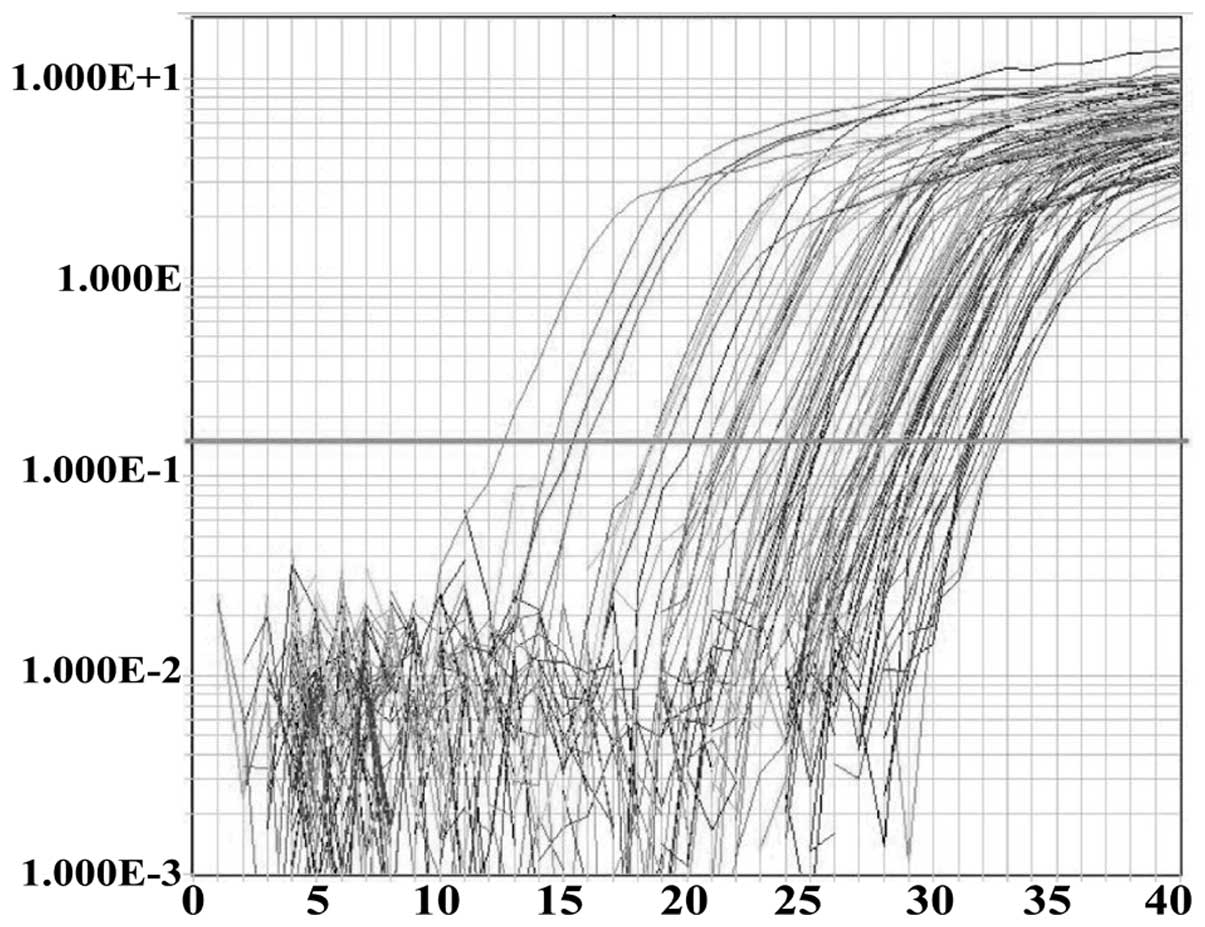
Human Cytokines RT2 Profiler
PCR array
In order to investigate the cytokines abnormal
expressed by human BMECs following treatment with the pooled sera
from patients with LC for 48 h, the Human Cytokines RT2
Profiler PCR array was carried out to detect the mRNA expression of
84 important cytokines. The typical amplification curves from the
sample of BMECs treated with sera from patients with LC analyzed by
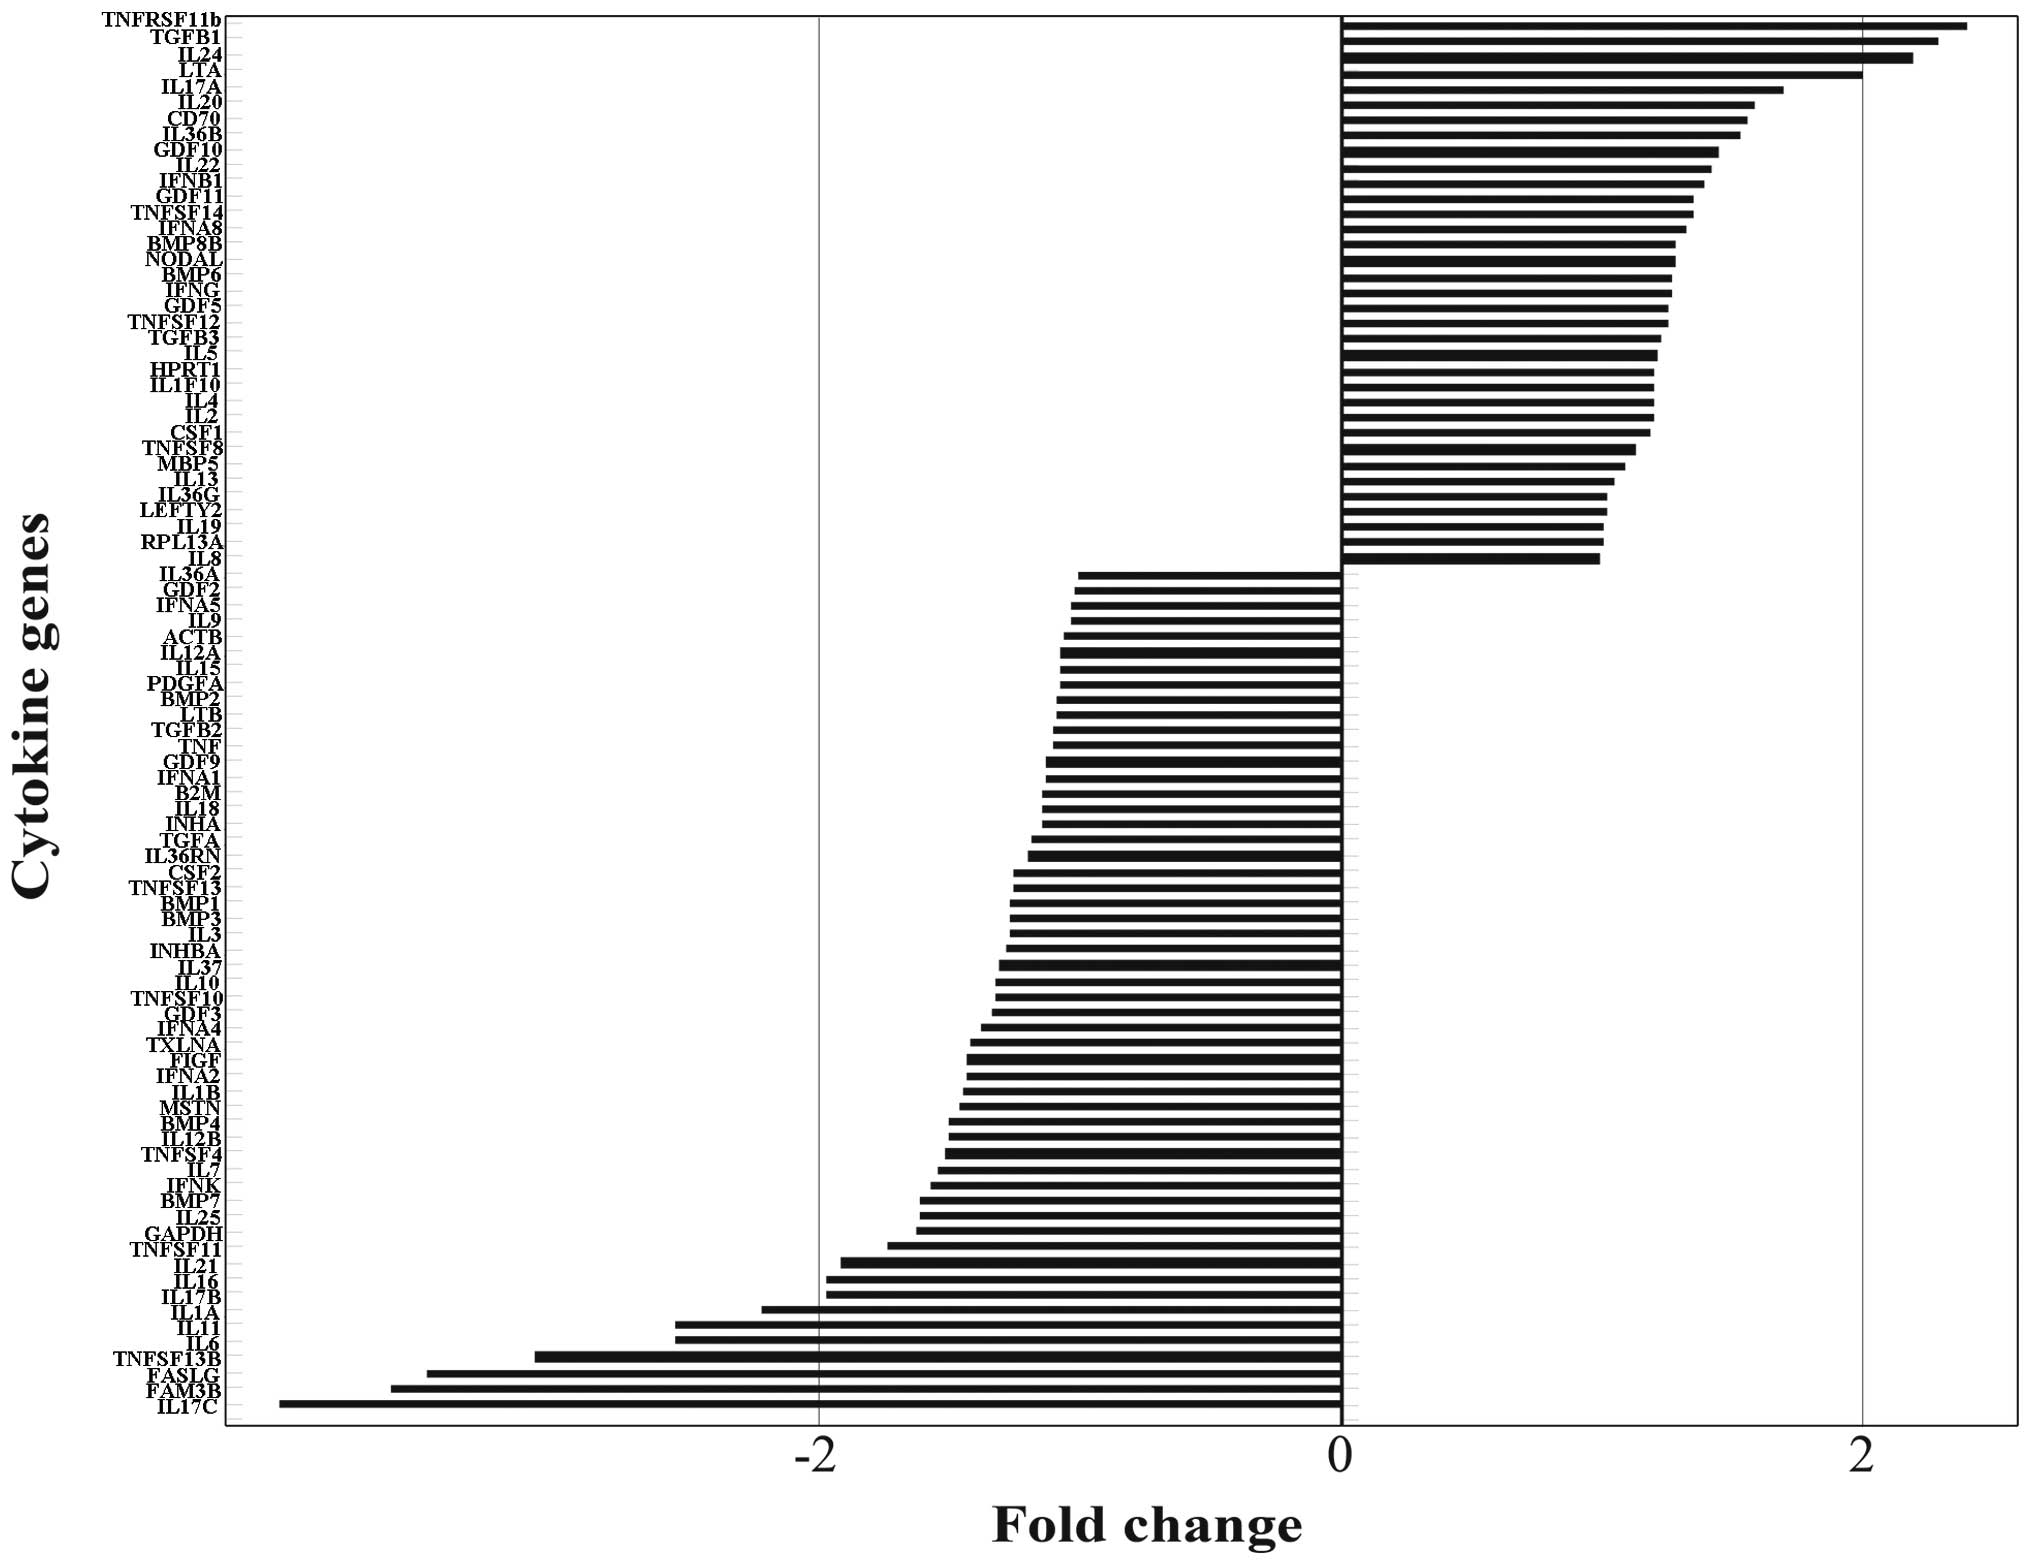
RT-PCR are shown in Fig. 3. To
identify the differentially expressed genes, we performed fold
change filtering between the 2 samples. The threshold is a fold
change ≥2.0 or ≤-2.0. The results revealed that TGFB1, TNFB, IL24
and TNF receptor superfamily, member 11b (TNFRSF11B) were
upregulated (fold change ≥2.0) and IL1A, IL6, IL11, IL17C, family
with sequence similarity 3, member B (FAM3B), Fas ligand (FASLG)
and TNF (ligand) superfamily, member 13b (TNFSF13B) were
downregulated (fold change ≤-2.0) in the BMECs treated with sera
from patients with LC (Fig.
4).
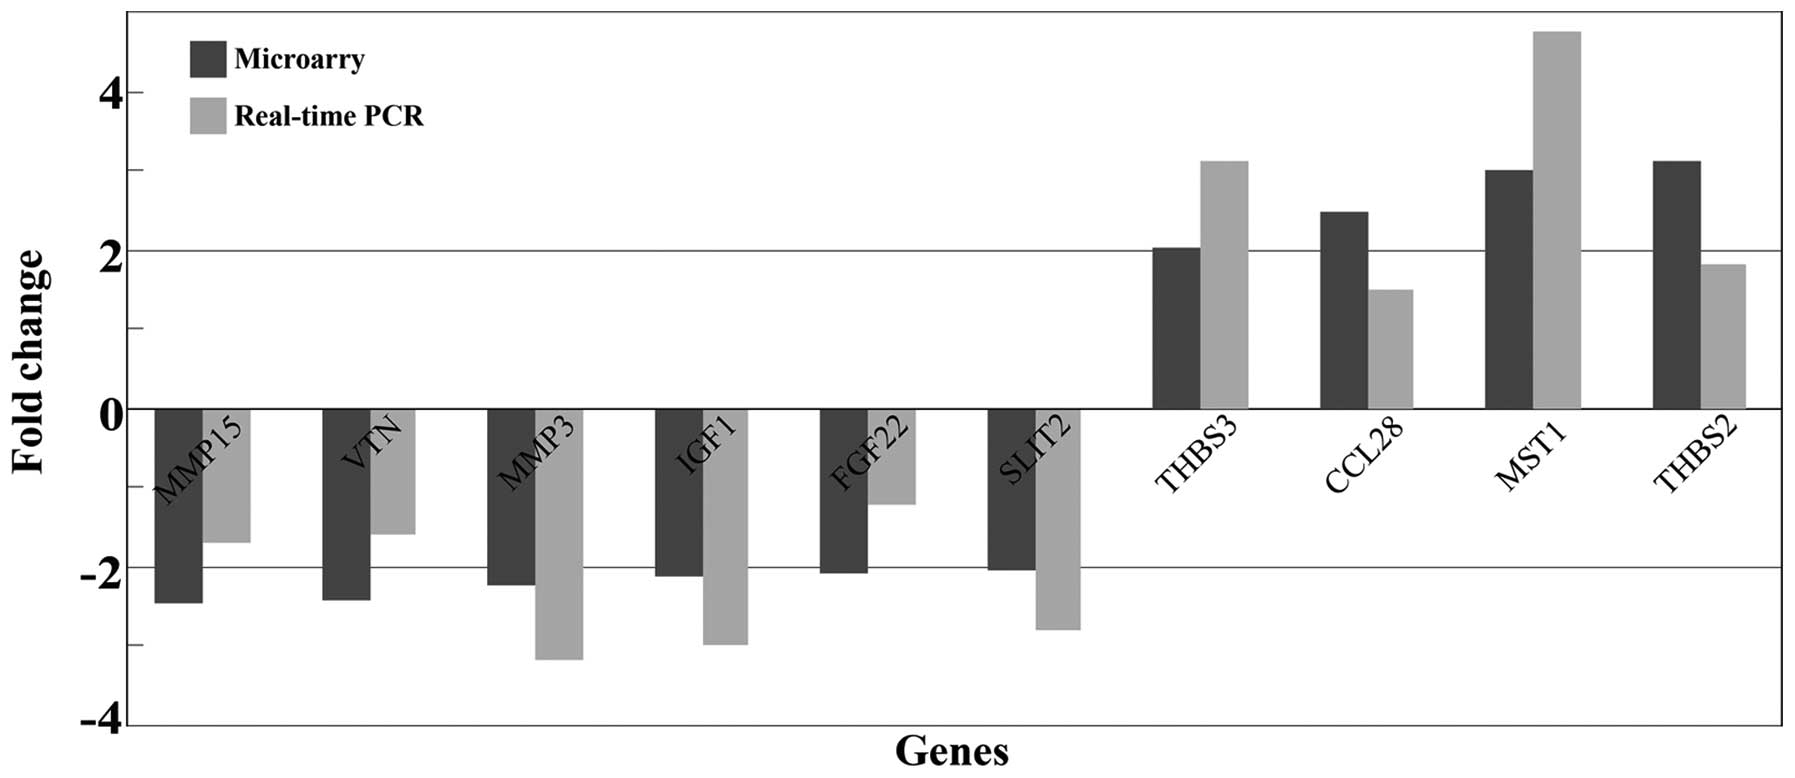
Supplementary screening and validating of
cytokine genes by whole genome microarray analysis and qRT-PCR
In order to detect more differentially expressed
cytokine genes in the BMECs treated with sera from patients with
LC, we also screened 13 genes (cytokines, chemokines and growth
factors) which were not identified as differentially expressed
genes in the whole genome microarray (Table VI). In order to confirm the
accuracy of the results, qRT-PCR was carried out to validate the 13
genes. The results revealed that 10 of the 13 differently expressed
genes were consistent with the data from microarray analysis. The
fold changes of those 10 gene expressions, as determined by whole
genome microarray and qRT- PCR, are presented in Fig. 5.
| Table VISupplementary analysis of
differentially expressed genes (cytokines, chemokines and growth
factors) in the whole genome microarray. |
Table VI
Supplementary analysis of
differentially expressed genes (cytokines, chemokines and growth
factors) in the whole genome microarray.
| Gene name | Gene ID | Fold change | Gene
description |
|---|
| Upregulation |
| CCL28 | 56477 | 2.46 | Chemokine ligand
28 |
| GDNF | 2668 | 2.16 | Glial cell derived
neurotrophic factor |
| THBS2 | 7058 | 3.11 | Thrombospondin
2 |
| LIF | 3976 | 2.32 | Leukemia inhibitory
factor |
| THBS3 | 7059 | 2.01 | Thrombospondin
3 |
| MST1 | 4485 | 3.02 | Macrophage
stimulating 1 |
| Downregulation |
| MMP15 | 4324 | −2.46 | Matrix
metallopeptidase 15 |
| FGF22 | 27006 | −2.09 | Fibroblast growth
factor 22 |
| MMP3 | 4314 | −2.22 | Matrix
metallopeptidase 3 |
| SLIT2 | 9353 | −2.03 | Slit homolog 2 |
| IGF1 | 3479 | −2.12 | Insulin-like growth
factor 1 |
| CCL4L2 | 388372 | −3.63 | Chemokine ligand
4-like 2 |
| VTN | 7448 | −2.41 | Vitronectin |
Differentially expressed cytokine genes
and bone marrow haemopoiesis
The Human Cytokines RT2 Profiler PCR
array, whole genome microarray and qRT-PCR were carried out to
screen and verify 21 differentially expressed cytokine genes
[TGFB1, TNFB, TNFRSF11B, TNFSF13B, IL1A, IL6, IL11, IL17C, IL24,
FAM3B, FASLG, matrix metallopeptidase (MMP)3, MMP15, vitronectin
(VTN), insulin-like growth factor 1 (IGF1), fibroblast growth
factor 22 (FGF22), slit homolog 2 (Drosophila) (SLIT2),
thrombospondin (THBS)2, THBS3, chemokine (C-C motif) ligand 28
(CCL28) and macrophage stimulating 1 (MST1)] from 97 cytokine genes
in the BMECs treated with sera from patients with LC. After
retrieving a large number of literature on the functions of the 21
differentially expressed cytokines during bone marrow hemopoiesis
in PubMed and then analyzing these results, we found that the
hemopoiesis-stimulating factors, IL1A, IL6, IL11 and IGF1 were
downregulated, whereas the hemopoiesis-inhibitory factors, TGFB1,
TNFB and MST1 were upregulated.
Discussion
LC refers to multiple organ and system disorder,
including the kidneys, brain and other organs induced by extensive
inflammatory reactions and damage to hepatic functions (18). Clinical trials and experimental
studies have shown that the humoral inhibitors in the sera of
patients with LC can affect hematopoietic tissue by acting on
erythroid differentiation (19).
In our previous study, in vivo experiments revealed that the
important components of the bone marrow microenvironment (BMECs) in
patients with LC and mice with LC underwent changes after CCL4
induction (7). In order to
further investigate the effects of LC on BMECs, in this study, we
carried out whole genome expression profiling to detect
differentially expressed genes in human BMECs treated with pooled
sera from patients with LC or sera from healthy volunteers as the
control group. The results revealed that 1,106 genes were
upregulated and 766 genes were downregulated. The results from GO
analysis and pathway analysis indicated that the important
upregulated genes were involved in processes such as cell adhesion,
cellular response to stimuli and cell apoptosis and these genes
were mainly either cell adhesion molecules or involved in the
apoptotic pathway; the important downregulated genes were involved
in blood vessel endothelial cell migration, cell surface receptor
signaling, vasculature development and secretion and these genes
mainly belonged to the Wnt and MAPK pathways. Moreover, apoptosis
assay confirmed that the humoral inhibitors in the sera of patients
with LC induced the apoptosis of BMECs.
The pathway of cell adhesion molecules involves the
high expression of selectin P ligand (SELPLG), intercellular
adhesion molecule 1 (ICAM1), cadherin (CDH)1, CDH3, CDH5 and other
cell adhesion genes. SELPLG is the most well-investigated
P-selectin glycoprotein ligand and it belongs to the adhesion
molecule family for granulocytes, platelets and endothelial cell
adhesion, which can promote the incidence of inflammatory reactions
and vascular lesions (20,21).
ICAM1 is expressed at relatively low levels in normal BMECs and its
overexpresion indicates damage or the activation of endothelial
cells (21–23). CDH1, CDH3 and CDH5 belong to the
cadherin family, among which CDH5 (VE-cadherin) plays important
roles in regulating the stability and integrity of the vascular
endothelium (24). It can
coordinate some signals, inhibit the growth of vascular cells and
decrease their permeability (25). The overexpression of these
adhesion molecules indicates that the blood pathogenic factors of
LC may lead to changes in BMECs.
The expression levels of protein kinase,
cAMP-dependent, catalytic, alpha (PRKACA or PKA), DNA fragmentation
factor, 40 kDa, beta polypeptide (caspase-activated DNase) (DFFB),
myeloid differentiation primary response 88 (MYD88),
TNFRSF1A-associated via death domain (TRADD) and other genes in the
apoptotic pathway increased. PKA can function in promoting
endothelial cell apoptosis and inhibiting vascularization. Kim
et al found that PKA inhibition can promote vascular
endothelial formation (26). DFFB
is a type of nucleotidase expressed during genomic DNA
fragmentation in cell apoptosis. The overexpression of DFFB
indicates an increase in apoptosis (27). MYD88 negatively regulates cell
growth in several hematopoietic and non-hematopoietic cell types,
including growth inhibition and apoptosis (28). TRADD can continuously recruit TNF,
Fas and other cytokines to induce cell death (29). More importantly, the results of
flow cytometry analysis suggested that sera from patients with LC
induced BMEC apoptosis; these results ares consistent with the
results of bioinformatic analysis.
The downregulated genes, such as wingless-type MMTV
integration site family, member 3 (Wnt3), wingless-type MMTV
integration site family, member 11 (Wnt11) and presenilin (PSEN)
are involved in the Wnt pathway. The Wnt pathway plays important
roles in cell formation and angiogenesis. Wnt3 can regulate
endothelial cell proliferation and angiogenesis by inducing Nanog
transcription (30). Zhou et
al found that Wnt11 played important roles in regulating
cardiac formation. Wnt11 signaling can regulate the morphogenesis
of the cardiac outflow tract by affecting extracellular matrix
formation, cytoskeletal reorganization and polarized cell migration
(31). PSEN1 can regulate the
proliferation and differentiation of endothelial progenitor cells,
and the functional loss of PSEN1 in the endothelial cell lineage
may induce vascular diseases (32). The downregulation of these
angiogenesis-promoting genes in the Wnt pathway indicates that the
humoral inhibitors in the sera of patients with LC may affect the
capacity of BMECs for angiogenesis.
Epidermal growth factor receptor (EGFR), calcium
channel, voltage-dependent, T type, alpha 1G subunit (CACNA1G),
v-mos Moloney murine sarcoma viral oncogene homolog (Mos) and other
genes in the MAPK pathway are expressed at low levels. The MAPK
pathway is associated with promoting vascular endothelial
proliferation and angiogenesis. EGFR plays a key role in
maintaining the functions of endothelial cells and endothelial
cells are unable to grow after the knockout of the EGFR gene
(33). Angiotensin II can induce
CACNA1G expression by the AT1 receptor, Ras and MEK in endothelial
cells, and CACNA1G can mediate angiotensin II to promote
endothelial cell migration (34).
Mos is a type of proto-oncogene encoding serine and tyrosine
kinases and it can regulate the cell cycle in meiosis (35). The low expression levels of these
genes in the MAPK pathway indicates that the pathogenic factors of
LC may affect the angiogenic capacity of BMECs and cell growth.
In addition to the above, a more important result
was found in our experiments. The Human Cytokines RT2
Profiler PCR array, whole genome microarray analysis and qRT-PCR
were carried out to screen and verify 21 differentially expressed
cytokine genes from 97 detected cytokine genes in BMECs following
treatment for 48 h with pooled sera from patients with LC. Of note,
further analysis on these differentially expressed genes indicated
that the positive hematopoietic factors, IL1A, IL6, IL11 and IGF1,
were expressed at a low levels, while the negative hematopoietic
factors, TGFB1, TNFB and MST1, were expressed at high levels.
As shown above, BMECs are extremely important
components of the bone marrow microenvironment, and they constitute
a barrier between the bone marrow microenvironment and peripheral
blood circulation (8). They are
in direct contact with blood and are exposed to the environment
with pathogenic factors for LC; on the other hand, they function as
cytoskeletal components to support the adhesion of HSPCs in the
bone marrow microenvironment (9).
More importantly, they secrete cytokines to the bone marrow
microenvironment by paracrine secretion, which regulates
positioning, homing, proliferation and the differentiation of HSPCs
(10). The results of the Human
Cytokines RT2 Profiler PCR array and the whole genome
microarray revealed that the positive hematopoietic factors, ILA1,
IL6, IL11 and IGF1, secreted by BMECs were expressed at low levels
following treatment with pooled sera from patients with LC; these
factors all have functions in promoting hematopoiesis; for
instance, IL1A has several functions, and it can regulate
hematopoiesis by inducing the release of other active molecules or
coordinating thrombopoietin (TPO) (36). As for IL6, Bernad et al
found that IL6 can promote growth and the self-renewal of
hematopoietic stem cells and early hematopoietic progenitor cells
(11). In vivo and in
vitro experiments have shown that IL11 can exert effects on
several types of hematopoietic cells, and previous studies have
shown that the in vivo hematopoietic functions of IL11 are
significant, and that it can significantly stimulate the platelet
count in the peripheral blood of normal animals or animals with
bone marrow depression (12).
Although IGF1 is not a classical hematopoietic growth factor, it
can promote the maturation of erythroid cells and the proliferation
of erythroid progenitor cells. Furthermore, IGF1 can promote heme
synthesis and acidophilic erythroblast enucleation (37).
Moreover, we also found that the mRNA levels of the
negative hematopoietic factors, TGFB1, TNFB and MST1, were
expressed at high levels following treatment with sera from
patients with LC; these factors have functions in inhibiting
hematopoiesis. For example, TGFB1 is not only an important mediator
of LC, but also a negative hematopoietic regulatory factor which
can directly inhibit the proliferation of early hematopoietic stem
cells (13,38). As for TNFB, Skobin et al
found that TNFB can inhibit the growth of erythroid cells,
granulocytes and megakaryoblasts (39). Broxmeyer et al (40) reported that MST1 can coordinate
with stimulating factors for early hematopoietic progenitor cells
and significantly inhibit the proliferation of early hematopoietic
progenitor cells. Cheng et al found that MST1 secreted by
BMECs had significant inhibitory activities on hematopoietic
progenitor cells (41).
In conclusion, adhesion molecules and apoptotic
pathways were expressed at high levels in BMECs treated with sera
from patients with LC, and the Wnt pathway and MAPK pathway, which
promote vascularization and endothelial cell proliferation were
expressed at low levels. Moreover, apoptosis was induced in the
BMECs treated with sera from patients with LC. These results
indicate that the humoral inhibitors in the sera of patients with
LC may damage BMECs, affect their growth and induce cell apoptosis.
Moreover, the positive hemopoietic factors secreted by BMECs
treated with sera from patients with LC were downregulated, and the
negative hemopoietic factors were upregulated, which may lead to a
disturbance in the bone marrow microenvironment and the dysfunction
of HSPCs, finally causing abnormalities in hematological indices in
patients with LC. This phenomenon may be one of the important
reasons for hematological abnormalities in patients with LC, and
may provide novel therapeutic targets for scientific researches and
clinical trials in the future.
Acknowledgements
This study was supported by a grant from the
National Natural Science Foundation of China (811170397).
References
|
1
|
Qamar AA, Grace ND, Groszmann RJ, et al:
Incidence, prevalence and clinical significance of abnormal
hematological indices in compensated cirrhosis. Clin Gastroenterol
Hepatol. 7:689–695. 2009. View Article : Google Scholar : PubMed/NCBI
|
|
2
|
Qamar AA and Grace ND: Abnormal
hematological indices in cirrhosis. Can J Gastroenterol.
23:441–445. 2009.PubMed/NCBI
|
|
3
|
Rois R, Sangro B, Herrero I, et al: The
role of thrombopoietin in the thrombocytopenia of patients with
live cirrhosis. Am J Gastroenterol. 100:1131–1136. 2005.
|
|
4
|
Sheehy T and Berman A: The anemia of
cirrhosis. J Lab Clin Med. 56:72–82. 1960.
|
|
5
|
Sullivan LW and Herbert V: Suppression of
hematopoiesis by ethanol. J Clin Invest. 43:2048–2062. 1964.
View Article : Google Scholar : PubMed/NCBI
|
|
6
|
Rosenfeld SJ and Young NS: Viruses and
bone marrow failure. Blood Rev. 5:71–77. 1991. View Article : Google Scholar
|
|
7
|
Zhao S, Fu YM, Zhang WH, et al:
Alterations of bone marrow sinusoidal endothelium in rat and
patients with liver cirrhosis. Dig Dis Sci. 55:654–661. 2010.
View Article : Google Scholar : PubMed/NCBI
|
|
8
|
Kopp HG, Avecilla ST, Hooper AT and Rafii
S: The bone marrow vascular niche: home of HSC differentiation and
mobilization. Physiology. 20:349–356. 2005. View Article : Google Scholar : PubMed/NCBI
|
|
9
|
Rafii S, Shapiro F, Rimarachin J, et al:
Isolation and characterization of human bone marrow microvascular
endothelial cells: hematopoietic progenitor cell adhesion. Blood.
84:10–19. 1994.PubMed/NCBI
|
|
10
|
Li WM, Huang WQ, Wang QR, et al: Positive
and negative haematopoietic cytokines produced by bone marrow
endothelial cells. Cytokine. 12:1017–1023. 2000. View Article : Google Scholar : PubMed/NCBI
|
|
11
|
Bernad A, Kopf M, Kulbacki R, et al:
Interleukin-6 is required in vivo for the regulation of stem cells
and committed progenitors of the hematopoietic system. Immunity.
1:725–731. 1994. View Article : Google Scholar : PubMed/NCBI
|
|
12
|
Schwertschlag US, Trepicchio WL, Dykstra
KH, et al: Hematopoietic, immunomodulatory and epithelial effects
of interleukin-11. Leukemia. 13:1307–1315. 1999. View Article : Google Scholar : PubMed/NCBI
|
|
13
|
Sitnicka E, Ruscetti FW, Priestley GV, et
al: Transforming growth factor beta 1 directly and reversibly
inhibits the initial cell divisions of long-term repopulating
hematopoietic stem cells. Blood. 88:82–88. 1996.PubMed/NCBI
|
|
14
|
Fossati G, Mazzucchelli I, Gritti D, et
al: In vitro effects of GM-CSF on mature peripheral blood
neutrophils. Int J Mol Med. 1:943–951. 1998.
|
|
15
|
Kramann R, Couson SK, Neuss S, et al:
Uraemia disrupts the vascular niche in a 3D co-culture system of
human mesenchymal stem cells and endothelial cells. Nephrol Dial
Transplant. 27:2693–2702. 2012. View Article : Google Scholar : PubMed/NCBI
|
|
16
|
Tjandra SS, Hsu C, Goh YI, et al: IFN-beta
signaling positively regulates tumorigenesis in aggressive
fibromatosis, potentially by modulating mesench-ymal progenitors.
Cancer Res. 67:7124–7131. 2007. View Article : Google Scholar : PubMed/NCBI
|
|
17
|
Livak KJ and Schmittgen TD: Analysis of
relative gene expression data using real-time quantitative PCR and
the 2(-Delta Delta C(T)) Method. Methods. 25:402–408. 2001.
View Article : Google Scholar : PubMed/NCBI
|
|
18
|
Bataller R and Brenner DA: Liver fibrosis.
J Clin Invest. 115:209–218. 2005. View
Article : Google Scholar
|
|
19
|
Ruhenstroth-Bauer G: The role of humoral
splenic factors in the formation and release of blood cells. Semin
Hematol. 2:229–248. 1965.PubMed/NCBI
|
|
20
|
Kansas GS: Selectins and their ligands:
current concepts and controversies. Blood. 88:3259–3287.
1996.PubMed/NCBI
|
|
21
|
Wagner DD and Frenette PS: The vessel wall
and its interactions. Blood. 111:5271–5281. 2008. View Article : Google Scholar : PubMed/NCBI
|
|
22
|
Schweitzer CM, van der Schoot CE, Drager
AM, et al: Isolation and culture of human bone marrow endothelial
cells. Exp Hematol. 23:41–48. 1995.PubMed/NCBI
|
|
23
|
Pigott R, Dillon LP, Hemingway IH and
Gearing AJ: Soluble forms of E-selectin, ICAM-1 and VCAM-1 are
present in the supernatant of cytokine activated cultured
endothelial cells. Biochem Biophys Res Commun. 187:584–589. 1992.
View Article : Google Scholar : PubMed/NCBI
|
|
24
|
Dejana E and Giampietro C: Vascular
endothelial-cadherin and vascular stability. Curr Opin Hematol.
19:218–223. 2012. View Article : Google Scholar : PubMed/NCBI
|
|
25
|
Le Guelte A and Gavard J: Role of
endothelial cell-cell junctions in endothelial permeability.
Methods Mol Biol. 763:265–279. 2011.PubMed/NCBI
|
|
26
|
Kim S, Bakre M, Yin H and Varner JA:
Inhibition of endothelial cell survival and angiogenesis by protein
kinase A. J Clin Invest. 110:933–941. 2002. View Article : Google Scholar : PubMed/NCBI
|
|
27
|
Widlak P: The DFF40/CAD endonuclease and
its role in apoptosis. Acta Biochim Pol. 47:1037–1044.
2000.PubMed/NCBI
|
|
28
|
Liebermann DA and Hoffman B: MyD genes in
negative growth control. Oncogene. 17:3319–3329. 1998. View Article : Google Scholar : PubMed/NCBI
|
|
29
|
Shakibaei M, Schulze-Tanzil G, Takada Y
and Aggarwal BB: Redox regulation of apoptosis by members of the
TNF superfamily. Antioxid Redox Signal. 7:482–496. 2005. View Article : Google Scholar : PubMed/NCBI
|
|
30
|
Kohler EE, Cowan CE, Wary KK, et al: NANOG
induction of fetal liver kinase-1 (FLK1) transcription regulates
endothelial cell proliferation and angiogenesis. Blood.
117:1761–1769. 2011. View Article : Google Scholar : PubMed/NCBI
|
|
31
|
Zhou W, Lin L, Evans SM, et al: Modulation
of morphogenesis by noncanonical Wnt signaling requires ATF/CREB
family-mediated transcriptional activation of TGFβ2. Nat Genet.
39:1225–1234. 2007.PubMed/NCBI
|
|
32
|
Nakajima M, Ogawa M, Shimoda Y, et al:
Presenilin-1 controls the growth and differentiation of endothelial
progenitor cells through its beta-catenin-binding region. Cell Biol
Int. 30:239–243. 2006. View Article : Google Scholar : PubMed/NCBI
|
|
33
|
Mustonen T and Alitalo K: Endothelial
receptor tyrosine kinases involved in angiogenesis. J Cell Biol.
129:895–898. 1995. View Article : Google Scholar : PubMed/NCBI
|
|
34
|
Zhou C and Wu S: T-type calcium channels
in pulmonary vascular endothelium. Microcirculation. 13:645–656.
2006. View Article : Google Scholar : PubMed/NCBI
|
|
35
|
van der Velden AW and Thoma AA: The role
of the 5 untranslated region of an mRNA in translation regulation
during development. Int J Biochem Cell Biol. 31:87–106.
1999.PubMed/NCBI
|
|
36
|
Broxmeyer HE and Williams DE: The
production of myeloid blood cells and their regulation during
health and disease. Crit Rev Oncol Hematol. 8:173–226. 1988.
View Article : Google Scholar : PubMed/NCBI
|
|
37
|
Zumkeller W: The insulin-like growth
factor system in hematopoietic cells. Leuk Lymphoma. 43:487–491.
2002. View Article : Google Scholar : PubMed/NCBI
|
|
38
|
Doh KO, Jung HK, Moon IJ, Kang HG, Park JH
and Park JG: Prevention of CCl4-induced liver cirrhosis by ribbon
antisense to transforming growth factor-β1. Int J Mol Med.
21:33–39. 2008.PubMed/NCBI
|
|
39
|
Skobin V, Jelkmann W, Morschakova E, et
al: Tumor necrosis factor-alpha and TNF-beta inhibit clonogenicity
of mobilized human hematopoietic progenitors. J Interferon Cytokine
Res. 20:507–510. 2000. View Article : Google Scholar : PubMed/NCBI
|
|
40
|
Broxmeyer HE, Cooper S, Li ZH, et al:
Macrophage-stimulating protein, a ligand for the RON receptor
protein tyrosine kinase, suppresses myeloid progenitor cell
proliferation and synergizes with vascular endothelial cell growth
factor and members of the chemokine family. Ann Hematol. 73:1–9.
1996. View Article : Google Scholar
|
|
41
|
Cheng LM and Wang QR: Hematopoietic
inhibitors elaborated by bone marrow endothelial cells. Zhongguo
Shi Yan Xue Ye Xue Za Zhi. 10:485–491. 2002.(In Chinese).
|