Introduction
Membranous nephropathy (MN) is a renal disease that
is histologically characterized by the uniform thickening of the
glomerular capillary wall. This is caused by subepithelial deposits
of immune complexes, which appear as granular deposits of
immunoglobulin G when visualized using immunofluorescence, and as
an electron-dense deposit when observed under an electron
microscope. MN is a frequent cause of nephrotic syndrome in adults
and can eventually progress to end-stage renal failure in many
patients (1–3). The MN disease site is the glomerular
visceral epithelial cell, or podocyte, which is a highly
specialized and terminally differentiated cell that is found on the
outside of the glomerular basement membrane (4). The disease, similar to most immune
glomerular diseases, manifests itself as an immune response to the
self-antigens expressed on the podocyte cell membrane (5). There is no specific treatment for
MN. Diuretics and angiotensin-converting enzyme inhibitors have
limited effects, whilst immunosuppressants cause side-effects and
their use in treatment is controversial (6).
Currently, the diagnosis of kidney disease depends
mainly on renal biopsy and immunofluorescence (7). There is an urgent need for a
validated biomarker that is easy to measure and able to accurately
predict long-term outcomes, to aid both in the diagnosis and
treatment of the disease (8). The
clinical management of patients with MN may improve with the better
understanding of the underlying mechanisms of the disease and the
availability of biomarkers.
microRNAs (miRNAs) regulate gene expression and have
been found to modulate crucial biological processes, including
differentiation, proliferation and apoptosis (9). They function through various
mechanisms, such as targeted miRNA degradation and translational
inhibition (10,11). Hundreds of miRNAs have been
identified, using molecular cloning and bioinformatics prediction
strategies, in worms, flies, fish, frogs, mammals and flowering
plants (12). Several studies
have indicated a possible link between miRNAs and kidney disease
(13–15). Although the expression results of
the various array analyses are inconsistent, the data indicate that
the dysregulation of miRNAs may play a pivotal role in the
pathogenesis of kidney disease. However, there have been few
studies on the association between miRNAs and MN. In this study, we
analyzed the pathogenesis of MN at the miRNA level. Next generation
high-throughput sequencing is an effective technique that enables
miRNA profiling at unprecedented quantitative and qualitative
levels (16). The data presented
in this study may enhance our knowledge of miRNA expression
profiles in patients with MN, and may provided insight into the
pathogenesis, diagnosis and treatment of MN.
Patients and methods
Patient samples
Peripheral blood samples were collected from 30
patients at the Second Clinical Medical College, Jinan University,
Shenzhen People’s Hospital (Shenzhen, China) between 2011 and 2012.
The diagnosis of MN was confirmed by renal biopsy and
immunofluorescence. Thirty specimens for the control group were
obtained from individuals who underwent annual body check-ups and
were confirmed as healthy in 2012, at Shenzhen People’s
Hospital.
Prior written informed consent was obtained from all
patients. The project was approved by the Shenzhen People’s
Hospital Ethics Committee. This study was performed in accordance
with the guidelines of Jinan University, which abides by the
Helsinki Declaration on ethical principles for medical research
involving human subjects.
Sample processing
Samples were collected in EDTA tubes and then
transferred to depletion filters to separate the lymphocytes, in
accordance with the LeukoLock Total RNA isolation system protocol
(Ambion, Austin, TX, USA). Total RNA was extracted from the cells
using the miRNeasy Mini kit (Qiagen, Hilden, Germany), in
accordance with the manufacturer’s instructions. The integrity of
the RNA and the presence of miRNAs were assessed by micro-capillary
electrophoresis, using an RNA 6000 kit and small RNA kit (Agilent
Technologies Inc., Santa Clara, CA, USA), respectively. The
concentration and quality of the RNA were assessed by absorbance
spectrometry on a NanoDrop 2000 spectrophotometer (Thermo, Waltham,
MA, USA).
miRNA microarray
miRNA microarrays, composed of 455 human, 236 rat
and 344 mouse miRNAs, were used to detect all human, rat, mouse and
other miRNAs in the Sanger miRNA database (release 8.1). This study
used miRNA power labeling (Exiqon, Vedbaek, Denmark) to 3′- or
5′-end label 0.5 μl of a sample or a human universal reference
total RNA, with the cy3-like HY3 or cy5-like HY5 dye, respectively.
Locked nucleic acids (LNAs) were used, as their superior
sensitivity over conventional DNA-based miRNA arrays can
discriminate between closely related miRNA family members.
miRNA microarray analysis
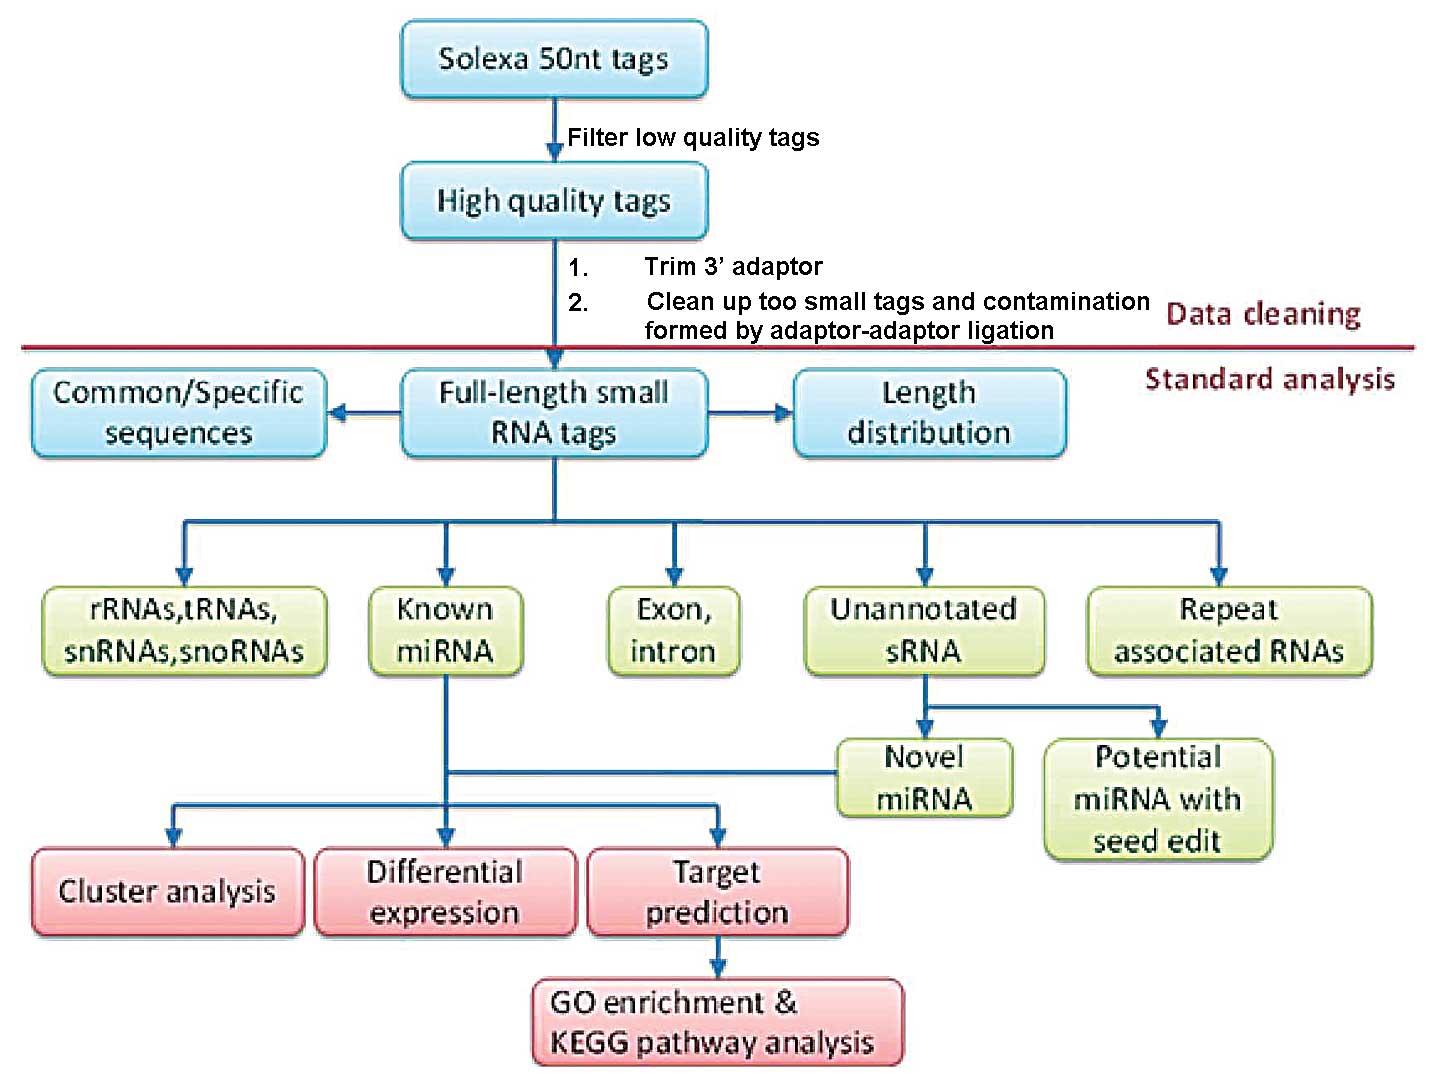
To create an MN library and normal control (NC)
library, total miRNAs from each subject underwent miRNA library
construction and sequencing. The process is illustrated in Fig. 1. The 50 nucleotide sequence tags
used for the high-throughput sequencing were obtained through data
cleansing to remove low quality tags and several types of
contaminants. The length distribution of the clean tags was
summarized and used in a standard bioinformatics analysis. The
clean tags were annotated and placed into different categories to
predict novel miRNAs and edit known miRNAs. The tags that could not
be annotated were placed in a separate category.
Statistical analysis
Statistical analyses were performed after the
libraries were established. The miRNAs were mapped to the genome
and a summary was produced for the known miRNA alignments. Cluster
analysis, differential expression and base edit analysis were
performed for the miRNAs.
Quantitative reverse transcription PCR
(qRT-PCR) verification of miRNA results
qRT-PCR was performed to verify the results of the
deep sequencing analysis for 5 differentially expressed miRNAs.
Total RNA (2 μg) was reverse transcribed into cDNA using a reverse
transcription kit, in accordance with the manufacturer’s
instructions (Promega, Madison, WI, USA). The cycle parameters for
the PCR reaction were as follows: 95°C for 5 min followed by 40
cycles of a denaturing step at 95°C for 10 sec and an extension
step at 60°C for 60 sec. All reactions were run in triplicate. The
relative quantification 2−ΔΔCt method was used to
determine the changes in expression levels between the MN and NC
groups. The miRNA expression levels were normalized to the
reference RNA, RUN6. The −ΔΔCt values were calculated using the
following formula: −ΔΔCt = −Ct(MN − NC), where Ct is the
cycle threshold provided by the Rotor-Gene 6000 Series Software 1.7
(Qiagen).
Results
Small RNA expression and distribution in
each genome
High-throughput sequencing produced 11,436,003 and
18,696,751 high quality sequence reads from the MN and NC groups,
respectively. Following the removal of the contaminated reads, the
total number of clean, small RNA reads was 11,109,127 and
16,001,191, in the MN and NC groups, respectively. The number of
unique small RNAs was 154,580 in the MN group and 1,034,806 in the
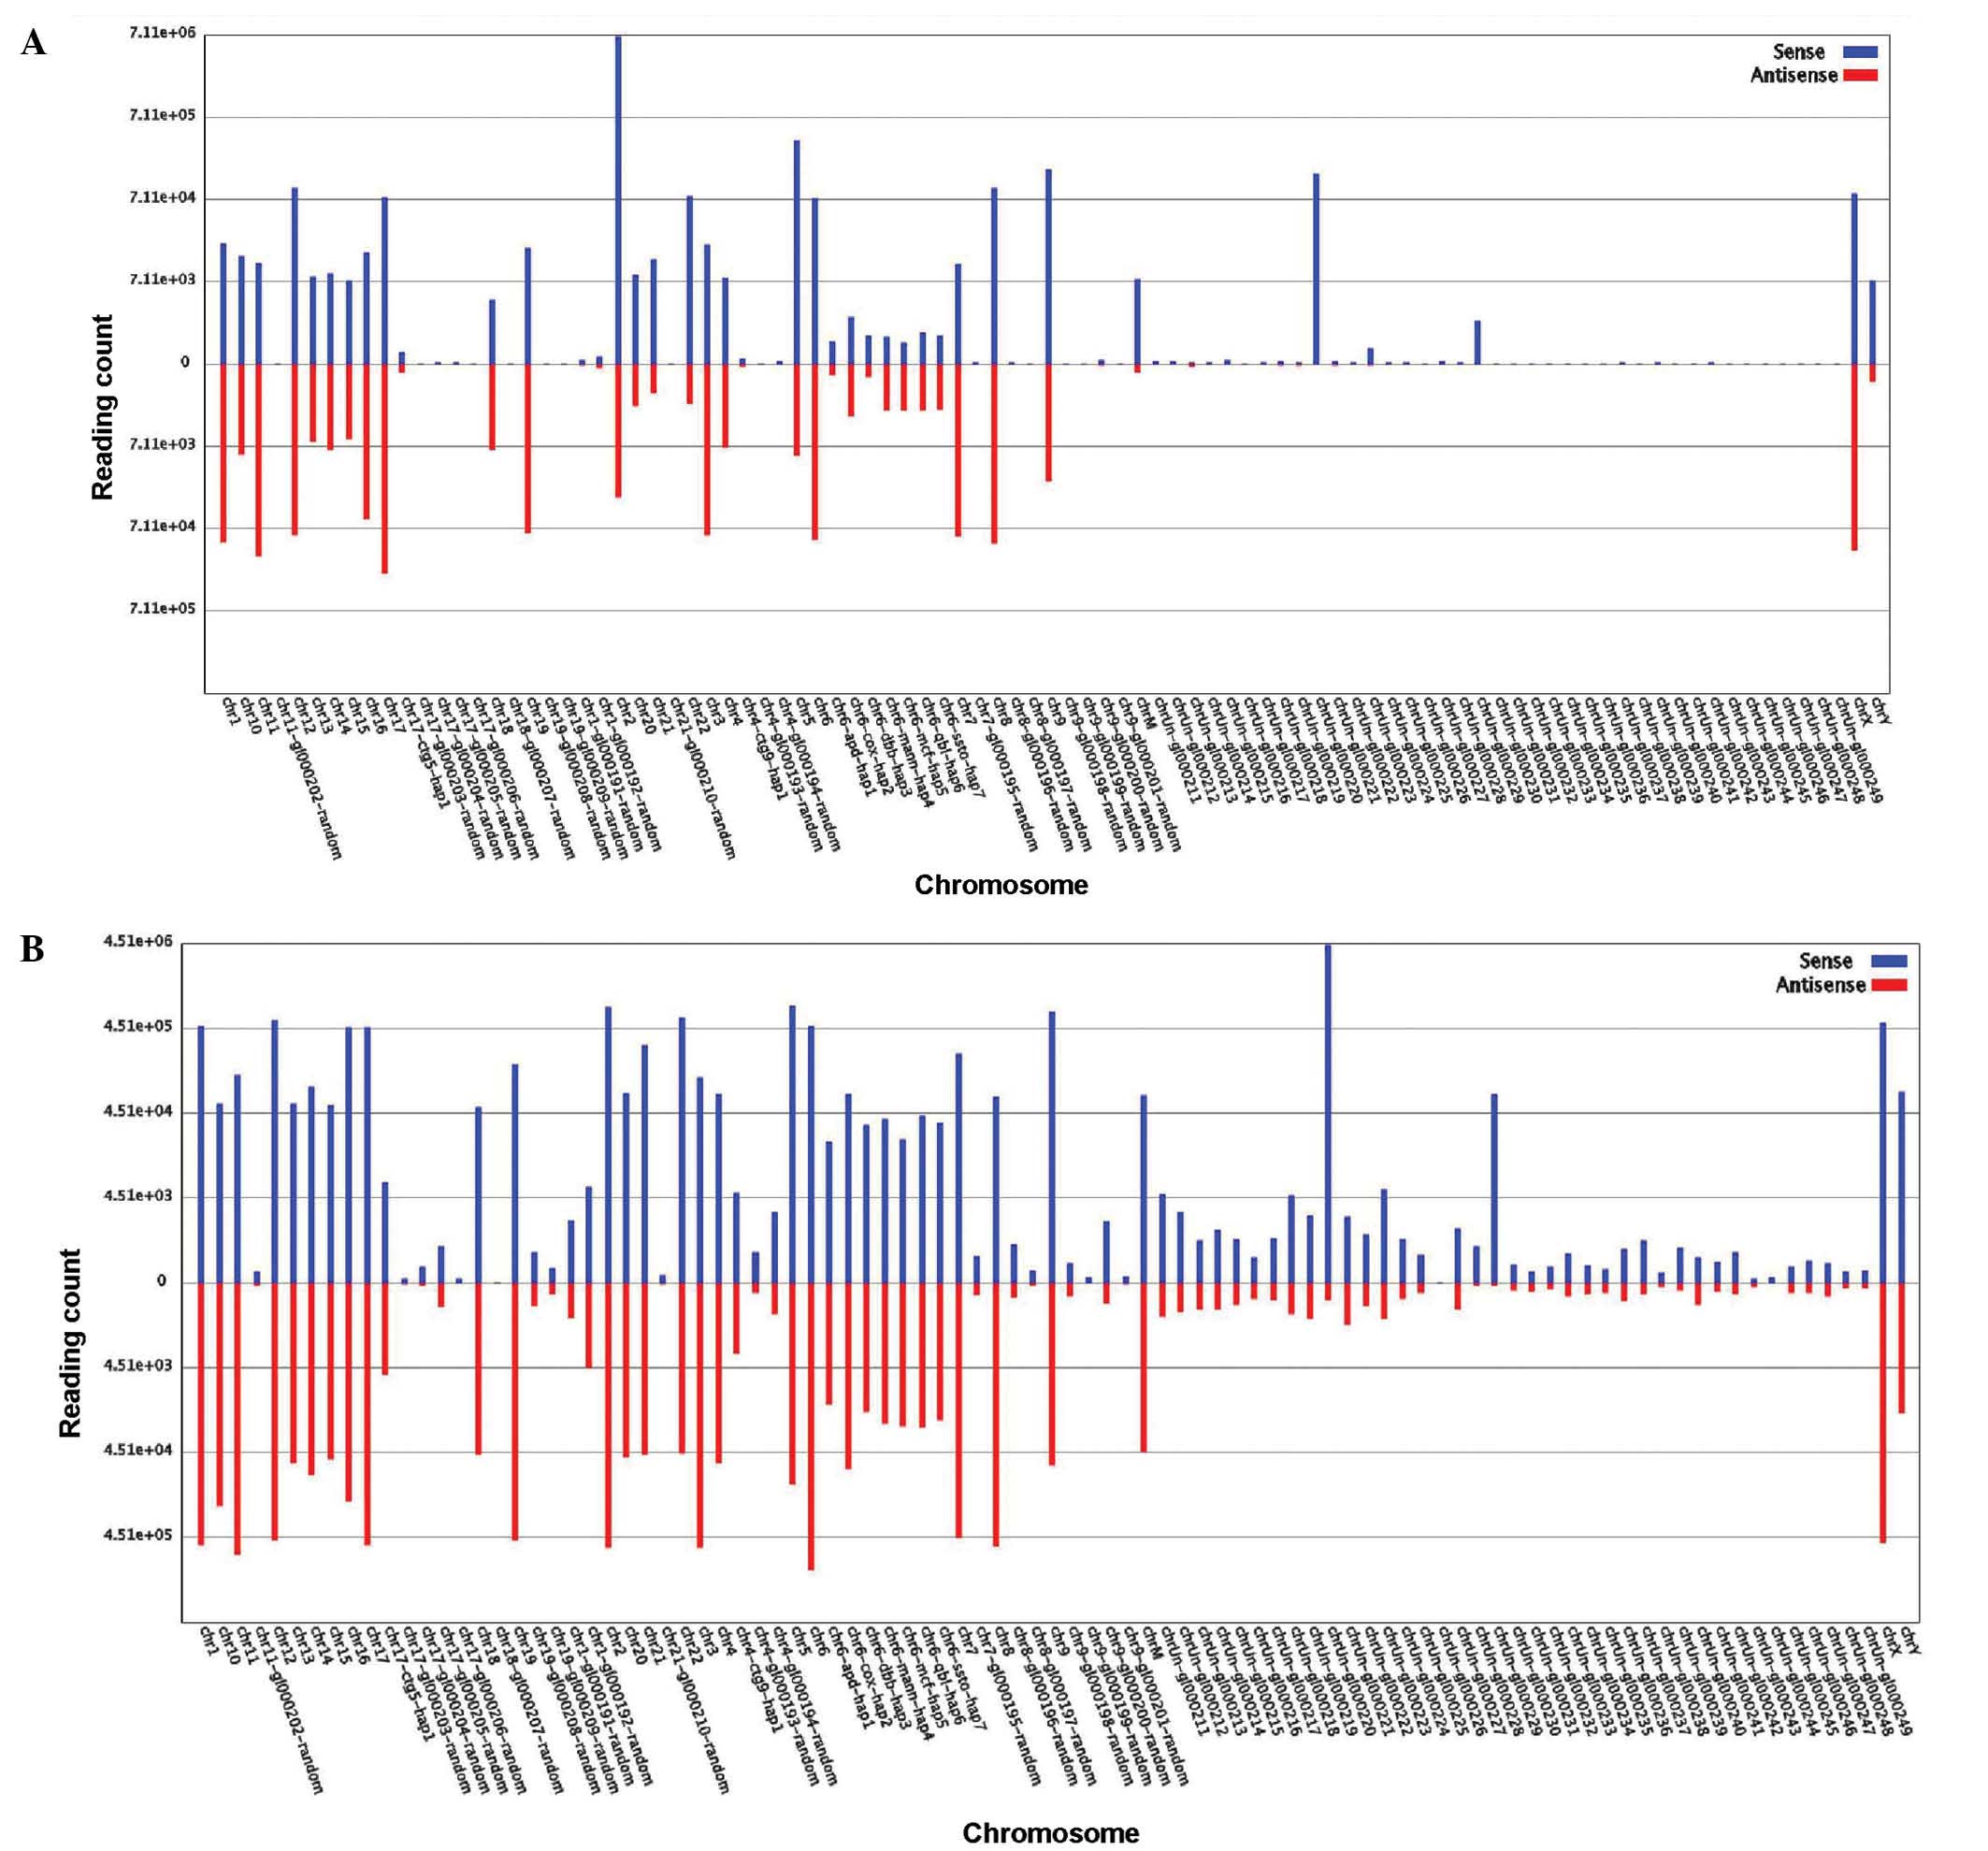
NC group. The small RNA tags were mapped to the genome using the
short oligonucleotide alignment program (SOAP) program, as
previously described (17), to
analyze their expression and distribution. The results are
presented in Table I. The
percentage of unique small RNAs mapped to the genome in the NC
group was 52.10%, which was greater than the 25% observed for the
MN group. By contrast, the MN percentage for the total small RNAs
was 85.00%, whilst for the NC group the value was 83.10%. Fig. 2 shows the number of small RNA tags
that were located on each chromosome and the comparison between the
MN and NC groups.
 | Table IMapping of unique small RNAs and
total small RNAs to the genome. |
Table I
Mapping of unique small RNAs and
total small RNAs to the genome.
| Unique
sRNAsa | Total sRNAsb |
|---|
|
|
|
|---|
| MN | NC | MN | NC |
|---|
| Total sRNAs | 154,580 | 1,034,806 | 11,109,127 | 16,001,191 |
| Mapping to the
genome | 38,577 | 539,279 | 9,445,450 | 13,301,445 |
| Percentage
(%)c | 25.00 | 52.10 | 85.00 | 83.10 |
Summary of known miRNA alignments
We aligned the small RNAs to miRNA precursors in the
corresponding species to obtain the miRNA count. This also allowed
the identification of bases at each position within the miRNAs. The
results are shown in Table II.
The percentage occurence of each base (A/U/C/G; A, adenine, U,
uracil, C, cytosine, D, guanine) at each position in the small RNAs
was calculated. A large variation was observed between the MN and
NC groups. For example, 83.99% of the bases in the second position
were A in the MN group. Only 22.99% of the bases at this position
were A in the NC group. Significant differences were also observed
at the 9th base (10.10% U in the MN group, 63.04% U in the NC
group) and 14th base (83.09% C in the MN group, 16.62% C in the NC
group). However, some similarities were observed between the two
groups at base positions 1, 6, 10, 12, 13, 15, 17, 18, 22, 23 and
24. At these positions, the most common base was the same in each
group. The outcomes are depicted in Fig. 3.
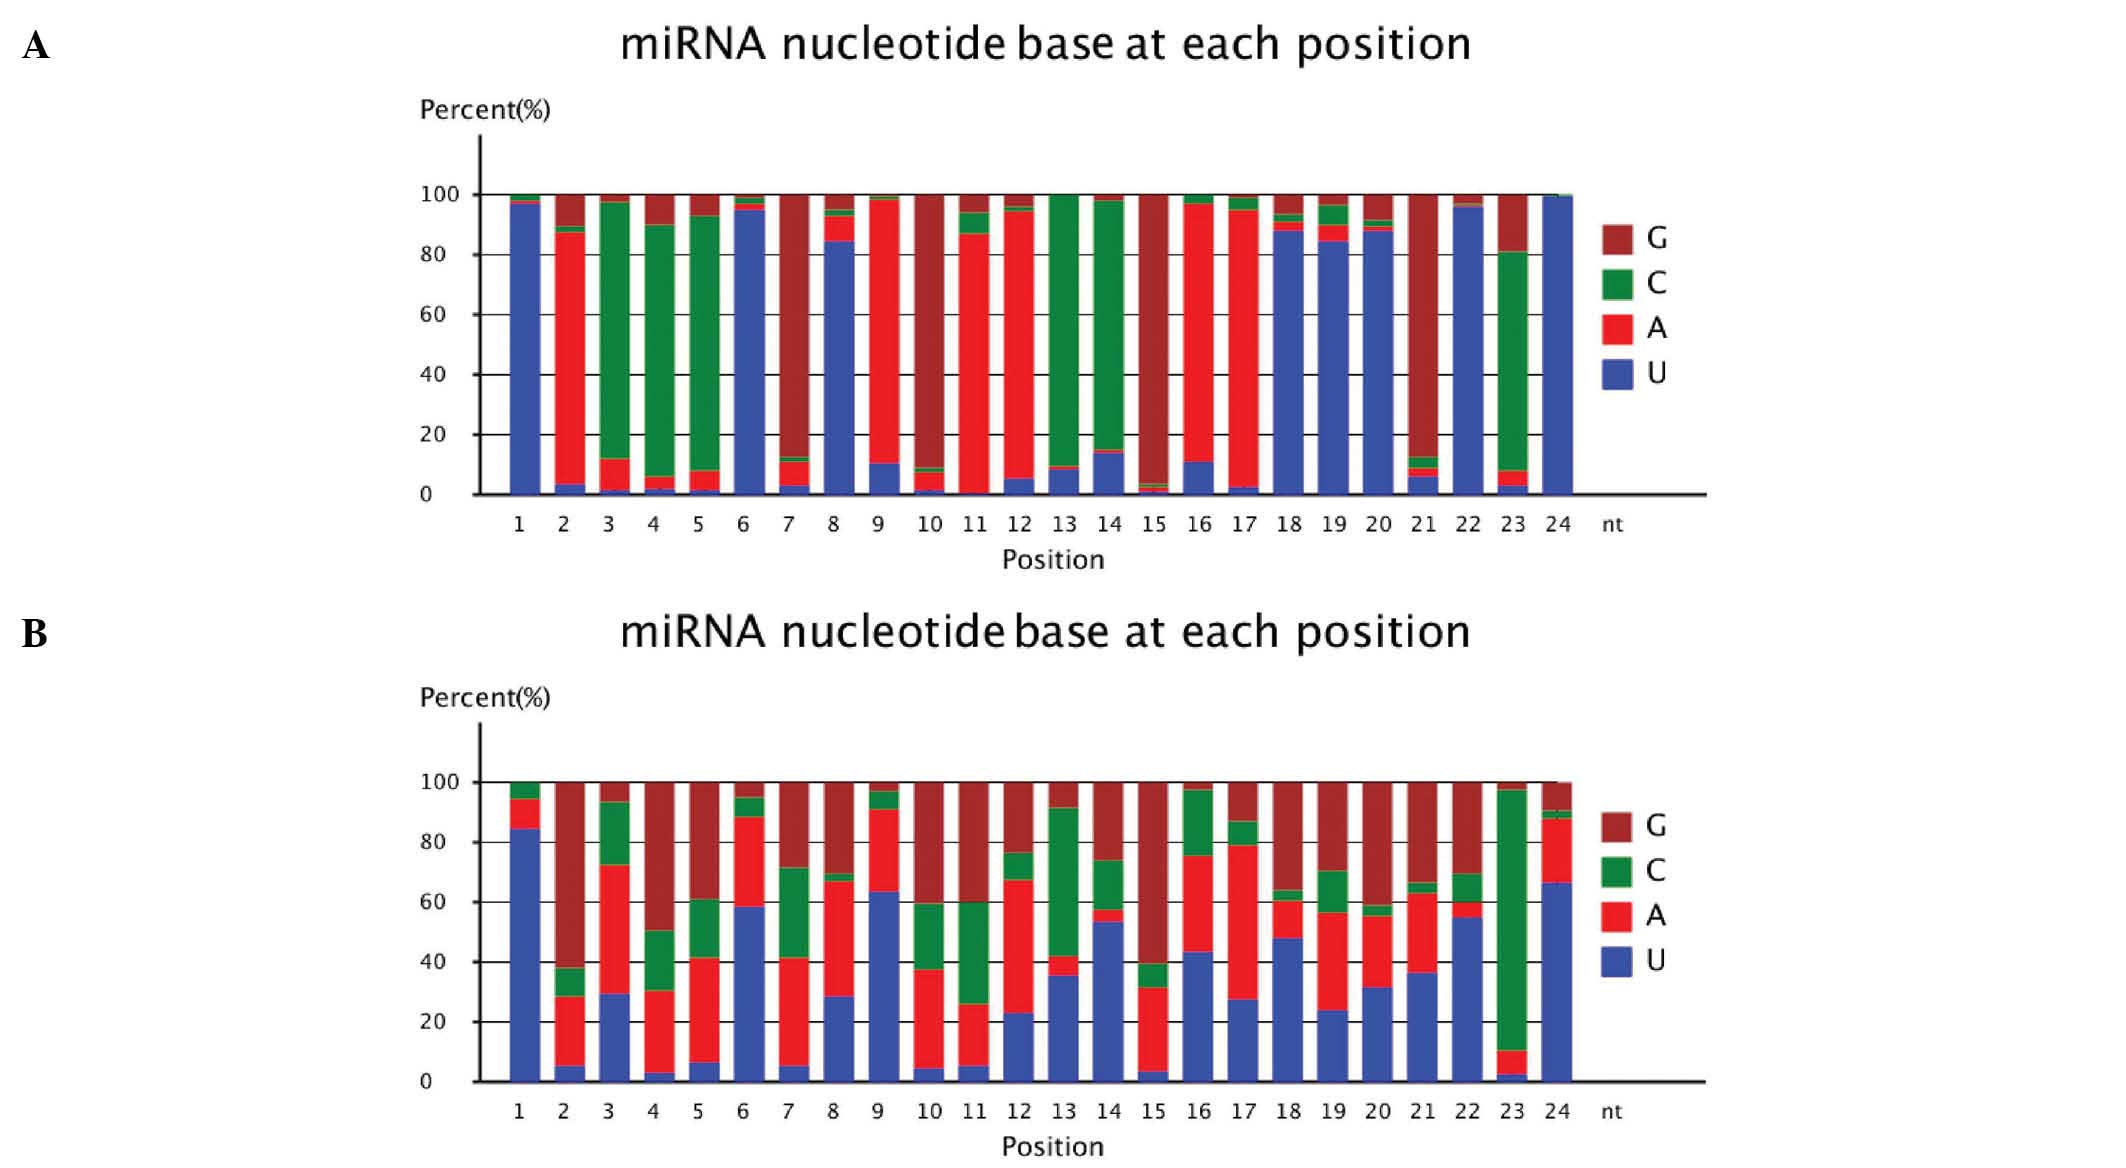 | Figure 3MicroRNA (miRNA) nucleotide base
(A/U/C/G) at each position in (A) the membranous nephropathy (MN)
and (B) normal control (NC) groups. The percentge of different
nucleotide bases at each position. Brown represents G, green
represents C, red represents A, blue represents U. A, adenine, U,
uracil, C, cytosine, D, guanine. |
| Table IIPercentage occurence of each base
(A/U/C/G) at each position in the sRNAs in the MN and NC group. |
Table II
Percentage occurence of each base
(A/U/C/G) at each position in the sRNAs in the MN and NC group.
| A, MN group |
|---|
|
|---|
| Position on
sRNA | A (%) | U (%) | C (%) | G (%) |
|---|
| 1 | 0.90 | 96.61 | 2.40 | 0.09 |
| 2 | 83.99 | 3.11 | 2.01 | 10.89 |
| 3 | 10.41 | 1.42 | 85.66 | 2.51 |
| 4 | 3.96 | 1.95 | 83.73 | 10.36 |
| 5 | 6.30 | 1.28 | 85.09 | 7.33 |
| 6 | 1.70 | 94.87 | 2.23 | 1.19 |
| 7 | 7.77 | 2.78 | 1.94 | 87.51 |
| 8 | 8.79 | 84.02 | 1.92 | 5.27 |
| 9 | 88.05 | 10.10 | 0.93 | 0.92 |
| 10 | 5.85 | 1.18 | 1.68 | 91.29 |
| 11 | 86.34 | 0.46 | 6.70 | 6.49 |
| 12 | 88.81 | 5.31 | 1.45 | 4.43 |
| 13 | 1.27 | 8.18 | 90.15 | 0.41 |
| 14 | 0.92 | 13.78 | 83.09 | 2.20 |
| 15 | 1.62 | 0.75 | 0.86 | 96.78 |
| 16 | 86.03 | 10.53 | 3.04 | 0.40 |
| 17 | 92.45 | 2.44 | 3.83 | 1.28 |
| 18 | 2.82 | 87.87 | 2.79 | 6.51 |
| 19 | 5.16 | 84.35 | 6.62 | 3.87 |
| 20 | 1.09 | 87.95 | 2.34 | 8.63 |
| 21 | 3.15 | 5.76 | 3.20 | 87.90 |
| 22 | 0.78 | 95.56 | 0.24 | 3.43 |
| 23 | 5.13 | 2.72 | 72.78 | 19.37 |
| 24 | 0.00 | 99.37 | 0.51 | 0.12 |
|
| B, NC group |
|
| Position on
sRNA | A (%) | U (%) | C (%) | G (%) |
|
| 1 | 10.01 | 84.27 | 5.62 | 0.10 |
| 2 | 22.99 | 5.07 | 9.87 | 62.07 |
| 3 | 42.97 | 29.38 | 20.91 | 6.74 |
| 4 | 27.54 | 2.84 | 19.77 | 49.84 |
| 5 | 34.92 | 6.37 | 19.69 | 39.02 |
| 6 | 29.87 | 58.16 | 6.84 | 5.12 |
| 7 | 35.85 | 5.20 | 29.98 | 28.96 |
| 8 | 38.34 | 28.22 | 2.58 | 30.85 |
| 9 | 27.48 | 63.04 | 6.42 | 3.05 |
| 10 | 32.86 | 4.33 | 22.10 | 40.71 |
| 11 | 20.43 | 5.49 | 34.07 | 40.01 |
| 12 | 44.81 | 22.61 | 8.66 | 23.93 |
| 13 | 6.28 | 35.38 | 49.68 | 8.66 |
| 14 | 3.93 | 53.36 | 16.62 | 26.09 |
| 15 | 27.70 | 3.42 | 8.18 | 60.71 |
| 16 | 31.53 | 43.49 | 22.36 | 2.62 |
| 17 | 51.50 | 27.04 | 8.13 | 13.33 |
| 18 | 12.07 | 47.97 | 3.64 | 36.32 |
| 19 | 32.18 | 23.90 | 13.92 | 29.99 |
| 20 | 24.02 | 31.37 | 3.44 | 41.18 |
| 21 | 26.34 | 36.24 | 3.54 | 33.87 |
| 22 | 4.88 | 54.75 | 9.62 | 30.76 |
| 23 | 8.07 | 2.10 | 86.98 | 2.84 |
| 24 | 21.44 | 66.17 | 2.77 | 9.62 |
Differential expression of miRNAs in the
MN and NC groups
Four procedures were completed to compare the miRNA
expression between the MN and NC libraries: i) relative expression
analysis was used to normalize the data against the number of
miRNAs and the total number of small RNA reads. This was used to
define the expression preferences of individual miRNAs, between the
two libraries. ii) The outcome of the relative expression analysis
was multiplied by a constant, set at 1×10⁶: Normalized
expression = (actual miRNA count/total count of clean reads)
×106. iii) The fold change and P-values were calculated
from the normalized expression data: fold change = log2
(MN/NC), P(y/x) = (N2/N1)y ×
(x+y)!/x!y!(1+N2/N1)(x+y+1) (x and
y indicate the number of reads of a miRNA in the NC and MN
libraries, respectively. N1 and N2 represent
the total number of clean reads in the NC and MN libraries,
respectively). iv) The fold change and Audic-Claverie method
(18) were used to define the
differential expression of miRNAs between the two groups. Fold
changes (log2 MN/NC) with P≤0.01 were considered to
indicate a statistically significant result.
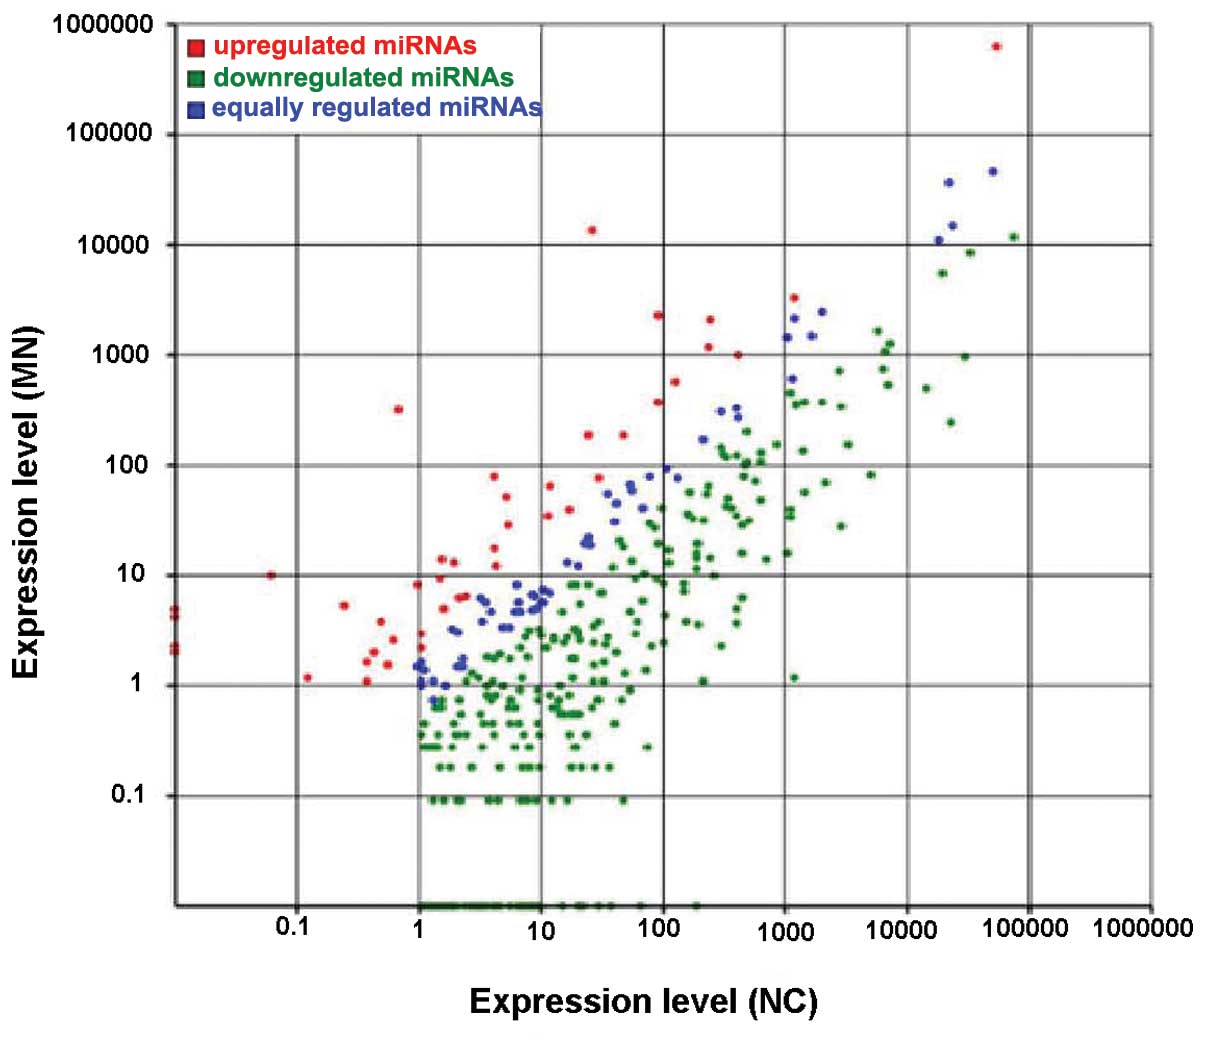
Differential expression between the MN and NC
libraries was found in 326 miRNAs. These consisted of 286 miRNAs
that were downregulated and 40 miRNAs that were upregulated
(Fig. 4). The fold change value
for the downregulated miRNAs ranged from −14.23 (hsa-miR-217) to
−1.03 (hsa-miR-589-5p). The greatest fold change in the upregulated
miRNAs was 8.97 (hsa-miR-486-5p). No upregulated miRNA exceeded a
fold change of 10. The 20 upregulated and downregulated miRNAs with
the highest fold changes in expression are listed in Table III.
| Table IIIThe top 20 upregulated and
downregulated miRNAs. |
Table III
The top 20 upregulated and
downregulated miRNAs.
| miRNA name | NCa | MNb | Fold change
(log2)c | P-value |
|---|
| Downregulated
miRNAs |
| hsa-miR-217 | 191.8607 | 0.01 | −14.22777294 | 0 |
| hsa-miR-216a | 66.6825 | 0.01 | −12.70309232 | 5.5967E-245 |
| hsa-miR-216b | 38.1222 | 0.01 | −11.89641592 | 2.4708E-140 |
| hsa-miR-95 | 29.9978 | 0.01 | −11.5506409 | 1.4472E-110 |
| hsa-miR-671-5p | 22.1858 | 0.01 | −11.11542074 | 6.07198E-82 |
| hsa-miR-3653 | 20.311 | 0.01 | −10.98804541 | 4.49572E-75 |
|
hsa-miR-1285-3p | 14.8739 | 0.01 | −10.53856732 | 3.75197E-55 |
|
hsa-miR-200c-3p | 1181.5995 | 1.1702 | −9.97977026 | 0 |
| hsa-miR-29a-5p | 9.9993 | 0.01 | −9.9656833 | 2.72194E-37 |
| hsa-miR-627 | 9.7493 | 0.01 | −9.92915478 | 2.24289E-36 |
| hsa-miR-425-3p | 9.4368 | 0.01 | −9.88215398 | 3.13127E-35 |
| hsa-miR-503 | 8.7493 | 0.01 | −9.77302376 | 1.03401E-32 |
|
hsa-miR-193a-5p | 8.3744 | 0.01 | −9.70984202 | 2.44579E-31 |
| hsa-miR-382-5p | 7.6869 | 0.01 | −9.58625814 | 8.07652E-29 |
|
hsa-miR-135b-5p | 7.1245 | 0.01 | −9.47664493 | 9.29106E-27 |
|
hsa-miR-4802-3p | 6.812 | 0.01 | −9.41193458 | 1.29711E-25 |
| hsa-miR-1246 | 6.812 | 0.01 | −9.41193458 | 1.29711E-25 |
|
hsa-miR-500a-5p | 6.6245 | 0.01 | −9.37166775 | 6.30846E-25 |
| hsa-miR-500b | 6.562 | 0.01 | −9.35799181 | 1.06882E-24 |
|
hsa-miR-5588-5p | 5.6246 | 0.01 | −9.1356067 | 2.90831E-21 |
| Upregulated
miRNAs |
| hsa-miR-486-5p | 26.5605 | 13344.793 | 8.97277891 | 0 |
| hsa-miR-208b | 0.01 | 4.8609 | 8.92507964 | 9.79541E-22 |
| hsa-miR-133a | 0.6874 | 306.0547 | 8.79842396 | 0 |
| hsa-miR-449a | 0.01 | 4.1407 | 8.69373087 | 1.23214E-18 |
| hsa-miR-195-3p | 0.01 | 2.2504 | 7.81403765 | 1.68736E-10 |
|
hsa-miR-449c-5p | 0.01 | 1.9804 | 7.62964804 | 2.45229E-09 |
| hsa-miR-133b | 0.0625 | 9.9918 | 7.3207446 | 5.40583E-42 |
| hsa-miR-204-5p | 92.2431 | 2212.9552 | 4.58438944 | 0 |
| hsa-miR-410 | 0.25 | 5.3109 | 4.40895636 | 9.13765E-19 |
| hsa-miR-21-3p | 4.1872 | 78.134 | 4.22189274 | 5.5898E-249 |
| hsa-miR-10b-5p | 55198.7661 | 628948.7014 | 3.51023443 | 0 |
| hsa-miR-19a-3p | 5.1871 | 51.3092 | 3.30621744 | 6.9257E-134 |
|
hsa-miR-4661-5p | 0.125 | 1.1702 | 3.22675512 | 0.000345083 |
|
hsa-miR-199b-5p | 1.5624 | 13.8625 | 3.1493517 | 1.00921E-35 |
| hsa-let-7i-5p | 248.6065 | 2045.6153 | 3.04059893 | 0 |
| hsa-miR-144-3p | 0.9999 | 8.1915 | 3.03427193 | 5.66076E-21 |
| hsa-miR-486-3p | 0.5 | 3.7807 | 2.91865338 | 4.6769E-10 |
| hsa-miR-19b-3p | 24.4357 | 181.8325 | 2.89554775 | 0 |
| hsa-miR-941 | 1.9374 | 12.7823 | 2.7219537 | 1.49032E-28 |
| hsa-miR-1468 | 1.4999 | 9.0916 | 2.59966789 | 9.12913E-20 |
Differential expression of novel miRNAs
in the MN and NC groups
There were 15 novel miRNAs in the MN group and 22
novel miRNAs in the NC group. Only 6 of these showed a
significantly different level of expression between the MN and NC
groups. The novel-miR-82, novel-miR-98, novel-miR-89 and
novel-miR-84 miRNAs were downregulated, whilst the novel-miR-152
and novel-miR-15 miRNAs were upregulated (Table IV). The novel-miR-15 fold change
of 9.85 was the largest fold change in the upregulated group. The
novel-miR-84 miRNA with the fold change of −7.45 was the largest in
the downregulated group.
| Table IVDifferential expression of novel
miRNAs in the MN and NC groups. |
Table IV
Differential expression of novel
miRNAs in the MN and NC groups.
| Novel miRNA
name | NC | MN | Fold change
(log2)a | P-value |
|---|
| Downregulated |
| novel_miR_82 | 1.1249 | 0.01 | −6.81365294 | 8.92E-05 |
| novel_miR_98 | 1.3749 | 0.01 | −7.10318289 | 1.08E-05 |
| novel_miR_89 | 1.6874 | 0.01 | −7.3986582 | 7.75E-07 |
| novel_miR_84 | 1.7499 | 0.01 | −7.45112866 | 4.58E-07 |
| Upregulated |
| novel_miR_152 | 0.01 | 1.6203 | 7.34011714 | 8.70E-08 |
| novel_miR_15 | 0.01 | 9.2717 | 9.85669008 | 1.01E-40 |
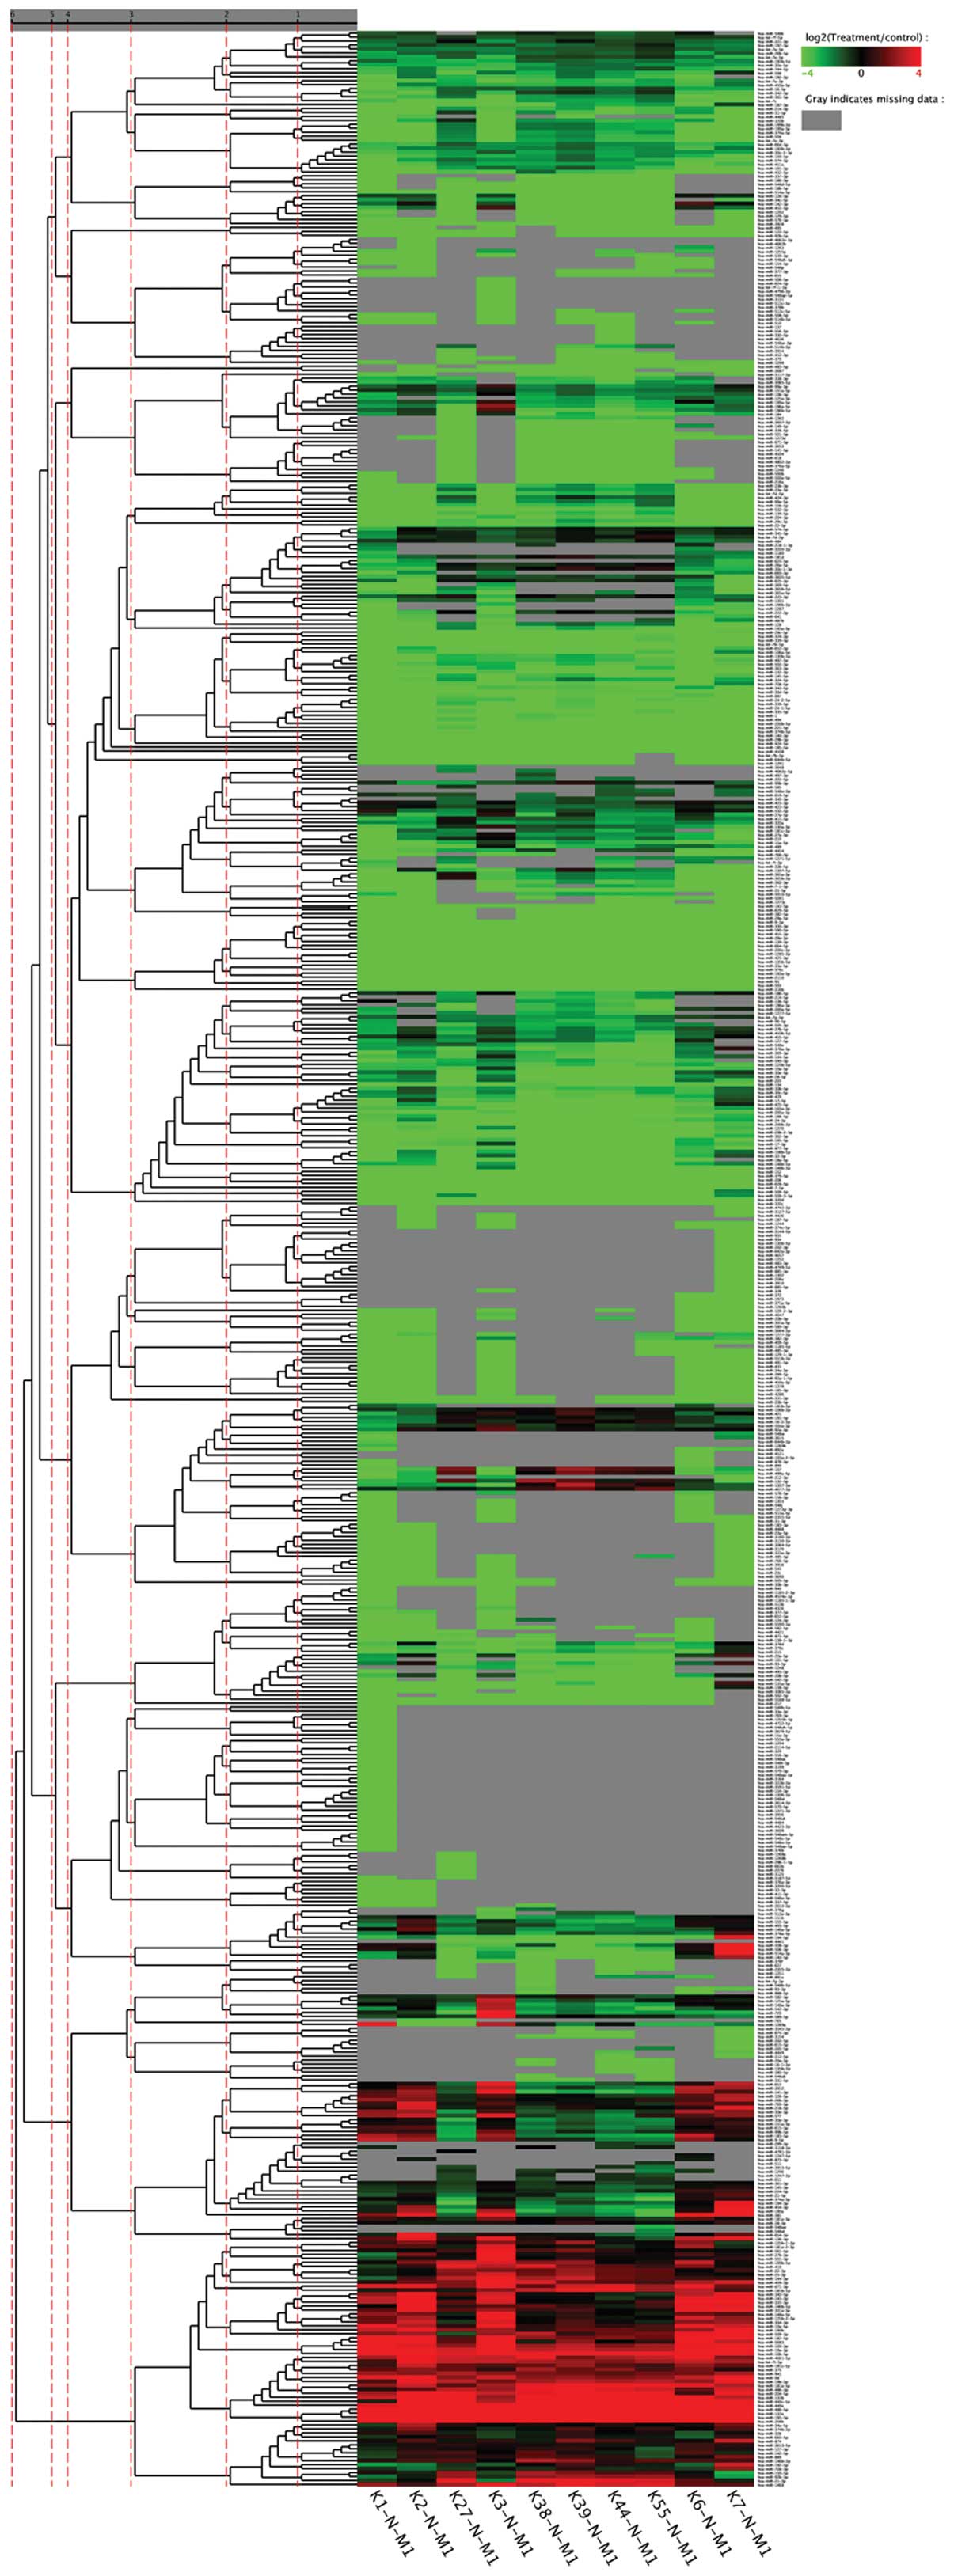
Cluster analysis of miRNAs
From the 30 specimens in the NC group, 10 were
randomly selected and labeled as K7-N, K6-N, K55-N, K44-N, K39-N,
K38-N, K3-N, K27-N, K2-N and K1-N and were compared with the MN
specimens in a heat map (Fig. 5).
The samples were clustered in accordance with their similarities in
expression patterns, i.e., fold change and P-value. Red indicated
that the miRNA had a higher expression level in the MN specimens,
whilst green indicated that the miRNA had a higher expression level
in the 10 specimens from the NC group. Gray indicated that the
miRNA was not expressed in at least one sample.
miRNA base edits
Nucleotide base positions 2–8 of a mature miRNA are
highly conserved and are known as the seed region. The target of
the miRNA may be dependent on this region. In our analysis, seed
region base changes were detected by aligning unannotated small
RNAs with mature miRNAs from the miRBase 18 database (http://www.mirbase.org/). Mismatches in the alignment
were assumed to be associated with the mechanism of the disease. In
this study, 108 miRNAs, which were common between the MN and NC
groups were analyzed for base edits. The proportion of miRNAs with
base edits was used to obtain the ratio of base edits between the
two groups (Table V). There were
77 miRNAs in which there were more base edits in the MN group than
in the NC group (MN/NC >1), 6 miRNAs that were equivalent
between the two groups (MN/NC = 1) and 25 miRNAs in which there
were more base edits in the NC group than in the MN group (MN/NC
<1). Generally, miRNA base edits occurred in the MN group more
often than in the NC group, which indicated a link with the
disease.
| Table VmiRNA base edit comparison between
the MN and NC groups (Top 10 ratio >1, 6 ratio = 1, top 6 ratio
<1). |
Table V
miRNA base edit comparison between
the MN and NC groups (Top 10 ratio >1, 6 ratio = 1, top 6 ratio
<1).
| miRNA name | Count with base
edit/total edit (MN)a | Count with base
edit/total edit (NC)b | Ratio (MN)/ratio
(NC)c |
|---|
| Ratio (MN)/ratio
(NC) >1 |
| hsa-miR-1 | 25.59 | 0.48 | 53.20 |
| hsa-miR-542-3p | 16.55 | 0.40 | 41.80 |
| hsa-miR-190a | 9.09 | 0.28 | 32.80 |
| hsa-miR-30b-5p | 19.68 | 0.75 | 26.17 |
|
hsa-miR-146a-5p | 22.82 | 1.26 | 18.13 |
|
hsa-miR-146b-5p | 22.07 | 1.29 | 17.12 |
| hsa-miR-128 | 23.23 | 1.98 | 11.73 |
| hsa-miR-9-5p | 24.48 | 2.17 | 11.28 |
|
hsa-miR-374b-5p | 12.50 | 1.18 | 10.62 |
| hsa-miR-28-5p | 12.96 | 1.24 | 10.48 |
| Ratio (MN)/ratio
(NC) = 1 |
| hsa-miR-378b | 100.00 | 99.55 | 1.00 |
| hsa-miR-23c | 100.00 | 99.67 | 1.00 |
| hsa-miR-378f | 100.00 | 99.72 | 1.00 |
| hsa-miR-378h | 100.00 | 99.76 | 1.00 |
| hsa-miR-378i | 100.00 | 99.99 | 1.00 |
|
hsa-miR-1304-3p | 100.00 | 100.00 | 1.00 |
| Ratio (MN)/ratio
(NC) <1 |
| hsa-miR-378g | 98.85 | 99.82 | 0.99 |
| hsa-let-7e-5p | 94.69 | 96.50 | 0.98 |
| hsa-miR-19a-3p | 78.09 | 81.60 | 0.96 |
| hsa-miR-423-5p | 0.87 | 0.92 | 0.95 |
| hsa-miR-30e-3p | 80.45 | 85.25 | 0.94 |
| hsa-miR-421 | 10.64 | 11.48 | 0.93 |
Validation of miRNA expression by
qRT-PCR
The expression levels of 5 randomly selected miRNAs:
hsa-miR-7-5p, hsa-miR-615-3p, hsa-miR-577, hsa-miR-98 and
hsa-miR-375, were compared. The hsa-miR-98 and hsa-miR-375 miRNAs
were upregulated, whilst hsa-miR-7-5p, hsa-miR-615-3p and
hsa-miR-577 were downregulated. The qRT-PCR data were obtained
using the 2−ΔΔCt method and normalized using RNA RUN6 as
a reference. The log2 (MN/NC) value was compared with
the fold change value (Table
VI). The log2 (MN/NC) values of hsa-miR-7-5p,
hsa-miR-615-3p and hsa-miR-577 were −5.06, −2.40 and −1.12,
respectively. These data confirmed that these miRNAs were
downregulated. The log2 (MN/NC) values of hsa-miR-98 and
hsa-miR-375 were 4.28 and 2.63, respectively, again confirming the
previous data, indicating that they were upregulated.
| Table VIValidation of miRNA expression
profiles by qRT-PCR. |
Table VI
Validation of miRNA expression
profiles by qRT-PCR.
| miRNA | Group |
CtU6 |
CtmiRNA | ΔCt =
CtmiRNA − CtU6 | Ct(MN −
CG) = ΔCtMN − ΔCtNC | 2−ΔΔC
a | MN/NC ratiob | log2
(MN/NC ratio)c |
|---|
| hsa-miR-7-5p | NC | 10.88 | 21.61 | 10.73 | 0 | 1 | 0.03 | −5.06 |
| MN | 11.37 | 27.16 | 15.79 | 5.06 | 0.03 | | |
| hsa-miR-615-3p | NC | 10.88 | 17.26 | 6.38 | 0 | 1 | 0.19 | −2.40 |
| MN | 11.37 | 20.15 | 8.78 | 2.40 | 0.19 | | |
| hsa-miR-577 | NC | 10.88 | 35.40 | 24.52 | 0 | 1 | 0.46 | −1.12 |
| MM | 11.37 | 37.01 | 25.64 | 1.12 | 0.46 | | |
| hsa-miR-98 | NC | 10.88 | 28.04 | 17.16 | 0 | 1 | 19.43 | 4.28 |
| MN | 11.37 | 24.25 | 12.88 | −4.28 | 19.43 | | |
| hsa-miR-375 | NC | 10.88 | 19.51 | 8.63 | 0 | 1 | 6.19 | 2.63 |
| MN | 11.37 | 17.37 | 6.00 | −2.63 | 6.19 | | |
Discussion
The high through-put sequencing used in this study
is suitable for the analysis of small RNA molecules as it is able
to decrease the loss of nucleotides in the reads, caused by
secondary structure. The technology is also ideal as it does not
require a large sample quantity (19). Such an analysis can obtain
millions of small RNA sequence tags in one run and can identify the
differential expression of small RNAs between two samples (20). We performed high through-put
sequencing on a large number of peripheral blood lymphocytes from
individuals separated into the MN and NC groups. The aim was to
identify dysregulated miRNAs that may serve as reliable diagnostic
markers and potential therapeutic targets. The data confirmed that
dysregulated miRNAs may play an important role in the pathogenesis
of nephropathy, which is consistent with previous studies (21–23).
We determined the unique and total number of small
RNAs in the MN and NC groups, and positioned the small RNAs within
the genome. Expression analysis and distribution of the small RNAs
was also performed. The number of total and unique small RNAs was
greater in the NC group than in the MN group. The miRBase 18
database (http://www.mirbase.org/) provides a
range of data to facilitate studies of miRNA genomics. This has
been used previously to map all miRNAs to their genomic coordinates
(24), allowing a network of
genome-wide miRNA expression to be produced (25,26). Analysis of the properties of miRNA
targets is a promising approach to the prediction of miRNA
function. If the targets of specific miRNAs are enriched with genes
associated with a particular biological process, it is reasonable
to infer that the miRNA is also involved in the same process
(27). The function of miRNAs was
not predicted in this study; however, a statistical analysis was
performed, revealing a discrepancy between a diseased and a normal
group of specimens, regardless of the quantity and distribution of
miRNAs. This provided strong evidence for the function of miRNAs in
the pathogenesis of disease.
Our data demonstrated the bias in miRNA nucleotides
at each base position. We found that U was the dominant nucleotide
in miRNAs. This was particularly noticeable at positions 1, 6, 8,
18, 19, 20, 22 and 24 in the MN group, and at positions 1, 6, 9,
14, 22 and 24 in the NC group. These results are consistent with
those of Zhang et al(28),
who demonstrated that the distribution of nucleotides indicated an
important role for U at the boundaries of the seed region and
termini. In addition, there was a large discrepancy in the
proportion of the 4 bases at each position. For example, U
accounted for 96.61 and 84.27% of bases at the 1st position in the
MN and NC groups, respectively. The A base accounted for 92.45 and
51.50% of bases at the 17th position in the MN and NC groups,
respectively. Genes with a higher level of expression showed
stronger signals, which indicated that these nucleotides were
responsible for the regulation of translation initiation. The
diversity of nucleotide sequences surrounding the initiation codon
has been explained by differences in relative contributions from
two distinct patterns (29), and
preferred nucleotide sequences varied between different eukaryotic
species (30). We speculate that
the reasons for the different nucleotide bias, between the MN and
NC groups, resulted from the individual differences in evolution or
the role of miRNAs. This requires further research.
In the present study, the results of the miRNA
differential expression analysis were unexpected as there were more
downregulated (n=286) miRNAs than upregulated (n=40) miRNAs. By
contrast, there are several reports on miRNA pathogenesis in
nephropathy that have reported more upregulated miRNAs, compared
with downregulated miRNAs (13,31). This is also the case for diseases,
such as congenital disorders (32), cancer (33) and immunological diseases (34). However, certain studies have
reported an increase in downregulated miRNAs, compared with
upregulated miRNAs; however, the difference in numbers is small.
Chen et al reported more downregulated (n=41) miRNAs than
upregulated (n=33) ones in urothelial cell carcinoma (35). Osanto et al reported more
downregulated (n=41) miRNAs than upregulated (n=29) ones in clear
cell renal cell carcinoma (36).
miRNAs that are more abundant in the kidneys, compared with other
organs, include miR-192, miR-194, miR-204, miR-215 and miR-216
(37). The miRNA-30 family
(hsa-miR-30e-5p, hsa-miR-30e-3p, hsa-miR-30d-5p, hsa-miR-30c-5p,
hsa-miR-30c-2-3p, hsa-miR-3b-5p, hsa-miR-30b-3p, hsa-miR-3a-5p and
hsa-miR-30a-3p) and the miR-133 family (hsa-miR-133b and
hsa-miR-133a) have been linked to the connective tissue growth
factor (CTGF), which is a key molecule in the process of fibrosis
(38). It is also a key molecule
in the process of nephropathy (39). Our study demonstrated that the
miRNA-30 family was downregulated and that the miR-133 family was
upregulated. The loss of miR-23b, miR-24 and miR-26a resulted in
the rapid progression of marked glomerular and tubular injury.
Their existence has been shown to be critical in maintaining
glomerular filtration (40).
These miRNAs were also downregulated in our study. We deduced that
the key involvement of miRNAs in the pathogenesis of MN was an
outcome of downregulation. This could explain why the
downregulation of miRNAs was more common than the upregulation.
However, our inference requires a more in-depth study.
We were also able to predict novel miRNAs, with 6
that showed a significant difference in expression between the MN
and NC groups. Four of the 6 were downregulated and 2 were
upregulated. The outcome was in agreement with the higher numbers
of miRNAs that were downregulated, compared with the number that
were upregulated, as described earlier in this study. Certain
studies have reported that the read number for most novel miRNAs is
much lower than that for the conserved miRNAs, which indicates that
non-conserved miRNAs are usually expressed at a lower level
(35,41). Despite the limited number of novel
miRNAs in this study, we found that the fold change was relatively
large, with values >6 or <−6. This indicated that the novel
miRNAs may have functional relevance in the pathogenesis of MN. The
identification of novel miRNA genes is important as it may reveal
putative genes that exert a regulatory effect on different types of
cancer (42). Dhahbi et
al(43) found 20 novel miRNAs
that were differentially expressed between young and senescent
fibroblasts. Three novel miRNAs have been shown to exhibit relative
sequence counts of >10 and are likely to be involved in the
development of prostate cancer (41). These studies demonstrated that
novel miRNAs have are closely associated with the occurrence of
disease. The targets and functions of novel miRNAs, which had not
previously been investigated in MN, have yet to be determined.
The nucleotides at positions 2–8 of mature miRNAs
are known to be highly conserved. The targets of miRNAs may be
altered by a change in the nucleotides in this region (44). We calculated the percentage of
base edits and compared the percentages between the MN and NC
groups. A discrepancy was observed, which indicated that this
region may be implicated in the pathogenesis of the disease. Blow
et al found that 6 of 99 surveyed pre-miRNAs were edited in
at least 1 of 10 human tissues (45). The hsa-miR-1269b and
hsa-miR-1034-3p miRNAs had the largest percentage (100%) of edited
bases in the NC group. There were 9 miRNAs in the MN group where
the percentage of edited bases reached 100%. There was a similar
base edit percentage in both the MN and NC groups. For example,
hsa-let-7a-5p, 85.52% in the MN group and 64.99% in the NC group;
hsa-miR-1304-4p, 100% in the MN group and 100% in the NC group;
hsa-miR-130-3p, 5.54% in the MN group and 2.10% in the NC group. We
identified that the number of miRNAs with a ratio (MN)/ratio(NC)
>1 was 77, whilst those with a ratio (MN)/ratio(NC) <1 was
25. Kawahara et al provided the first evidence that edited
miRNAs have a biological significance in vivo(46). We speculated that miRNA base edits
may be involved in the pathogenesis of MN and may provide an
innovative method for investigating the mechanisms responsible for
the development of MN.
This study is one of the few that have profiled the
expression patterns of miRNAs on a genome-wide scale in patients
with MN. Our results demonstrated the differential expression of
miRNAs and a discrepancy in nucleotide bias between normal and
diseased individuals. Base edits showed a clear difference between
the two groups, which strongly indicated that dysregulated miRNAs
may present an area of research into the pathogenesis of MN. Our
study also indicated that miRNAs can serve as a potential clinical
target to diagnose and treat MN patients in the future. Whilst the
results indicated the significant potential and benefit of miRNAs,
further studies are required to provide further insight into the
molecular functions of miRNAs. Our data may be used as basic
research to support novel methods for the investigation, diagnosis
and treatment of MN. We anticipate that miRNA-based genetic
therapies will be developed to replace traditional therapies for
the future benefit of patients.
Acknowledgements
The authors thank the patients and health
professionals for their contribution to this study and their
valuable experimental specimens. Constructive opinions and guidance
were obtained from Dr Dai. We also thank the research team at
Shenzhen Clinical Medical Research Center for their support of our
study.
References
|
1
|
Ponticelli C and Passerini P: Can
prognostic factors assist therapeutic decisions in idiopathic
membranous nephropathy? J Nephrol. 23:156–163. 2010.PubMed/NCBI
|
|
2
|
Ponticelli C: Membranous nephropathy. J
Nephrol. 20:268–287. 2007.
|
|
3
|
Cybulsky AV, Quigg RJ and Salant DJ:
Experimental membranous nephropathy redux. Am J Physiol Renal
Physiol. 289:F660–F671. 2005. View Article : Google Scholar : PubMed/NCBI
|
|
4
|
Shankland SJ: New insights into the
pathogenesis of membranous nephropathy. Kidney Int. 57:1204–1205.
2000. View Article : Google Scholar : PubMed/NCBI
|
|
5
|
Couser WG: Membranous nephropathy: a long
road but well traveled. J Am Soc Nephrol. 16:1184–1187. 2005.
View Article : Google Scholar : PubMed/NCBI
|
|
6
|
Fervenza FC, Sethi S and Specks U:
Idiopathic membranous nephropathy: diagnosis and treatment. Clin J
Am Soc Nephrol. 3:905–919. 2008. View Article : Google Scholar : PubMed/NCBI
|
|
7
|
Praga M and Rojas-Rivera J: Glomerular
disease: predicting outcomes in idiopathic membranous nephropathy.
Nat Rev Nephrol. 8:496–498. 2012. View Article : Google Scholar : PubMed/NCBI
|
|
8
|
Bataille S, Jourde N, Daniel L, et al:
Comparative safety and efficiency of five percutaneous kidney
biopsy approaches of native kidneys: a multicenter study. Am J
Nephrol. 35:387–393. 2012. View Article : Google Scholar : PubMed/NCBI
|
|
9
|
Bartel DP: MicroRNAs: genomics,
biogenesis, mechanism, and function. Cell. 116:281–297. 2004.
View Article : Google Scholar : PubMed/NCBI
|
|
10
|
Kim VN and Nam JW: Genomics of microRNA.
Trends Genet. 22:165–173. 2006. View Article : Google Scholar : PubMed/NCBI
|
|
11
|
Zhang B, Wang Q and Pan X: MicroRNAs and
their regulatory roles in animals and plants. J Cell Physiol.
210:279–289. 2007. View Article : Google Scholar : PubMed/NCBI
|
|
12
|
Lagos-Quintana M, Rauhut R, Lendeckel W
and Tuschl T: Identification of novel genes coding for small
expressed RNAs. Science. 294:853–858. 2001. View Article : Google Scholar : PubMed/NCBI
|
|
13
|
Dai Y, Sui W, Lan H, Yan Q, Huang H and
Huang Y: Comprehensive analysis of microRNA expression patterns in
renal biopsies of lupus nephritis patients. Rheumatol Int.
29:749–754. 2009. View Article : Google Scholar : PubMed/NCBI
|
|
14
|
Saal S and Harvey SJ: MicroRNAs and the
kidney: coming of age. Curr Opin Nephrol Hypertens. 18:317–323.
2009. View Article : Google Scholar : PubMed/NCBI
|
|
15
|
Li JY, Yong TY, Michael MZ and Gleadle JM:
Review: The role of microRNAs in kidney disease. Nephrology
(Carlton). 15:599–608. 2010. View Article : Google Scholar : PubMed/NCBI
|
|
16
|
Morozova O and Marra MA: Applications of
next-generation sequencing technologies in functional genomics.
Genomics. 92:255–264. 2008. View Article : Google Scholar : PubMed/NCBI
|
|
17
|
Li R, Li Y, Kristiansen K and Wang J:
SOAP: short oligonucleotide alignment program. Bioinformatics.
24:713–714. 2008. View Article : Google Scholar : PubMed/NCBI
|
|
18
|
Tino P: Basic properties and information
theory of Audic-Claverie statistic for analyzing cDNA arrays. BMC
Bioinformatics. 10:3102009. View Article : Google Scholar : PubMed/NCBI
|
|
19
|
Minoche AE, Dohm JC and Himmelbauer H:
Evaluation of genomic high-throughput sequencing data generated on
Illumina HiSeq and genome analyzer systems. Genome Biol.
12:R1122011. View Article : Google Scholar : PubMed/NCBI
|
|
20
|
Huss M: Introduction into the analysis of
high-throughput-sequencing based epigenome data. Brief Bioinform.
11:512–523. 2010. View Article : Google Scholar : PubMed/NCBI
|
|
21
|
Wang G, Kwan BC, Lai FM, Chow KM, Kam-Tao
Li P and Szeto CC: Expression of microRNAs in the urinary sediment
of patients with IgA nephropathy. Dis Markers. 28:79–86. 2010.
View Article : Google Scholar : PubMed/NCBI
|
|
22
|
Wang G, Kwan BC, Lai FM, et al: Intrarenal
expression of miRNAs in patients with hypertensive nephrosclerosis.
Am J Hypertens. 23:78–84. 2010. View Article : Google Scholar : PubMed/NCBI
|
|
23
|
Ichii O, Otsuka S, Sasaki N, Namiki Y,
Hashimoto Y and Kon Y: Altered expression of microRNA miR-146a
correlates with the development of chronic renal inflammation.
Kidney Int. 81:280–292. 2012. View Article : Google Scholar : PubMed/NCBI
|
|
24
|
Griffiths-Jones S, Saini HK, van Dongen S
and Enright AJ: miRBase: tools for microRNA genomics. Nucleic Acids
Res. 36:D154–D158. 2008. View Article : Google Scholar : PubMed/NCBI
|
|
25
|
Martinez NJ, Ow MC, Barrasa MI, et al: A
C. elegans genome-scale microRNA network contains composite
feedback motifs with high flux capacity. Genes Dev. 22:2535–2549.
2008.
|
|
26
|
Rajewsky N and Socci ND: Computational
identification of microRNA targets. Dev Biol. 267:529–535. 2004.
View Article : Google Scholar
|
|
27
|
Ulitsky I, Laurent LC and Shamir R:
Towards computational prediction of microRNA function and activity.
Nucleic Acids Res. 38:e1602010. View Article : Google Scholar : PubMed/NCBI
|
|
28
|
Zhang B, Stellwag EJ and Pan X:
Large-scale genome analysis reveals unique features of microRNAs.
Gene. 443:100–109. 2009. View Article : Google Scholar : PubMed/NCBI
|
|
29
|
Nakagawa S, Niimura Y, Gojobori T, Tanaka
H and Miura K: Diversity of preferred nucleotide sequences around
the translation initiation codon in eukaryote genomes. Nucleic
Acids Res. 36:861–871. 2008. View Article : Google Scholar : PubMed/NCBI
|
|
30
|
Joshi CP, Zhou H, Huang X and Chiang VL:
Context sequences of translation initiation codon in plants. Plant
Mol Biol. 35:993–1001. 1997. View Article : Google Scholar : PubMed/NCBI
|
|
31
|
Sui W, Dai Y, Huang Y, Lan H, Yan Q and
Huang H: Microarray analysis of MicroRNA expression in acute
rejection after renal transplantation. Transpl Immunol. 19:81–85.
2008. View Article : Google Scholar : PubMed/NCBI
|
|
32
|
Sui W, Ou M, Chen J, et al: MicroRNA
expression profile of peripheral blood mononuclear cells of
Klinefelter syndrome. Exp Ther Med. 4:825–831. 2012.PubMed/NCBI
|
|
33
|
Patnaik SK, Yendamuri S, Kannisto E,
Kucharczuk JC, Singhal S and Vachani A: MicroRNA expression
profiles of whole blood in lung adenocarcinoma. PLoS One.
7:e460452012. View Article : Google Scholar : PubMed/NCBI
|
|
34
|
Dai Y, Sui W, Lan H, Yan Q, Huang H and
Huang Y: Microarray analysis of micro-ribonucleic acid expression
in primary immunoglobulin A nephropathy. Saudi Med J. 29:1388–1393.
2008.PubMed/NCBI
|
|
35
|
Chen YH, Wang SQ, Wu XL, et al:
Characterization of microRNAs expression profiling in one group of
Chinese urothelial cell carcinoma identified by Solexa sequencing.
Urol Oncol. 31:219–227. 2013. View Article : Google Scholar : PubMed/NCBI
|
|
36
|
Osanto S, Qin Y, Buermans HP, et al:
Genome-wide microRNA expression analysis of clear cell renal cell
carcinoma by next generation deep sequencing. PLoS One.
7:e382982012. View Article : Google Scholar : PubMed/NCBI
|
|
37
|
Tian Z, Greene AS, Pietrusz JL, Matus IR
and Liang M: MicroRNA-target pairs in the rat kidney identified by
microRNA microarray, proteomic, and bioinformatic analysis. Genome
Res. 18:404–411. 2008. View Article : Google Scholar
|
|
38
|
Duisters RF, Tijsen AJ, Schroen B, et al:
miR-133 and miR-30 regulate connective tissue growth factor:
implications for a role of microRNAs in myocardial matrix
remodeling. Circ Res. 104:170–178. 2009. View Article : Google Scholar : PubMed/NCBI
|
|
39
|
Mezzano SA, Droguett MA, Burgos ME, et al:
Overexpression of chemokines, fibrogenic cytokines, and
myofibroblasts in human membranous nephropathy. Kidney Int.
57:147–158. 2000. View Article : Google Scholar : PubMed/NCBI
|
|
40
|
Ho J, Ng KH, Rosen S, Dostal A, Gregory RI
and Kreidberg JA: Podocyte-specific loss of functional microRNAs
leads to rapid glomerular and tubular injury. J Am Soc Nephrol.
19:2069–2075. 2008. View Article : Google Scholar : PubMed/NCBI
|
|
41
|
Xu G, Wu J, Zhou L, et al:
Characterization of the small RNA transcriptomes of androgen
dependent and independent prostate cancer cell line by deep
sequencing. PLoS One. 5:e155192010. View Article : Google Scholar : PubMed/NCBI
|
|
42
|
Oulas A, Boutla A, Gkirtzou K, Reczko M,
Kalantidis K and Poirazi P: Prediction of novel microRNA genes in
cancer-associated genomic regions - a combined computational and
experimental approach. Nucleic Acids Res. 37:3276–3287. 2009.
View Article : Google Scholar : PubMed/NCBI
|
|
43
|
Dhahbi JM, Atamna H, Boffelli D, Magis W,
Spindler SR and Martin DI: Deep sequencing reveals novel microRNAs
and regulation of microRNA expression during cell senescence. PLoS
One. 6:e205092011. View Article : Google Scholar : PubMed/NCBI
|
|
44
|
Li G, Li Y, Li X, Ning X, Li M and Yang G:
MicroRNA identity and abundance in developing swine adipose tissue
as determined by Solexa sequencing. J Cell Biochem. 112:1318–1328.
2011. View Article : Google Scholar : PubMed/NCBI
|
|
45
|
Blow MJ, Grocock RJ, van Dongen S, et al:
RNA editing of human microRNAs. Genome Biol. 7:R272006. View Article : Google Scholar : PubMed/NCBI
|
|
46
|
Kawahara Y, Zinshteyn B, Sethupathy P,
Iizasa H, Hatzigeorgiou AG and Nishikura K: Redirection of
silencing targets by adenosine-to-inosine editing of miRNAs.
Science. 315:1137–1140. 2007. View Article : Google Scholar : PubMed/NCBI
|