Introduction
Obesity has become a widespread issue in modern
society. When energy input exceeds energy expenditure, adipose
tissue mass increases by adipocyte hyperplasia and hypertrophy
(1). In order to manage the
health concerns associated with obesity, it is necessary to
understand its development and regulation. At the cellular level,
obesity is considered a hypertrophic disease resulting from an
increase in adipogenesis (2). The
3T3-L1 cell line derived from 3T3 Swiss mouse embryo is one of the
most well-characterized and reliable models for studying
adipogenesis. Confluent 3T3-L1 preadipocytes differentiate upon
exposure to adipogenic inducers, such as insulin,
3-isobutyl-1-methylxanthine (IBMX) and dexamethasone. These
inducers activate the dramatic changes in cell morphology,
cytoskeletal components and the level and type of extracellular
matrix components. The acquisition of the adipocyte phenotype is
characterized by chronological changes in the expression of
numerous genes (3). It is crucial
to identify the expression profiles of specific genes during the
process of adipogenesis, which would provide important insight into
the molecular mechanisms underlying adipogenesis.
Quantitative reverse transcription-polymerase chain
reaction (qRT-PCR) is a powerful and efficient means of rapidly
comparing gene expression patterns between different developmental
stages and experimental conditions (4). To ensure reproducible and accurate
quantitative expression measures, it is necessary to normalize the
expression levels of target genes using suitable reference genes.
An ideal reference gene should show similar mRNA levels at
different stages of development of an organism or in different
tissues, and should not vary in abundance in response to
environmental factors or bioassay treatments. However, there is no
universal reference gene with a constant expression in all tissues
and experimental conditions (5).
Increasing evidence demonstrates that the expression levels of the
most commonly used internal reference genes, including
glyceraldehyde-3-phosphate dehydrogenase (GAPDH), β-actin (actin)
and 18 ribosomal RNA (18S) vary markedly under different
experimental conditions (6–9).
Normalization using unsuitable reference genes will lead to
erroneous results (6–9). Therefore, the selection of
appropriate reference genes is critical for the interpretation and
accuracy of expression data.
In this study, 3 popular algorithms, GeNorm
(10), NormFinder (11) and BestKeeper (12) were used to evaluate the expression
stability of 10 commonly used reference genes throughout 3T3-L1
adipocyte differentiation. We identified 18S and
hydroxymethylbilane synthase (HMBS) as the most stable internal
reference genes, while GAPDH and transferrin receptor (TFRC) were
the least stable ones for adipocyte differentiation studies. We
also analyzed the influence of various reference genes on the
expression profiles of target genes, such as 2 key transcript
factors for adipocyte differentiation, peroxisome
proliferator-activated receptor (PPAR)γ2 and CCAAT/enhanced binding
protein (C/EBP)α (2,3). The use of GAPDH and TFRC as
reference genes significantly underestimated the changes in the
expression levels of these genes.
Materials and methods
Materials
Dulbecco’s modified Eagle’s medium (DMEM) and other
culture reagents were obtained from Gibco Life Technologies (Grand
Island, NY, USA). The cell culture plates were purchased from Nalge
Nunc International (Roskilde, Denmark). Human insulin (HumulinR)
was obtained from Eli Lilly S.A.S. (Fegersheim, France). Bovine
serum albumin (BSA), IBMX and dexamethasone were purchased from
Sigma (St. Louis, MO, USA). Anti-actin, anti-GAPDH, anti-α1-tubulin
(tubulin), anti-mouse IgG and anti-rabbit IgG conjugated with
horseradish peroxidase were obtained from Cell Signaling Technology
(Beverly, MA, USA). Murine-derived 3T3-L1 preadipocytes were
purchased from the American Type Culture Collection (ATCC;
Rockville, MD, USA). Berberine was obtained from the National
Institute for the Control of Pharmaceutical and Biological Products
(Beijing, China).
Cell culture and differentiation
3T3-L1 preadipocytes were grown and passaged in DMEM
containing 25 mM glucose plus 10% fetal bovine serum (FBS). For
adipocyte differentiation, 2-day post-confluent cells were placed
in 10% FBS-DMEM with 250 nM dexamethasone, 0.5 mM IBMX and 1 μg/ml
insulin. After 2 days, the medium was changed to 10% FBS-DMEM
containing 1 μg/ml insulin alone for 2 additional days and was
replaced with 10% FBS-DMEM. Thereafter, the medium was changed
every 2 days.
Oil Red O staining
3T3-L1 preadipocytes induced to differentiate for
various days were washed with phosphate-buffered saline (PBS),
fixed with 4% paraformaldehyde in 0.1 M phosphate buffer, pH 7.4
for 15 min at room temperature, and washed 3 times with deionized
water. A mixture of Oil Red O (0.6% Oil Red O dye in isopropanol)
and water at a 6:4 ratio was layered on the cells for 10 min,
followed by hematoxylin counterstaining.
qRT-PCR
Total RNA was isolated using TRIzol reagent
(Invitrogen, Carlsbad, CA, USA) and reverse transcribed from random
primers (Promega, Madison, WI, USA) according to the manufacturer’s
instructions. Real-time PCR was performed on a Roche LightCycler
480 system using SYBR Premix Ex Taq™ (Takara, Otsu, Japan) in a
final volume of 20 μl. The conditions for real-time PCR were as
follows: denaturation at 95°C for 10 sec, 40 cycles at 95°C for 5
sec, and 60°C for 31 sec. A melting curve was built in the
temperature range of 60–95°C at the end of amplification. The
primer sequences used for real-time PCR are presented in Table I. All primers were synthesized by
Shanghai Sangon Biological Engineering Technology & Services
Co., Ltd. (Shanghai, China).
 | Table IDescription of reference genes and
target genes and their primer sequences used in qRT-PCR. |
Table I
Description of reference genes and
target genes and their primer sequences used in qRT-PCR.
| Gene symbol | Gene name | Accession no.
(GenBank) | Gene function | Primer sequences
(5′→3′) |
|---|
| Reference
genes |
| Actin | β-actin | NM_007393.3 | Cytoskeletal
structural protein | F:
GGCTGTATTCCCCTCCATCG
R: CCAGTTGGTAACAATGCCATGT |
| GAPDH |
Glyceraldehyde-3-phosphate
dehydrogenase | NM_008084.2 | Involved in
glycolysis and gluconeogenesis | F:
AACGACCCCTTCATTGAC
R: TCCACGACATACTCAGCAC |
| PIPA | Peptidyl-prolyl
isomerase A | NM_008907.1 | Cis-trans
isomerization of oligopeptides, accelerate the folding of
proteins | F:
TGGAGCGTTTTGGGTCCAG3
R: AGCTGTCCACAGTCGGAAATG |
| TFRC | Transferrin
receptor | NM_011638.4 | Uptake of
iron-loaded transferrin into cells | F:
GTTTCTGCCAGCCCCTTATTAT
R: GCAAGGAAAGGATATGCAGCA |
| 18S | 18S ribosomal
RNA | NR_003278.3 | Eukaryotic small
ribosomal subunit | F:
ACCGCAGCTAGGAATAATGGA
R: GCCTCAGTTCCGAAAACCA |
| Tubulin | α1-tubulin | NM_011653.2 | Microtubules of the
eukaryotic cytoskeleton | F:
CCAGGGCTTCTTGGTTTTCC
R: CGCTCAATGTCGAGGTTTCT |
| 36-B4 | Ribosomal protein,
large, P0 | NM_007475.5 | Protein
synthesis | F:
TGAGATTCGGGATATGCTGTTGG
R: CGGGTCCTAGACCAGTGTTCT |
| HMBS | Hydroxymethylbilane
synthase | NM_001110251.1 | Heme synthesis and
porphyrin metabolism | F:
ATGAGGGTGATTCGAGTGGG
R: TTGTCTCCCGTGGTGGACATA |
| HPRT |
Hypoxanthine-guanine
phosphoribosyltransferase | NM_013556.2 | Purine
synthesis | F:
TCAGTCAACGGGGGACATAAA
R: GGGGCTGTACTGCTTAACCAG |
| B2M |
beta-2-microglobulin | NM_009735.3 | β chain of MHC
class I molecules | F:
TTCTGGTGCTTGTCTCACTGA
R: CAGTATGTTCGGCTTCCCATTC |
| Target genes |
| PPARγ2 | Peroxisome
proliferator-activated receptor | NM_001127330.1 | Induce
adipogenesis | F:
GCATGGTGCCTTCGCTGA
R: TGGCATCTCTGTGTCAACCATG |
| C/EBP-α | CCAAT/enhancer
binding protein α | NM_007678.3 | Activate the
promoters of fat-cell specific genes in adipogenesis | F:
CAAGAACAGCAACGAGTACCG
R: GTCACTGGTCAACTCCAGCAC |
Western blot analysis
Cells in 6-well plates were washed twice with
ice-cold PBS and placed immediately in lysis buffer containing 1 mM
phenylmethylsulfonyl fluoride (PMSF), protease inhibitor cocktail I
(Calbiochem/EMD Miliipore, Billerica, MA, USA) and phosphatase
inhibitor cocktail V (Merck, Darmstadt, Germany). Lysates were
gently mixed for 10 min at 4°C and then centrifuged at 13,000 × g
for 15 min at 4°C. The protein concentration of the extracts was
determined according to the method of Bradford, using BSA as the
standard. Samples were separated by SDS-PAGE on 8% polyacrylamide
gels and transferred onto PVDF-Plus membranes (Bio-Rad, Hercules,
CA, USA). Primary antibodies were detected with donkey anti-rabbit
at 1:2,000 for 1 h at room temperature. The blotted membrane was
developed with ECL Advance (Cell Signaling Technology, Boston, MA,
USA) and imaged with a LAS-4000 Super CCD Remote Control Science
Imaging System (Fuji, Tokyo, Japan).
Software determination of appropriate
reference genes and statistical analysis
For stability comparisons of candidate reference
genes, 3 validation software programs, GeNorm, NormFinder and
BestKeeper, were used according to their original publications
(10–12). Data are presented as the means ±
SEM. Comparisons were performed using ANOVA for multiple groups or
the Student’s t-test for 2 groups. A value of P<0.05 was
considered to indicate a statistically significant difference.
Results
Quality control for the accuracy of gene
expression by qRT-PCR
For obtaining accurate and reliable results of gene
expression, attention should be paid to well-differentiated
adipocytes, equal sample size, intact RNA and efficient primers
apart from reference genes (5,13).
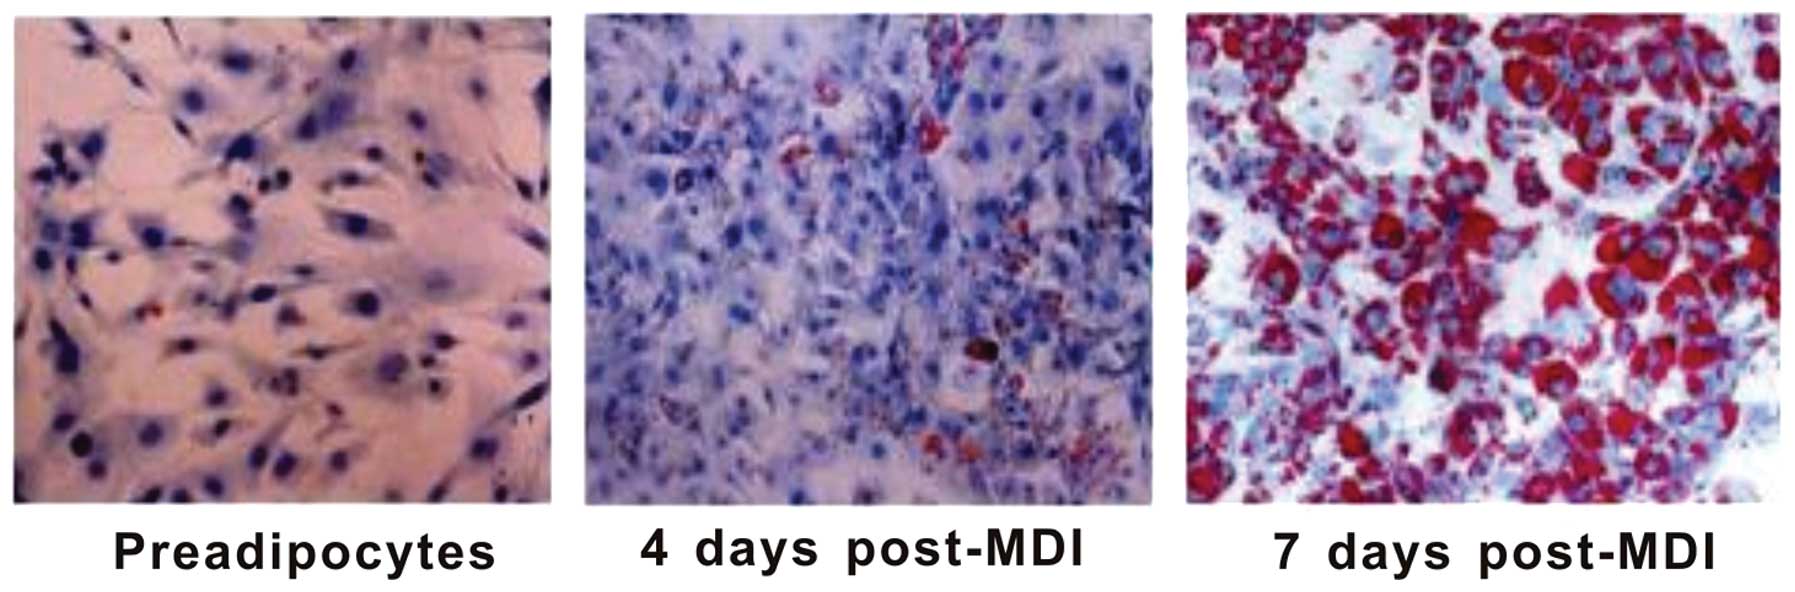
Whether preadipocytes converge into mature adipocytes is important
for research. As shown in Fig. 1,
3T3-L1 preadipocytes exhibited a similar morphology to fibroblasts.
The induction of differentiation for 4 days triggered deep
phenotypical changes of preadipocytes that became spherical, with
small lipid droplets in the cytoplasm, as shown by Oil Red O
staining. Seven days after induction, >90% of the cells showed
the phenotype of mature adipocytes, with a large number of lipid
droplets accumulated in the cytoplasm. To reduce inter-sample
variation, total RNA of 3T3-L1 adipocytes at different time points
after the induction of differentiation was isolated and reverse
transcribed at simultaneously. The mean A260/280 ratio of the RNA
samples was 1.98±0.03 and reflected pure and protein-free RNA. The
integrity of RNA samples was characterized by an 28S/18S ratio of
>2 on a 1% agarose gel. Real-time PCR was run in duplicate and
all samples at different time points were analyzed in the same run
in order to exclude between-run variations. A melting curve was
constructed for each primer pair to confirm product
specificity.
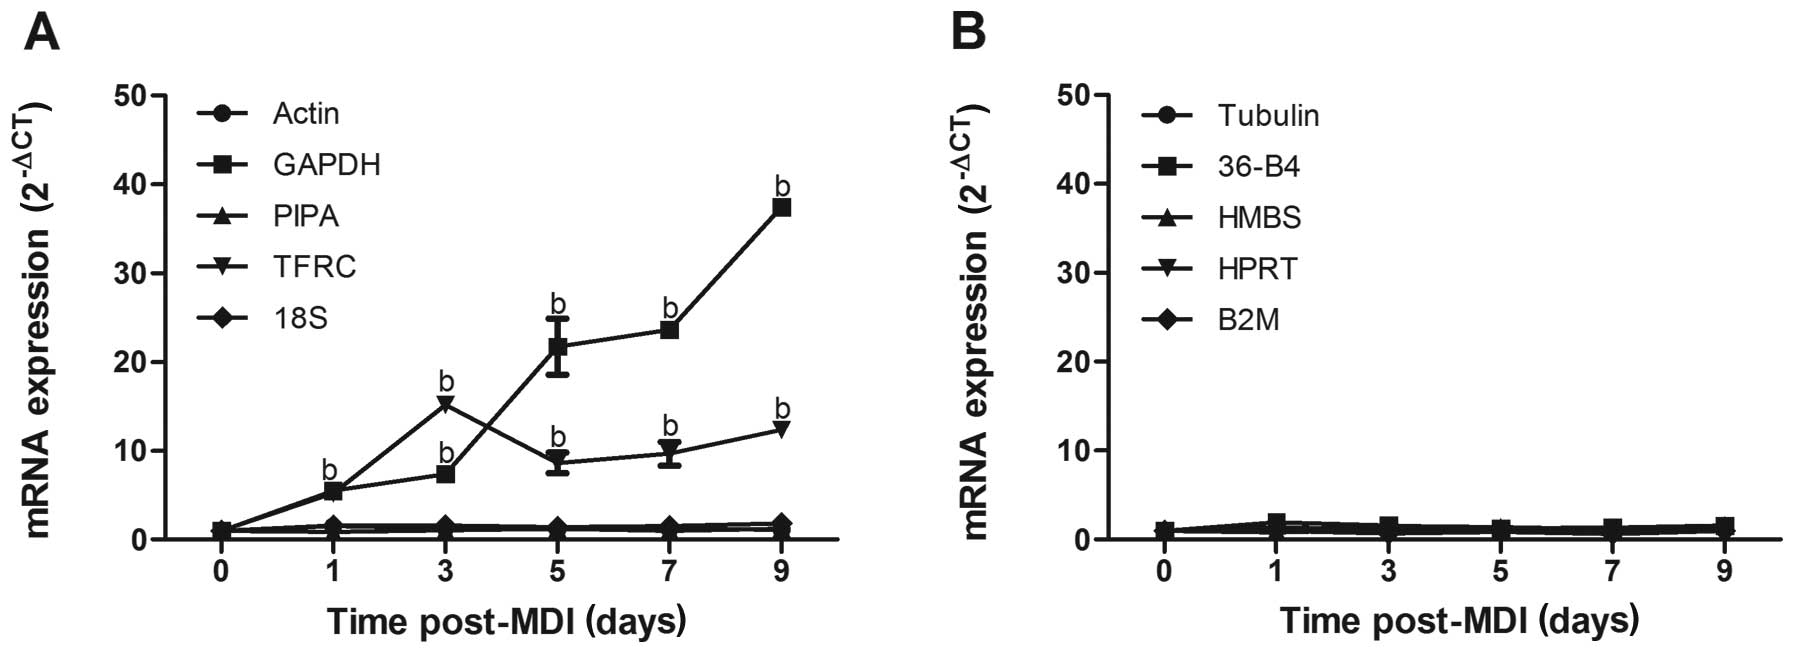
Non-normalized expression levels of
candidate reference genes during 3T3-L1 adipocyte
differentiation
Another essential strategy suggested for normalizing
qRT-PCR data is to use a suitable internal reference gene whose
expression should not change with treatment or under different
experimental conditions (5). It
is important to distinguish technical variability from true
biological changes in gene expression. According to the guidelines
described in the study by Gorzelniak (14), the difference in threshold cycle
number (ΔCT) values before and after induction (<±0.5) is
considered a fluctuation in gene expression that is largely due to
technical variance, while the ΔCT values (>±1.0) are strongly
suggestive of biological variability resulting from treatment or
experimental conditions. Among the 10 reference genes (Table I), the relative expression levels
of actin, peptidylprolyl isomerase A [PIPA (cyclophilin A)], 18S,
tubulin, ribosomal protein, large, P0 (36-B4), HMBS,
hypoxanthine-guanine phosphoribosyltransferase (HPRT) and
beta-2-microglobulin (B2M) fluctuated within the range ΔCT <±0.5
during the course of 3T3-L1 adipocyte differentiation (Fig. 2A and B), precluding these commonly
used reference genes for suitability under this experimental
condition. On the contrary, GAPDH and TFRC were disqualified as
suitable reference genes, with ΔCT values >±1.0 clearly
indicative of biological variability. The GAPDH mRNA level
increased by 6.2-, 7.5-, 22.1-, 24.1- and 17.5-fold on day 1, 3, 5,
7 and 9, respectively after the induction of differentiation
(P<0.01); the mRNA level of TFRC increased by 5.2-, 15.2-, 8.7-,
9.7- and 12.4-fold on day 1, 3, 5, 7 and 9, respectively
(P<0.01, Fig. 2A).
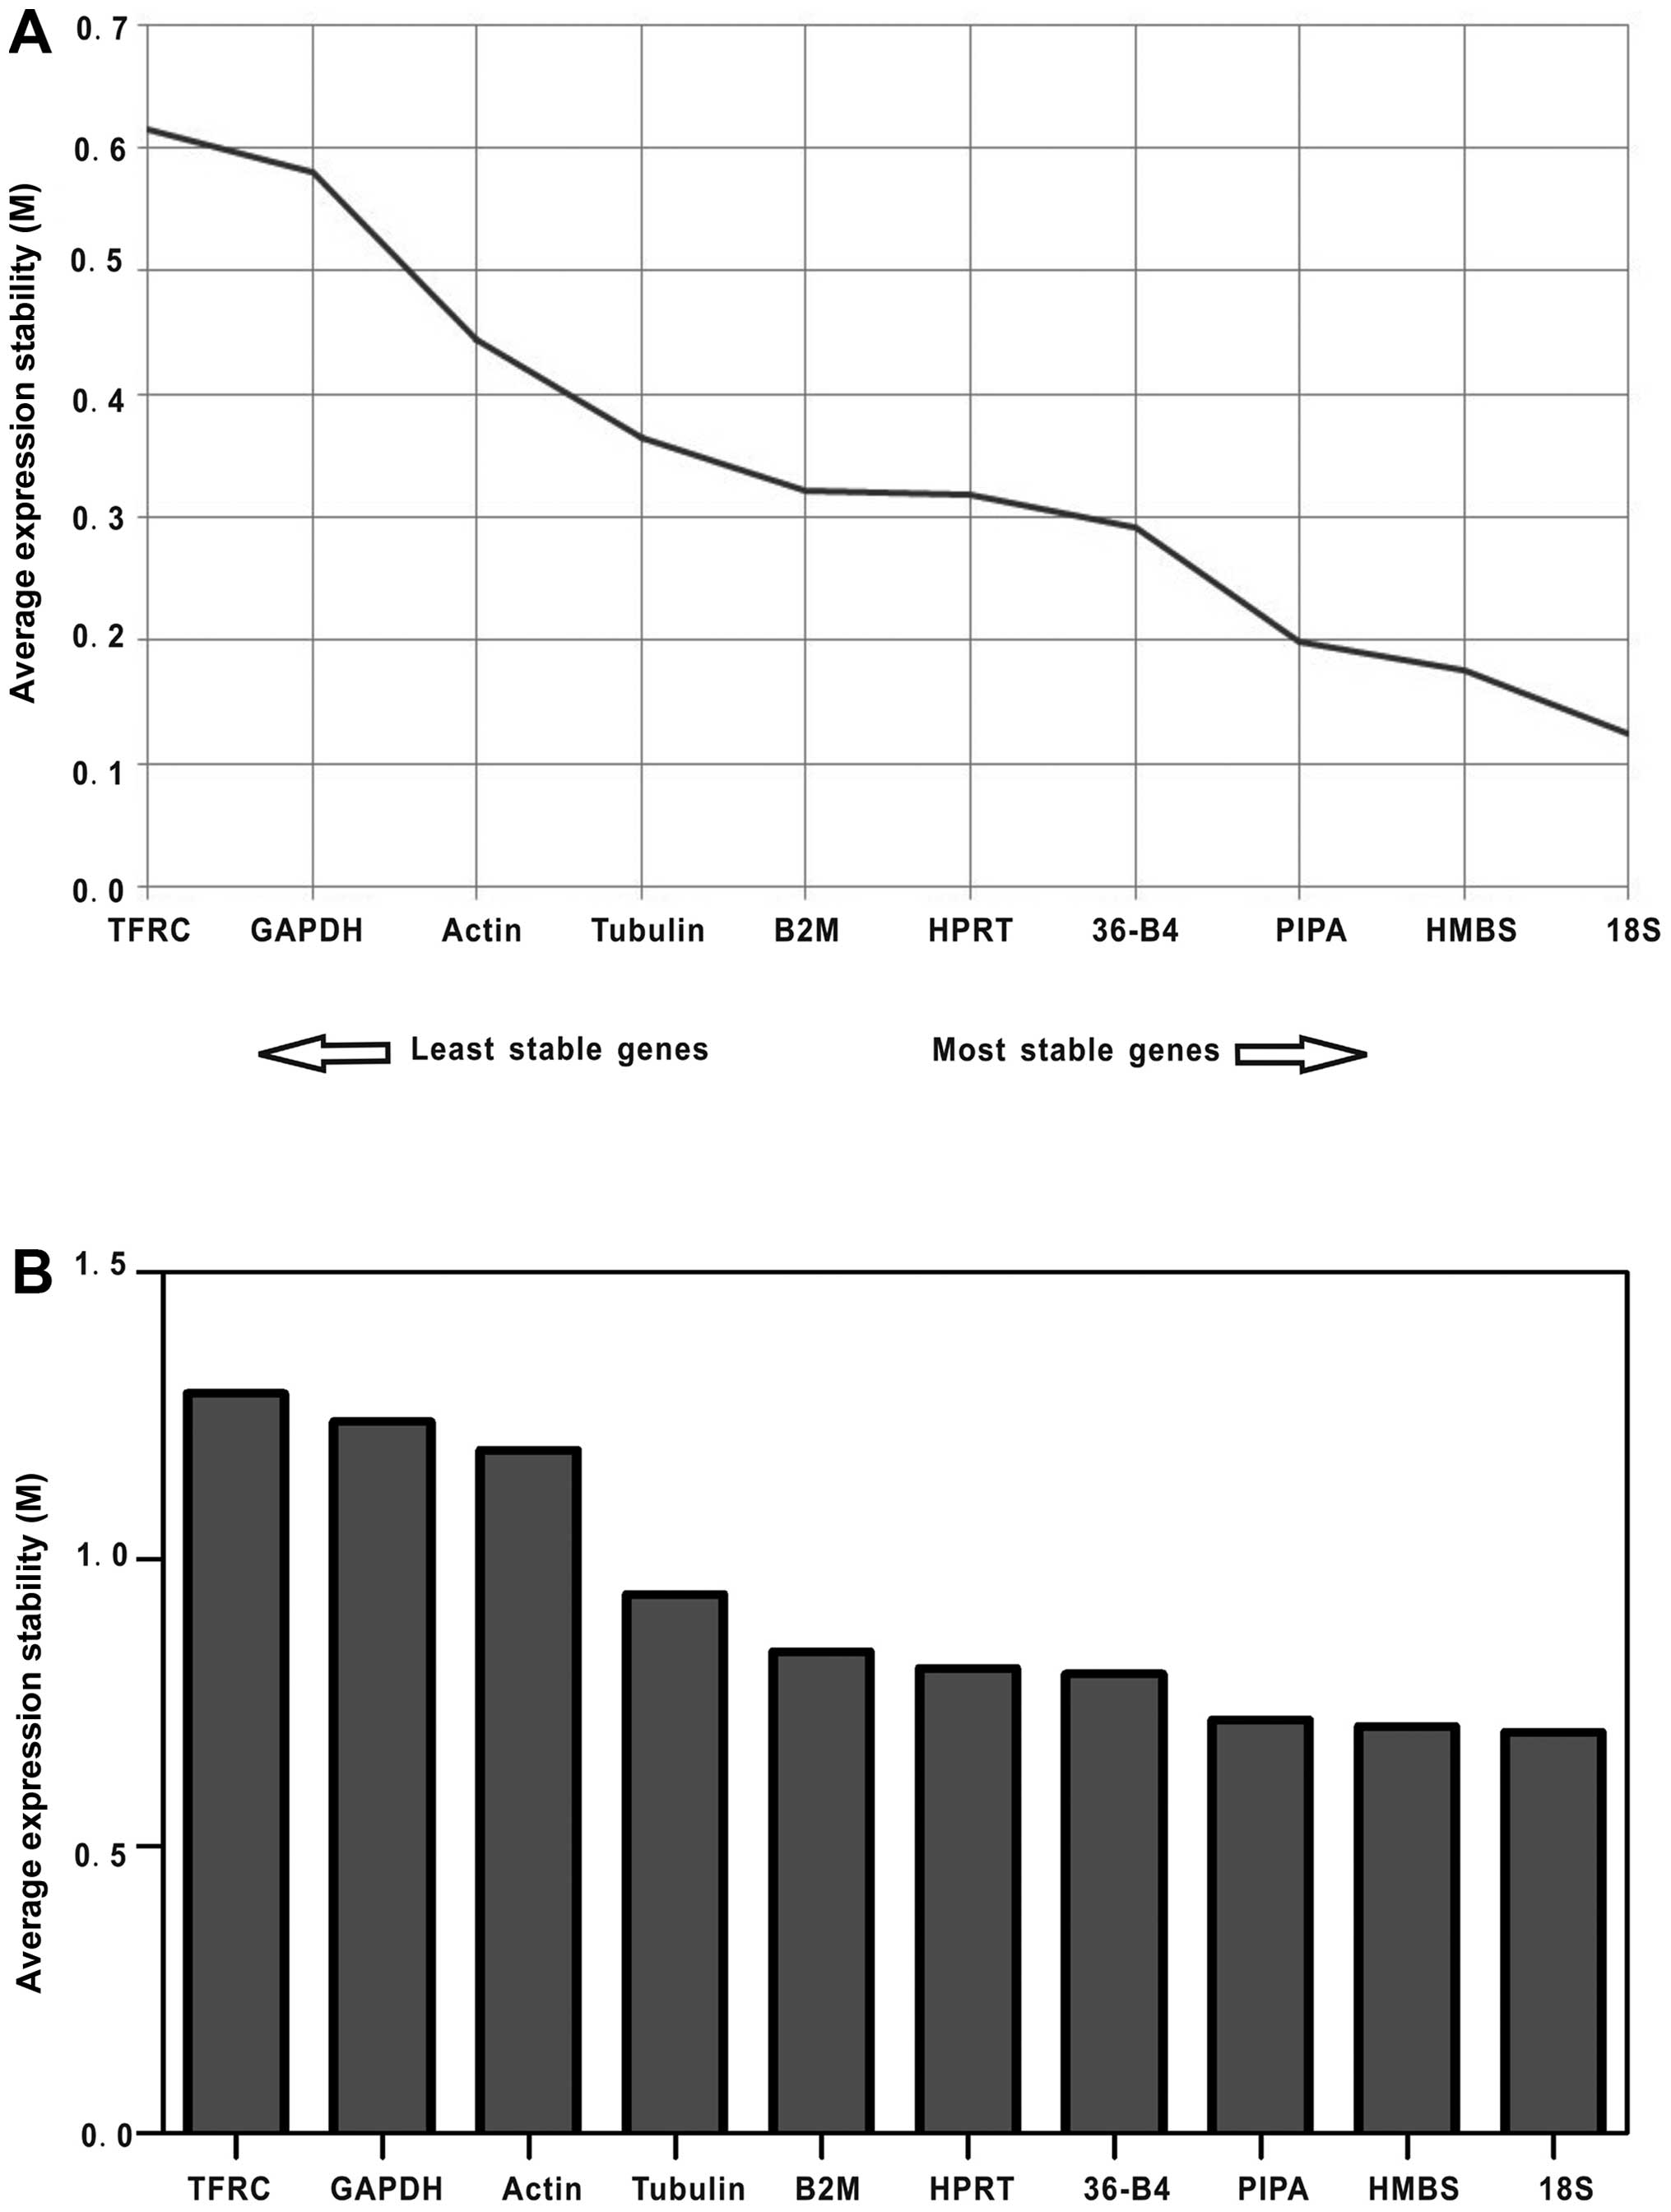
Statistical validation of appropriate
reference genes by GeNorm, NormFinder and BestKeeper
To identify the most suitable set of genes for
normalization during 3T3-L1 adipocyte differentiation, the
expression stability of the 10 candidate reference genes was
analyzed using the GeNorm, NormFinder and BestKeeper programs. The
GeNorm algorithm determines expression stability (M) through a
pair-wise comparison of one candidate reference gene and all other
candidate genes, independent of the level of gene expression for
each sample (10,15). The genes with the lowest M-values
will be considered to have the most stable expression during 3T3-L1
adipocyte differentiation (0–9 days). As a result, the ranking of
the M-values of the examined reference genes was as follows: 18S
> HMBS > PIPA > 36-B4 > HPRT > B2M > tubulin >
actin > GAPDH > TFRC (Fig.
3A).
NormFinder was designed to calculate stability by
using the combined estimation of intra- and intergroup expression
variations of the analyzed genes (11). Based on the calculated stability
values of the 10 reference genes shown in Fig. 3B, the NormFinder program validated
the findings of the GeNorm algorithm, in which the most unstable
reference genes were TFRC and GAPDH, and the most stable one was
18S followed by HMBS.
BestKeeper calculates the percentage coefficient of
variation (CV) and standard deviation (SD) using the crossing point
(CP) value of each candidate gene (12,16). As shown in Table II, GAPDH and TFRC remained the
most unstable reference genes, whereas HMBS and PIPA were ranked
the most stable reference genes, a finding that was different from
the other 2 software results.
| Table IIDetailed expression stability
analysis of candidate reference genes by BestKeeper software. |
Table II
Detailed expression stability
analysis of candidate reference genes by BestKeeper software.
| Gene | Actin | GAPDH | PIPA | TFRC | 18S | Tubulin | 36-B4 | HMBS | HPRT | B2M |
|---|
| n | 36 | 36 | 36 | 36 | 36 | 36 | 36 | 36 | 36 | 36 |
| geo Mean (CP) | 20.57 | 19.18 | 22.27 | 26.57 | 12.79 | 20.97 | 22.13 | 27.06 | 23.68 | 19.25 |
| ar Mean (CP) | 20.59 | 19.23 | 22.27 | 26.60 | 12.80 | 20.97 | 22.14 | 27.06 | 23.70 | 19.25 |
| Min (CP) | 19.38 | 17.07 | 21.55 | 24.73 | 12.05 | 20.06 | 20.95 | 26.22 | 22.54 | 18.18 |
| Max (CP) | 21.72 | 21.47 | 22.92 | 28.57 | 13.57 | 21.88 | 23.59 | 27.62 | 25.25 | 20.24 |
| Std dev. (±
CP) | 0.59 | 1.18 | 0.31 | 1.03 | 0.49 | 0.37 | 0.56 | 0.27 | 0.62 | 0.32 |
| CV (% CP) | 2.88 | 6.13 | 1.38 | 3.86 | 3.79 | 1.77 | 2.54 | 0.99 | 2.60 | 1.66 |
| Min (x-fold) | −2.29 | −4.32 | −1.64 | −3.59 | −1.68 | −1.88 | −2.27 | −1.79 | −2.22 | −2.10 |
| Max (x-fold) | 2.21 | 4.87 | 1.57 | 3.99 | 1.71 | 1.87 | 2.76 | 1.47 | 2.96 | 1.98 |
| Std dev. (±
x-fold) | 1.51 | 2.26 | 1.24 | 2.04 | 1.40 | 1.29 | 1.48 | 1.20 | 1.53 | 1.25 |
Taken together, the software analysis results
indicated that GAPDH and TFRC ranked as the least stable reference
genes, while 18S and HMBS ranked as the most stable ones (Table III). Therefore, GAPDH and TFRC
may not be a suitable choice for use as reference genes, whereas
18S and HMBS may serve well as reference genes during 3T3-L1
adipocyte differentiation.
| Table IIIRanking of reference gene stability
during 3T3-L1 adipocyte differentiation. |
Table III
Ranking of reference gene stability
during 3T3-L1 adipocyte differentiation.
| Ranking | BestKeeper | GeNorm | NormFinder |
|---|
| 1 | HMBS | 18S | 18S |
| 2 | PIPA | HMBS | HMBS |
| 3 | B2M | PIPA | PIPA |
| 4 | Tubulin | 36-B4 | 36-B4 |
| 5 | 18S | HPRT | B2M |
| 6 | 36-B4 | B2M | Tubulin |
| 7 | Actin | Tubulin | HPRT |
| 8 | HPRT | Actin | Actin |
| 9 | TFRC | GAPDH | TFRC |
| 10 | GAPDH | TFRC | GAPDH |
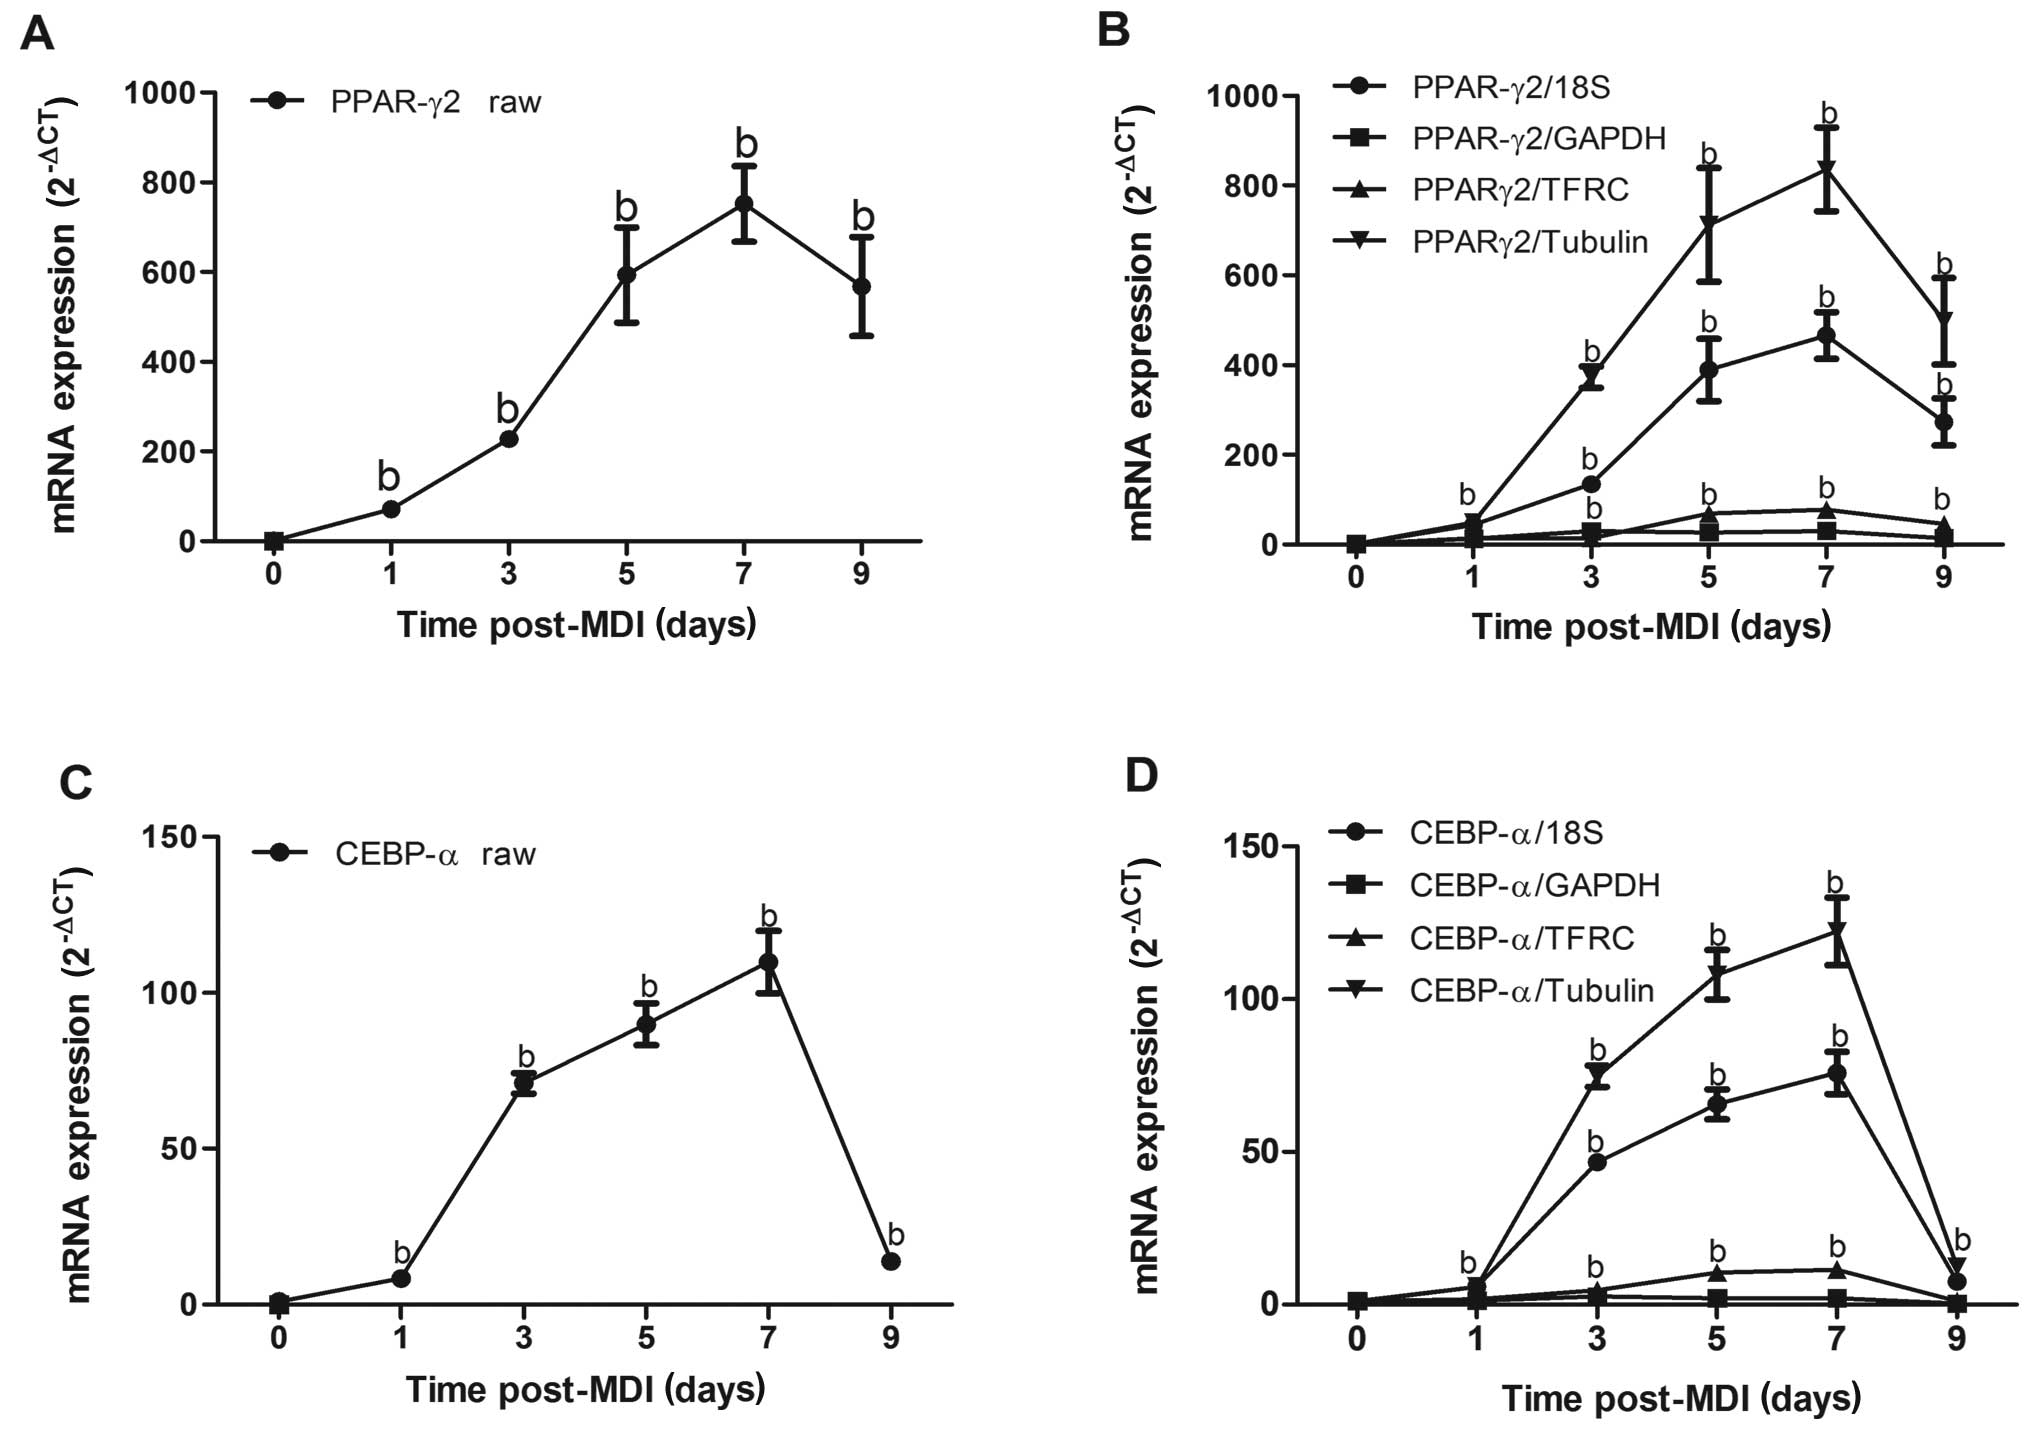
Expression levels of target gene
influenced by the selection of normalized genes
To illustrate the impact of reference gene selection
on the determination of target gene expression levels, the
expression profiles of 2 key transcription factors in adipocyte
differentiation, PPARγ2 and C/EBPα (2,17),
were individually normalized to 4 different reference genes with
varying degrees of suitability. We determined the non-normalized
mRNA expression profile of 2 target genes in the same samples used
in the determination of the reference gene expression profile. The
expression of PPARγ2 was gradually increased with the
differentiation of 3T3-L1 preadipocytes, reaching the peak with a
676-fold increase 7 days after induction (Fig. 4A). The expression profile of
PPARγ2 normalized to 18S or tubulin was consistent with its raw
expression, which gradually increased 1 day after induction and
reached its peak 7 days later. However, the magnitude of PPARγ2
expression was markedly attenuated when normalized to GAPHD or
TFRC, reaching only a 28- or 70-fold increase, respectively as
compared to a 466-fold or 551-fold increase when normalized to 18S
or tubulin, respectively 7 days after induction (Fig. 4B). Similarly, the magnitude of
C/EBPα expression when normalized to GAPDH was sharply decreased
compared with its raw expression (Fig. 4C and D). Collectively, these data
demonstrate that the selection of reference genes exerts a profound
impact on the experimental outcome, illustrating the critical need
to validate each reference gene in a cell-type and
condition-specific manner.
Effects of berberine on the expression
levels of reference genes
Berberine, one of the major constituents of the
Chinese herb, Rhizoma coptidis, has been reported to improve
insulin resistance and reduce hyperglycemia (18,19). Our previous study indicated that
berberine significantly inhibited 3T3-L1 adipocyte differentiation
(20), which has also been
confirmed by other studies (21,22). To further analyze the expression
stability of the reference genes, 5 μM berberine were added to the
cell culture during the differentiation of 3T3-L1 adipocytes. The
results revealed that GAPDH mRNA expression was significantly
reduced by berberine at all stages of adipocyte differentiation
(P<0.05 or P<0.01), reduced by 68 and 66% at 5 and 7 days,
respectively. As expected, there were no significant changes in the
expression levels of the other 8 reference gene in the presence of
berberine apart from TFRC (Fig.
5).
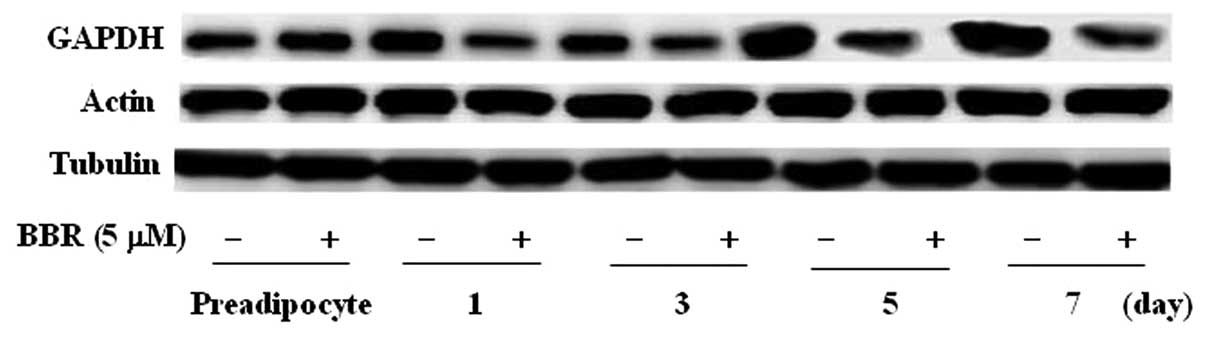
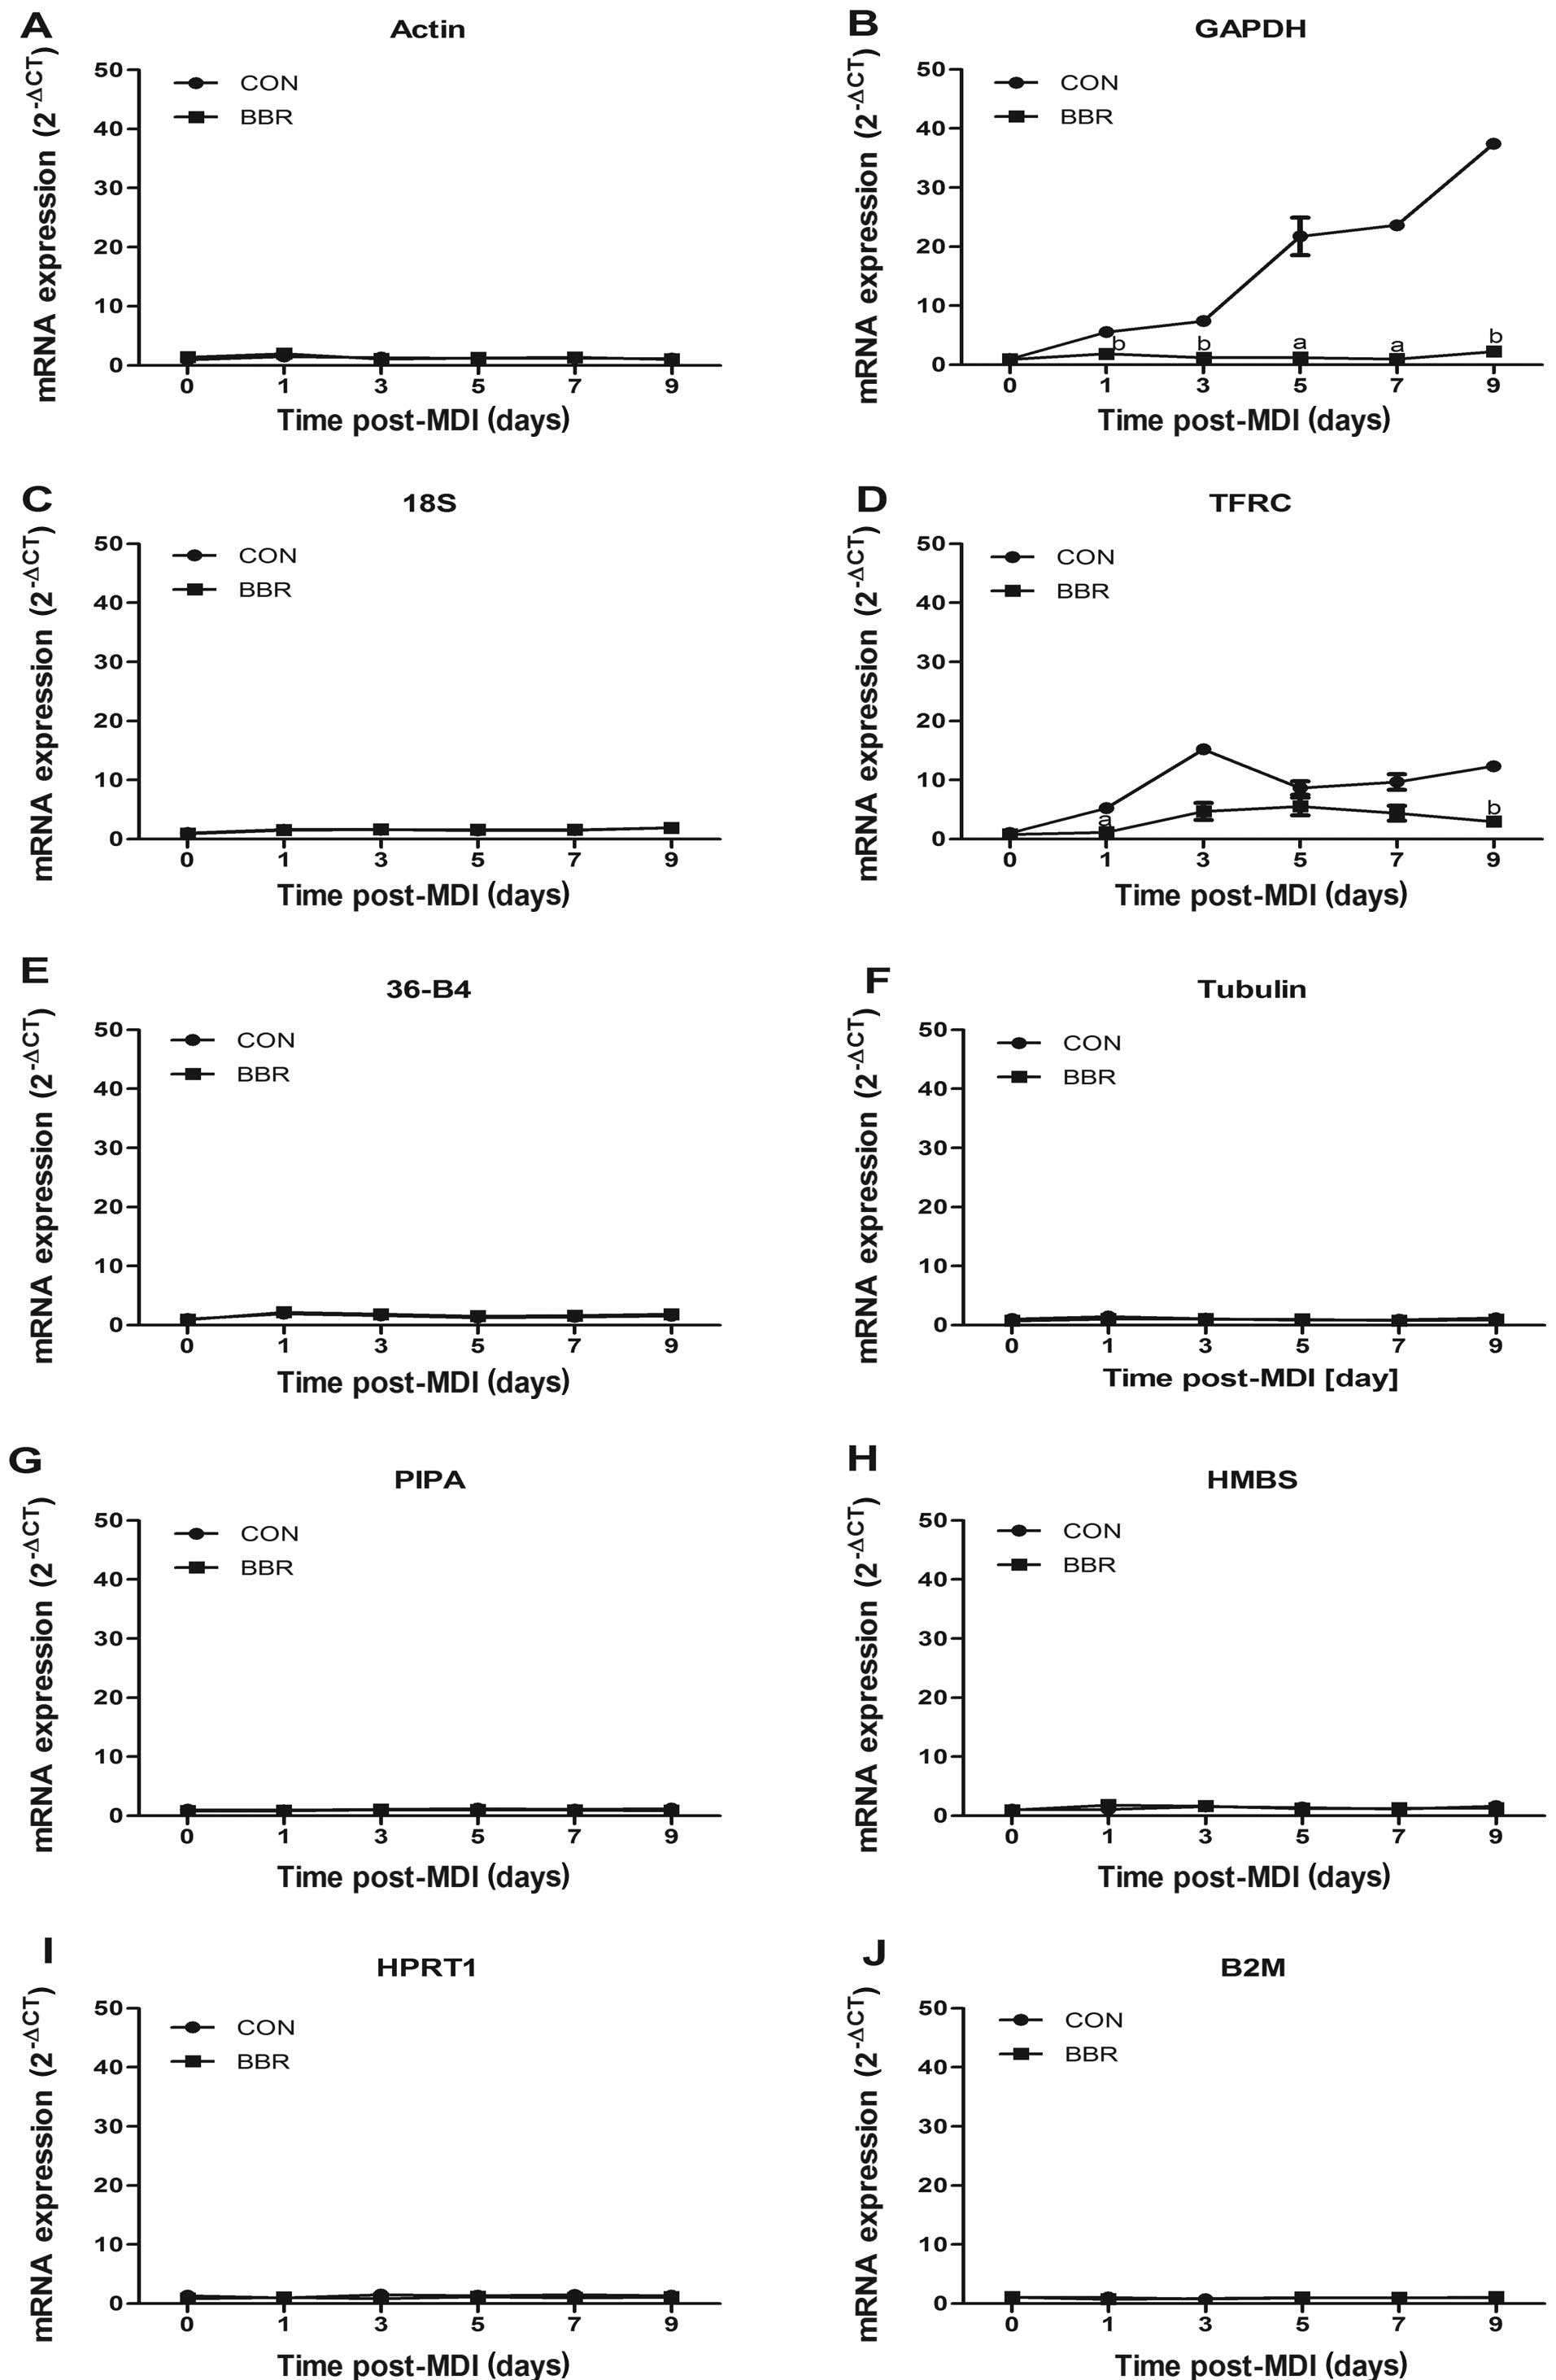 | Figure 5Effects of berberine on mRNA
expression levels of candidate reference genes. Total RNA was
isolated from the differentiated 3T3-L1 cells (0–9 days) in the
presence or absence of 5 μM berberine (BBR). Relative
quantification analysis of (A) actin, (B) GAPDH, (C) 18S, (D) TFRC,
(E) 36-B4, (F) tubulin, (G) PIPA, (H) HMBS, (I) HPRT, (J) B2M gene
expression levels was conducted by the 2−ΔCT method.
Data are expressed as the relative fold to day 0. Significance was
established at aP<0.05, bP<0.01
compared with day 0. |
In addition, we further detected the protein
expression levels of 3 commonly used reference genes. Western blot
analysis revealed that GAPDH protein expression markedly increased
at 5 and 7 days after induction, while there were no obvious
changes in actin and tubulin protein expression throughout
adipocyte differentiation. GAPDH protein expression levels were
inhibited by berberine, but not those of actin and tubulin
(Fig. 6). Consequently, GAPDH is
not appropriate as a reference gene for western blot analysis
during 3T3-L1 adipocyte differentiation.
Discussion
qRT-PCR has become one of the most popular
techniques for quantifying mRNA levels, particularly for
low-abundance genes. For the accurate and reliable analysis of
target gene expression, the normalization of qRT-PCR data with
suitable internal reference genes is required (5). Normalization is essential to correct
the non-specific variations arising from the difference in the
amount of template used and its quality, which can affect the
efficiency of the qRT-PCR reactions (11). The strategy is based on the
assumption that reference genes are stably expressed. However,
there is mounting evidence suggesting that the expression of
internal reference genes may vary significantly under different
experimental conditions, opening the possibility that erroneous
information could be generated if data normalization is based on
genes that themselves are regulated (9,23,24). Reference genes are essential
endogenous regulatory genes that are involved in various processes
in the cell, such as metabolism, cell structure, gene transcription
and homeostasis (25). Adipocyte
differentiation is a process where cells undergo marked
morphological changes, accompanied by substantial biochemical
changes, such as cell cycle exit and changes in biochemical
processes, metabolism and cytoskeletal components (3,26).
Significant modifications in gene expression therefore underlie
these vast arrays of protein and cellular changes. Therefore, in
this study, we evaluated 10 commonly used candidate reference genes
for normalizing qRT-PCR gene expression data during the course of
3T3-L1 adipocyte differentiation.
Firstly, we evaluated the differentiation status of
3T3-L1 adipocytes using Oil Red O staining. The results revealed
that 3T3-L1 adipocytes were filled with lipid 7 days after the
induction of differentiation, along with a significant increase in
the PPARγ2 mRNA level. Therefore, these cells were considered to be
fully differentiated. Secondly, the samples of various groups were
simultaneously extracted, reversed and amplified to reduce
intersample variability. We directly compared the CT values of all
candidate reference genes in 3T3-L1 adipocytes differentiated for
different periods of time (different number of days). As ΔCT values
are exponents, all validation data were converted to ‘fold changes’
using the 2−ΔCT method for raw data. Accordingly, a ΔCT
value of −0.5 and +0.5 is equivalent to 0.7- and 1.4-fold changes
in relative gene expression, respectively. Using the criterion of
ΔCT ≤±0.5 as a delimiter of reference gene suitability, we
identified 8 reference genes (actin, PIPA, 18S, tubulin, 36-b4,
HMBS, HPRT and B2M) suitable for use in target gene normalization.
However, GAPDH and TFRC mRNA expression levels fluctuated with (ΔCT
>1.0) after 3T3-L1 adipocyte differentiation, showing dramatic
increases as compared to before induction. Thus, the 2 genes were
inappropriate as endogenous reference genes under this experimental
condition.
As a simple comparison of CT values revealed an
‘overall expression variation’ for the candidate reference genes,
we further evaluated the expression stability of the 10 candidate
reference genes using 3 software programs. Despite the differences
we found in the reference gene ranking when using different
statistical approaches, there was a general agreement among the
methods for the determination of the most stable and unstable
genes. The GeNorm and NormFinder identified 18S and HMBS as the
most stable genes, while BestKeeper recommended HMBS and PIPA as
the most stable ones. The 3 software programs all identified GAPDH
and TFRC as the least stable genes, which confirmed the simple
comparison of the CT value according to the guideline described in
the study by Gorzelniak (14).
Previous studies have revealed the expression stability of 18S
during 3T3-L1 adipocyte differentiation and in human adipose tissue
(7,27), as well as under a number of
experimental conditions (8,28).
Therefore, 18S, as opposed to HMBS was recommended for normalizing
target gene expression in this study.
GAPDH is a classic glycolytic enzyme and has been
traditionally considered as a reference gene, the levels of which
are considered remain stable under different manipulations. Two
previous studies have demonstrated that GAPDH is a stably expressed
gene in human adipose cells across a wide range of experimental
settings (14) and in the
epicardial adipose tissues of lean, overweight and obese patients
undergoing coronary artery bypass grafting (29). Even in studies involving adipocyte
differentiation, GAPDH was still seleced as an endogenous reference
gene (30,31). However, substantial evidence has
revealed that the GAPDH gene expression level varies considerably
in adipose tissue (27,32) and in other tissues or cultured
cells under different situations (9,33,34). As demonstrated in differentiating
adipocytes (6,7) and in adipose tissue derived from
genetically obese rats (35,36), the upregulation of GAPDH parallels
the acquisition of the full lipogenic phenotype. Moreover, GAPDH
mRNA expression is stimulated by multiple factors, such as insulin,
AMP analogs, T3 and norepinephrine involved in adipocyte
differentiation (6,37). Therefore, GAPDH is considered an
important adipogenic marker (38,39). In the present study, GAPDH mRNA
and protein levels were gradually increased with the maturity of
differentiated 3T3-L1 adipocytes, particularly at the later stages
of differentiation, which was abrogated by berberine, an inhibitor
of adipogenesis. Thus, GAPDH is not recommended as an endogenous
control gene during adipocyte differentiation for qRT-PCR as well
as western blot analysis.
Insulin elicits a redistribution in TFRC expression
in 3T3-L1 adipocytes through an increase in the rate constant for
receptor externalization (40).
TFRC mRNA expression has been shown to be upregulated in omental
and subcutaneous adipose tissue of obese patients (27). Gabrielsen et al observed a
40% decrease in TFRC mRNA expression in adipocytes from mice fed a
high-iron diet compared with that in mice fed normal chow (41). In the current study, the increased
TFRC mRNA expression throughout 3T3-L1 adipocyte differentiation
was reduced by berberine, suggesting that TFRC is an unstably
expressed gene in adipocytes.
The expression profiles of target genes can be
markedly influenced depending on the choice of normalization genes.
If the wrong reference gene is selected, it can result in false
findings (23). This was
reflected in our study. The expression profiles of 2 key adipogenic
regulators, PPARγ2 and C/EBPα, when normalized to 18S and tubulin
were similar to their raw expression levels (Fig. 4). PPARγ2 expression normalized to
18S increased by 44- to 466-fold throughout 3T3-L1 adipocyte
differentiation, exhibiting the well-established model of mature
adipocytes. However, the increased folds of 2 target gene
expression levels were markedly decreased when normalized to GAPDH
and TFRC at various stages of adipocyte differentiation. The false
results are expectedly drawn that the expression levels of 8 stable
reference genes will markedly decrease if normalized to GAPDH.
This study clearly demonstrates the critical
importance of reference gene validation for adipocyte
differentiation studies, and highlights GAPDH and TFRC as
unsuitable reference genes under this condition. 18S and HMBS are
the most suitable reference genes for normalizing target genes
during the course of 3T3-L1 adipocyte differentiation. The other 6
reference genes (actin, PIPA, Tubulin, 36-B4, HPRT and B2M) also
showed relatively stable expression levels.
Acknowledgements
This study was funded by grants from the National
Natural Science Foundation of China (30600294, 81070652, 81070617,
81170720, 81261120564 and 81270910).
Abbreviations:
|
IBMX
|
3-isobutyl-1-methylxanthine
|
|
qRT-PCR
|
quantitative reverse
transcription-polymerase chain reaction
|
|
GAPDH
|
glyceraldehyde-3-phosphate
dehydrogenase
|
|
actin
|
β-actin
|
|
18S
|
18 ribosomal RNA
|
|
HMBS
|
hydroxymethylbilane synthase
|
|
TFRC
|
transferrin receptor
|
|
PPARγ2
|
peroxisome proliferator-activated
receptor γ2
|
|
C/EBP
|
CCAAT/enhanced binding protein
|
|
BSA
|
bovine serum albumin
|
|
FBS
|
fetal bovine serum
|
|
PBS
|
phosphate-buffered saline
|
|
PIPA
|
cyclophilin A
|
|
36-B4
|
ribosomal protein, large, P0
|
|
HPRT
|
hypoxanthine-guanine
phosphoribosyltransferase
|
|
B2M
|
beta-2- microglobulin
|
References
|
1
|
Waki H and Tontonoz P: Endocrine functions
of adipose tissue. Annu Rev Pathol. 2:31–56. 2007. View Article : Google Scholar
|
|
2
|
Kershaw EE and Flier JS: Adipose tissue as
an endocrine organ. J Clin Endocrinol Metab. 89:2548–2556. 2004.
View Article : Google Scholar : PubMed/NCBI
|
|
3
|
Gregoire FM, Smas CM and Sul HS:
Understanding adipocyte differentiation. Physiol Rev. 78:783–809.
1998.PubMed/NCBI
|
|
4
|
Pfaffl MW: The ongoing evolution of qPCR.
Methods. 50:215–216. 2010. View Article : Google Scholar : PubMed/NCBI
|
|
5
|
Huggett J, Dheda K, Bustin S and Zumla A:
Real-time RT-PCR normalisation; strategies and considerations.
Genes Immun. 6:279–284. 2005. View Article : Google Scholar : PubMed/NCBI
|
|
6
|
Barroso I, Benito B, Garci-Jimenez C,
Hernandez A, Obregon MJ and Santisteban P: Norepinephrine,
tri-iodothyronine and insulin upregulate glyceraldehyde-3-phosphate
dehydrogenase mRNA during Brown adipocyte differentiation. Eur J
Endocrinol. 141:169–179. 1999. View Article : Google Scholar
|
|
7
|
Ferguson BS, Nam H, Hopkins RG and
Morrison RF: Impact of reference gene selection for target gene
normalization on experimental outcome using real-time qRT-PCR in
adipocytes. PLoS One. 5:e152082010. View Article : Google Scholar : PubMed/NCBI
|
|
8
|
Bas A, Forsberg G, Hammarström S and
Hammarström ML: Utility of the housekeeping genes 18S rRNA,
beta-actin and glyceraldehyde-3-phosphate-dehydrogenase for
normalization in real-time quantitative reverse
transcriptase-polymerase chain reaction analysis of gene expression
in human T lymphocytes. Scand J Immunol. 59:566–573. 2004.
View Article : Google Scholar
|
|
9
|
Stephens AS, Stephens SR and Morrison NA:
Internal control genes for quantitative RT-PCR expression analysis
in mouse osteoblasts, osteoclasts and macrophages. BMC Res Notes.
4:4102011. View Article : Google Scholar : PubMed/NCBI
|
|
10
|
Vandesompele J, De Preter K, Pattyn F,
Poppe B, Van Roy N, De Paepe A and Speleman F: Accurate
normalization of real-time quantitative RT-PCR data by geometric
averaging of multiple internal control genes. Genome Biol.
3:RESEARCH00342002. View Article : Google Scholar : PubMed/NCBI
|
|
11
|
Andersen CL, Jensen JL and Orntoft TF:
Normalization of real-time quantitative reverse transcription-PCR
data: a model-based variance estimation approach to identify genes
suited for normalization, applied to bladder and colon cancer data
sets. Cancer Res. 64:5245–5250. 2004. View Article : Google Scholar
|
|
12
|
Pfaffl MW, Tichopad A, Prgomet C and
Neuvians TP: Determination of stable housekeeping genes,
differentially regulated target genes and sample integrity:
BestKeeper - Excel-based tool using pair-wise correlations.
Biotechnol Lett. 26:509–515. 2004. View Article : Google Scholar
|
|
13
|
Derveaux S, Vandesompele J and Hellemans
J: How to do successful gene expression analysis using real-time
PCR. Methods. 50:227–230. 2010. View Article : Google Scholar : PubMed/NCBI
|
|
14
|
Gorzelniak K, Janke J, Engeli S and Sharma
AM: Validation of endogenous controls for gene expression studies
in human adipocytes and preadipocytes. Horm Metab Res. 33:625–627.
2001. View Article : Google Scholar : PubMed/NCBI
|
|
15
|
Tatsumi K, Ohashi K, Taminishi S, Okano T,
Yoshioka A and Shima M: Reference gene selection for real-time
RT-PCR in regenerating mouse livers. Biochem Biophys Res Commun.
374:106–110. 2008. View Article : Google Scholar : PubMed/NCBI
|
|
16
|
Stern-Straeter J, Bonaterra GA, Hormann K,
Kinscherf R and Goessler UR: Identification of valid reference
genes during the differentiation of human myoblasts. BMC Mol Biol.
10:662009. View Article : Google Scholar : PubMed/NCBI
|
|
17
|
Farmer SR: Transcriptional control of
adipocyte formation. Cell Metab. 4:263–273. 2006. View Article : Google Scholar
|
|
18
|
Zhou L, Wang X, Shao L, Yang Y, Shang W,
Yuan G, Jiang B, Li F, Tang J, Jing H and Chen M: Berberine acutely
inhibits insulin secretion from beta-cells through 3′,5′-cyclic
adenosine 5′-monophosphate signaling pathway. Endocrinology.
149:4510–4518. 2008.PubMed/NCBI
|
|
19
|
Zhou L, Yang Y, Wang X, Liu SS, Shang W,
Yuan G, Li F, Tang J, Chen M and Chen J: Berberine stimulates
glucose transport through a mechanism distinct from insulin.
Metabolism. 56:405–412. 2007. View Article : Google Scholar : PubMed/NCBI
|
|
20
|
Zhou LB, Chen MD, Wang X, Song HD, Yang Y,
Tang JF, Li FY, Xu MY and Chen JL: Effect of berberine on the
differentiation of adipocyte. Zhonghua Yi Xue Za Zhi. 83:338–340.
2003.(In Chinese).
|
|
21
|
Huang C, Zhang Y, Gong Z, Sheng X, Li Z,
Zhang W and Qin Y: Berberine inhibits 3T3-L1 adipocyte
differentiation through the PPARgamma pathway. Biochem Biophys Res
Commun. 348:571–578. 2006. View Article : Google Scholar : PubMed/NCBI
|
|
22
|
Pham TP, Kwon J and Shin J: Berberine
exerts anti-adipogenic activity through up-regulation of C/EBP
inhibitors, CHOP and DEC2. Biochem Biophys Res Commun. 413:376–382.
2011. View Article : Google Scholar : PubMed/NCBI
|
|
23
|
Dheda K, Huggett JF, Bustin SA, Johnson
MA, Rook G and Zumla A: Validation of housekeeping genes for
normalizing RNA expression in real-time PCR. Biotechniques.
37:112–114. 116118–119. 2004.
|
|
24
|
Tricarico C, Pinzani P, Bianchi S,
Paglierani M, Distante V, Pazzagli M, Bustin SA and Orlando C:
Quantitative real-time reverse transcription polymerase chain
reaction: normalization to rRNA or single housekeeping genes is
inappropriate for human tissue biopsies. Anal Biochem. 309:293–300.
2002. View Article : Google Scholar
|
|
25
|
Touchberry CD, Wacker MJ, Richmond SR,
Whitman SA and Godard MP: Age-related changes in relative
expression of real-time PCR housekeeping genes in human skeletal
muscle. J Biomol Tech. 17:157–162. 2006.PubMed/NCBI
|
|
26
|
Poulos SP, Dodson MV and Hausman GJ: Cell
line models for differentiation: preadipocytes and adipocytes. Exp
Biol Med. 235:1185–1193. 2010. View Article : Google Scholar : PubMed/NCBI
|
|
27
|
Catalán V, Gómez-Ambrosi J, Rotellar F,
Silva C, Rodríguez A, Salvador J, Gil MJ, Cienfuegos JA and
Frühbeck G: Validation of endogenous control genes in human adipose
tissue: relevance to obesity and obesity-associated type 2 diabetes
mellitus. Horm Metab Res. 39:495–500. 2007.PubMed/NCBI
|
|
28
|
Schmid H, Cohen CD, Henger A, Irrgang S,
Schlondorff D and Kretzler M: Validation of endogenous controls for
gene expression analysis in microdissected human renal biopsies.
Kidney Int. 64:356–360. 2003. View Article : Google Scholar : PubMed/NCBI
|
|
29
|
Chechi K, Gelinas Y, Mathieu P, Deshaies Y
and Richard D: Validation of reference genes for the relative
quantification of gene expression in human epicardial adipose
tissue. PLoS One. 7:e322652012. View Article : Google Scholar : PubMed/NCBI
|
|
30
|
Janke J, Engeli S, Gorzelniak K, Luft FC
and Sharma AM: Resistin gene expression in human adipocytes is not
related to insulin resistance. Obes Res. 10:1–5. 2002. View Article : Google Scholar : PubMed/NCBI
|
|
31
|
Choi K: The role of ghrelin and growth
hormone secretagogues receptor on rat adipogenesis. Endocrinology.
144:754–759. 2003. View Article : Google Scholar : PubMed/NCBI
|
|
32
|
Liu YM, Lacorte JM, Viguerie N, Poitou C,
Pelloux V, Guy-Grand B, Coussieu C, Langin D, Basdevant A and
Clément K: Adiponectin gene expression in subcutaneous adipose
tissue of obese women in response to shortterm very low calorie
diet and refeeding. J Clin Endocrinol Metab. 88:5881–5886. 2003.
View Article : Google Scholar : PubMed/NCBI
|
|
33
|
Sikand K, Singh J, Ebron JS and Shukla GC:
Housekeeping gene selection advisory: glyceraldehyde-3-phosphate
dehydrogenase (GAPDH) and beta-actin are targets of miR-644a. PLoS
One. 7:e475102012. View Article : Google Scholar : PubMed/NCBI
|
|
34
|
Li YL, Ye F, Hu Y, Lu WG and Xie X:
Identification of suitable reference genes for gene expression
studies of human serous ovarian cancer by real-time polymerase
chain reaction. Anal Biochem. 394:110–116. 2009. View Article : Google Scholar : PubMed/NCBI
|
|
35
|
Rolland V, Dugail I, Le Liepvre X and
Lavau M: Evidence of increased glyceraldehyde-3-phosphate
dehydrogenase and fatty acid synthetase promoter activities in
transiently transfected adipocytes from genetically obese rats. J
Biol Chem. 270:1102–1106. 1995. View Article : Google Scholar
|
|
36
|
Dugail I, Quignard-Boulangé A, Le Liepvre
X, Ardouin B and Lavau M: Gene expression of lipid storage-related
enzymes in adipose tissue of the genetically obese Zucker rat.
Co-ordinated increase in transcriptional activity and potentiation
by hyperinsulinaemia. Biochem J. 281:607–611. 1992.
|
|
37
|
Alexander MC, Lomanto M, Nasrin N and
Ramadka C: Insulin stimulates glyceraldehyde-3-phosphate
dehydrogenase gene expression through cis-acting DNA sequences.
Proc Natl Acad Sci USA. 85:5092–5096. 1988. View Article : Google Scholar : PubMed/NCBI
|
|
38
|
Wang ZX, Jiang CS, Liu L, Wang XH, Jin HJ,
Wu Q and Chen Q: The role of Akt on arsenic trioxide suppression of
3T3-L1 preadipocyte differentiation. Cell Res. 15:379–386. 2005.
View Article : Google Scholar : PubMed/NCBI
|
|
39
|
Gary-Bobo M, Elachouri G, Scatton B, Le
Fur G, Oury-Donat F and Bensaid M: The cannabinoid CB1 receptor
antagonist rimonabant (SR141716) inhibits cell proliferation and
increases markers of adipocyte maturation in cultured mouse 3T3
F442A preadipocytes. Mol Pharmacol. 69:471–478. 2006. View Article : Google Scholar
|
|
40
|
Tanner LI and Lienhard GE: Insulin elicits
a redistribution of transferrin receptors in 3T3-L1 adipocytes
through an increase in the rate constant for receptor
externalization. J Biol Chem. 262:8975–8980. 1987.
|
|
41
|
Gabrielsen JS, Gao Y, Simcox JA, Huang J,
Thorup D, Jones D, Cooksey RC, Gabrielsen D, Adams TD, Hunt SC,
Hopkins PN, Cefalu WT and McClain DA: Adipocyte iron regulates
adiponectin and insulin sensitivity. J Clin Invest. 122:3529–3540.
2012. View Article : Google Scholar : PubMed/NCBI
|