Introduction
Skeletal muscle atrophy is a complex biochemical
process occurring under various pathophysiological conditions in
adult animals, such as disuse (e.g., immobilization, denervation,
muscle unloading), starvation, aging and in syndromes, such as
cachexia (1). It is important to
understand the molecular mechanisms underlying skeletal muscle
atrophy and to develop effective strategies to delay its onset
(2–4). Denervation-induced muscle atrophy
has received attention as it is commonly encountered in clinical
practice and is very likely to cause extreme adverse effects
(5,6). A number of factors that contribute
to denervation-induced muscle atrophy have been identified,
including neuromuscular alterations, altered protein synthesis and
degradation, and apoptosis-induced muscle fiber loss (7–10).
However, previous studies have mainly focused on single gene and/or
protein changes potentially linked to skeletal muscle atrophy.
Therefore, a global investigation of the protein expression changes
may help to decipher the molecular basis of denervation-induced
skeletal muscle atrophy.
Proteomics is a well-established approach for
simultaneously detecting the expression of a high number of
proteins in biological samples. Among the different proteomic
techniques, isobaric tags for relative and absolute quantification
(iTRAQ) labeling, albeit initially developed on the basis of
traditional two-dimensional electrophoresis (2-DE), is particularly
suitable and has proven to far surpass 2-DE in sample coverage and
protein separation efficiency (11). iTRAQ coupled with two-dimensional
liquid chromatography-tandem mass spectrometry (2D LC-MS/MS)
represents a state-of-the art tool, extensively used to identify
and quantify differential proteomes.
In this study, we first examined the protein
expression profile in denervated tibialis anterior (TA) muscle
following sciatic nerve transection in rats, and then classified
the differentially expressed proteins using Gene Ontology (GO)
functional annotation and the Kyoto Encyclopedia of Genes and
Genomes (KEGG) pathway terms, so as to investigate the functional
implications of differential expression in TA muscle during
denervation-induced atrophy. Additional protein-protein interaction
analysis revealed that the tumor necrosis factor
receptor-associated factor-6 (TRAF6) protein was also
differentially expressed in denervated TA muscle, although this
protein was not detected in our proteomics analysis, possibly due
to its low abundance. TRAF6 knockdown experiments provided further
evidence of the biological significance of TRAF6 in skeletal muscle
atrophy.
Materials and methods
Animals and surgical procedures
Adult female Sprague-Dawley (SD) rats, weighing
180–220 g, were provided by the Experimental Animal Center of
Nantong University. The rats were randomly divided into 2 groups,
subsequently subjected to operation, and 1 control group (10 rats
in each group). Animal handling procedures followed the
Institutional Animal Care Guidelines of Nantong University and were
approved by the Administration Committee of Experimental Animals,
Jiangsu Province, China. The rats were subjected to sciatic nerve
transection (operated groups) or sham operation (control group), as
previously described (12). At 1
and 4 weeks following the operation, the TA muscles were rapidly
dissected from the operated side of the animals and immediately
immersed in liquid nitrogen prior to use. TA muscles were also
harvested from animals of the control group.
Protein sample preparation and iTRAQ
labeling
Protein samples were extracted from the harvested
muscles and quantified using the Protein Assay kit (Bio-Rad,
Hercules, CA, USA). iTRAQ labeling of the protein samples was
performed as previously described (12). Briefly, 100 μg of each protein
sample, obtained by acetone precipitation, was dissolved in 20 μl
of dissolution buffer and sequentially reduced, alkylated and
digested, followed by labeling with the iTRAQ tags 114, 115 and
116, and pooling for further analysis.
The mixed iTRAQ-labeled sample was resuspended in
buffer A (10 mM KH2PO4 in 25% v/v
acetonitrile at pH 2.7) and fractionated using an off-line strong
cation exchange column on a 1100 HPLC system (Agilent Technologies,
Waldbronn, Germany). Gradient elution was performed from 0% buffer
B (10 mM KH2PO4 in 25% v/v acetonitrile/350
mM KCL at pH 2.7) to 25% buffer B for 30 min, and then from 25%
buffer B to 100% buffer B for 20 min. The fractions were collected
at 2-min intervals, and desalted on Vivapure® C18 Micro
spin columns (Sartorius Stedim Biotech, Gottingen, Germany), and
vacuum-dried prior to LC/MS/MS analysis. All reagents used in these
procedures were purchased from Applied Biosystems (Foster City, CA,
USA).
2D LC-MS/MS
Online 2D nano LC-MS/MS analysis was performed as
previously described (12).
Briefly, the peptides in each fraction were resuspended in 20 μl
solvent A (water with 0.1% formic acid), separated by nano LC, and
analyzed by on-line electrospray tandem mass spectrometry using the
LTQ Orbitrap XL mass spectrometer (Thermo Electron Corp., Bremen,
Germany). An 18-μl peptide sample was loaded for 5 min, with a flow
of 20 μl/min, onto the peptide column Captrap (Michrom
BioResources, Auburn, CA, USA), and subsequently eluted with a
3-step linear gradient, starting from 5% solvent B (acetonitrile
with 0.1% formic acid) to 45% solvent B for 70 min, increased to
80% solvent B for 1 min, and then holding on 80% solvent B for 4
min. The electrospray voltage of 1.9 kV vs. the inlet of the mass
spectrometer was used.
A LTQ Orbitrap XL mass spectrometer was operated in
the data-dependent mode to switch automatically between MS and
MS/MS acquisition. Survey full-scan MS spectra (m/z 400–2,000) were
acquired with a mass resolution of 60,000 at m/z 400, followed by
MS/MS of the 4 most intense peptide ions. The dissociation mode was
higher energy C-trap dissociation (HCD), under which iTRAQ-labeled
peptides fragmented to produce reporter ions at 114.1, 115.1 and
116.1. Fragment ions of the peptides were simultaneously produced,
and sequencing of the labeled peptides allowed the identification
of the corresponding proteins. Dynamic exclusion was used with 2
repeat counts (10-sec repeat duration), and the m/z values
triggering MS/MS were placed on an exclusion list for 120 sec. For
MS/MS, precursor ions were activated using 40% normalized collision
energy and an activation time of 30 msec. The peak intensity of the
3 iTRAQ reporter ions reflected the relative abundance of the
peptides and thereby, proteins, in the samples.
Protein identification and
quantification
The MS raw data were analyzed as previously
described (12). Briefly, MS/MS
spectra were compared to rat data from the Swiss-Prot database
(Release 2010_04) using the SEQUEST software v.28 (revision 12;
Thermo Electron Corp.). The search parameters were set as follows:
trypsin (KR) cleavage with 2 miscleavages allowed;
carbamidomethylation of cysteine residues as fixed modification;
iTRAQ modification of peptide N-termini, methionine oxidation,
iTRAQ modification of lysine residues and N-terminal acetylation as
variable modifications; peptide mass tolerance 20 ppm, and fragment
ion tolerance 0.05 Da. Protein identification results were
evaluated using the Trans Proteomic Pipeline (TPP) set of tools
(revision 4.2), with quantification of iTRAQ reporter ion
intensities performed using the Libra tool.
For the selection of differentially expressed
proteins, we considered the following criteria, as previously
described (13): i) proteins
containing at least 2 unique high-scoring peptides; and ii)
proteins with a median ratio above 2 or below 0.5; and iii) >95%
confidence level in each comparison.
Bioinformatic analysis
The differentially expressed proteins were mapped to
the appropriate GO database to calculate the number of genes at
each node, and were classified according to molecular function. The
differentially expressed proteins were further classified into the
KEGG molecular pathway (http://www.genome.jp/kegg/pathway.html) to explore
specific biological pathways affected by skeletal muscle atrophy.
In addition, predicted protein-protein interactions for the list of
differentially expressed proteins and the resulting network were
retrieved and constructed using the STRING database version 9.0
(http://string-db.org) (14).
Western blot analysis
Western blot analysis was used to confirm the
expression of selected proteins as previously described (15). Briefly, muscle protein samples
were homogenized in RIPA buffer, separated by 1D electrophoresis
and electroblotted onto a polyvinylidene fluoride (PVDF) membrane.
The membrane was blocked with 5% non-fat dry milk in Tris-buffered
saline (TBS) for 1 h at room temperature, followed by incubation
with primary polyclonal antibodies: mouse anti-β-enolase (1:1,000;
BD Biosciences, San Diego, CA, USA) and rabbit anti-α-enolase
(1:500; AB Biotec, Stockholm, Sweden) in TBST (10 mM Tris-HCl, pH
7.5, 150 mM NaCl and 0.1% Tween-20) supplemented with 5% milk
overnight at 4°C. After washing in TBST, the membrane was incubated
with HRP-conjugated goat anti-rabbit/mouse IgG polyclonal antibody
(AB Biotec) for 60 min. Following TBST washes, immunoprobed
proteins were visualized using the enhanced chemiluminescence
method: Chemiluminescent solution luminol and hydrogen peroxide
were provided with the ECL luminescence kit (Pierce Corp.,
Rockford, IL, USA). HRP catalyzes the reaction of luminol with
hydrogen peroxide to generate a peroxide. The peroxide is unstable
and easy to decompose to form a luminescent electron excitation
energy intermediates, which will produce fluorescence, when the
electron excitation energy intermediates return from the excited
state to the ground state.
Immunohistochemistry
Immunohistochemical analysis was performed as
described in a previous study (15). Briefly, the TA muscle was
dissected, post-fixed, dehydrated, and sectioned (8-μm-thick
sections) using a cryostat; the sections were thaw-mounted onto
poly-L-lysine-coated slides and stored at −20°C prior to
immunostaining. The slides were washed in phosphate-buffered saline
(PBS) for 10 min at room temperature, blocked, and then incubated
overnight at 4°C with primary antibodies: mouse anti-β-enolase
antibody and rabbit anti-α-enolase antibody (both at 1:100). After
washing with PBS, the slides were incubated at 4°C for 24 h with
secondary goat antibodies labeled with fluorescein isothiocyanate 1
(FITC): anti-mouse IgG-FITC (1:100; Santa Cruz Biotechnology, Inc.,
Santa Cruz, CA, USA) and anti-rabbit IgG-FITC (1:200; Abcam,
Cambridge, MA, USA). The slides were washed 3 times in PBS,
coverslipped and visualized under a DMR fluorescent microscope
(Leica Microsystems, Wetzlar, Germany).
Cell culture and small interfering RNA
(siRNA) transfection
The cells were cultured as previously described
(16). Briefly, L6 skeletal
muscle cells were grown and maintained in high-glucose Dulbecco’s
modified Eagle’s medium (DMEM) supplemented with 10% fetal bovine
serum (FBS), 100 U/ml penicillin and 100 μg/ml streptomycin in a
10% CO2 humidified atmosphere at 37°C. The cells grown
in culture flasks up to approximately 80% confluency were
trypsinized and seeded into a 6-well culture plate for incubation
in DMEM containing 10% FBS, until they reached approximately 90%
confluence. Following replacement of the medium with DMEM
containing 2% horse serum, the cells were induced to differentiate
until >90% had differentiated into myotubes. The resulting L6
myotubes were treated with 100 nM dexamethasone in 0.1% ethanol for
48 h. Dexamathasone is a glucocorticoid that induces myotube
atrophy (16).
TRAF6 siRNA oligonucleotides targeting rat TRAF6,
and control oligonucleotides (TRAF6 siRNA negative control) were
purchased from RiboBio Co., Ltd. (Guangzhou, China). Cells were
transfected using riboFect™ CP reagent (RiboBio Co., Ltd.)
according to the manufacturer’s instructions. L6 myotubes were
transfected with 100 nM TRAF6 siRNA or 100 nM negative control
siRNA. Six hours later, the medium was replaced with
differentiation medium. L6 myotubes were treated with 100 nM
dexamathasone in 0.1% ethanol for 48 h and collected for RNA
preparation. For myotube size quantification, the transfected L6
myotubes were fixed after 48 h of dexamatheasone treatment. Myotube
cultures were photographed under a phase contrast microscope (Leica
Microsystems). The diameters were measured in a total of 60
myotubes from at least 6 random fields using Image-Pro Plus
software (Media Cybernetics, Silver Springs, MD, USA).
Quantitative reverse-transcription PCR
(qRT-PCR)
Total RNA was extracted from the L6 myotubes, and
reverse transcription was performed using Oligo(dT) primers
(Shanghai Sangon Biotechnology Corp., Shanghai, China). cDNA was
synthesized using an iScript cDNA Synthesis kit (Bio-Rad) following
the manufacturer’s instructions, and stored at −20°C prior to use.
All primers were purchased from Generay Biotech Co., Ltd.
(Shanghai, China). The primers used in this study were as folows:
TRAF6 forward, GGCA TTTACATTTGGAAGATTGGC and reverse, AGGGAAATG
TAGTTTGCACAGCG; muscle ring-finger protein 1 (MuRF1) forward,
GGTGCCTACTTGCTCCTTGTGC and reverse, CTGTTTTCCTTGGTCACTCGGC; muscle
atrophy F-box (MAFbx) forward, GATCTTGTCTGACAAAGGGCAGC and reverse,
GGGTGAAAGTGAGACGGAGCAG and GAPDH forward, CAACGGGAAACCCATCACCA and
reverse, ACG CCAGTAGACTCCACGACAT. The PCR reactions were performed
on the Applied Biosystems 7500 real-time PCR system using the iTaq
Fast SYBR-Green Supermix (Bio-Rad) following the manufacturer’s
instructions. The cycle threshold (Ct) values, corresponding to the
PCR cycle number at which fluorescence emission reached a threshold
above baseline emission, were determined. mRNA expression levels
were then calculated using the 2−ΔΔCt method, as
described in a previous study (16). GAPDH served as an internal
control.
Statistical analysis
All data are expressed as the means ± SD. One-way
ANOVA was used to compare differences between groups. All
statistical analyses were conducted with the Stata 7.0 software
package (StataCorp LP, College Station, TX, USA). Values of
p<0.05 were considered to indicate statistically significant
differences.
Results
Screening of differentially expressed
proteins and functional analysis
iTRAQ-based proteomic analysis
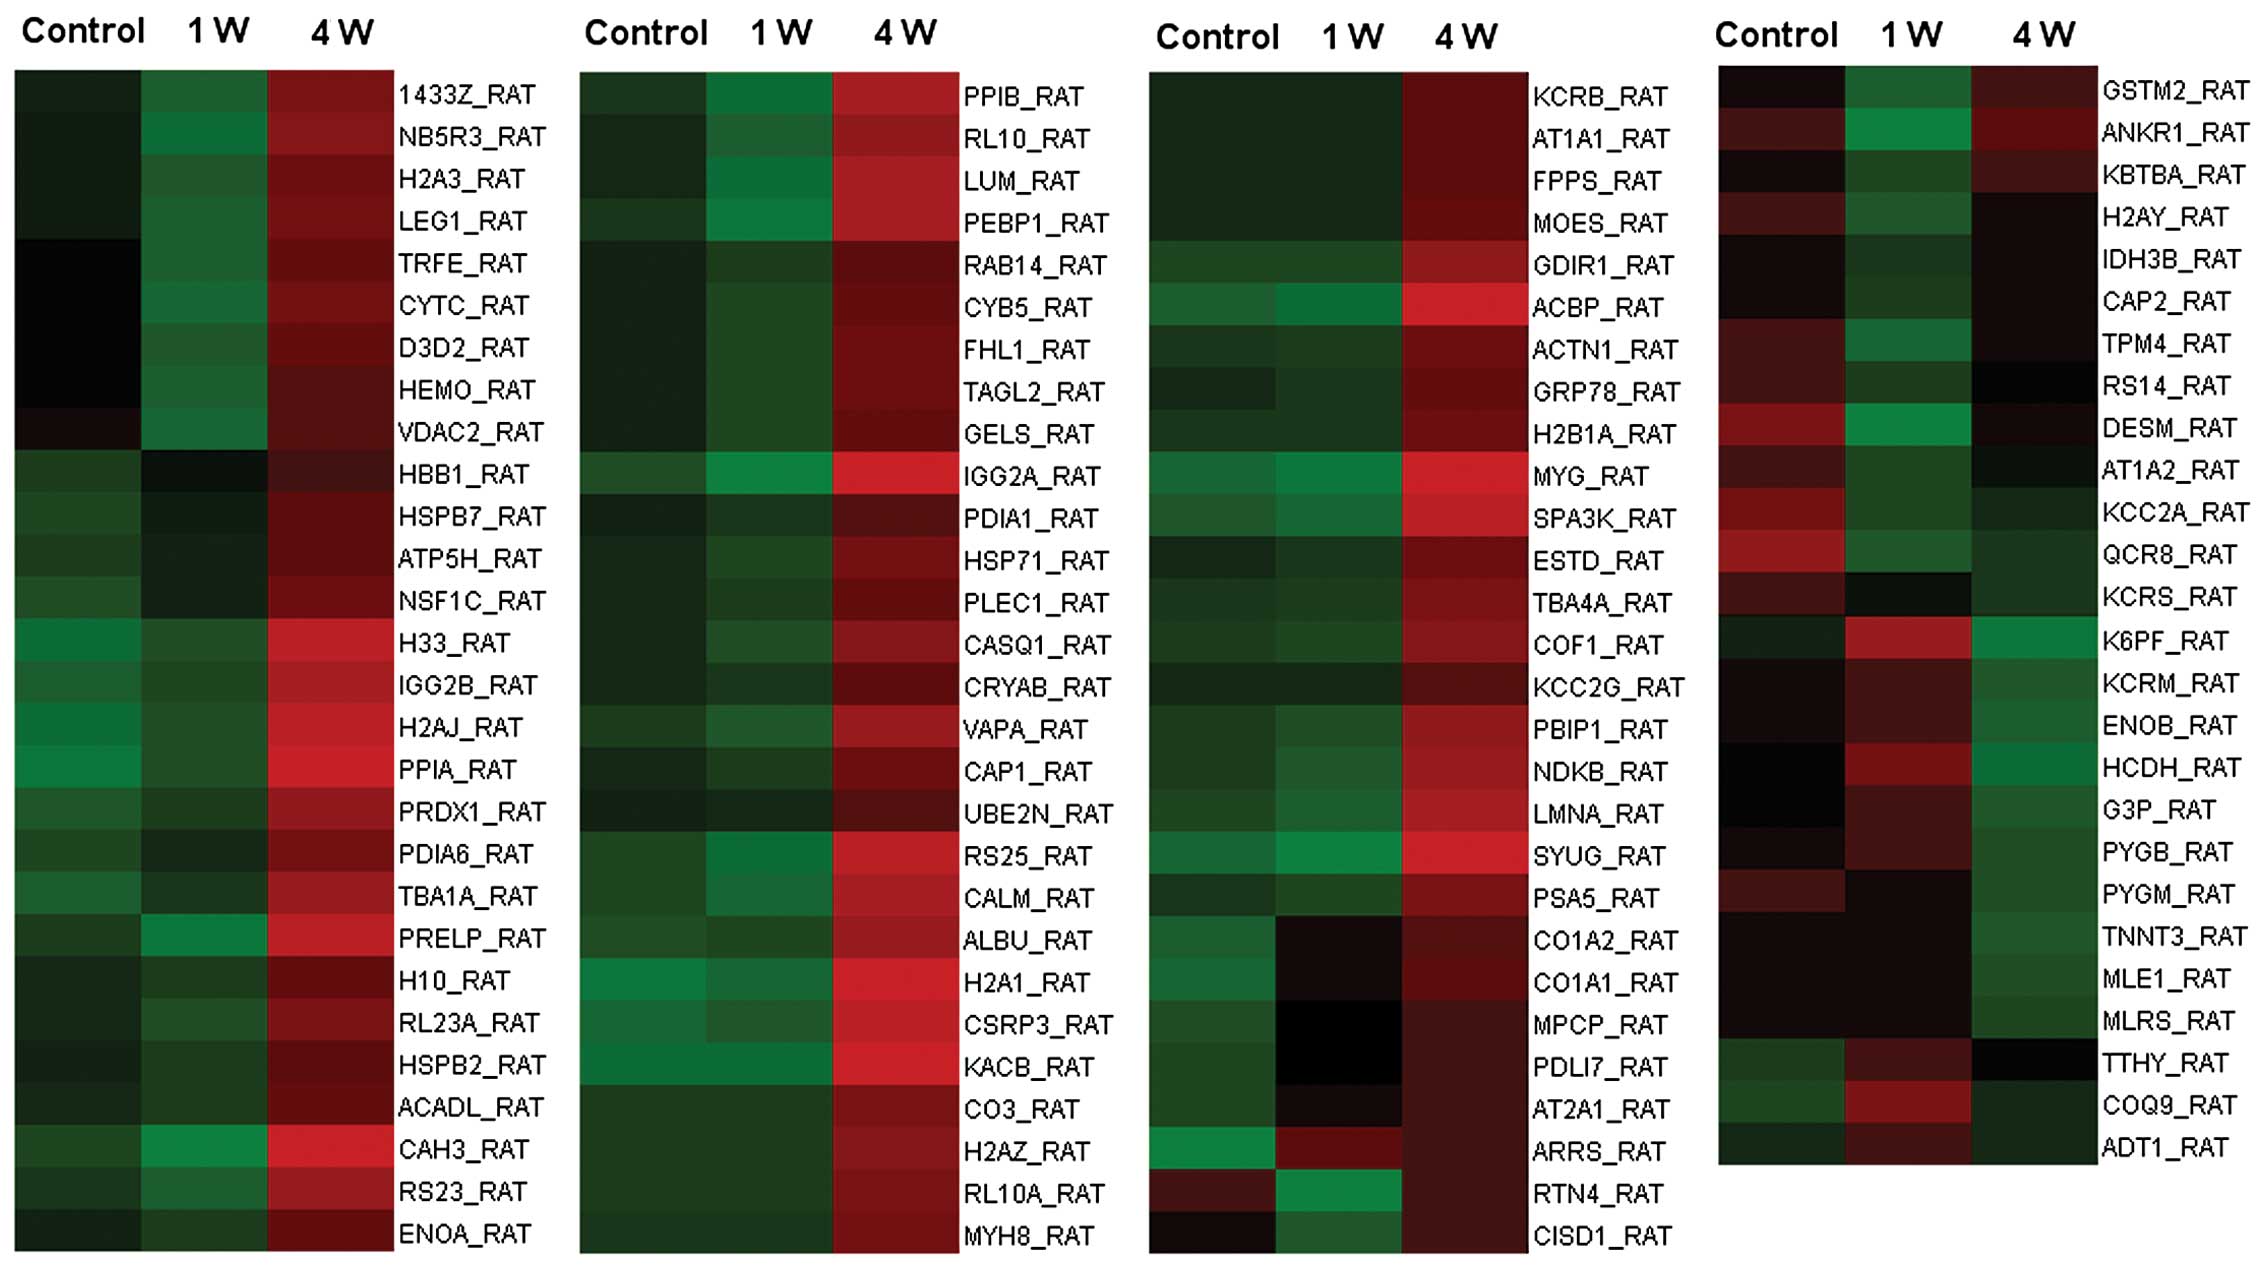
A total of 110 proteins were identified as
differentially expressed (with criteria: p<0.05 and fold change
of >2.0) in denervated TA muscle at 1 and 4 weeks following
sciatic nerve transection. The 110 proteins are listed in Table I, and their expression levels
relative to the control are displayed in a heatmap graphic
(Fig. 1).
 | Table IList of differentially expressed
proteins in denervated tibialis anterior (TA) muscle. |
Table I
List of differentially expressed
proteins in denervated tibialis anterior (TA) muscle.
| Functional
category: gene name | 115/114 | 116/114 | Predicted molecular
function/protein name |
|---|
| Metabolic
enzymes |
| ACADL_RAT | 0.756 | 2.180 | Long-chain specific
acyl-CoA dehydrogenase, mitochondrial |
| CAH3_RAT | 0.300 | 4.451 | Carbonic anhydrase
3 |
| CYB5_RAT | 0.692 | 2.077 | Cytochrome b5 |
| D3D2_RAT | 0.444 | 1.778 | 3,2-Trans-enoyl-CoA
isomerase, mitochondrial |
| ENOA_RAT | 0.725 | 2.102 | Alpha-enolase |
| ENOB_RAT | 1.236 | 0.302 | Beta-enolase |
| ESTD_RAT | 0.923 | 2.538 | S-formylglutathione
hydrolase |
| FPPS_RAT | 1.028 | 2.355 | Farnesyl
pyrophosphate synthetase |
| G3P_RAT | 1.445 | 0.429 |
Glyceraldehyde-3-phosphate
dehydrogenase |
| GSTM2_RAT | 0.316 | 1.158 | Glutathione
S-transferase Mu 2 |
| HADH_RAT | 1.820 | 0.261 |
Hydroxyacyl-coenzyme A dehydrogenase,
mitochondrial |
| K6PF_RAT | 2.512 | 0.288 |
6-Phosphofructokinase, muscle type |
| KCC2A_RAT | 0.300 | 0.425 |
Calcium/calmodulin-dependent protein
kinase type II alpha chain |
| KCC2G_RAT | 0.923 | 2.000 |
Calcium/calmodulin-dependent protein
kinase type II gamma chain |
| KCRB_RAT | 1.000 | 2.286 | Creatine kinase
B-type |
| KCRM_RAT | 1.271 | 0.373 | Creatine kinase
M-type |
| KCRS_RAT | 0.600 | 0.425 | Creatine kinase,
sarcomeric mitochondrial |
| NDKB_RAT | 0.778 | 3.444 | Nucleoside
diphosphate kinase B |
| PDIA1_RAT | 0.824 | 2.015 | Protein
disulfide-isomerase |
| PDIA6_RAT | 1.400 | 3.400 | Protein
disulfide-isomerase A6 |
| PPIA_RAT | 2.000 | 10.000 | Peptidyl-prolyl
cis-trans isomerase A |
| PPIB_RAT | 0.400 | 3.300 | Peptidyl-prolyl
cis-trans isomerase B |
| PRDX1_RAT | 1.375 | 4.375 |
Peroxiredoxin-1 |
| PYGB_RAT | 1.355 | 0.425 | Glycogen
phosphorylase, brain form (fragment) |
| PYGM_RAT | 0.895 | 0.354 | Glycogen
phosphorylase, muscle form |
| ATP5H_RAT | 1.412 | 2.753 | ATP synthase
subunit d, mitochondrial |
| IDH3B_RAT | 0.488 | 0.847 | Isocitrate
dehydrogenase (NAD+) subunit beta, mitochondrial |
| NB5R3_RAT | 0.337 | 2.228 | NADH-cytochrome b5
reductase 3 |
| Structural
proteins |
| ACTN1_RAT | 0.904 | 2.604 |
Alpha-actinin-1 |
| CAP1_RAT | 0.800 | 2.467 | Adenylyl
cyclase-associated protein 1 |
| CAP2_RAT | 0.462 | 0.846 | Adenylyl
cyclase-associated protein 2 |
| COF1_RAT | 0.909 | 3.182 | Cofilin-1 |
| CSRP3_RAT | 1.312 | 6.750 | Cysteine and
glycine-rich protein 3 |
| DESM_RAT | 0.055 | 0.575 | Desmin |
| FHL1_RAT | 0.667 | 2.200 | Four and a half LIM
domains protein 1 |
| LMNA_RAT | 0.750 | 3.875 | Lamin-A |
| MLE1_RAT | 1.047 | 0.394 | Myosin light chain
1, skeletal muscle isoform |
| MLRS_RAT | 1.038 | 0.421 | Myosin regulatory
light chain 2, skeletal muscle isoform |
| MOES_RAT | 1.019 | 2.443 | Moesin |
| MYH8_RAT | 1.000 | 2.780 | Myosin-8
(fragment) |
| PDLI7_RAT | 1.917 | 2.750 | PDZ and LIM domain
protein 7 |
| PLEC1_RAT | 0.786 | 2.214 | Plectin-1 |
| TAGL2_RAT | 0.658 | 2.225 | Transgelin-2 |
| TBA1A_RAT | 1.625 | 5.125 | Tubulin alpha-1A
chain |
| TBA4A_RAT | 0.917 | 2.917 | Tubulin alpha-4A
chain |
| TNNT3_RAT | 1.019 | 0.360 | Troponin T, fast
skeletal muscle |
| TPM4_RAT | 0.222 | 0.815 | Tropomyosin alpha-4
chain |
| Signaling
molecules |
| ADT1_RAT | 2.070 | 1.038 | ADP/ATP translocase
1 |
| ARRS_RAT | 87.902 | 74.473 | S-arrestin |
| AT1A1_RAT | 1.000 | 2.231 |
Sodium/potassium-transporting ATPase
subunit alpha-1 |
| AT1A2_RAT | 0.367 | 0.600 |
Sodium/potassium-transporting ATPase
subunit alpha-2 |
| AT2A1_RAT | 2.300 | 2.502 |
Sarcoplasmic/endoplasmic reticulum calcium
ATPase 1 |
| CALM_RAT | 0.586 | 3.810 | Calmodulin |
| CASQ1_RAT | 0.701 | 2.731 | Calsequestrin-1
(fragment) |
| GDIR1_RAT | 1.046 | 3.650 | Rho
GDP-dissociation inhibitor 1 |
| GELS_RAT | 0.665 | 2.081 | Gelsolin |
| LEG1_RAT | 0.452 | 2.123 | Galectin-1 |
| MPCP_RAT | 2.291 | 3.311 | Phosphate carrier
protein, mitochondrial |
| PEBP1_RAT | 0.333 | 3.333 |
Phosphatidylethanolamine-binding protein
1 |
| RAB14_RAT | 0.706 | 2.000 | Ras-related protein
Rab-14 |
| SPA3K_RAT | 0.800 | 5.400 | Serine protease
inhibitor A3K |
| SYUG_RAT | 0.143 | 8.857 |
Gamma-synuclein |
| VDAC2_RAT | 0.313 | 1.438 | Voltage-dependent
anion-selective channel protein 2 |
| Chaperones |
| 1433Z_RAT | 0.501 | 2.291 | 14-3-3 protein
zeta/delta |
| CRYAB_RAT | 0.860 | 2.156 | Alpha-crystallin B
chain |
| GRP78_RAT | 0.951 | 2.354 | 78 kDa
glucose-regulated protein |
| HSP71_RAT | 0.750 | 2.431 | Heat shock 70 kDa
protein 1A/1B |
| HSPB2_RAT | 0.769 | 2.077 | Heat shock protein
beta-2 |
| HSPB7_RAT | 1.498 | 2.902 | Heat shock protein
beta-7 (fragment) |
| Extracellular
matrix proteins |
| CO1A1_RAT | 3.754 | 5.350 | Collagen alpha-1
(I) chain |
| CO1A2_RAT | 2.884 | 4.169 | Collagen alpha-2
(I) chain |
| LUM_RAT | 0.375 | 3.125 | Lumican |
| PRELP_RAT | 0.333 | 3.833 | Prolargin |
| Ubiquitin
proteasome pathway |
| PSA5_RAT | 0.818 | 2.727 | Proteasome subunit
alpha type-5 |
| UBE2N_RAT | 0.867 | 2.000 |
Ubiquitin-conjugating enzyme E2 N |
| Carrier
proteins |
| ACBP_RAT | 0.667 | 6.167 | Acyl-CoA-binding
protein |
| ALBU_RAT | 1.148 | 4.169 | Serum albumin |
| HBB1_RAT | 1.521 | 2.413 | Hemoglobin subunit
beta-1 |
| HEMO_RAT | 0.38 | 1.500 | Hemopexin |
| MYG_RAT | 0.667 | 7.529 | Myoglobin |
| TRFE_RAT | 0.385 | 1.769 |
Serotransferrin |
| Ribosomal proteins
and histones |
| H10_RAT | 0.738 | 2.150 | Histone H1.0 |
| H2A1_RAT | 1.500 | 11.500 | Histone H2A type
1 |
| H2A3_RAT | 0.492 | 2.014 | Histone H2A type
3 |
| H2AJ_RAT | 1.750 | 7.750 | Histone H2A.J |
| H2AY_RAT | 0.286 | 0.750 | Core histone
macro-H2A.1 |
| H2AZ_RAT | 1.000 | 3.273 | Histone H2A.Z |
| H2B1A_RAT | 0.946 | 2.630 | Histone H2B type
1-A |
| H33_RAT | 1.600 | 7.600 | Histone H3.3 |
| RL10_RAT | 0.533 | 2.800 | 60S ribosomal
protein L10 |
| RL10A_RAT | 1.000 | 3.100 | 60S ribosomal
protein L10a |
| RL23A_RAT | 0.667 | 2.467 | 60S ribosomal
protein L23a |
| RS14_RAT | 0.424 | 0.727 | 40S ribosomal
protein S14 |
| RS23_RAT | 0.571 | 3.143 | 40S ribosomal
protein S23 |
| RS25_RAT | 0.500 | 4.200 | 40S ribosomal
protein S25 |
| Membrane
trafficking proteins |
| NSF1C_RAT | 1.600 | 3.500 | NSFL1 cofactor
p47 |
| RTN4_RAT | 0.104 | 0.991 | Reticulon-4 |
| TTHY_RAT | 2.377 | 1.600 | Transthyretin |
| VAPA_RAT | 0.700 | 3.200 | Vesicle-associated
membrane protein-associated protein A |
| Protein
synthesis |
| KBTBA_RAT | 0.474 | 1.159 | Kelch repeat and
BTB domain-containing protein 10 |
| Other proteins |
| ANKR1_RAT | 0.047 | 1.213 | Ankyrin repeat
domain-containing protein 1 |
| CISD1_RAT | 0.364 | 1.045 | CDGSH iron sulfur
domain-containing protein 1 |
| CO3_RAT | 1.015 | 3.195 | Complement C3 |
| COQ9_RAT | 3.467 | 1.294 | Ubiquinone
biosynthesis protein COQ9, mitochondrial |
| CYTC_RAT | 0.319 | 1.837 | Cystatin-C |
| IGG2A_RAT | 0.240 | 5.230 | Ig gamma-2A chain C
region |
| IGG2B_RAT | 1.420 | 5.569 | Ig gamma-2B chain C
region |
| KACB_RAT | 1.009 | 9.908 | Ig kappa chain C
region, B allele |
| PBIP1_RAT | 0.818 | 3.273 | Pre-B-cell leukemia
transcription factor-interacting protein 1 |
| QCR8_RAT | 0.235 | 0.333 | Cytochrome b-c1
complex subunit 8 |
GO functional annotation
The 110 differentially expressed proteins were
grouped into 11 classes according to their molecular function based
on GO terms (Table I). The
highest number of proteins was classified as metabolic enzymes,
followed by structural proteins, signaling molecules, chaperones,
extracellular matrix proteins and ubiquitin proteasome
pathway-related proteins.
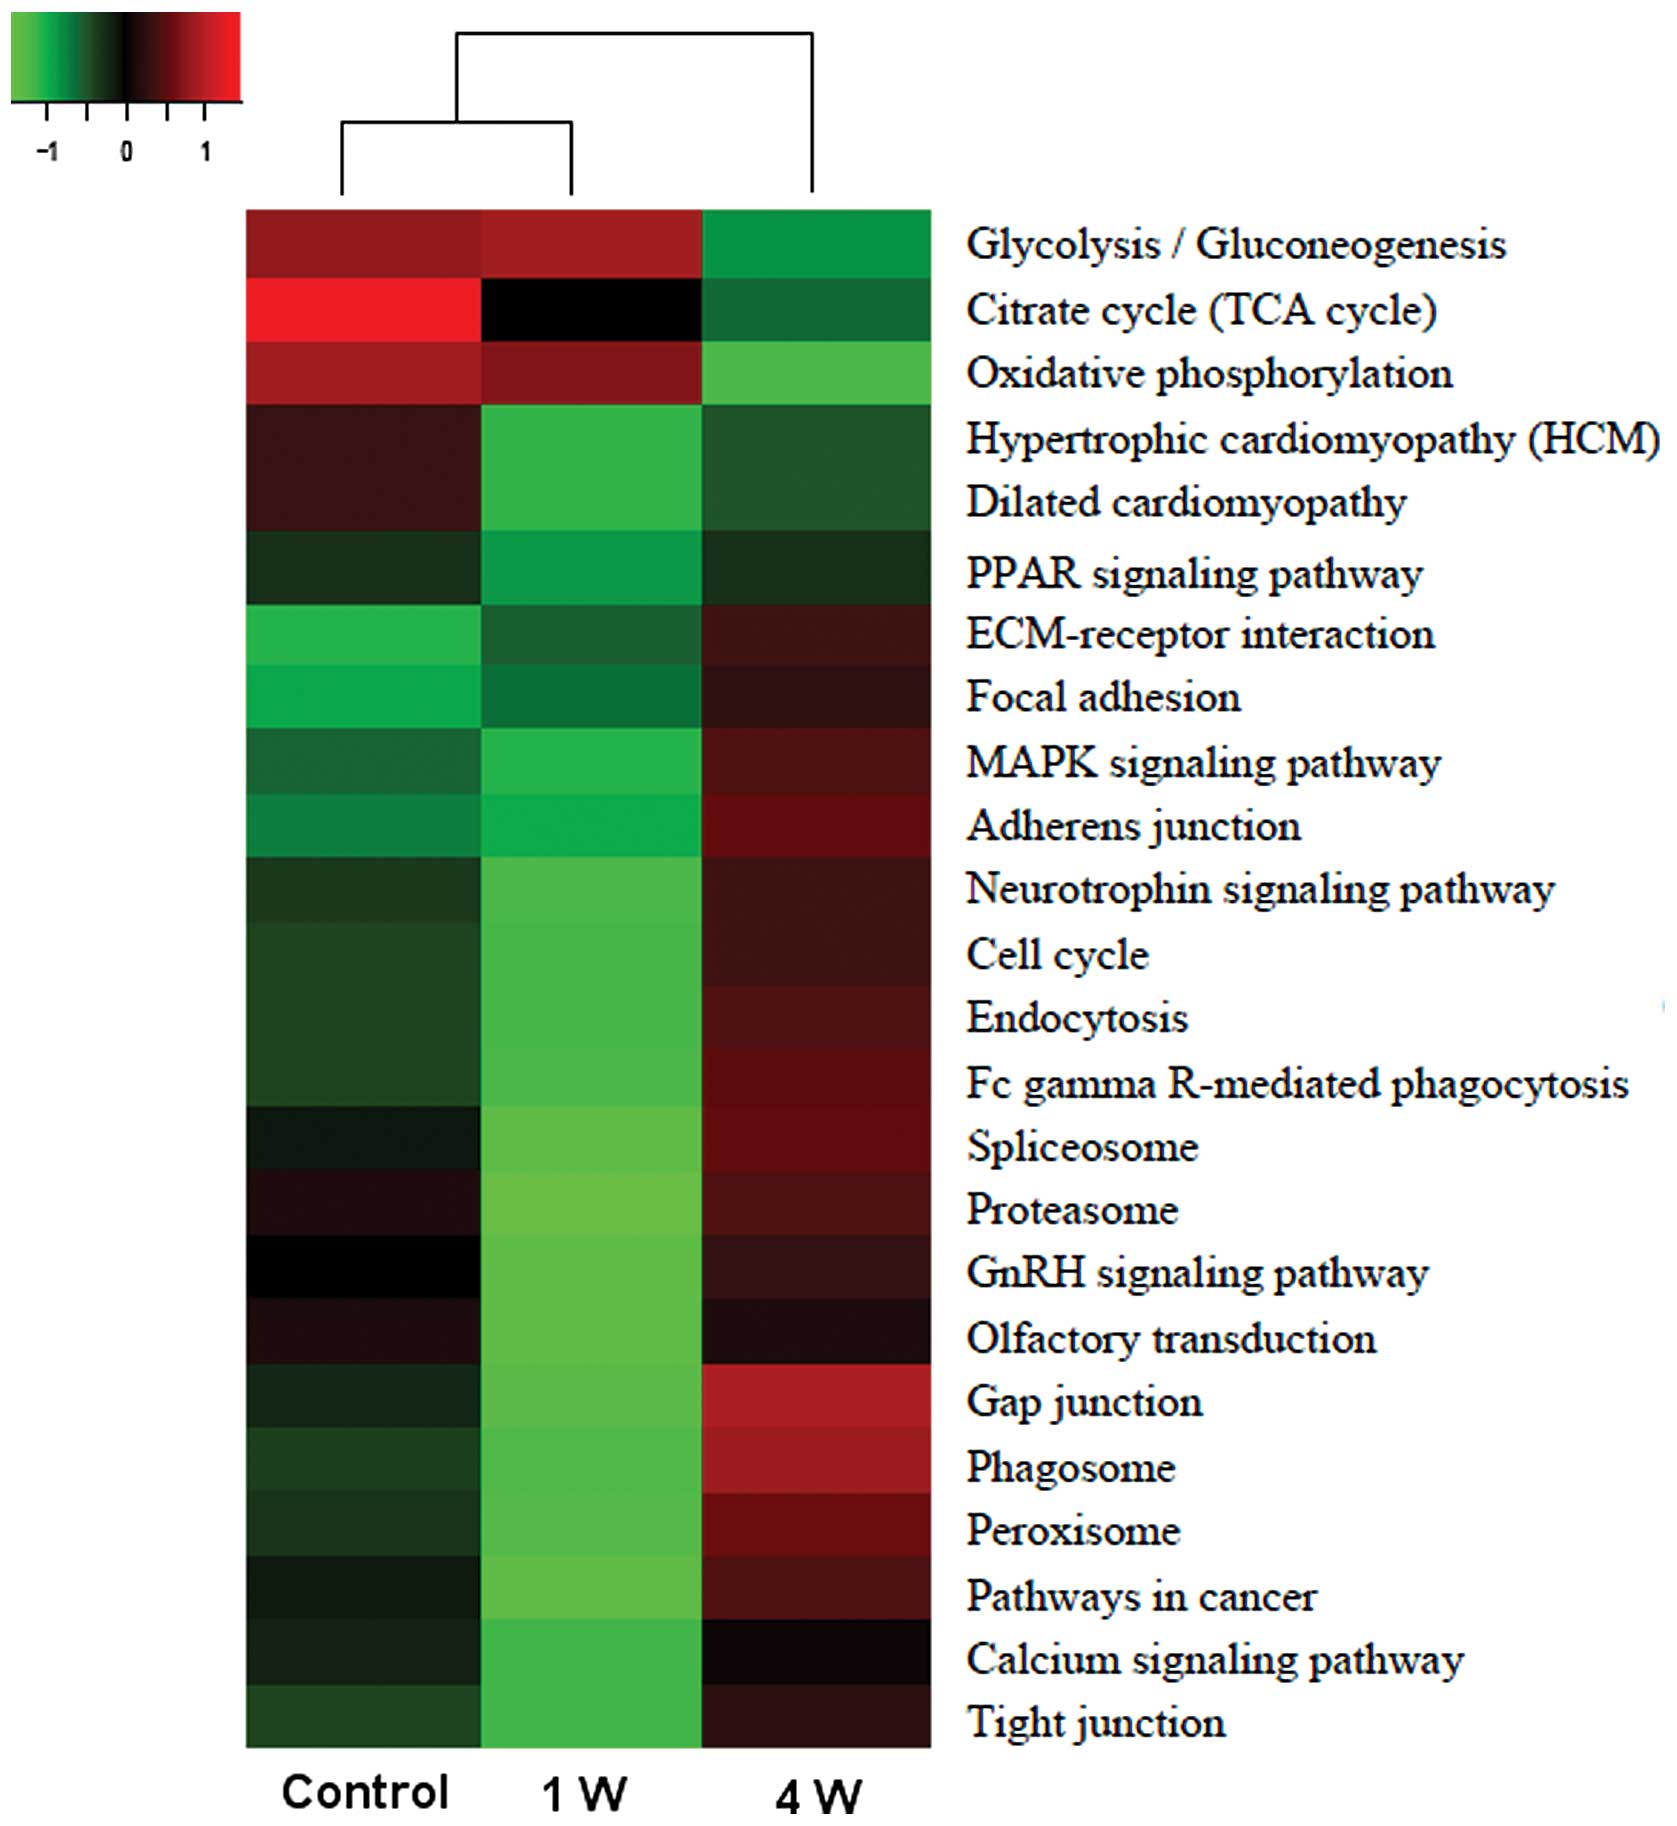
KEGG pathway identification
The 110 differentially expressed proteins were
involved in a number of distinct pathways, such as glycolysis,
Krebs (tricarboxylic acid/citrate) cycle, proteasome and MAPK
signaling. The heatmap displaying the expression data for the
corresponding genes (Fig. 2)
shows that during denervation-induced muscle atrophy, decreasing
trends are observed for the Krebs cycle and glycolysis (at 4
weeks), while proteasome and MAPK signaling pathway genes showed an
increasing trend at 4 weeks. Moreover, glycolysis-related genes
were the most highly expressed in all conditions.
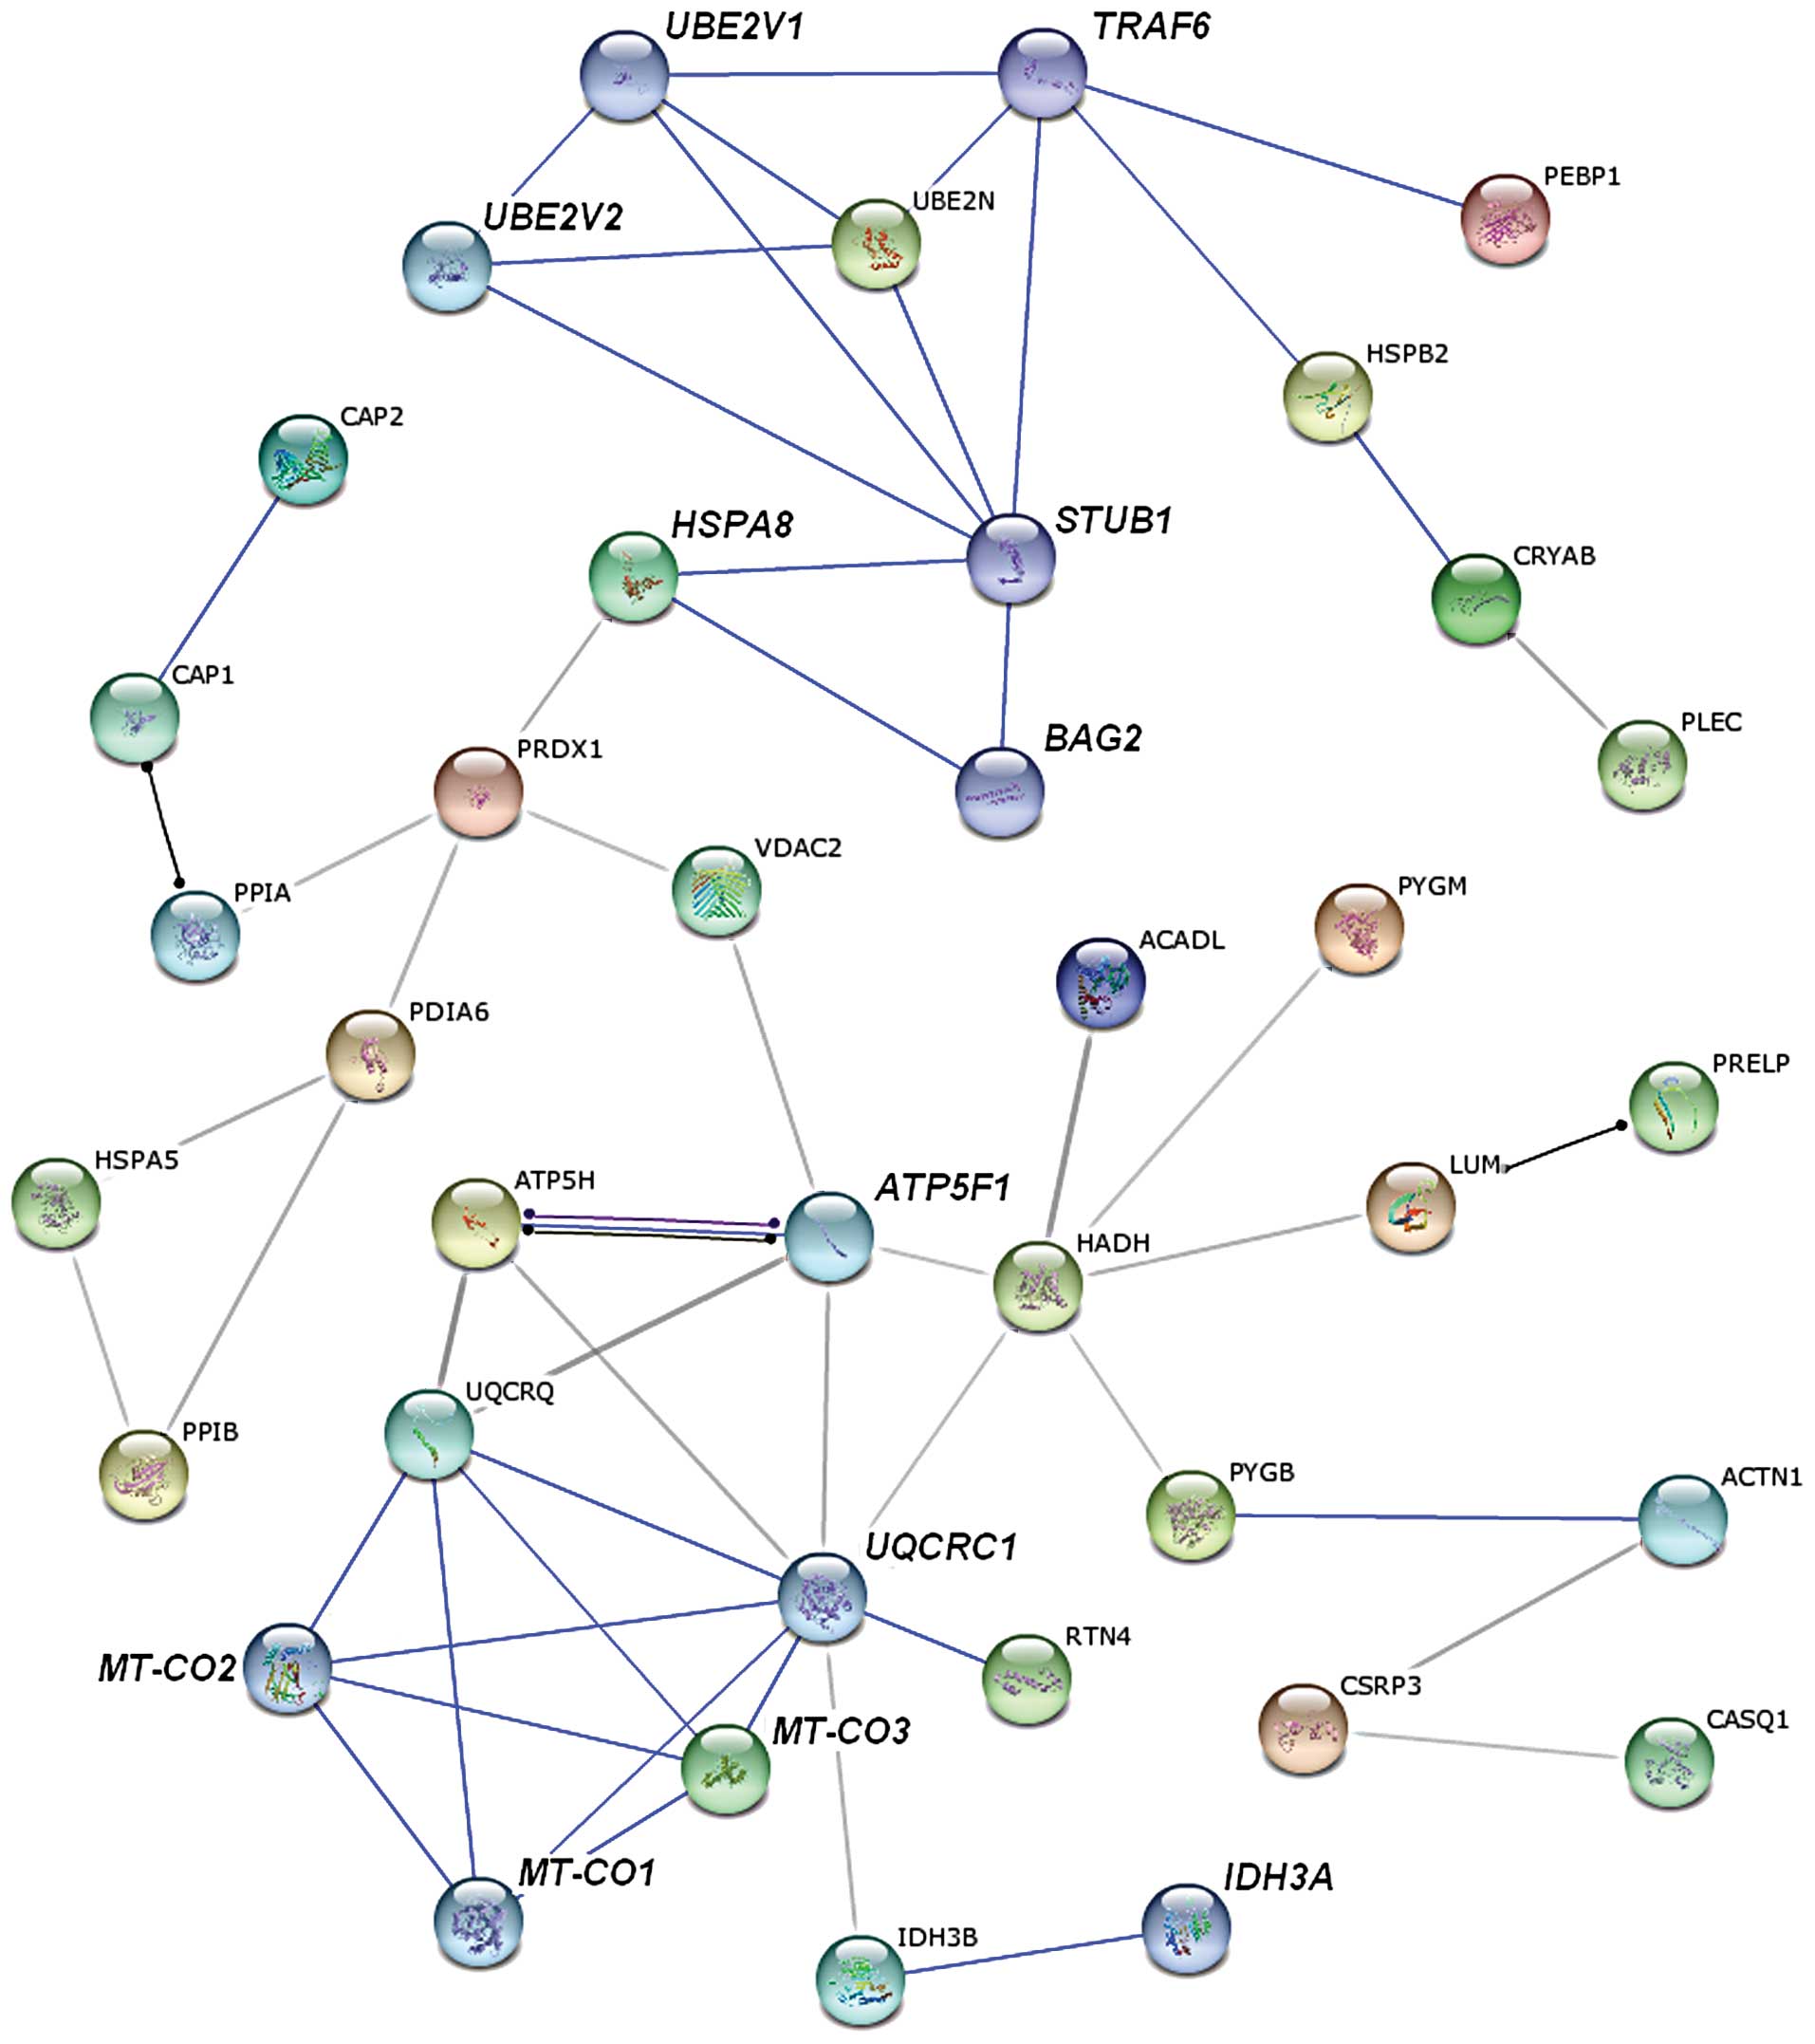
Analysis with STRING databases
We searched for known and predicted interactions for
the differentially expressed proteins identified by iTRAQ-based
proteomics in the STRING protein-protein interaction database and
constructed a protein-protein interaction network (Fig. 3). The network predicted an
interaction between ubiquitin-conjugating enzyme E2N (UBE2N),
identified as upregulated in denervated atrophic skeletal muscle
from our proteomics analysis, and TRAF6, which was not detected in
our study. UBE2N is required for TRAF6 activation (17). Therefore, we hypothesized that
TRAF6 may also be expressed in denervated TA muscle and upregulated
during denervation-induced atrophy. Furthermore, it was shown that
TRAF6 activates both MuRF1 and muscle-specific ubiquitin E3-ligase
atrophy gene-1/muscle atrophy F-box (Atrogin-1/MAFbx) (18), which further suggests that the
expression of MuRF1 and Atrogin-1/MAFbx is upregulated during the
progression of muscle atrophy. Both hypotheses derived from the
network analysis were confirmed by western blot analysis (see
below).
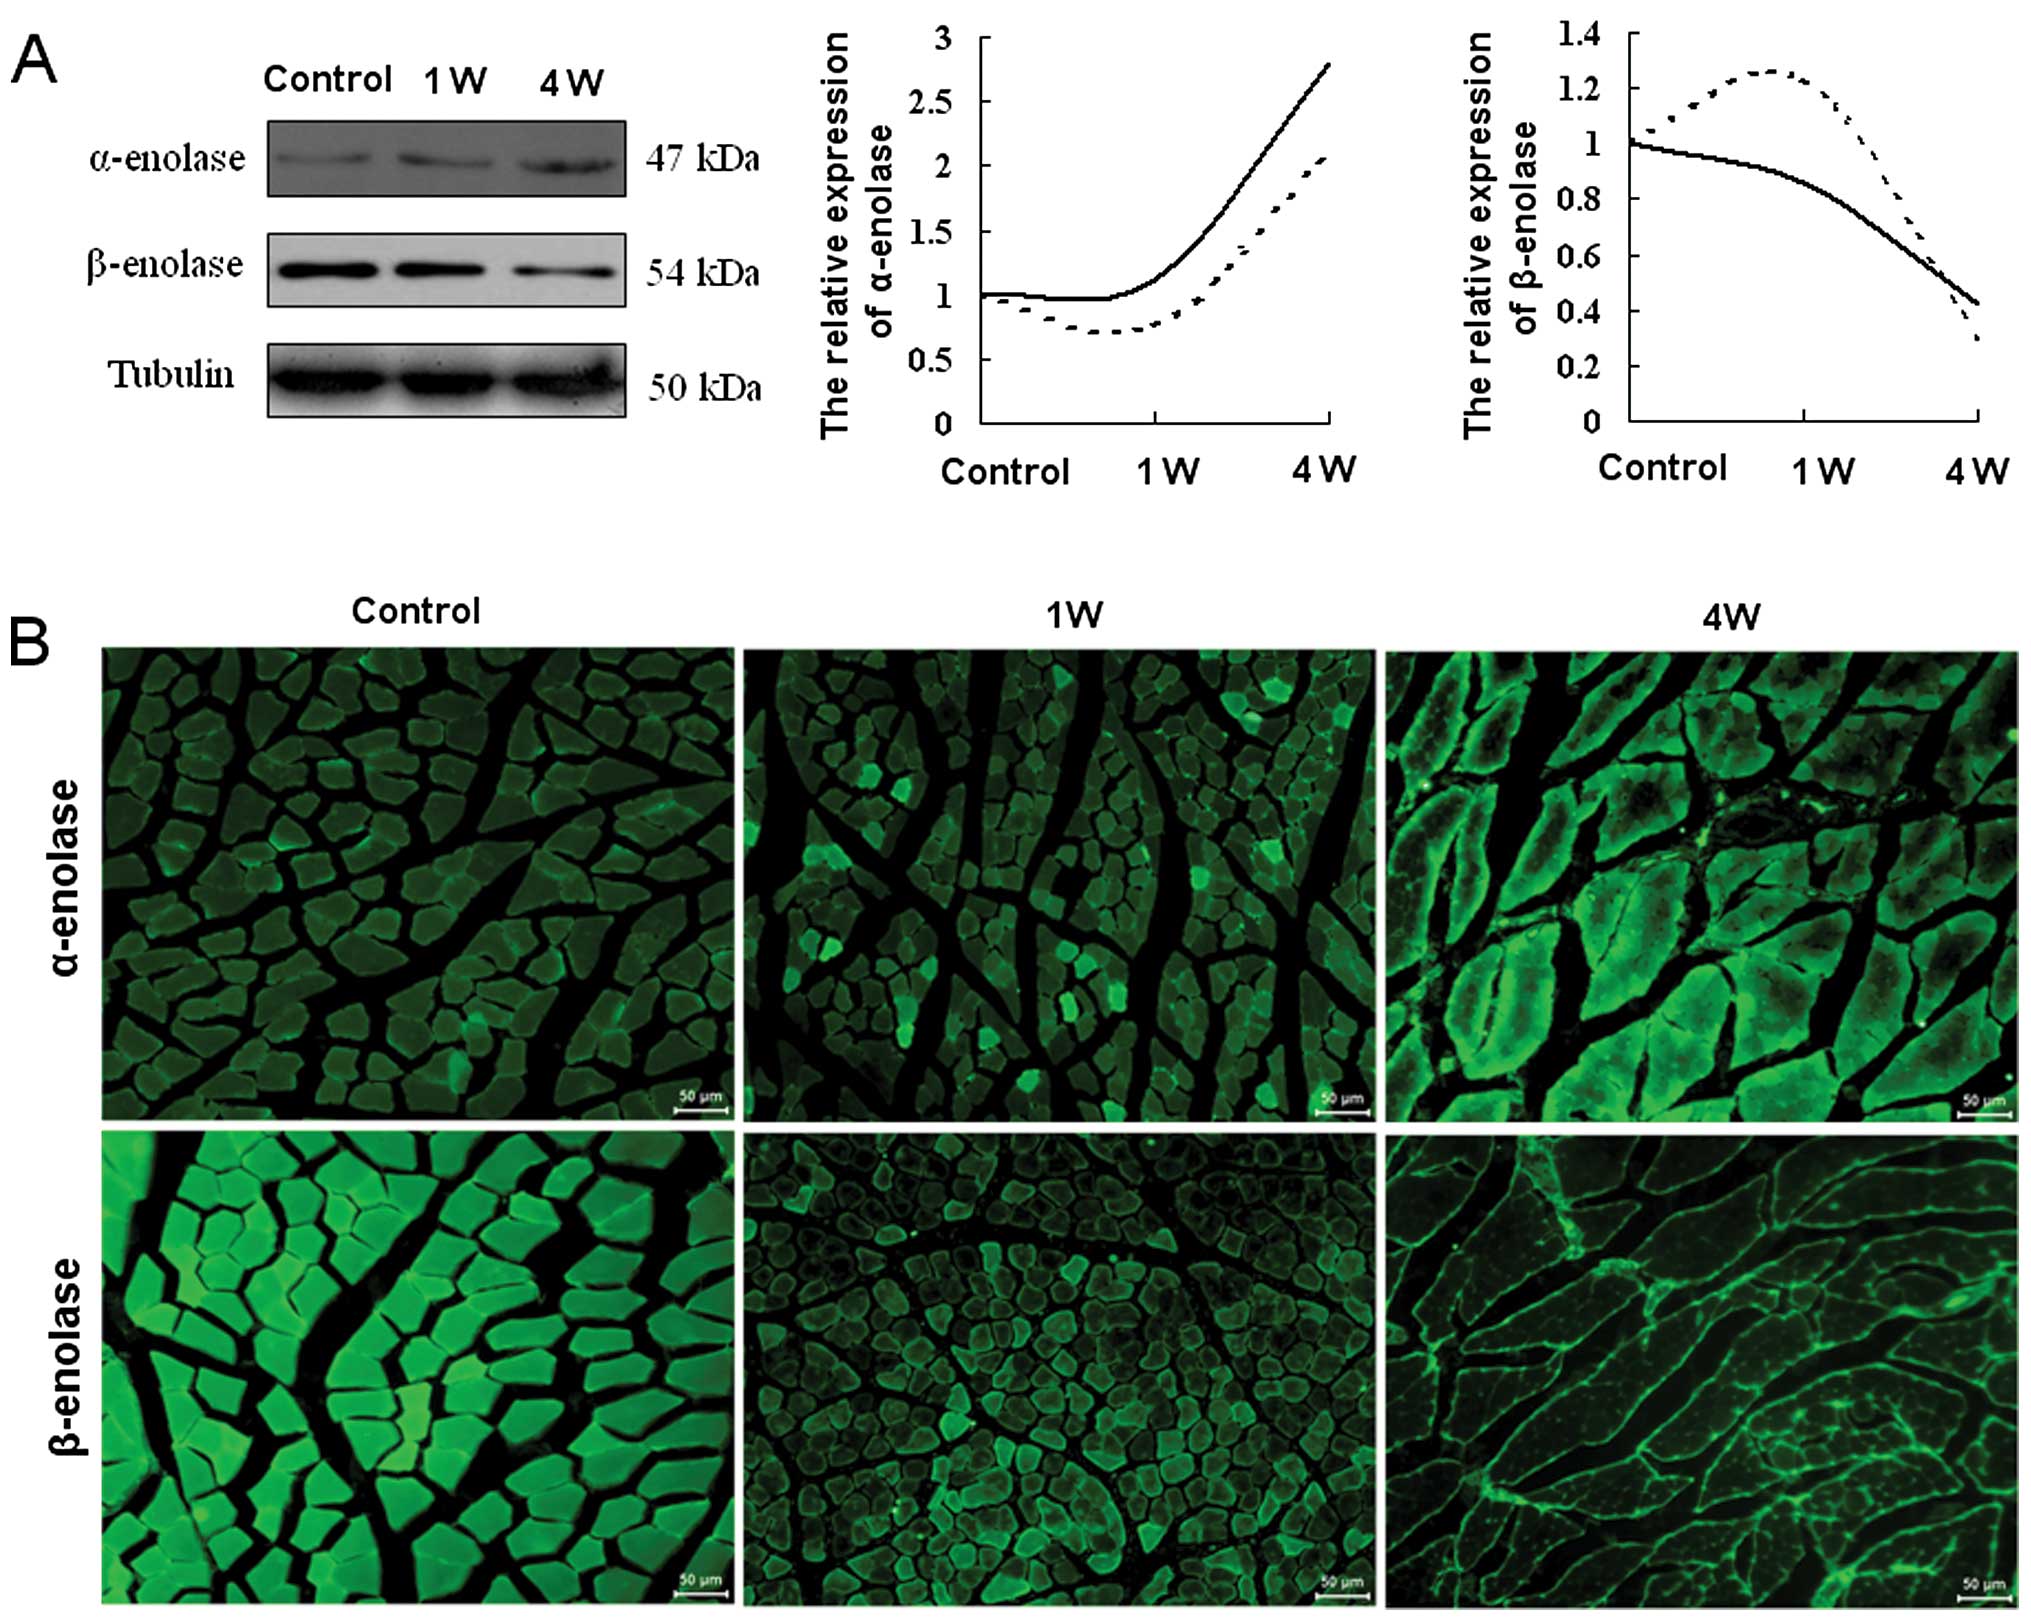
Validation of selected differentially
expressed proteins
To validate the results obtained by iTRAQ coupled
with 2DLC-MS/MS, 2 representative glycolytic enzymes, α- and
β-enolase, were selected for western blot and immunohistochemical
analyses. In these analyses, α- and β-enolase were found to be
gradually up- and downregulated during denervation-induced atrophy
in TA muscle, respectively (Fig. 4A
and B). The comparison between the western blot analysis and
iTRAQ-based proteomics results for the 2 enzymes indicated that the
expression change trends were consistent overall between the 2
methods, despite some deviations (Fig. 4A).
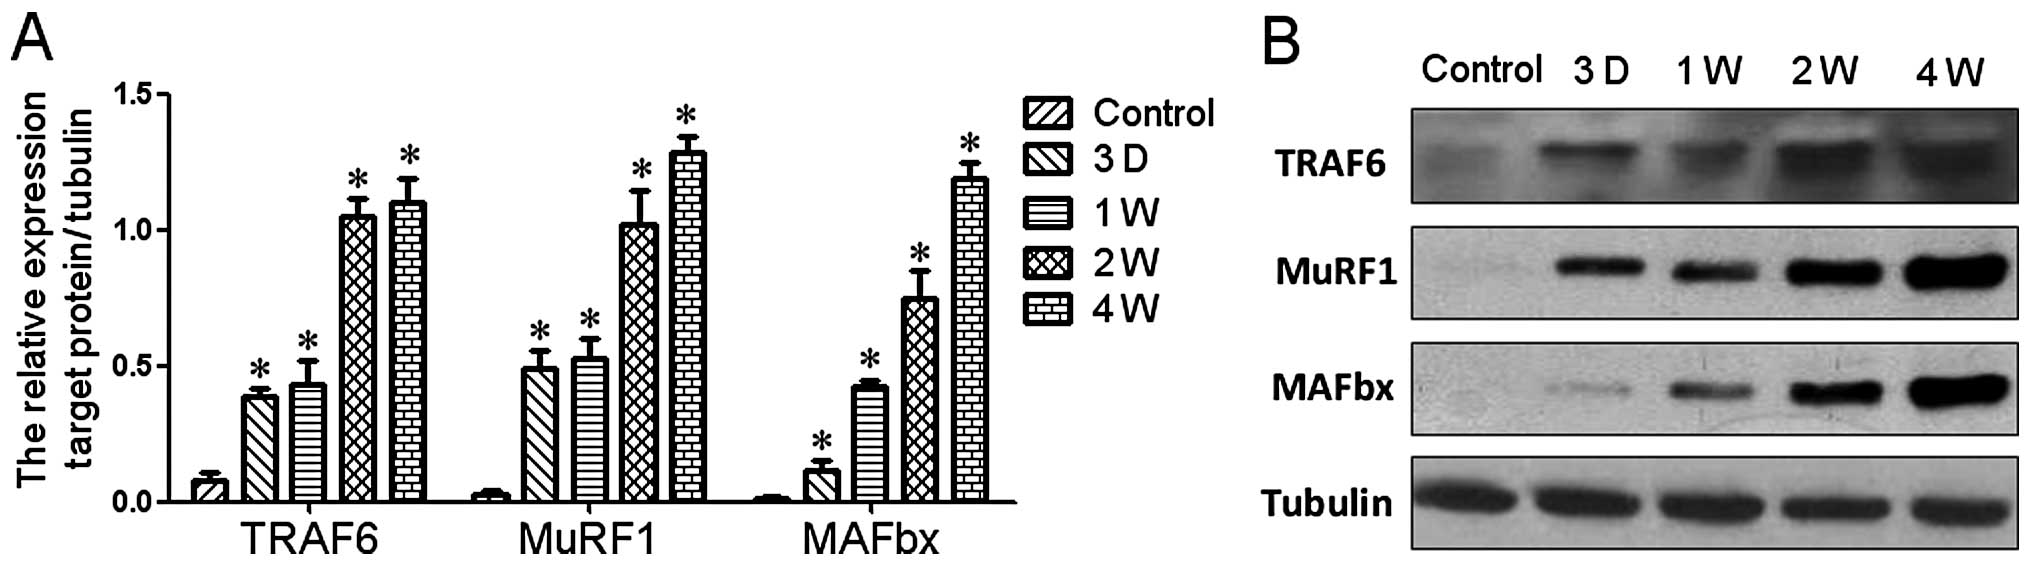
Western blot analysis was also carried out to
confirm the hypothesis derived from the protein-protein interaction
network. The results indicated that the protein expression of
TRAF6, MAFBx and MuRF1 was significantly upregulated during
denervation-induced muscle atrophy in TA muscle (Fig. 5).
Involvement of TRAF6 in myotube
atrophy
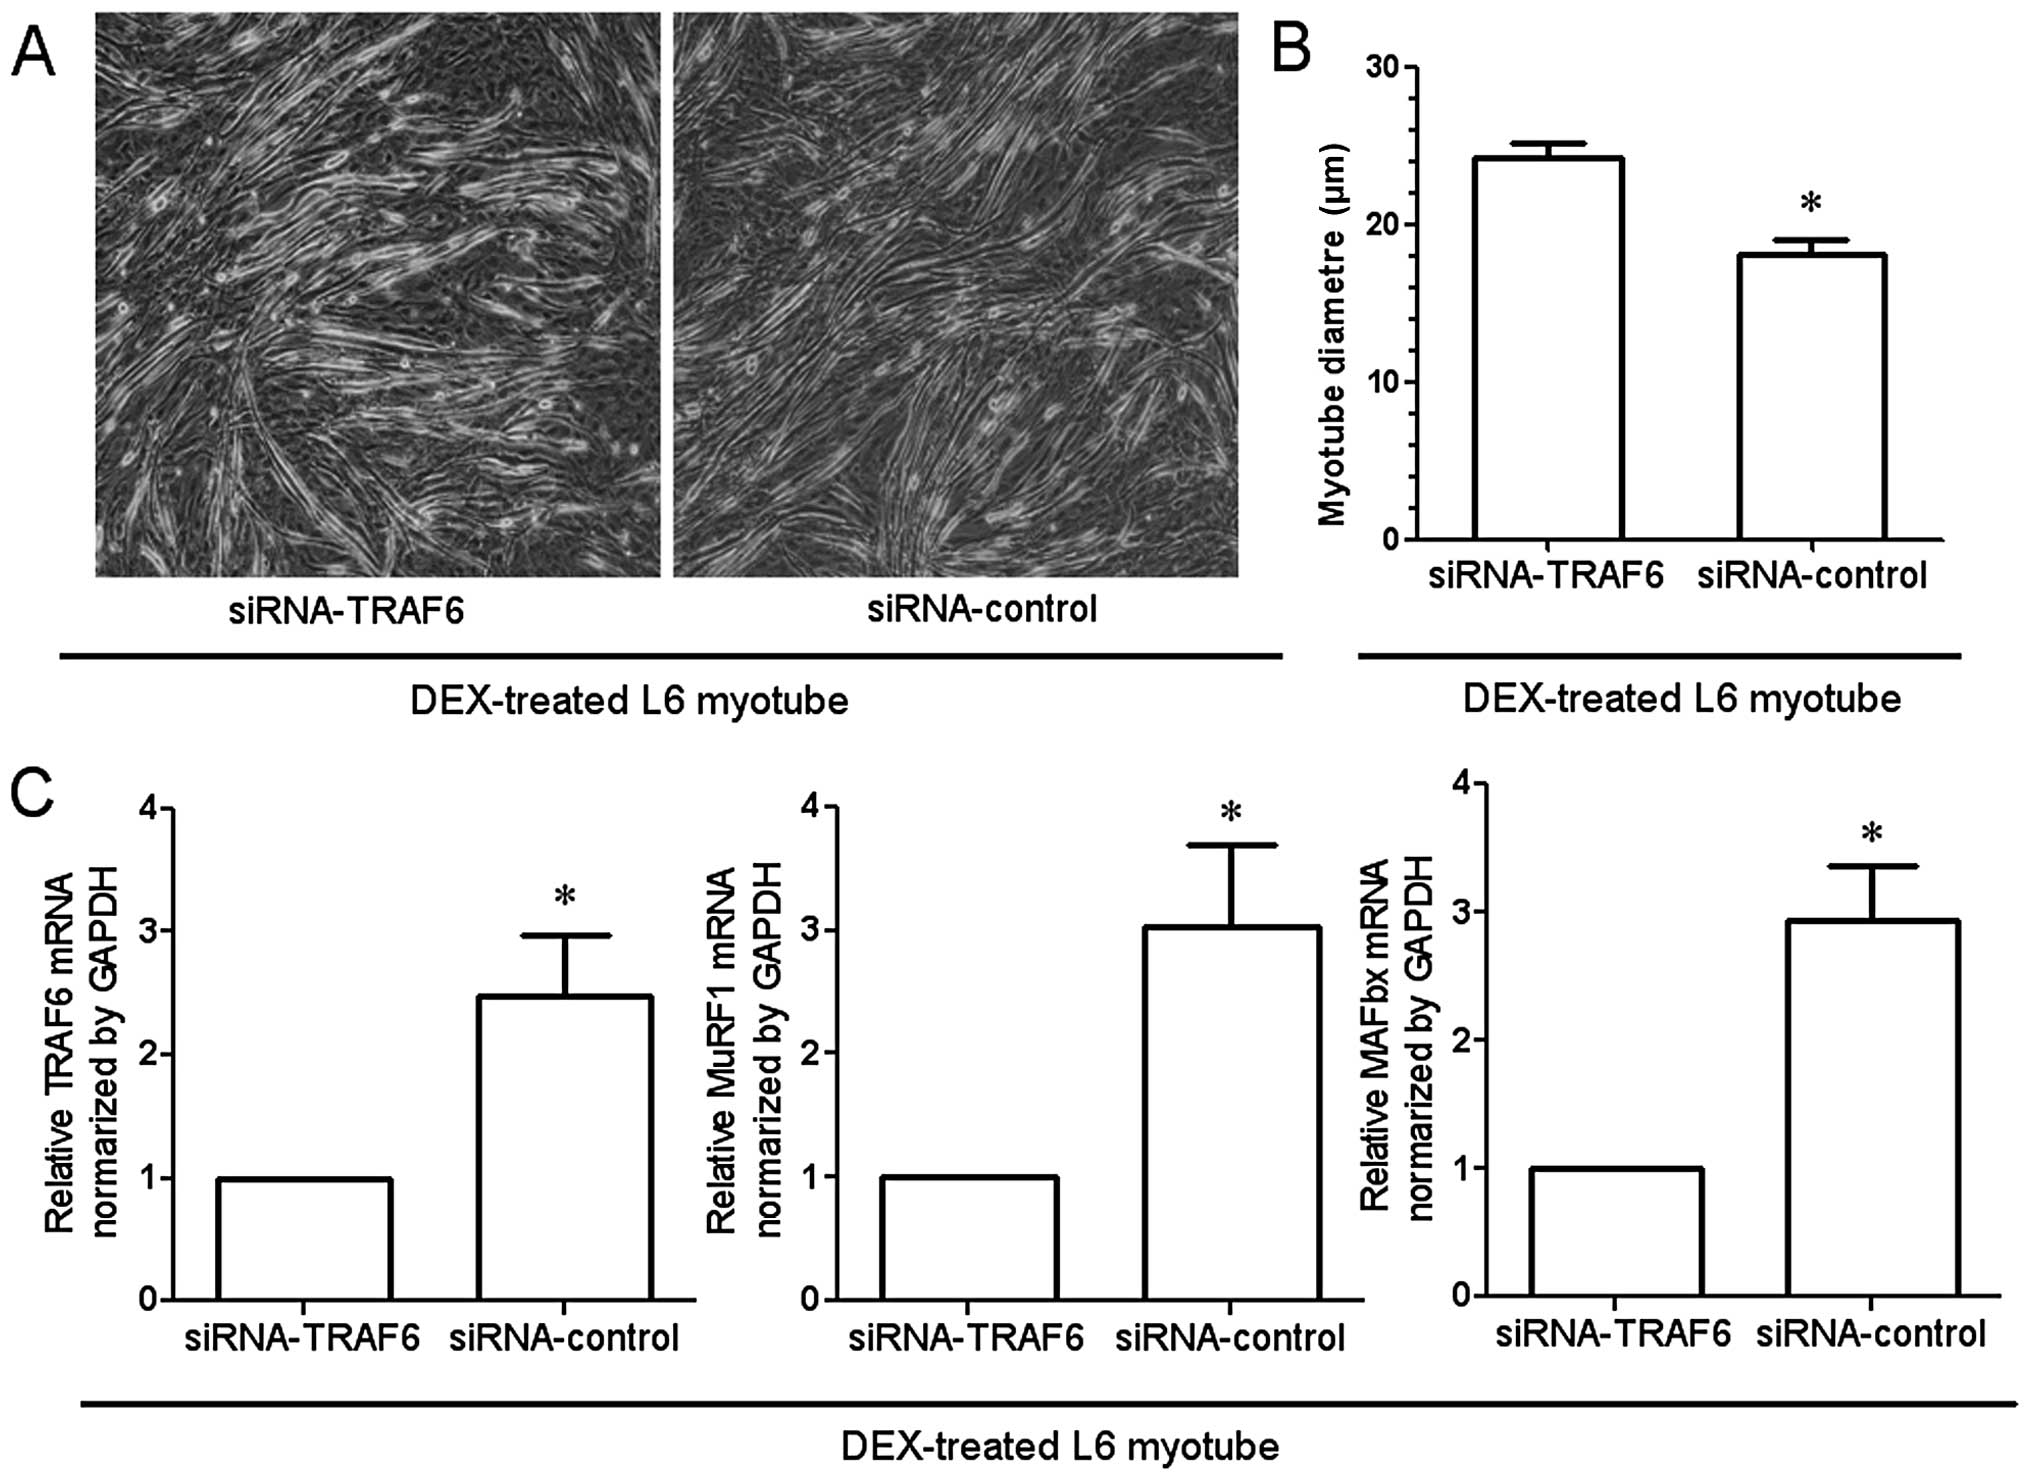
Light microscopy revealed that transfection of
myotubes with the siRNA targeting TRAF6 attenuated
dexamethasone-induced atrophy of L6 myotubes as compared to
transfection with the negative control siRNA (Fig. 6A). The diameter of L6 myotubes in
which TRAF6 was knocked down was significantly larger than that of
the myotubes transfected with the negative control (Fig. 6B). In addition, qRT-PCR
demonstrated the dexamethasone-induced upregulation of MAFBx and
MuRF1, as well as the expected downregulation of TRAF6 expression
by transfection with siRNA (Fig.
6C).
Discussion
In this study, proteomic and bioinformatic analyses
were performed to examined the changes in TA muscle during
denervation-induced atrophy. Our findings are in agreement with
results from previous global protein expression profiling studies
in denervated skeletal muscle (12,19), but also identified novel protein
targets that may be relevant to the pathobiology of muscle
atrophy.
The majority of differentially expressed proteins in
denervated TA muscle identified in our study are enzymes involved
in the regulation of energy metabolism, including α- and β-enolase,
glycogen phosphorylase muscle form (PYGM), creatine kinase M-type
(KCRM) and GAPDH (G3P). Cross-referencing with KEGG pathway data
indicated that these energy metabolism-related enzymes are involved
in the glycolytic, Krebs cycle and oxidative phosphorylation
pathways. These observations suggest that time-dependent changes in
energy production might be a dominant molecular event occurring in
denervated skeletal muscle. The altered expression of energy
metabolism-related proteins can lead to an overall disturbance of
the muscle, and ultimately contribute to the establishment of
pathological states, such as atrophy (20–22).
Enolase (2-phospho-D-glycerate hydrolase) is an
essential dimeric glycolytic enzyme, and skeletal muscles contain 2
isoforms, α and β (15,23). A previous study demonstrated that
the ubiquitous α-enolase and the muscle-specific β-enolase have the
highest and lowest expression in undifferentiated myoblasts,
respectively, and that a significant increase in the expression of
β-enolase occurs upon differentiation of myoblasts and is
maintained until the postnatal period (24). By contrast, α-enolase has been
rarely found expressed in the adult skeletal muscle. An isozymic
switch from the embryonic α- towards the muscle-specific β-enolase
has been observed during differentiation and maturation of
myoblasts with high-energy requirements (24,25). In our study, the expression of α-
and β-enolase following muscle denervation in adult TA muscle was
increased and decreased, respectively. This result suggests that an
isozymic switch opposite to that occurring in muscle maturation
(from the muscle-specific β- towards the embryonic α-enolase) takes
place during denervation-induced muscle atrophy.
Enolase is a glycolytic enzyme that catalyses the
conversion of 2-phosphoglycerate (2-PGA) to phosphoenolpyruvate
(PEP) (24). β-Enolase binds with
high affinity to sarcomeric troponin at the subcellular site where
glycolysis-produced ATP is most needed for muscle contraction
(26). In human muscles, the
β-enolase subunit accounts for >90% of the total enolase
activity (27), and high levels
of β-enolase characterize the glycolytic fast-twitch fibers of
adult muscles. During the degeneration of myofibers, the drop in
total enolase activity, mainly caused by a rapid decrease of
β-enolase, correlates with myofiber degeneration (25). In this study, β-enolase was
significantly downregulated in denervated TA muscle, which might
relate to the reduced production of ATP in glycolysis, the failure
in maintenance of the fast-twitch skeletal muscle phenotype, and
the myofiber degeneration observed in atrophy. These hypotheses
remain to be further investigated.
Enolase is well known as an enzyme of the glycolytic
pathway, ubiquitously expressed in the cytosol of prokaryotic and
eukaryotic cells (28). α-enolase
is however a multifunctional protein; in addition to its glycolytic
activity, this protein has plasminogen receptor functions and plays
a regulatory role in extracellular remodelling processes such as
myogenesis (29,30). In this study, α-enolase was
significantly upregulated in denervated TA muscle, which might be
associated with early stages of myogenesis following nerve
transection. Furthermore, α-enolase was reported to be upregulated
by hypoxia (31) and
pro-inflammatory stimuli (32),
which are two common pathogenic characteristics of muscle atrophy
(33–36). Based on these reports, we
hypothesize that the significant upregulation of α-enolase might
relate to the inflammatory environment of the denervated skeletal
muscle. Pro-inflammatory cytokines play a key role in the
pathophysiology of muscle atrophy through activation of
atrophy-related genes, such as nucleasr factor (NF)-κB, TRAF6,
MuRF1 and MAFbx (37–39). Therefore, it appears that
α-enolase plays a complex role in the regulation of
denervation-induced muscle atrophy. The exact underlying mechanisms
will be evaluated in a future study.
In proteomic studies, low-abundance proteins are
commonly undetected. In this study, proteomic analysis indicated
that the E2 polyubiquitin-conjugating enzyme UBE2N, required for
TRAF6 activation (17), is
upregulated in denervated TA muscle. This result, combined with
predictions of protein-protein interactions based on the STRING
database, allowed us to infer that TRAF6 might be upregulated in
denervated TA muscle, although the expression of this protein was
not directly assessed by iTRAQ-based proteomics (undetected
protein). This hypothesis was confirmed by western blotting. Our
finding on TRAF6 expression in denervation-induced muscle atrophy
is consistent with a previous study of starvation-induced muscle
atrophy (18).
TRAF6 is a unique E3 ubiquitin ligase and adaptor
protein involved in receptor-mediated activation of a number of
signaling pathways, and its expression is enhanced during skeletal
muscle atrophy (40). Deletion of
the TRAF6 reduced the expression of the muscle-specific ubiquitin
ligases MuRF1 and MAFBx (18),
which are critical proteins in the development of muscle atrophy
(41,42). We further inferred that MAFBx and
MuRF1 may be upregulated in denervated TA muscle. The inference was
also confirmed by western blot analysis.
We hypothesized that the increased expression of
α-enolase in denervated TA muscle may relate to the activation of
atrophy-related genes, including TRAF6, MuRF1 and MAFBx. Although
these proteins were not identified by our proteomics analysis
(possibly due to their low abundance), predicted interaction data
from the STRING database allowed to infer a potential expression of
the protein TRAF6 in denervated TA muscle. The expression of TRAF6,
but also, MuRF1 and MAFBx proteins, was positively detected in
denervated TA muscle with western blot analysis.
In order to investigate the potential involvement
and the functional role of TRAF6 in the development of myotube
atrophy, in this study, we examined the effects of siRNA-mediated
TRAF6 knockdown on dexamethasone-induced L6 myotube atrophy. In
addition, the mRNA levels of TRAF6, MuRF1 and MAFBx were quantified
by qRT-PCR in atrophied myotubes with the TRAF6 knockdown, and the
results confirmed that TRAF6 may possibly exert its function
through at least in part, regulating the muscle-specific ubiquitin
ligases MAFBx and MuRF1.
In summary, the combined use of proteomics and
bioinformatics provided additional knowledge on denervation-induced
skeletal muscle atrophy. Hopefully, our findings may contribute to
the understanding and treatment of skeletal muscle atrophy. This
study also provided an example where a high number of proteins with
high- or medium-abundance were identified with high confidence by
an advanced proteomics technique, although even higher-sensitivity
methods still remain to be developed so as to allow detection of
low-abundance proteins. We suggest that subcellular fractionation
techniques may be used in the future to reduce the sampling
complexity and enrich for proteins of interest in skeletal muscle
extracts, thereby allowing more a thorough analysis of the
proteomic content of atrophied muscle.
Acknowledgements
This study was funded by the Hi-Tech Research and
Development Program of China (863 Program, grant no. 2012AA020502),
the National Key Basic Research Program of China (973 Program,
grant nos. 2014CB542202 and 2014CB542203), the National Natural
Science Foundation of China (grant nos. 81130080, 81171180,
81301628 and 81073079), a project funded by the Priority Academic
Program Development of Jiangsu Higher Education Institutions
(PAPD), the Basic Research Project of the Jiangsu Education
Department (grant no. 12KJB310010), the Colleges and Universities
in Jiangsu Province graduate research project (grant no.
CXZZ12_0861) and the Nantong Science and Technology Innovation
Program (grant no. BK2011045). We thank Professor Jie Liu for
assistance in the manuscript preparation.
References
|
1
|
Jackman RW and Kandarian SC: Am J Physiol
Cell Physiol. 287:C834–843. 2004. View Article : Google Scholar : PubMed/NCBI
|
|
2
|
Ibebunjo C, Chick JM, Kendall T, et al:
Genomic and proteomic profiling reveals reduced mitochondrial
function and disruption of the neuromuscular junction driving rat
sarcopenia. Mol Cell Biol. 33:194–212. 2013. View Article : Google Scholar : PubMed/NCBI
|
|
3
|
McKinnell IW and Rudnicki MA: Molecular
mechanisms of muscle atrophy. Cell. 119:907–910. 2004. View Article : Google Scholar
|
|
4
|
Romanick M, Thompson LV and Brown-Borg HM:
Murine models of atrophy, cachexia, and sarcopenia in skeletal
muscle. Biochim Biophys Acta. 1832:1410–1420. 2013. View Article : Google Scholar : PubMed/NCBI
|
|
5
|
Wei B, Dui W, Liu D, et al: MST1, a key
player, in enhancing fast skeletal muscle atrophy. BMC Biology.
11:122013. View Article : Google Scholar : PubMed/NCBI
|
|
6
|
Nagpal P, Plant PJ, Correa J, et al: The
ubiquitin ligase Nedd4-1 participates in denervation-induced
skeletal muscle atrophy in mice. PloS One. 7:e464272012. View Article : Google Scholar : PubMed/NCBI
|
|
7
|
Nader GA: Molecular determinants of
skeletal muscle mass: getting the ‘AKT’ together. Int J Biochem
Cell Biol. 37:1985–1996. 2005.PubMed/NCBI
|
|
8
|
Ramamoorthy S, Donohue M and Buck M:
Decreased Jun-D and myogenin expression in muscle wasting of human
cachexia. Am J Physiol Endocrinol Metab. 297:E392–401. 2009.
View Article : Google Scholar : PubMed/NCBI
|
|
9
|
Menconi MJ, Arany ZP, Alamdari N, et al:
Sepsis and glucocorticoids downregulate the expression of the
nuclear cofactor PGC-1beta in skeletal muscle. Am J Physiol
Endocrinol Metab. 299:E533–543. 2010. View Article : Google Scholar : PubMed/NCBI
|
|
10
|
Tews DS, Behrhof W and Schindler S:
Expression patterns of initiator and effector caspases in
denervated human skeletal muscle. Muscle Nerve. 31:175–181. 2005.
View Article : Google Scholar : PubMed/NCBI
|
|
11
|
Bantscheff M, Boesche M, Eberhard D, et
al: Robust and sensitive iTRAQ quantification on an LTQ Orbitrap
mass spectrometer. Mol Cell Proteomics. 7:1702–1713. 2008.
View Article : Google Scholar : PubMed/NCBI
|
|
12
|
Sun H, Li M, Gong L, et al: iTRAQ-coupled
2D LC-MS/MS analysis on differentially expressed proteins in
denervated tibialis anterior muscle of Rattus norvegicus.
Mol Cell Biochem. 364:193–207. 2012. View Article : Google Scholar : PubMed/NCBI
|
|
13
|
Sinclair J, Metodieva G, Dafou D, et al:
Profiling signatures of ovarian cancer tumour suppression using
2D-DIGE and 2D-LC-MS/MS with tandem mass tagging. J Proteomics.
74:451–465. 2011. View Article : Google Scholar : PubMed/NCBI
|
|
14
|
Szklarczyk D, Franceschini A, Kuhn M, et
al: The STRING database in 2011: functional interaction networks of
proteins, globally integrated and scored. Nucleic Acids Res.
39:D561–D568. 2011. View Article : Google Scholar : PubMed/NCBI
|
|
15
|
Sun H, Zhu T, Ding F, et al: Proteomic
studies of rat tibialis anterior muscle during postnatal growth and
development. Mol Cell Biochem. 332:161–171. 2009. View Article : Google Scholar : PubMed/NCBI
|
|
16
|
Menconi M, Gonnella P, Petkova V, et al:
Dexamethasone and corticosterone induce similar, but not identical,
muscle wasting responses in cultured L6 and C2C12 myotubes. J Cell
Biochem. 105:353–364. 2008. View Article : Google Scholar : PubMed/NCBI
|
|
17
|
Sanada T, Kim M, Mimuro H, et al: The
Shigella flexneri effector OspI deamidates UBC13 to dampen
the inflammatory response. Nature. 483:623–626. 2012.
|
|
18
|
Paul PK, Bhatnagar S, Mishra V, et al: The
E3 ubiquitin ligase TRAF6 intercedes in starvation-induced skeletal
muscle atrophy through multiple mechanisms. Mol Cell Biol.
32:1248–1259. 2012. View Article : Google Scholar : PubMed/NCBI
|
|
19
|
Jones A, Hwang DJ, Narayanan R, et al:
Effects of a novel selective androgen receptor modulator on
dexamethasone-induced and hypogonadism-induced muscle atrophy.
Endocrinology. 151:3706–3719. 2010. View Article : Google Scholar : PubMed/NCBI
|
|
20
|
Wang X, Pickrell AM, Rossi SG, et al:
Transient systemic mtDNA damage leads to muscle wasting by reducing
the satellite cells pool. Hum Mol Genet. 22:3976–3986. 2013.
View Article : Google Scholar : PubMed/NCBI
|
|
21
|
Calvani R, Joseph AM, Adhihetty PJ, et al:
Mitochondrial pathways in sarcopenia of aging and disuse muscle
atrophy. Biol Chem. 394:393–414. 2013. View Article : Google Scholar : PubMed/NCBI
|
|
22
|
Picard M, Ritchie D, Thomas MM, et al:
Alterations in intrinsic mitochondrial function with aging are
fiber type-specific and do not explain differential atrophy between
muscles. Aging Cell. 10:1047–1055. 2011. View Article : Google Scholar : PubMed/NCBI
|
|
23
|
Sun H, Liu J, Ding F, et al: Investigation
of differentially expressed proteins in rat gastrocnemius muscle
during denervation-reinnervation. J Muscle Res Cell Motil.
27:241–250. 2006. View Article : Google Scholar : PubMed/NCBI
|
|
24
|
Keller A, Peltzer J, Carpentier G, et al:
Interactions of enolase isoforms with tubulin and microtubules
during myogenesis. Biochim Biophys Acta. 1770:919–926. 2007.
View Article : Google Scholar : PubMed/NCBI
|
|
25
|
Merkulova T, Dehaupas M, Nevers MC, et al:
Differential modulation of alpha, beta and gamma enolase isoforms
in regenerating mouse skeletal muscle. Eur J Biochem.
267:3735–3743. 2000. View Article : Google Scholar : PubMed/NCBI
|
|
26
|
Merkulova T, Lucas M, Jabet C, et al:
Biochemical characterization of the mouse muscle-specific enolase:
developmental changes in electrophoretic variants and selective
binding to other proteins. Biochem J. 323(Pt 3): 791–800. 1997.
|
|
27
|
Comi GP, Fortunato F, Lucchiari S, et al:
Beta-enolase deficiency, a new metabolic myopathy of distal
glycolysis. Ann Neurol. 50:202–207. 2001. View Article : Google Scholar : PubMed/NCBI
|
|
28
|
Seweryn E, Pietkiewicz J, Szamborska A, et
al: Enolase on the surface of prokaryotic and eukaryotic cells is a
receptor for human plasminogen. Postepy Hig Med Dosw (Online).
61:672–682. 2007.(In Polish).
|
|
29
|
Díaz-Ramos A, Roig-Borrellas A,
García-Melero A, et al: Requirement of plasminogen binding to its
cell-surface receptor alpha-enolase for efficient regeneration of
normal and dystrophic skeletal muscle. PloS One.
7:e504772012.PubMed/NCBI
|
|
30
|
Díaz-Ramos A, Roig-Borrellas A,
García-Melero A, et al: alpha-Enolase, a multifunctional protein:
its role on pathophysiological situations. J Biomed Biotechnology.
2012:1567952012.PubMed/NCBI
|
|
31
|
Aaronson RM, Graven KK, Tucci M, et al:
Non-neuronal enolase is an endothelial hypoxic stress protein. J
Biol Chem. 270:27752–27757. 1995. View Article : Google Scholar : PubMed/NCBI
|
|
32
|
Fontán PA, Pancholi V, Nociari MM, et al:
Antibodies to streptococcal surface enolase react with human
α-enolase: implications in poststreptococcal sequelae. J Infect
Dis. 182:1712–1721. 2000.PubMed/NCBI
|
|
33
|
Paul PK, Gupta SK, Bhatnagar S, et al:
Targeted ablation of TRAF6 inhibits skeletal muscle wasting in
mice. J Cell Biol. 191:1395–1411. 2010. View Article : Google Scholar : PubMed/NCBI
|
|
34
|
Zhao W, Pan J, Zhao Z, et al: Testosterone
protects against dexamethasone-induced muscle atrophy, protein
degradation and MAFbx upregulation. J Steroid Biochem Mol Biol.
110:125–129. 2008. View Article : Google Scholar : PubMed/NCBI
|
|
35
|
Castillero E, Alamdari N, Lecker SH, et
al: Suppression of atrogin-1 and MuRF1 prevents
dexamethasone-induced atrophy of cultured myotubes. Metabolism.
62:1495–1502. 2013. View Article : Google Scholar : PubMed/NCBI
|
|
36
|
Castillero E, Alamdari N, Aversa Z, et al:
PPARβ/δ regulates glucocorticoid- and sepsis-induced FOXO1
activation and muscle wasting. PloS One. 8:e597262013.
|
|
37
|
Suetta C, Frandsen U, Jensen L, et al:
Aging affects the transcriptional regulation of human skeletal
muscle disuse atrophy. PloS One. 7:e512382012. View Article : Google Scholar : PubMed/NCBI
|
|
38
|
Caron AZ, Haroun S, Leblanc E, et al: The
proteasome inhibitor MG132 reduces immobilization-induced skeletal
muscle atrophy in mice. BMC Musculoskelet Disord. 12:1852011.
View Article : Google Scholar : PubMed/NCBI
|
|
39
|
Caron AZ, Drouin G, Desrosiers J, et al: A
novel hindlimb immobilization procedure for studying skeletal
muscle atrophy and recovery in mouse. J Appl Physiol.
106:2049–2059. 2009. View Article : Google Scholar : PubMed/NCBI
|
|
40
|
Paul PK and Kumar A: TRAF6 coordinates the
activation of autophagy and ubiquitin-proteasome systems in
atrophying skeletal muscle. Autophagy. 7:555–556. 2011. View Article : Google Scholar : PubMed/NCBI
|
|
41
|
Cao PR, Kim HJ and Lecker SH:
Ubiquitin-protein ligases in muscle wasting. Int J Biochem Cell
Biol. 37:2088–2097. 2005. View Article : Google Scholar : PubMed/NCBI
|
|
42
|
Zhang L, Tang H, Kou Y, et al:
MG132-mediated inhibition of the ubiquitin-proteasome pathway
ameliorates cancer cachexia. J Cancer Res Clin Oncol.
139:1105–1115. 2013. View Article : Google Scholar : PubMed/NCBI
|