Introduction
Glucagon-like peptide-1 (GLP-1) and
glucose-dependent insulinotropic polypeptide (GIP) are incretin
hormones that regulate insulin secretion from pancreatic β cells.
GLP-1 and GIP are secreted by the small intestine in response to
meal ingestion. GLP-1 is secreted from L cells in the lower small
intestine, while GIP is secreted from K cells in the upper small
intestine. These incretins stimulate insulin secretion from β cells
by binding to the GLP-1 receptor (GLP-1R) and GIP receptor (GIPR).
Incretins also have extra-pancreatic functions in a variety of
tissues. For example, GLP-1 affects the central nervous system,
resulting in neuroprotection against amyloid β (1) and the suppression of appetite
(2). It has also been reported to
increase glucose uptake in the cardiovascular system (3) and prolong gastric acid secretion
(4). GIP affects the central
nervous system by stimulating memory recognition and
neuroprotection (5). Several
studies have also demonstrated that GIP mediates lipogenesis in
adipocytes (6) and bone
remodeling (7).
The incretin receptors, GLP-1R and GIPR, play
important roles in glucose metabolism. GLP-1R and GIPR are members
of the G protein-coupled receptor (GPCR) family. GLP-1R and GIPR
are expressed in a variety of organs, such as the pancreas,
stomach, intestine, heart, lungs, pituitary gland and brain
(8,9). However, GLP-1R, but not GIPR, is
expressed in the kidneys. In addition, GIPR, but not GLP-1R, is
expressed in the adrenal cortex, adipose tissue and bone (9,10).
The binding of incretins to their receptors activates adenylate
cyclase, which increases intracellular cyclic adenosine
monophosphate (cAMP) and is followed by changes in the
intracellular Ca2+ concentration, ATP production in the
mitochondria and insulin secretion (11).
There is a correlation between glucose metabolism
and bone metabolism. For example, insulin signals in osteoblasts
activate osteocalcin production, which enhances glucose metabolism.
However, this activation does not occur under conditions of
impaired bone resorption (12).
The expression of insulin and adiponectin receptors increases
during osteoblastic differentiation (13). Adiponectin, which regulates
glucose and lipid metabolism, stimulates bone morphogenetic
protein-2 (BMP-2) expression in osteoblasts (14).
Incretins act in an insulin-dependent or
-independent manner. The GLP-1-mediated suppression of hepatic
glucose production is one of the insulin-independent effects
(15). However, the
insulin-dependent effects of GLP-1 are still controversial. For
example, it is unclear whether the effects of GLP-1 on adipocytes
are dependent on or independent of insulin since the direct role of
GLP-1R on adipocytes has not been experimentally confirmed
(16–18). It has been suggested that
incretins have a direct effect on bone as the genetic disruption of
pancreatic GLP-1R increases bone resorption in mice (19,20). Although GIPR is expressed in
osteoblasts (21), it is unclear
whether GLP-1R is also expressed in osteoblasts. GIP has been
reported to inhibit bone resorption and enhance bone formation by
stimulating osteoblast proliferation and inhibiting osteoblast
apoptosis (22). Notably,
GIPR-knockout mice exhibit reduced bone strength and quality
(23,24).
The objective of this study was to clarify the
presence of GLP-1R and GIPR in mouse osteoblastic MC3T3-E1 cells
and examine the associaiton between incretin receptors in
osteoblasts and glucose metabolism.
Materials and methods
Materials
MC3T3-E1 cells, a mouse osteoblastic cell line, were
obtained from the RIKEN Cell Bank (Tsukuba, Japan). The reagent
used for total RNA isolation (RNA STAT-60™) was purchased from
Amsbio (Abingdon, UK). Rabbit polyclonal anti-GLP-1R and GIPR
antibodies, which cross-react with mouse antigens, were obtained
from Abcam (Cambridge, UK). Recombinant human BMP-2 (rhBMP-2) was
purchased from R&D Systems (Minneapolis, MN, USA). The other
reagents used were of the highest grade commercially available.
Cell culture
MC3T3-E1, mouse osteoblast-like cells, were
maintained at 37°C under 95% air/5% CO2 in Minimum
Essential Medium Eagle α modification (α-MEM; Sigma, St. Louis, MO,
USA) containing 5.6 mM glucose, 100 U/ml penicillin, 100 μg/ml
streptomycin and 10% fetal bovine serum (FBS; SAFC Biosciences,
Lenexa, KS, USA). For glucose and BMP-2 treatment,
3.75×10⁴ cells were seeded onto 35-mm dishes and
incubated overnight at 37°C. The dishes were then randomly divided
into 8 groups and were incubated in medium containing normal (5.6
mM) or high (10, 20 or 30 mM) glucose concentrations without or
with 100 ng/ml rhBMP-2.
Reverse transcription-polymerase chain
reaction (RT-PCR)
The MC3T3-E1 cells were cultured in α-MEM
supplemented with 10% FBS and 5.6 mM glucose for 72 h. Total RNA
was then isolated using RNA STAT-60™ reagent according to the
instructions provided by the manufacturer. cDNA was synthesized
from 1.0 μg of total RNA with oligo(dT) primers using SuperScript™
III Reverse Transcriptase (Invitrogen, San Diego, CA, USA) under
the conditions suggested by the manufacturer. GLP-1R, GIPR and
glyceraldehyde 3-phosphate dehydrogenase (GAPDH) mRNA expression
was detected by RT-PCR using the following primers (forward and
reverse), as previously described: GLP-1R, 5′-GGAGTGTGAAGAGTC
TAAGC-3′ and 5′-GCAGTACTGCATGAGCAGGA-3′ (25); GIPR, 5′-CTGCCTGCCGCACGGCCCAGAT-3′
and 5′-GCG AGCCAGCCTCAGCCGGTAA-3′ (22); GAPDH, 5′-ACCACA GTCCATGCCATCAC-3′
and 5′-TCCACCACCCTGTTGCT GTA-3′. For GLP-1R, the PCR conditions
comprised an initial activation of polymerase at 94°C for 10 min,
followed by 35 cycles of denaturation at 94°C for 1 min, annealing
at 59°C for 30 sec, and extension at 72°C for 1 min, with a final
extension at 72°C for 10 min. For GIPR, the PCR conditions
comprised an initial denaturation at 94°C for 2 min, followed by 35
cycles of denaturation at 94°C for 30 sec, annealing at 65°C for 30
sec, and extension at 72°C for 1 min, with a final extension at
72°C for 10 min. The quality of the template was examined by
amplifying GAPDH cDNA in each PCR condition. The amplified PCR
products were analyzed by electrophoresis on a 2% agarose gel in
Tris-acetate-EDTA buffer, stained with ethidium bromide and
photographed under ultraviolet transillumination.
Quantitative PCR
The cells were seeded at a density of
3.75×10⁴ cells in 35-mm dishes and maintained at 37°C.
The following day, the medium was substituted with medium
containing various concentrations of glucose, as described above.
Total RNA was isolated from the cells following culture for 24, 48
and 72 h, and was converted to cDNA. Four samples were prepared for
each treatment. Quantitative PCR assays were carried out in
triplicate for each sample using a StepOne™ Real-Time PCR System
(Applied Biosystems, Foster City, CA, USA). PCR analyses were
conducted with gene-specific primers and fluorescently labeled
TaqMan GLP-1R-specific probes (Mm00445292_m1), GIPR
(Mm01316344_m1), Runx2 (Mm00501580_m1), alkaline phosphatase (ALP,
Mm01285814_g1) and GAPDH (Mm99999915_g1). The PCR conditions
comprised activation at 95°C for 20 sec, followed by 40 cycles of
95°C for 1 sec and 60°C for 20 sec. The ΔΔCt method of relative
quantification was used to determine the fold change in the
expression of each gene. First, the threshold cycle (Ct) of the
target mRNAs was normalized to the Ct values of the internal
control (GAPDH) in the same sample (ΔCt = Cttarget −
CtGAPDH), which was followed by normalization to the
control (ΔΔCt = ΔCtsample − ΔCtcontrol). The
fold change in expression was calculated as the relative
quantification value (RQ; 2−ΔΔCt).
Western blot analysis
Total protein was extracted from confluent cells
cultured for 72 h on 60-mm dishes in normal- (5.6 mM) or
high-glucose (30 mM) medium with or without BMP-2. Briefly, the
cells were washed twice with phosphate-buffered saline (PBS),
scraped from the dish and collected by centrifugation. The cells
were then resuspended in 100 μl of lysis buffer (20 mM Tris-HCl,
150 mM NaCl, 10 mM iodoacetamide, 5 mM NaF, 5 mM sodium
pyrophosphate, 10 mM EDTA, 10 mM β-glycerophosphate, pH 7.5,
containing 2% Triton X-100 and protease inhibitor cocktail),
incubated on ice for 15 min and centrifuged at 19,000 × g for 15
min at 4°C. The supernatant was mixed with sodium dodecyl
sulfate-polyacrylamide gel electrophoresis sample buffer (26) and heated at 100°C for 5 min.
Proteins (10 μg of total protein/well) were then separated on 5–20%
polyacrylamide gels (SuperSep Ace; Wako, Osaka, Japan) and
transferred onto a polyvinyldifluoride membrane (Millipore Corp.,
Billerica, MA, USA). The membrane was blocked with 1% bovine serum
albumin (BSA) in PBS containing 0.1% Tween-20 for 40 min at room
temperature and then incubated for 120 min with primary antibody
(anti-GLP-1R, 1:5,000 dilution, ab39072; anti-α-tubulin, 1:10,000
dilution, ab4074). The membranes were then washed 6 times for 5 min
each in buffer containing PBS and 0.1% Tween-20, followed by
incubation with a peroxidase-coupled secondary antibody (1:2,000
dilution; Pierce, Rockford, IL, USA). ECL Prime (GE Healthcare Life
Sciences, Piscataway, NJ, USA) was used to detect peroxidase
activity. The optical densities of the bands were quantified using
ImageJ 1.47 software (NIH, Bethesda, MD, USA). GLP-1R expression
was normalized to α-tubulin expression, which was used as an
internal loading control.
Immunofluorescence
The MC3T3-E1 cells (3.2×10⁴ cells/well)
were grown on a glass coverslip in 24-well plates for 72 h in
normal- (5.6 mM) or high-glucose (30 mM) medium with or without
BMP-2. Shortly before fixation, fresh medium containing 500 ng/ml
Hoechst 33342 (Cell Signaling Technology, Danvers, MA, USA) was
added followed by incubation for 1 h at 37°C. The cells were then
fixed with freshly prepared 4% paraformaldehyde (Sigma). The fixed
cells were permeabilized with 0.1% Triton X-100 in 10 mM
glycine-PBS, blocked with 3% BSA in PBS at room temperature for 30
min and incubated with rabbit anti-GLP-1R antibody (1:1,000
dilution, ab39072) for 1 h. After several washes with 0.1% BSA in
PBS, the cells were incubated with anti-rabbit secondary antibody
conjugated with AlexaFluor 488 (Molecular Probes, Eugene, OR, USA)
for 1 h, washed again with 0.1% BSA in PBS and mounted in ProLong
Gold Antifade reagent (Life Technologies, Eugene, OR, USA). The
samples were observed under an All-in-One Fluorescence Microscope
(BZ-9000; Keyence, Osaka, Japan).
3-(4,5-Dimethylthiazol-2-yl)-2,5-diphenyltetrazolium bromide (MTT)
assay
The MC3T3-E1 cells were seeded in 96-well plates at
a density of 5×10³ cells/100 μl/well. Following
incubation for 24, 48 or 72 h in normal- (5.6 mM) or high-glucose
(10, 20 or 30 mM) medium containing BMP-2, cell proliferation was
assessed using the MTT Cell Counting kit-8 (Dojindo, Kumamoto,
Japan) according to the manufacturer’s instructions. MTT solution
(10 μl) was added to each well and to the control wells without
cells. Following incubation at 37°C for 1 h, the amount of the MTT
formazan product was analyzed spectrophotometrically at a
wavelength of 450 nm. The absorbance was normalized to that of
cell-free medium.
Statistical analysis
Statistical analysis was performed using SPSS II for
Windows (SPSS Inc., Chicago, IL, USA). The statistical significance
of differences among groups was calculated using analysis of
variance. Data are presented as the means ± standard error of the
mean (SEM). P<0.05 was regarded as statistically significant and
P<0.01 as highly significant.
Results
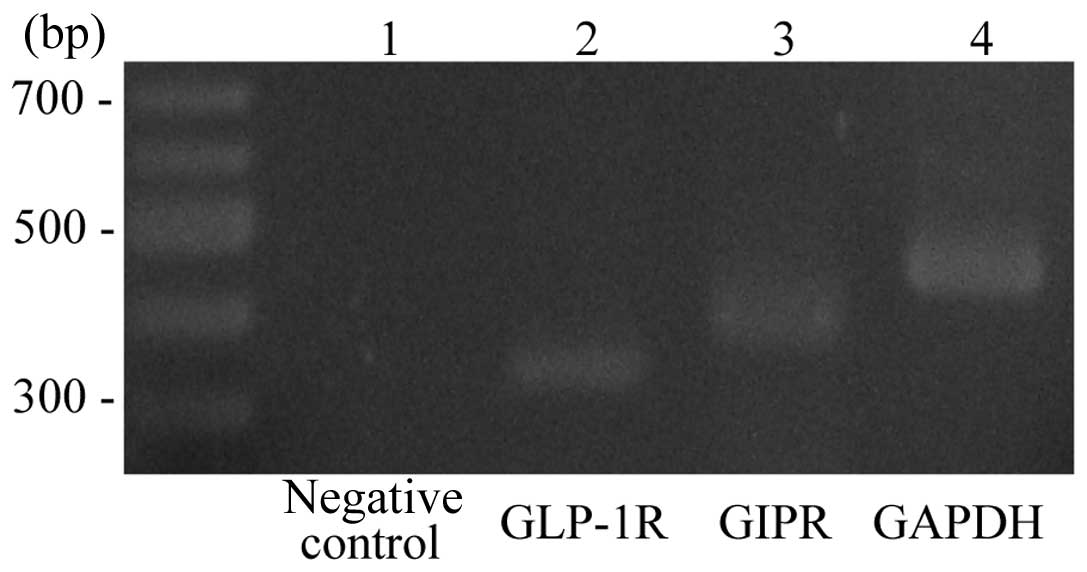
Expression of incretin receptors in
MC3T3-E1 cells
The MC3T3-E1 cell line, the most widely studied
mouse osteoblastic cell line, was used in this study. We first
examined the mRNA expression of GLP-1R and GIPR in these cells by
RT-PCR with specific primers. Bands at 337 and 382 bp,
corresponding to GLP-1R and GIPR, respectively, were detected
(Fig. 1), indicating that these
osteoblasts expressed both types of incretin receptors.
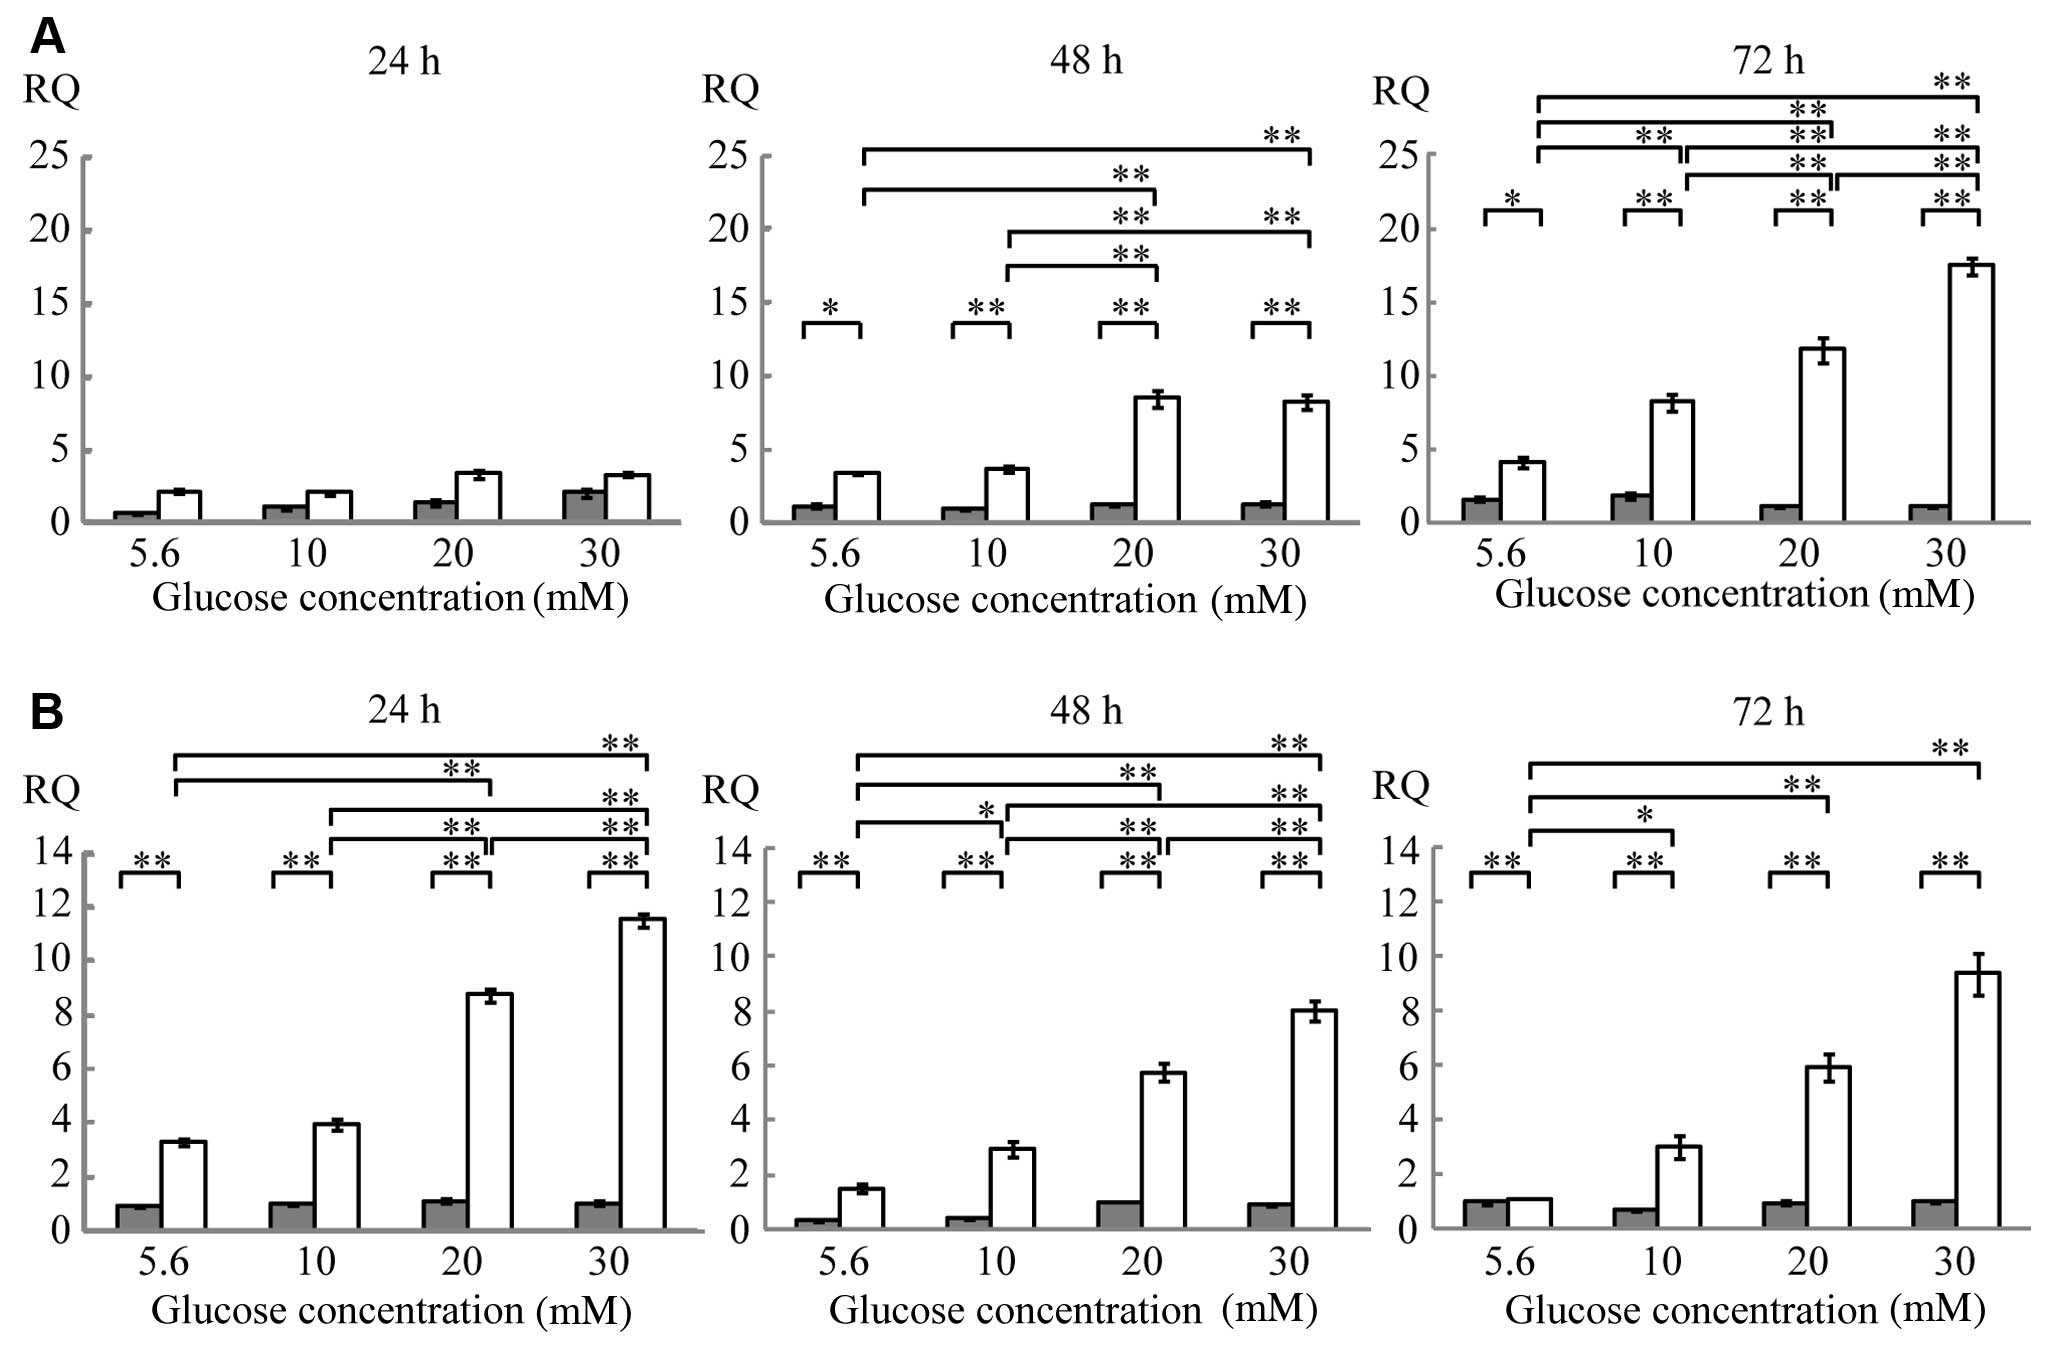
Quantitative PCR
The MC3T3-E1 cells were cultured in medium
containing various glucose concentrations. The expression of GLP-1R
mRNA following 24 h of culture was unaffected by changes in glucose
concentrations either in the presence or absence of BMP-2. After 48
h of culture, GLP-1R mRNA expression increased in the presence of
BMP-2 compared with the absence of BMP-2 by 3-fold in the cells
cultured in 5.6 mM (normal) glucose, 4-fold in the cells cultured
in 10 mM glucose, and 6-fold in the cells cultured in 20 and 30 mM
glucose. After 72 h of culture, GLP-1R mRNA expression increased in
the presence of BMP-2 by 3-fold in the cells cultured in 5.6 mM
glucose, 4-fold in the cells cultured in 10 mM glucose, 11-fold in
the cells cultured in 20 mM glucose and 16-fold in the cells
cultured in 30 mM glucose (Fig.
2A and Table I). Notably, in
the presence of BMP-2, GLP-1R mRNA expression increased in response
to higher glucose concentrations. After 48 h of culture, GLP-1R
mRNA expression in the presence of BMP-2 in the cells cultured in
30 mM glucose was 2-fold higher than that in the cells cultured in
5.6 mM glucose. After 72 h of culture, GLP-1R mRNA expression in
the cells cultured in 30 mM glucose was 4-fold higher than that in
the cells cultured in 5.6 mM glucose (Fig. 2A and Table I). GLP-1R mRNA expression
increased in a time-dependent manner, since its expression after 72
h of culture in the cells cultured in 30 mM glucose in the presence
of BMP-2 was 5-fold higher than that after 24 h of culture
(Table I).
 | Table IEffects of glucose, BMP-2 and
incubation time on GLP-1R mRNA expression. |
Table I
Effects of glucose, BMP-2 and
incubation time on GLP-1R mRNA expression.
| Glucose
concentration (mM) | 24 h | 48 h | 72 h |
|---|
|
|
|
|---|
| BMP-2 (−) | BMP-2 (+) | BMP-2 (−) | BMP-2 (+) | BMP-2 (−) | BMP-2 (+) |
|---|
| 5.6 | 0.82±0.08 | 2.25±0.18 | 1.16±0.17 | 3.40±0.05 | 1.62±0.15 | 4.17±0.36 |
| 10 | 1.14±0.15 | 2.21±0.15 | 0.90±0.09 | 3.67±0.25 | 1.90±0.23 | 8.23±0.56 |
| 20 | 1.52±0.25 | 3.45±0.28 | 1.29±0.09 | 8.46±0.51 | 1.11±0.07 | 11.79±0.84 |
| 30 | 2.16±0.27 | 3.38±0.16 | 1.31±0.13 | 8.22±0.49 | 1.10±0.04 | 17.49±0.55 |
GIPR mRNA expression was stimulated by BMP-2 at each
glucose concentration (Fig. 2B
and Table II). GIPR mRNA
expression increased in response to higher glucose concentrations
in the presence of BMP-2, being 4-fold higher in the cells cultured
in 30 mM glucose than in the cells cultured in 5.6 mM glucose after
24 h of culture (Fig. 2B and
Table II). After 48 and 72 h of
culture, GIPR mRNA expression in the cells cultured in 30 mM
glucose increased by 5- and 9-fold, respectively, compared with the
cells cultured in 5.6 mM glucose in the presence of BMP-2. However,
GIPR mRNA expression was not affected by the incubation time
(Table II).
| Table IIEffects of glucose, BMP-2 and
incubation time on GIPR mRNA expression. |
Table II
Effects of glucose, BMP-2 and
incubation time on GIPR mRNA expression.
| Glucose
concentration (mM) | 24 h | 48 h | 72 h |
|---|
|
|
|
|---|
| BMP-2 (−) | BMP-2 (+) | BMP-2 (−) | BMP-2 (+) | BMP-2 (−) | BMP-2 (+) |
|---|
| 5.6 | 0.91±0.05 | 3.29±0.12 | 0.28±0.03 | 1.50±0.14 | 0.96±0.11 | 1.09±0.03 |
| 10 | 0.97±0.05 | 3.95±0.20 | 0.43±0.04 | 2.94±0.26 | 0.68±0.06 | 2.98±0.40 |
| 20 | 1.09±0.10 | 8.76±0.26 | 1.01±0.03 | 5.78±0.32 | 0.94±0.09 | 5.94±0.50 |
| 30 | 1.00±0.10 | 11.54±0.28 | 0.86±0.05 | 8.04±0.35 | 1.00±0.05 | 9.33±0.74 |
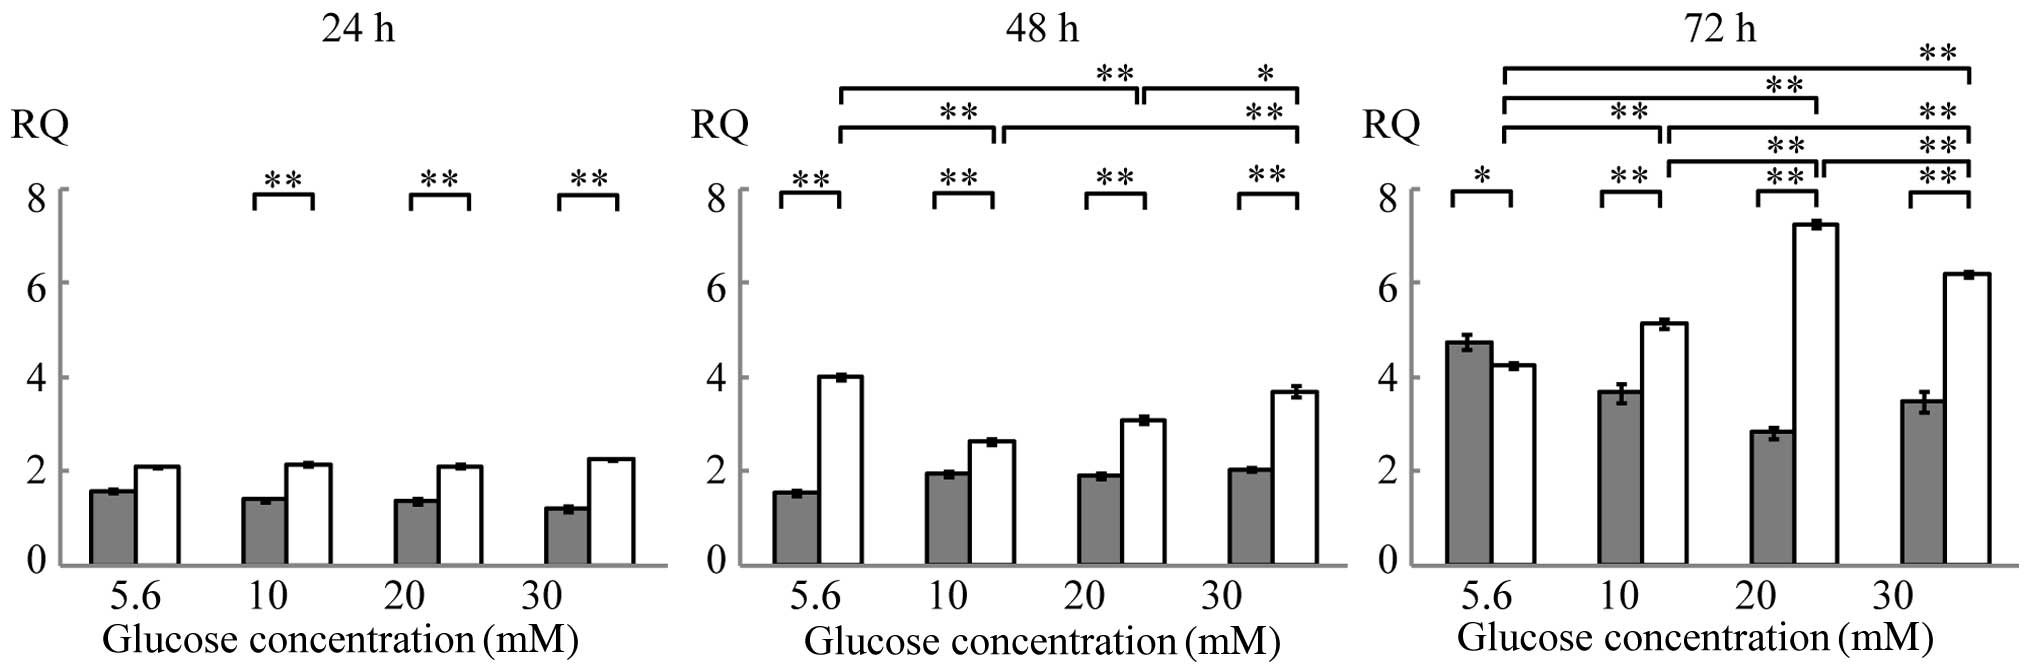
The expression of Runx2 mRNA increased in a time-
dependent manner in the presence of BMP-2. The glucose
concentration affected Runx2 mRNA expression after 48 and 72 h of
culture in the presence of BMP-2 (Fig. 3 and Table III). The expression of ALP mRNA
was below the limit of detection at all culture duration tests
(data not shown).
| Table IIIEffects of glucose, BMP-2 and
incubation time on Runx2 mRNA expression. |
Table III
Effects of glucose, BMP-2 and
incubation time on Runx2 mRNA expression.
| Glucose
concentration (mM) | 24 h | 48 h | 72 h |
|---|
|
|
|
|---|
| BMP-2 (−) | BMP-2 (+) | BMP-2 (−) | BMP-2 (+) | BMP-2 (−) | BMP-2 (+) |
|---|
| 5.6 | 1.60±0.04 | 2.09±0.02 | 1.53±0.07 | 3.99±0.04 | 4.73±0.15 | 4.23±0.06 |
| 10 | 1.40±0.05 | 2.15±0.05 | 1.96±0.06 | 2.63±0.05 | 3.66±0.21 | 5.12±0.10 |
| 20 | 1.37±0.04 | 2.11±0.03 | 1.91±0.06 | 3.08±0.07 | 2.82±0.12 | 7.23±0.08 |
| 30 | 1.21±0.07 | 2.27±0.02 | 2.03±0.05 | 3.68±0.11 | 3.46±0.23 | 6.18±0.06 |
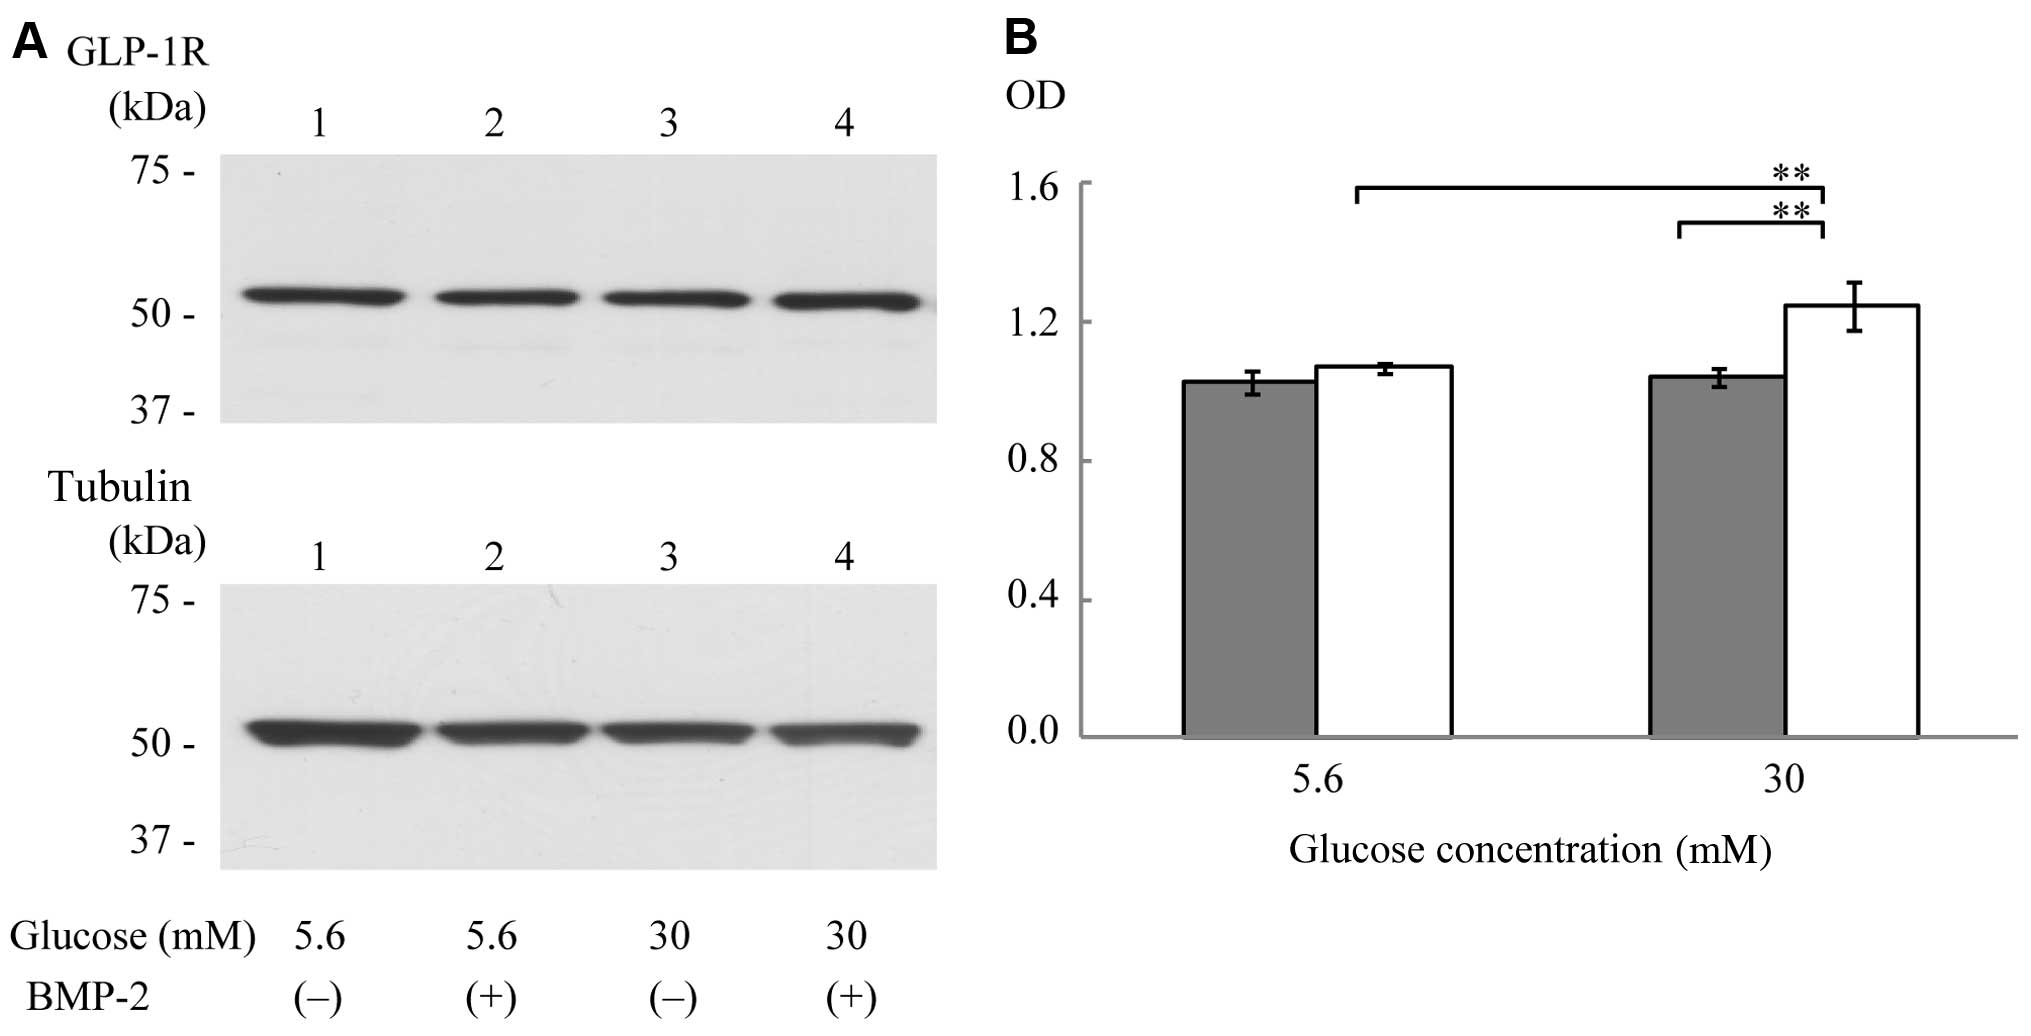
Western blot analysis
Western blot analysis was performed to determine the
protein expression levels of incretin receptors in MC3T3-E1 cells.
GLP-1R expression was determined in the total cell lysates using an
anti-GLP-1R antibody. GLP-1R expression appeared to be greater in
the cells cultured in 30 mM glucose with BMP-2 than in the cells
cultured in 5.6 mM glucose with or without BMP-2 (Fig. 4).
Immunofluorescence
Immunocytochemical analysis revealed a vesicular
staining pattern in the cytoplasm and cell surface, suggesting that
some cell compartments contained GLP-1R. The staining intensity was
slightly higher in the cells treated with 30 mM glucose in the
presence of BMP-2; however, the cellular distribution of GLP-1R was
not apparently affected by either glucose or BMP-2 (Fig. 5).
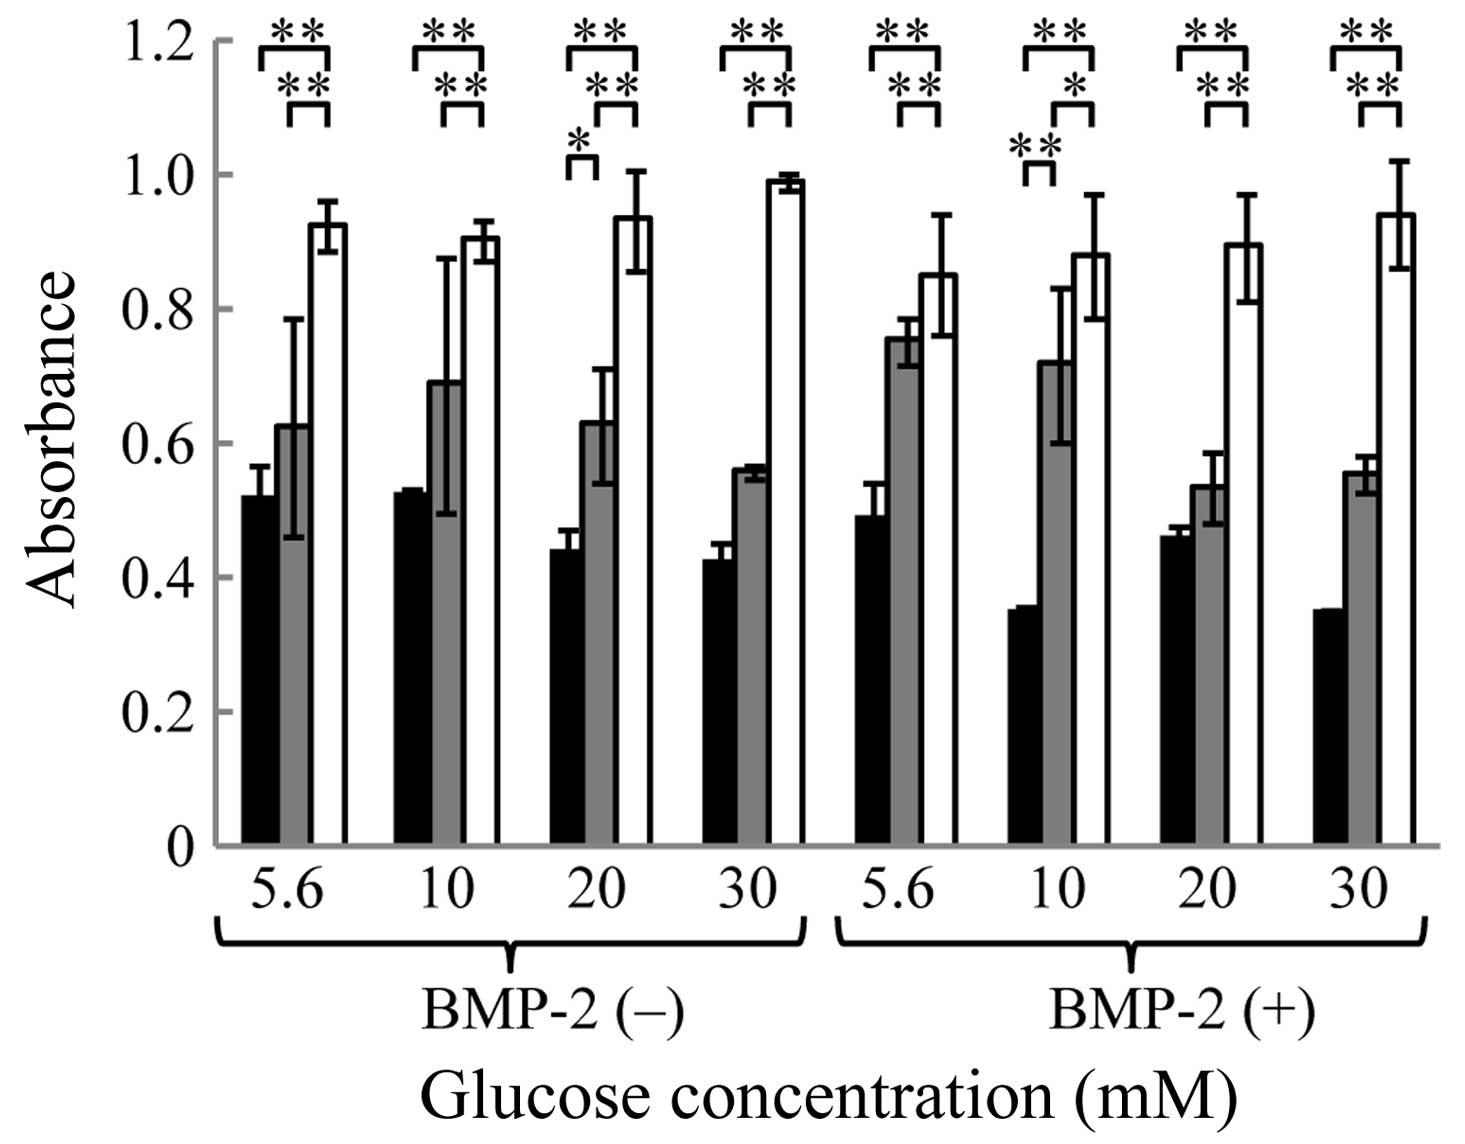
MTT assay
MTT assay revealed a time-dependent increase in the
number of cells in all groups analyzed. However, cell proliferation
was not affected by treatment with high glucose or BMP-2 (Fig. 6).
Discussion
The aim of this study was to determine whether
incretin receptors are expressed in osteoblasts and reveal the
correlation between glucose metabolism and bone metabolism.
Previous studies have demonstrated that GIPR is
expressed in osteoblastic cells (21); however, the presence of GLP-1R in
these cells still remains uncertain. Although osteoblastic cells
are thought to express a functional receptor for GLP-1 (27), there is no direct evidence to
confirm the mRNA and protein expression of GLP-1R in these cells.
It has been reported that GIP exerts direct effects on bone,
whereas the effects of GLP-1 on bone metabolism are mediated by the
thyroid hormone (20,28). Our RT-PCR analysis revealed that
the MC3T3-E1 cells expressed GLP-1R and GIPR, suggesting that GLP-1
may directly affect bone metabolism, similar to GIP.
In our study, at normal glucose concentrations (5.6
mM), the expression of both incretin receptors was very low and was
close to the lower limit of detection. However, treatment with 30
mM glucose increased the expression levels of GLP-1R and GIPR mRNA
by 4- and 9-fold, respectively. GLP-1R and GIPR knockout mice have
a higher risk of osteoporosis, suggesting that both receptors are
involved in bone metabolism (29). On the other hand, another study
revealed that treatment with a GLP-1R agonist may induce
polyarthritis in some patients with type 2 diabetes mellitus
(30). Thus, it is possible that
the optimal effects of incretins may be achieved at moderate
expression levels.
The glucose concentration is known to regulate many
cellular events, including cell apoptosis, proliferation and
differentiation. For example, it has been reported that incubation
in high glucose concentrations stimulates the apoptosis of neurons,
retinal pericytes and endothelial cells (31–33). However, high glucose does not
affect the proliferation of human mesenchymal stem cells (34). MTT assays in this study revealed
that treatment with high glucose did not affect the proliferation
of MC3T3-E1 cells, which suggests either that the proliferation of
osteoblasts is not affected by high glucose or that a longer
duration of exposure is necessary to influence proliferation
(35).
In our study, the expression of GLP-1R, but not
GIPR, increased in a time-dependent manner. Although both GLP-1R
and GIPR mediate insulin secretion from pancreatic β cells in
response to ligand binding, these receptors have the opposite
effects in other cell types. For example, GLP-1 has been shown to
inhibit glucagon secretion in pancreatic α cells in contrast to GIP
(36). Therefore, while GLP-1R
and GIPR are co-expressed in the same tissues, such as the
pancreas, they have different roles. Moreover, some tissues (e.g.,
kidneys and adipose tissue) express either GLP-1R or GIPR. Thus,
the different reactions of GLP-1R and GIPR to culture duration may
reflect the different roles of these receptors. Notably, glucose
metabolism seems to be altered after the loss of L cells, but is
not affected by the loss of K cells (37), which suggests that GLP-1 has a
greater effect on glucose metabolism than GIP.
BMP-2 stimulates bone formation and osteoblastic
differentiation. Runx2, an osteogenic master transcription factor,
is an important mediator of BMP-2 expression (38). Runx2 protein has been detected in
pre-osteoblasts, and its expression is upregulated in immature
osteoblasts, but downregulated in mature osteoblasts. Thus, the
MC3T3-E1 cells in this study were undergoing differentiation
induced by BMP-2.
GLP-1R and GIPR belong to the GPCR family, the
members of which are expressed in a variety of tissues and are
potential targets for drug discovery (39). It has been reported that the
administration of insulin and thiazolidinediones increases fracture
risk (40–42), whereas inhibitors of dipeptidyl
peptidase-4 (DPP-4) are associated with reduced fracture risk
(43). DPP-4 inactivates GLP-1
and its inhibitors improve glycemic control in patients with type 2
diabetes by preventing incretin degradation (44).
GLP-1 and GIP also reduce the expression of the
receptor of advanced glycation end products (AGE) in endothelial
and mesangial cells by increasing cAMP levels (45,46). Chronic hyperglycemia induces
non-enzymatic glycosylation and the transformation of various
proteins, particularly type I collagen, into AGE, leading to a
deterioration of bone mineralization and impaired biomechanical
properties of the skeleton. AGE can also affect bone metabolism by
inducing the expression of pro-inflammatory cytokines, such as
tumor necrosis factor, which promote bone resorption and inhibit
osteoblastic activity and maturation (8).
In conclusion, in the present study, we confirmed
that MC3T3-E1 cells express both GLP-1R and GIPR. To the best of
our knowledge, this is the first study to demonstrate that both
incretin receptors are expressed in the osteoblastic cell line. Our
results also suggest that GLP-1R expression is regulated by glucose
concentration, particularly in the presence of BMP-2, suggesting
that GLP-1R links bone metabolism and glucose metabolism in
osteoblasts, and that GLP-1 may have potential therapeutic
applications in bone diseases.
Acknowledgements
We would like to thank Associate Professor Yoshiyuki
Sasaki for providing his statistical expertise, Associate Professor
Tatsuo Terashima and Associate Professor Miki Yokoyama for their
helpful comments during the preparation of this manuscript. This
study was financially supported by Grants-in-Aid for Scientific
Research (23792421, 25463169) from the Ministry of Education,
Culture, Sports, Science and Technology of Japan.
References
|
1
|
Perry T and Greig NH: Enhancing central
nervous system endogenous GLP-1 receptor pathways for intervention
in Alzheimer’s disease. Curr Alzheimer Res. 2:377–385.
2005.PubMed/NCBI
|
|
2
|
Lavin JH, Wittert GA, Andrews J, et al:
Interaction of insulin, glucagon-like peptide 1, gastric inhibitory
polypeptide, and appetite in response to intraduodenal
carbohydrate. Am J Clin Nutr. 68:591–598. 1998.PubMed/NCBI
|
|
3
|
Nikolaidis LA, Elahi D, Hentosz T, et al:
Recombinant glucagon-like peptide-1 increases myocardial glucose
uptake and improves left ventricular performance in conscious dogs
with pacing-induced dilated cardiomyopathy. Circulation.
110:955–961. 2004. View Article : Google Scholar
|
|
4
|
Dupre J, Behme MT, Hramiak IM, et al:
Glucagon-like peptide I reduces postprandial glycemic excursions in
IDDM. Diabetes. 44:626–630. 1995. View Article : Google Scholar : PubMed/NCBI
|
|
5
|
Ding KH, Zhong Q, Xie D, et al: Effects of
glucose-dependent insulinotropic peptide on behavior. Peptides.
27:2750–2755. 2006. View Article : Google Scholar : PubMed/NCBI
|
|
6
|
Miyawaki K, Yamada Y, Ban N, et al:
Inhibition of gastric inhibitory polypeptide signaling prevents
obesity. Nat Med. 8:738–742. 2002. View
Article : Google Scholar : PubMed/NCBI
|
|
7
|
Gaudin-Audrain C, Irwin N, Mansur S, et
al: Glucose-dependent insulinotropic polypeptide receptor
deficiency leads to modifications of trabecular bone volume and
quality in mice. Bone. 53:221–230. 2013.PubMed/NCBI
|
|
8
|
Ceccarelli E, Guarino EG, Merlotti D, et
al: Beyond glycemic control in diabetes mellitus: effects of
incretin-based therapies on bone metabolism. Front Endocrinol
(Lausanne). 4:732013.PubMed/NCBI
|
|
9
|
Hansotia T and Drucker DJ: GIP and GLP-1
as incretin hormones: lessons from single and double incretin
receptor knockout mice. Regul Pept. 128:125–134. 2005. View Article : Google Scholar : PubMed/NCBI
|
|
10
|
Yip RG, Boylan MO, Kieffer TJ and Wolfe
MM: Functional GIP receptors are present on adipocytes.
Endocrinology. 139:4004–4007. 1998. View Article : Google Scholar : PubMed/NCBI
|
|
11
|
Seino Y, Fukushima M and Yabe D: GIP and
GLP-1, the two incretin hormones: similarities and differences. J
Diabetes Invest. 1:8–23. 2010. View Article : Google Scholar : PubMed/NCBI
|
|
12
|
Ferron M, Wei J, Yoshizawa T, et al:
Insulin signaling in osteoblasts integrates bone remodeling and
energy metabolism. Cell. 142:296–308. 2010. View Article : Google Scholar : PubMed/NCBI
|
|
13
|
Kamada A, Ikeo T, Yoshikawa Y, et al: Gene
expression of adipocytokine receptors during osteoblastic
differentiation. J Oral Tissue Eng. 7:53–60. 2009.
|
|
14
|
Huang CY, Lee CY, Chen MY, Tsai HC, Hsu HC
and Tang CH: Adiponectin increases BMP-2 expression in osteoblasts
via AdipoR receptor signaling pathway. J Cell Physiol. 224:475–483.
2010. View Article : Google Scholar : PubMed/NCBI
|
|
15
|
Prigeon RL, Quddusi S, Paty B and
D’Alessio DA: Suppression of glucose production by GLP-1
independent of islet hormones: a novel extrapancreatic effect. Am J
Physiol Endocrinol Metab. 285:E701–E707. 2003.PubMed/NCBI
|
|
16
|
Sancho V, Nuche B, Arnés L, et al: The
action of GLP-1 and exendins upon glucose transport in normal human
adipocytes, and on kinase activity as compared to morbidly obese
patients. Int J Mol Med. 19:961–966. 2007.PubMed/NCBI
|
|
17
|
Vella A, Shah P, Reed AS, Adkins AS, Basu
R and Rizza RA: Lack of effect of exendin-4 and glucagon-like
peptide-1-(7,36)-amide on insulin action in non-diabetic humans.
Diabetologia. 45:1410–1415. 2002.PubMed/NCBI
|
|
18
|
Egan JM, Meneilly GS, Habener JF and Elahi
D: Glucagon-like peptide-1 augments insulin-mediated glucose uptake
in the obese state. J Clin Endocrinol Metab. 87:3768–3773. 2002.
View Article : Google Scholar : PubMed/NCBI
|
|
19
|
Nuche-Berenguer B, Moreno P, Esbrit P, et
al: Effect of GLP-1 treatment on bone turnover in normal, type 2
diabetic, and insulin-resistant states. Calcif Tissue Int.
84:453–461. 2009. View Article : Google Scholar : PubMed/NCBI
|
|
20
|
Yamada C, Yamada Y, Tsukiyama K, et al:
The murine glucagon-like peptide-1 receptor is essential for
control of bone resorption. Endocrinology. 149:574–579. 2008.
View Article : Google Scholar : PubMed/NCBI
|
|
21
|
Bollag RJ, Zhong Q, Phillips P, et al:
Osteoblast-derived cells express functional glucose-dependent
insulinotropic peptide receptors. Endocrinology. 141:1228–1235.
2000.PubMed/NCBI
|
|
22
|
Zhong Q, Itokawa T, Sridhar S, et al:
Effects of glucose-dependent insulinotropic peptide on osteoclast
function. Am J Physiol Endocrinol Metab. 292:E543–E548. 2007.
View Article : Google Scholar : PubMed/NCBI
|
|
23
|
Xie D, Cheng H, Hamrick M, et al:
Glucose-dependent insulinotropic polypeptide receptor knockout mice
have altered bone turnover. Bone. 37:759–769. 2005. View Article : Google Scholar : PubMed/NCBI
|
|
24
|
Mieczkowska A, Irwin N, Flatt PR, Chappard
D and Mabilleau G: Glucose-dependent insulinotropic polypeptide
(GIP) receptor deletion leads to reduced bone strength and quality.
Bone. 56:337–342. 2013. View Article : Google Scholar : PubMed/NCBI
|
|
25
|
Noguchi H, Oishi K, Ueda M, et al:
Establishment of mouse pancreatic stem cell line. Cell Transplant.
18:563–571. 2009.PubMed/NCBI
|
|
26
|
Laemmli UK: Cleavage of structural
proteins during the assembly of the head of bacteriophage T4.
Nature. 227:680–685. 1970. View
Article : Google Scholar : PubMed/NCBI
|
|
27
|
Nuche-Berenguer B, Portal-Núñez S, Moreno
P, et al: Presence of a functional receptor for GLP-1 in
osteoblastic cells, independent of the cAMP-linked GLP-1 receptor.
J Cell Physiol. 225:585–592. 2010. View Article : Google Scholar : PubMed/NCBI
|
|
28
|
Lamari Y, Boissard C, Moukhtar MS,
Jullienne A, Rosselin G and Garel JM: Expression of glucagon-like
peptide 1 receptor in a murine C cell line: regulation of
calcitonin gene by glucagon-like peptide 1. FEBS Lett. 393:248–252.
1996. View Article : Google Scholar : PubMed/NCBI
|
|
29
|
Tsukiyama K, Yamada Y, Yamada C, et al:
Gastric inhibitory polypeptide as an endogenous factor promoting
new bone formation after food ingestion. Mol Endocrinol.
20:1644–1651. 2006. View Article : Google Scholar : PubMed/NCBI
|
|
30
|
Ambrosio ML, Monami M, Sati L, Marchionni
N, Di Bari M and Mannucci E: GLP-1 receptor agonist-induced
polyarthritis: a case report. Acta Diabetol. Oct 25–2013.(Epub
ahead of print).
|
|
31
|
Russell JW, Sullivan KA, Windebank AJ,
Herrmann DN and Feldman EL: Neurons undergo apoptosis in animal and
cell culture models of diabetes. Neurobiol Dis. 6:347–363. 1999.
View Article : Google Scholar : PubMed/NCBI
|
|
32
|
Romeo G, Liu WH, Asnaghi V, Kern TS and
Lorenzi M: Activation of nuclear factor-kappaB induced by diabetes
and high glucose regulates a proapoptotic program in retinal
pericytes. Diabetes. 51:2241–2248. 2002. View Article : Google Scholar : PubMed/NCBI
|
|
33
|
Piconi L, Quagliaro L, Assaloni R, et al:
Constant and intermittent high glucose enhances endothelial cell
apoptosis through mitochondrial superoxide overproduction. Diabetes
Metab Res Rev. 22:198–203. 2006. View
Article : Google Scholar : PubMed/NCBI
|
|
34
|
Weil BR, Abarbanell AM, Herrmann JL, Wang
Y and Meldrum DR: High glucose concentration in cell culture medium
does not acutely affect human mesenchymal stem cell growth factor
production or proliferation. Am J Physiol Regul Integr Comp
Physiol. 296:R1735–R1743. 2009. View Article : Google Scholar : PubMed/NCBI
|
|
35
|
Balint E, Szabo P, Marshall CF and Sprague
SM: Glucose-induced inhibition of in vitro bone mineralization.
Bone. 28:21–28. 2001. View Article : Google Scholar : PubMed/NCBI
|
|
36
|
Yabe D and Seino Y: Two incretin hormones
GLP-1 and GIP: comparison of their actions in insulin secretion and
β cell preservation. Prog Biophys Mol Biol. 107:248–256. 2011.
|
|
37
|
Pedersen J, Ugleholdt RK, Jørgensen SM, et
al: Glucose metabolism is altered after loss of L cells and
alpha-cells but not influenced by loss of K cells. Am J Physiol
Endocrinol Metab. 304:E60–E73. 2013. View Article : Google Scholar : PubMed/NCBI
|
|
38
|
Choi KY, Kim HJ, Lee MH, et al: Runx2
regulates FGF2-induced Bmp2 expression during cranial bone
development. Dev Dyn. 233:115–121. 2005. View Article : Google Scholar : PubMed/NCBI
|
|
39
|
Gigoux V and Fourmy D: Acting on hormone
receptors with minimal side effect on cell proliferation: A timely
challenge illustrated with GLP-1R and GPER. Front Endocrinol
(Lausanne). 4:502013.PubMed/NCBI
|
|
40
|
Monami M, Cresci B, Colombini A, et al:
Bone fractures and hypoglycemic treatment in type 2 diabetic
patients: a case-control study. Diabetes Care. 31:199–203. 2008.
View Article : Google Scholar : PubMed/NCBI
|
|
41
|
Meier C, Kraenzlin ME, Bodmer M, Jick SS,
Jick H and Meier CR: Use of thiazolidinediones and fracture risk.
Arch Intern Med. 168:820–825. 2008. View Article : Google Scholar : PubMed/NCBI
|
|
42
|
Bazelier MT, Gallagher AM, van Staa TP, et
al: Use of thiazolidinediones and risk of osteoporotic fracture:
disease or drugs? Pharmacoepidemiol Drug Saf. 21:507–514. 2012.
View Article : Google Scholar : PubMed/NCBI
|
|
43
|
Monami M, Dicembrini I, Antenore A and
Mannucci E: Dipeptidyl peptidase-4 inhibitors and bone fractures: a
meta-analysis of randomized clinical trials. Diabetes Care.
34:2474–2476. 2011. View Article : Google Scholar
|
|
44
|
Drucker DJ and Nauck MA: The incretin
system: glucagon-like peptide-1 receptor agonists and dipeptidase-4
inhibitors in type 2 diabetes. Lancet. 368:1696–1705. 2006.
View Article : Google Scholar : PubMed/NCBI
|
|
45
|
Tahara N, Yamagishi S, Takeuchi M, et al:
Serum levels of advanced glycation end products (AGEs) are
independently correlated with circulating levels of dipeptidyl
peptidase-4 (DPP-4) in humans. Clin Biochem. 46:300–303. 2013.
View Article : Google Scholar : PubMed/NCBI
|
|
46
|
Yamagishi S and Matsui T: Pleiotropic
effects of glucagon-like peptide-1 (GLP-1)-based therapies on
vascular complications in diabetes. Curr Pharm Des. 17:4379–4385.
2011. View Article : Google Scholar : PubMed/NCBI
|