Introduction
Breast cancer (BC) is considered as a leading cause
of cancer-related mortality in females, with 232,340 estimated new
female cases (~29% of 10 leading cancer types) diagnosed in 2013
(1). Since BC is recognized as a
molecularly heterogeneous disease, it is essential to classify the
disease into subtypes which are distinguished by pervasive
differences in gene expression patterns. Molecular subtypes in BC
were first mentioned by Sorlie et al (2). The phenotypic diversity observed in
BC was mapped to a specific gene expression pattern. Based on the
unsupervised hierarchical clustering and microarray results, BC was
divided into the luminal A, luminal B, ERBB2-associated,
basal-like and normal-like subtypes (3). Among these, the luminal A and
luminal B subtypes both belong to the luminal subtype, which is the
most common subtype (up to 65–70% of female BC cases) (2). Between the 2 subtypes, the luminal B
subytpe is characterized as estrogen receptor (ER)/progesterone
receptor (PR)-positive and human epidermal growth factor receptor 2
(HER2)-positive (ER+/PR+,
HER2+), with intermediate expression level of genes in
epithelial cells, including ER, GATA binding protein 3
(GATA3), X-box binding protein (XBP), trefoil factor
3 (TF3), hepatocyte nuclear factor 3α (HNF3α) and
estrogen-regulated protein (LIV-1) (4,5).
The different characteristics between the luminal A and B subtypes
are that HER2 is expressed in the latter subtype, and the
latter subtype is also characterized by a high expression of
gamma-glutamyl hydrolase (GGH), lysosome-associated
transmembrane protein 4 beta (LAPTMB4), nuclease sensitive
element binding protein 1 (NSEP1) and cyclin E1
(CCNE1). More accurately, the expression of Ki67 is above
14% in the luminal B subtype. Apparent differences in prognosis and
response to chemotherapy with respect to the subtypes have been
reported in specific patient cohorts (1,2,6).
The 3′ untranslated region (3′UTR) is the section of
messenger RNA (mRNA) that immediately follows the translation
termination codon and usually is not translated into protein.
Through the alternative polyadenylation [poly(A)] (APA) progress,
several mRNA isoforms can be produced with variable lengths of
3′UTRs (termed tandem 3′UTRs). The known regulatory role of tandem
3′UTRs is mainly observed in gene expression networks, whereby they
influence mRNA stability, transport and translation, generally
through the loss and gain of regulatory motifs, such as AU-rich
elements (AREs), GU-rich elements and microRNA-binding sites
(7–9). While in the human genome, APA
phenomena are rather common since more than half of the genes have
APA sites (10). Currently there
are several methods based on high-throughput sequencing to profile
APA sites at the whole-transcriptome level, including RNA-Seq,
poly(A) capture, 3P-Seq, sequencing APA sites (SAPAS), direct RNA
sequencing (DRS) and poly(A)-tail length profiling by sequencing
(PAL-seq) (11–17). Among these, SAPAS provides an
unbiased framework for analyzing 3′UTR switching in APA profiling
data (18).
In this study, we applied the SAPAS method to
generate a comprehensive and high-resolution map of APA sites of
human transcripts in one patient diagnosed with the luminal B
subtype of BC. Through bioinformatics analysis, we found 153 genes
with differential usage of tandem 3′UTRs, which were enriched
mainly in focal adhesion and spliceosome pathways and the Wnt
receptor signaling pathway, negative regulation of cellular
macromolecule biosynthetic process, negative regulation of
transcription process and negative regulation of signal
transduction process. Moreover, 1,296 differentially expressed
genes (DEGs) were discovered to be related in the process of
response to endogenous stimuli, response to nutrient levels, cell
cycle and cellular chemical homeostasis. Using RT-qPCR approaches,
we validated our findings and demonstrated the utilization of the
approach to identify APA events. We identifed a number of
unannotated poly(A) sites and DEGs to elucidate the possible roles
for 3′UTRs in the development of BC and to suggest potential future
applications of 3′UTRs in the diagnosis and therapy of BC.
Materials and methods
Sample information
The mammary normal and cancerous tissues of 9
patients diagnosed with luminal B type BC were obtained through
mammary cancer radical operation from the Central Hospital of Zibo,
Zibo, China. The normal tissues were mammary cancer-adjacent
tissues with no cancer lesions, as shown by a pathological
examination. Informed written consent was provided by all patients.
Immunohistochemical analysis was performed on paraffin-embedded
sections, including markers for ER, PR, HER2/neu (c-erbB-2) and
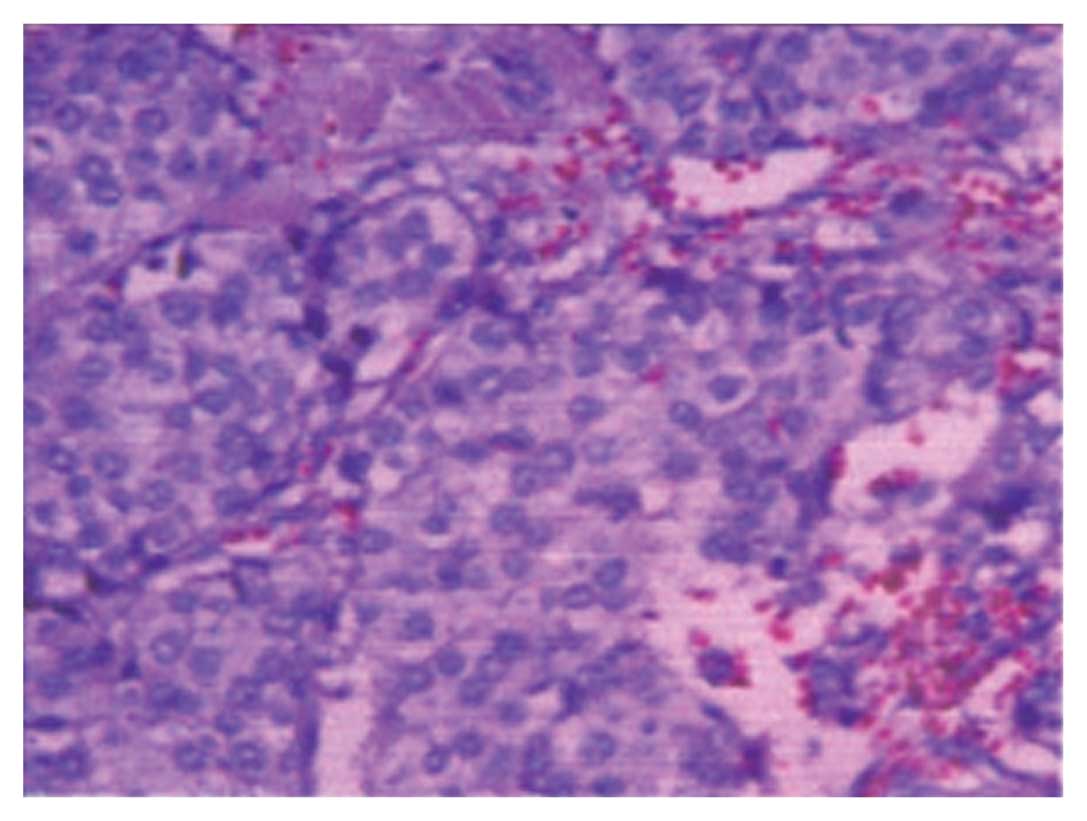
Ki-67. The one patient we selected for SAPAS sequencing was 29
years old and was ER+++, PR+,
c-erbB-2++ with a Ki-67 expression of 15%. The tumor
size was 4.2×3.5×2.5 cm. According to the above data and
histological appearance (Fig. 1),
the patient was diagnosed with stage II luminal B type invasive
breast ductal carcinoma with focal necrosis and calcification. The
detailed immunohistochemical and clinical data of the 9 patients
are presented in Table I. This
study was approved by the Medicine Ethics Committee of the Central
Hospital of Zibo. Informed consent for obtaining the tissue
specimens was obtained from all 9 patients.
 | Table IClinical and immunohistochemical
characteristics of the 9 patients with luminal B type BC. |
Table I
Clinical and immunohistochemical
characteristics of the 9 patients with luminal B type BC.
| Case | Age (years) | ER | PR | c-erbB-2 | Ki-67 (%) | Stage |
|---|
| Case 0a | 29 | +++ | + | ++ | 15 | II |
| Case 1b | 36 | + | + | +++ | 60 | II–III |
| Case 2b | 58 | + | − | ++ | 40 | III |
| Case 3b | 50 | ++ | + | ++ | 70 | I |
| Case 4b | 30 | + | + | +++ | 30 | III |
| Case 5b | 44 | ++ | ++ | 0 | 55 | II–III |
| Case 6b | 46 | ++ | +++ | + | 20 | II–III |
| Case 7b | 41 | + | + | +++ | 80 | III |
| Case 8b | 47 | + | +++ | +++ | 25 | III |
RNA extraction
Total RNA of the 18 tissues (normal and cancerous
from the 9 patients) was extracted using TRIzol reagent
(Invitrogen, Carlsbad, CA, USA) according to the manufacturer’s
instructions. A NanoDrop 1000 spectrophotometer (NanoDrop
Technologies, Wilmington, DE, USA) and agarose gel electrophoresis
were used to detect the amount and quality of the total RNA. RNA
purity was assessed by the ratio of absorbance at 260 and 280 nm
(A260/A280).
In vitro transcription-sequencing of APA
sites (IVT-SAPAS) library preparation and sequencing
Two libraries from one patient were constructed with
the improved method known as IVT-SAPAS as previously described
(1). The advantages of IVT-SAPAS
are as follows: Firstly, the quantity of the total RNA was reduced
from 10 μg to 750 ng, and secondly, using the in vitro
transcription method, large amounts of RNA were produced from cDNA
templates. This improved method is extremely useful when samples
are limited. The libraries were then sequenced from the 3′ end with
Illumina GAIIx (Illumina Inc., San Diego, CA, USA).
Raw data analysis
The image files produced by the SAPAS method were
transferred into FastQ files through Off-Line Base Caller version
1.9 (Illumina Inc.). The base quality of the raw data for each
sample was estimated using FastQC version 0.10.1 (Babraham
Institute, Cambridge, UK). Perl scripts were programmed to perform
the filtering and trimming of all the reads. Reads with low quality
and polyNT (polyNT defined as the fragments with a series of single
bases, particularly T) were filtered and the linker
5′-TTTTCTTTTTTCTTTTTT-3′ on the 5′ end of the reads was trimmed.
Subsequently, only the long reads (≥25 nt) were obtained. These
remaining reads were mapped to the human genome (hg19; downloaded
from UCSC genome bioinformatics) (19) (maintained by the University of
California Santa Cruz, Santa Cruz, CA, USA) through Bowtie (version
0.12.7; parameters: -v 2 -k 2 -best -q) (20) with bowtie-indexes downloaded from
the Center for Bioinformatics and Computational Biology. The
uniquely mapped reads were selected to filter reads with internal
priming, which refer to the reads mapped to the region within 20
bases downstream of poly(A) cleavage sites containing 12 ‘A’,
5′-AAAAAAAA-3′ or 5′-GAAAA+GAAA+G-3′. These were regarded as
disruption sequences since they can bind to primers with their
A-rich genomic regions, while not with the poly(A) tail. Perl
scripts were used for statistical analysis prior to and following
raw data analysis.
Poly(A) site annotation
According to Tian et al (10), all the reads of the 2 samples
after internal priming were iteratively clustered as poly(A)
cleavage sites. These poly(A) cleavage sites that are located next
to each other within 24 nt were further clustered as cleavage
clusters. Each cleavage cluster with more than one read was
assigned as a poly(A) site. In order to annotate the poly(A) sites,
a dataset of all known 3′UTR regions was extracted from the Known
Genes database of the UCSC table browser, the detailed procedures
were as in the study by Tian et al (21), except that the non-coding gene
items were kept. With UCSC Known Genes (19) and polyA_DB2 (22), all the poly(A) sites were
annotated as known and novel sites. The annotation procedure was
the same as in the study by Sun et al (23). On the basis of their locations on
the genome, all the novel sites were classified as ≤1 knt
downstream, 3′UTRs, coding DNA sequences, intergenic sequences,
introns and non-coding genes. The poly(A) sites number was
calculated.
Tandem 3′UTR analysis
The tandem poly(A) site was defined with the same
conditions as in the study by Tian et al (21). The poly(A) sites that overlapped
with multiple known 3′UTR regions were not taken into
consideration. Thus, genes containing more than one tandem poly(A)
site were regarded as genes with tandem 3′UTR. Subsequently, a
statistical analysis of tandem APA switch events of these genes,
which were expressed in both of the 2 samples, was performed using
the linear trend test method. Briefly, the 3′UTR length for each
tandem poly(A) site was calculated. A column chain table was then
generated as in the study by Sun et al (23). Pearson’s correlation co-efficient
r, which was in short for tandem APA sites switch index (TSI), was
then calculated. The χ2 distribution with one degree of
freedom was calculated using the following formula:
M2=(n−1)r2. The P-value was then calculated,
as was the corresponding false discovery rates (FDRs) rectified by
the Benjamini-Hochberg method.
Furthermore, tandem 3′UTR length switching with a
FDR cut-off of 1% was considered to be significantly different
between the 2 samples. A positive r value indicates a longer tandem
3′UTR in cancer tissue and vice versa. More stringently,
genes with r<−0.1 and FDR <0.01 were considered as shortened
3′UTR genes, while genes with r>0.1 and FDR <0.01 were
regarded as lengthened 3′UTR genes. R software was used to generate
a scatter plot illustrating the correlation between them, and the
relevant co-efficient was calculated. The number of these 2 types
of tandem 3′UTR genes was calculated separately and the
χ2 test was performed.
Analysis of DEGs
In addition to test tandem APA switch events, SAPAS
can also identify gene expression profiles. Since SAPAS only
sequenced the 3′UTRs of mRNAs, the length of each gene could be
disregarded when estimating the gene expression level. Thus, the
expression level of a gene could be represented by the read number
mapped to the corresponding region on the genome. The expression
difference of each gene between the 2 samples was assessed by
Fisher’s exact test. The P-value was then adjusted through the
Benjamini-Hochberg method. Genes with a FDR <0.01 were
considered to be DEGs.
Functional annotation and enrichment
analysis
DAVID Bioinformatics Resources 6.7 (24) was used to perform functional
annotation and enrichment of the tandem 3′UTR genes and the DEGs
separately. Significantly enriched biological process (BP) gene
ontology (GO) terms and pathways against a background model of all
human transcripts were selected.
Validation by RT-qPCR analysis
Six genes with switched APA sites [collagen, type I,
alpha 2 (COL1A2), DEAD (Asp-Glu-Ala-Asp) box helicase 5
(DDX5), small nuclear ribonucleoprotein 200 kDa (U5)
(SNRNP200), catenin, beta interacting protein 1
(CTNNBIP1), dishevelled segment polarity protein 3
(DVL3) and protein phosphatase,
Mg2+/Mn2+ dependent, 1A (PPM1A)] and 5
differentially expressed genes [matrix Gla protein (MGP),
transforming growth factor β receptor III (TGFBR3),
insulin-like growth factor 2 (IGF2), calcipressin 1
(RCAN1) and cyclin D1 (CCND1)] were subjected to
RT-qPCR to validate the sequencing data (Table II). Total RNA was isolated using
TRIzol reagent (Invitrogen) according to the manufacturer’s
instructions. For each sample, 1,000 ng of total RNA was then used
in reverse transcription reactions using random hexamers and
SuperScript® II Reverse Transcriptase (Invitrogen). For
each gene, two gene-specific primer sets were designed according to
Tian et al (21). RT-qPCR
was performed using the LightCycler 480 Instrument (Roche
Biochemicals, Indianapolis, IN, USA) according to the
manufacturer’s instructions. The expression ratios of the shortened
region to the lengthened region (cUTR/eUTR, cUTR stands for
constitutive UTR, while eUTR stands for extended UTR) were
maintained through calculating ΔΔCt values for each gene by
normalizing the extended set against the constitutive one.
Significantly differential usage of poly(A) sites of genes between
samples was detected by the Student’s t-test at a significance
level of 0.05. For differentially expressed genes, the relative
quantification method was used to measure the levels of the genes
in the cancer tissue. GAPDH was used as an endogenous
control.
| Table IIPrimers used in RT-qPCR. |
Table II
Primers used in RT-qPCR.
| Genes | Forward primer | Reverse primer |
|---|
| RT-qPCR primers for
genes with switched APA sites |
|
COL1A2-S |
ATCTACTTGCTTAAATTGTGGGC |
GGTTGACATTTTCCATAACAGGT |
|
COL1A2-L |
GCCAGTCTCATTTTCATCTTCTT |
ATGCTTTATTTCATTTTTTTCACAA |
| DDX5-S |
ACATAAAGCAAGTGAGCGACC |
CCTCTACCCCTGGAACGAC |
| DDX5-L |
CTTTCGGGGGAGAGGGTA |
CAGGCTGGACACAACACACAT |
|
SNRNP200-S |
TTTTGGGTAAAGGAGAGTTGAGC |
AAGGGAAAGGAAGTGGAGGTAG |
|
SNRNP200-L |
ACTACCACAAGAACCAACACTGAG |
GGGTCACATCCAGCTAGTACATTT |
|
CTNNBIP1-S |
ACTCAGTGGGGCTGGCAT |
AAGGTTTCTGTTGGTCAAGATTTA |
|
CTNNBIP1-L |
GCCCCCTCTTTGTAGCTCCT |
CAGCAACACTTTGACTTTTCCTCT |
| PPM1A-S |
TGTGTTTGGACTTGGGGTT |
AGTTAAATGAAGGGACTGGCT |
| PPM1A-L |
CAACCACCACCAATGCACA |
TAGTCAAGGGATAACCAGGTAAGA |
| DVL3-S |
TGTGGATGTGATGTGAGCAGG |
GACAAAGTAAAAAAGACGGACGG |
| DVL3-L |
GTAGTCGCCTCCAATAGCCAT |
GGTTAGTAGGGTTAGGGGTCTGAA |
| RT-qPCR primers for
differentially expressed genes |
| MGP |
CCTTCATATCCCCTCAGCAGA |
GCAGCATTGTATCCATAAACCA |
| TGFBR3 |
CCTTGGGGACAGTAGTGGTTG |
GTGATGTTTCCGTGGGGCT |
| IGF2 |
CATCGTTGAGGAGTGCTGTTTC |
ACTGCTTCCAGGTGTCATATTG |
| RCAN1 |
GATGCGACCCCAGTCATAAAC |
TTCCTCTTCTTCCTCCTTCTCT |
| CCND1 |
GCATCTACACCGACAACTCCA |
TTGTTCTCCTCCGCCTCTG |
Results
Sample infomation and sequencing
procedure
Total RNA (36.8 and 38.2 μg) was extracted from the
normal and cancerous tissue. The OD260/280 value of both samples
detected by NanoDrop was 1.88, and the RNA integrity from agarose
gel electrophoresis revealed that the total RNA qualified for
subsequent procedure. After library construction, the results of
Agilent Bioanalyzer 2100 (Agilent Technologies Inc., Santa Clara,
CA, USA) revealed that the length of the 2 libraries was
approximately 370 bp, located in the normal range of 200–600 bp.
All these data showed that the total RNA was properly extracted
from the 2 samples and the libraries were regularly
constructed.
Sequencing and data filtering
The 2 libraries were sequenced through the Illumina
Genome Analyzer IIx platform. The raw sequencing data were uploaded
to the Sequence Read Archive (SRA) database at the National Center
for Biotechnology Information (NCBI) and are accessible using the
NCBI accession no. SRP041304. In total, 27.4 and 26.6 million raw
reads were obtained for the 2 samples (normal and cancerous,
respectively). After filtering and trimming, almost 27.3 and 26.5
million reads (99.6%) were remaining. Subsequently, nearly 25.1 and
24.5 million (92.0%) reads were mapped to the human nuclear genome
(hg19). Among these, approximately 18.9 million (69.1%) and 18.0
million (67.8%) reads were uniquely mapped. The internal priming
reads were then filtered, and 11.5 million (41.8%) and 10.9 million
(40.8%) reads could be used to infer transcript cleavage sites and
annotate poly(A) sites.
Poly(A) sites annotation and tandem 3′UTR
analysis
In conclusion, 18,078 UCSC canonical genes with at
least one read, which accounted for 66.2% of all canonical genes,
were sequenced. The poly(A) sites of 18,448 and 18,970 genes
(Table III) were annotated in
the normal and cancerous tissue samples. Subsequently, after
filtering the poly(A) sites supported with only one read, 16,880
and 17,432 genes with poly(A) sites were obtained for the normal
and cancerous tissue, respectively. In all, nearly 78.9% reads were
mapped to the region within 24 nt of the known poly(A) sites. This
implied that most of the filtered reads produced by this study were
mapped to known poly(A) sites in the UCSC transcript ends database
and Tian’s database (10).
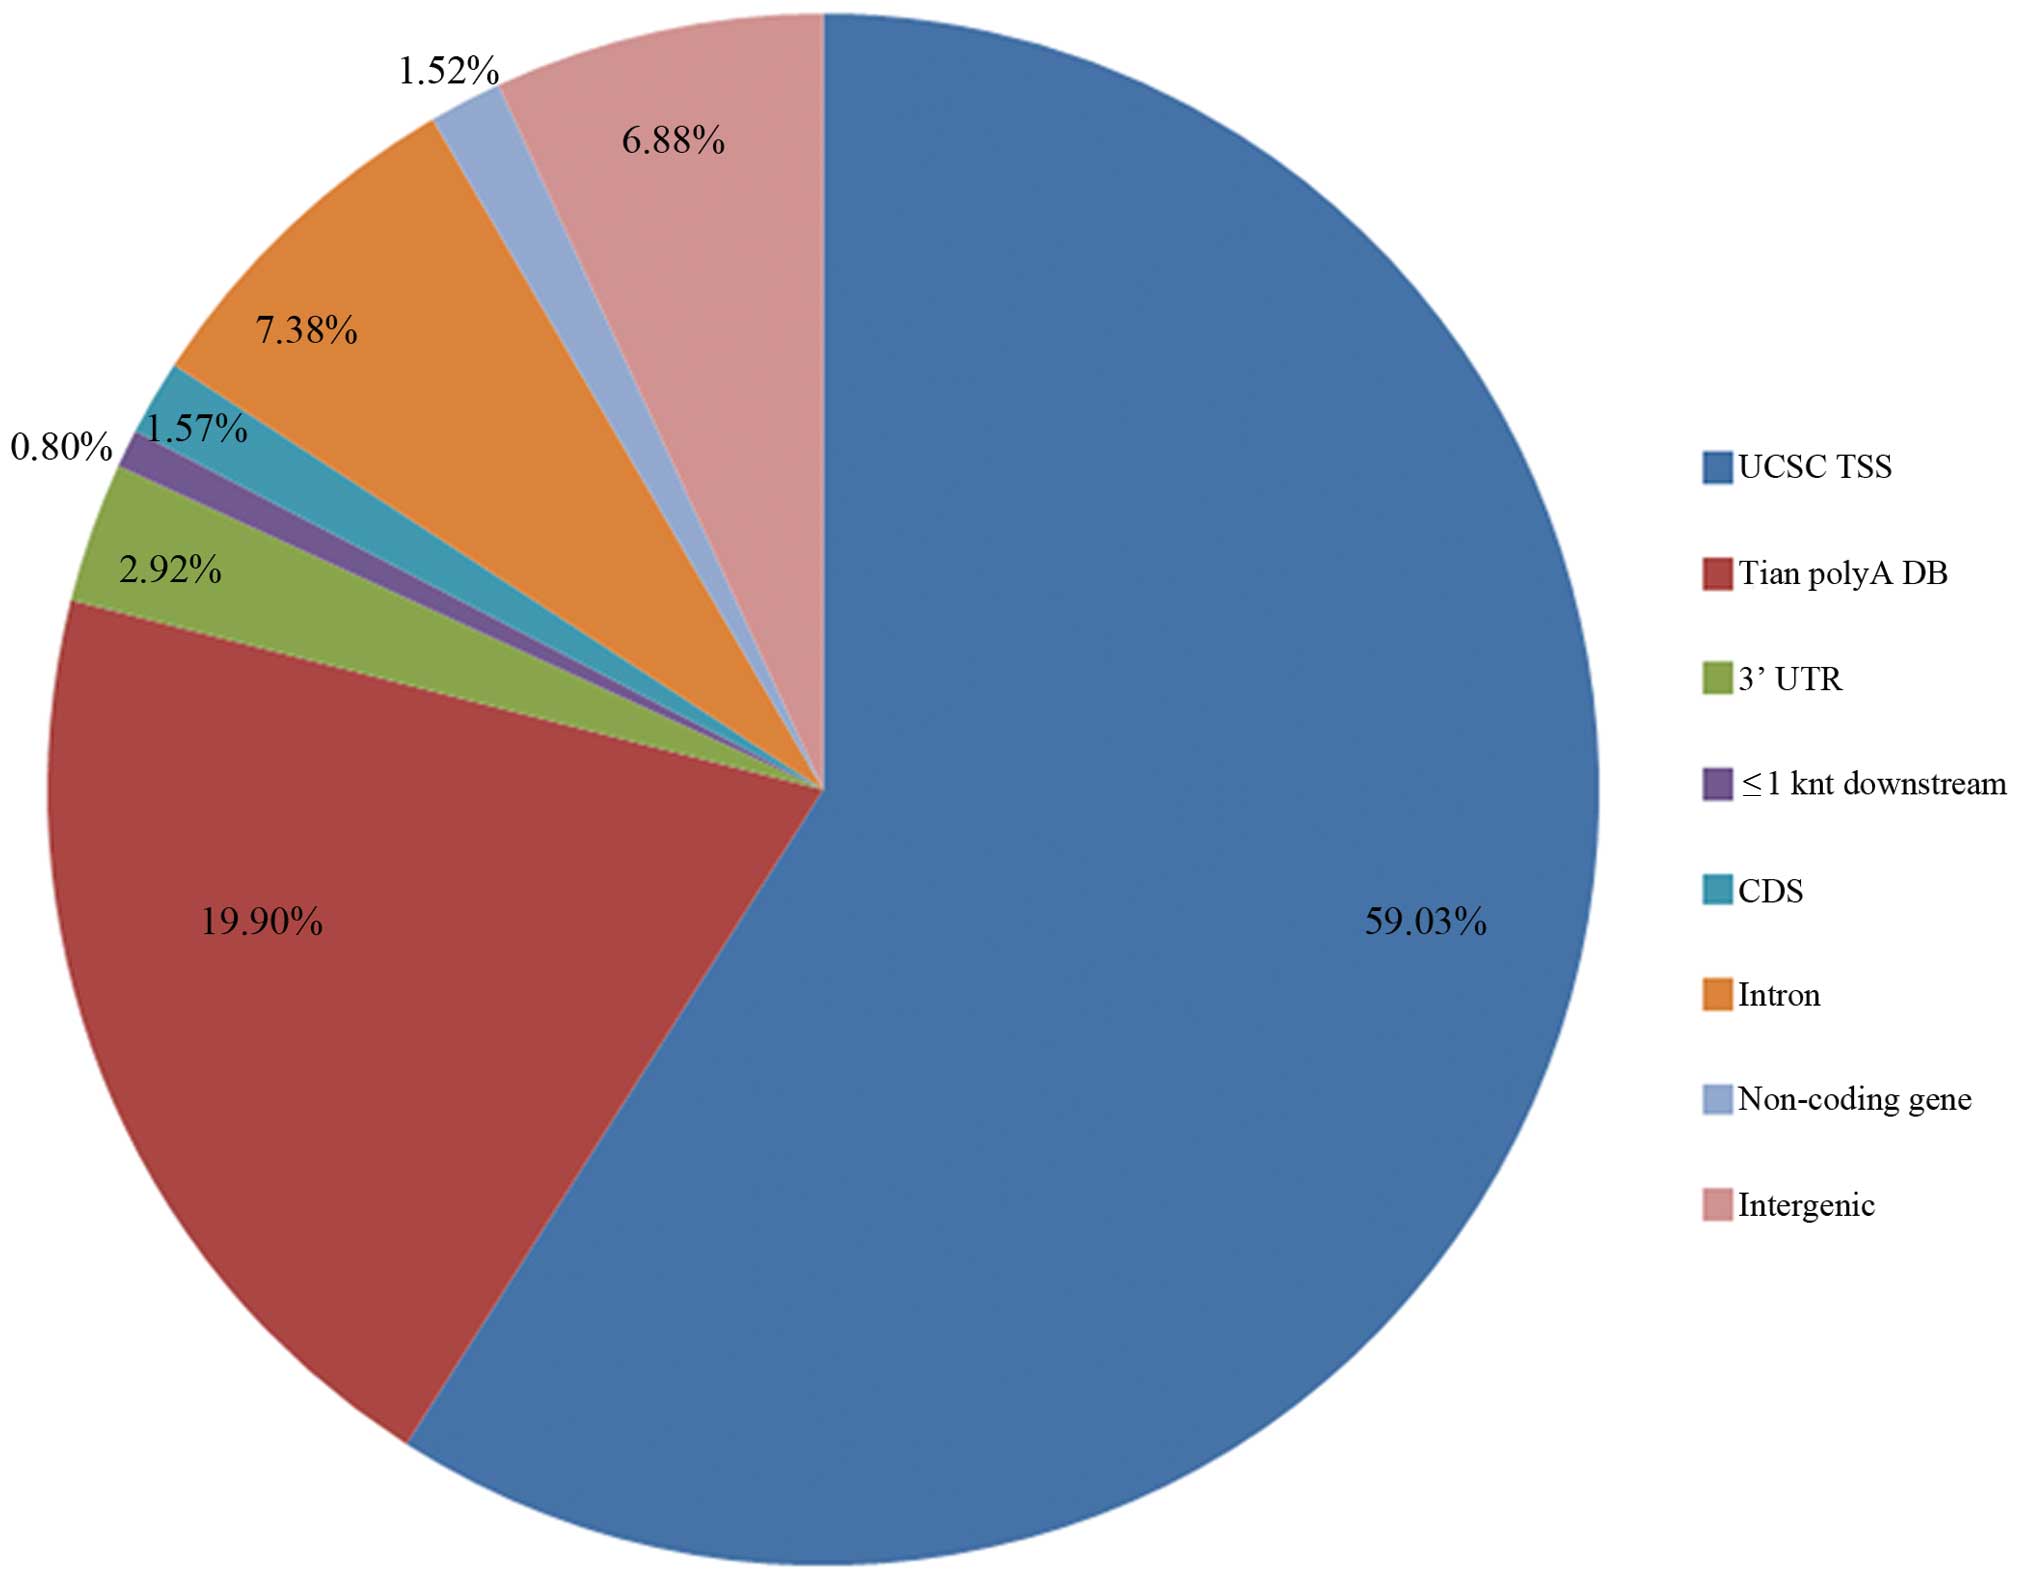
Furthermore, 2.9 and 0.8% of the reads mapped to the 3′UTR region
of UCSC canonical gene and 1 kb downstream of the end of the genes
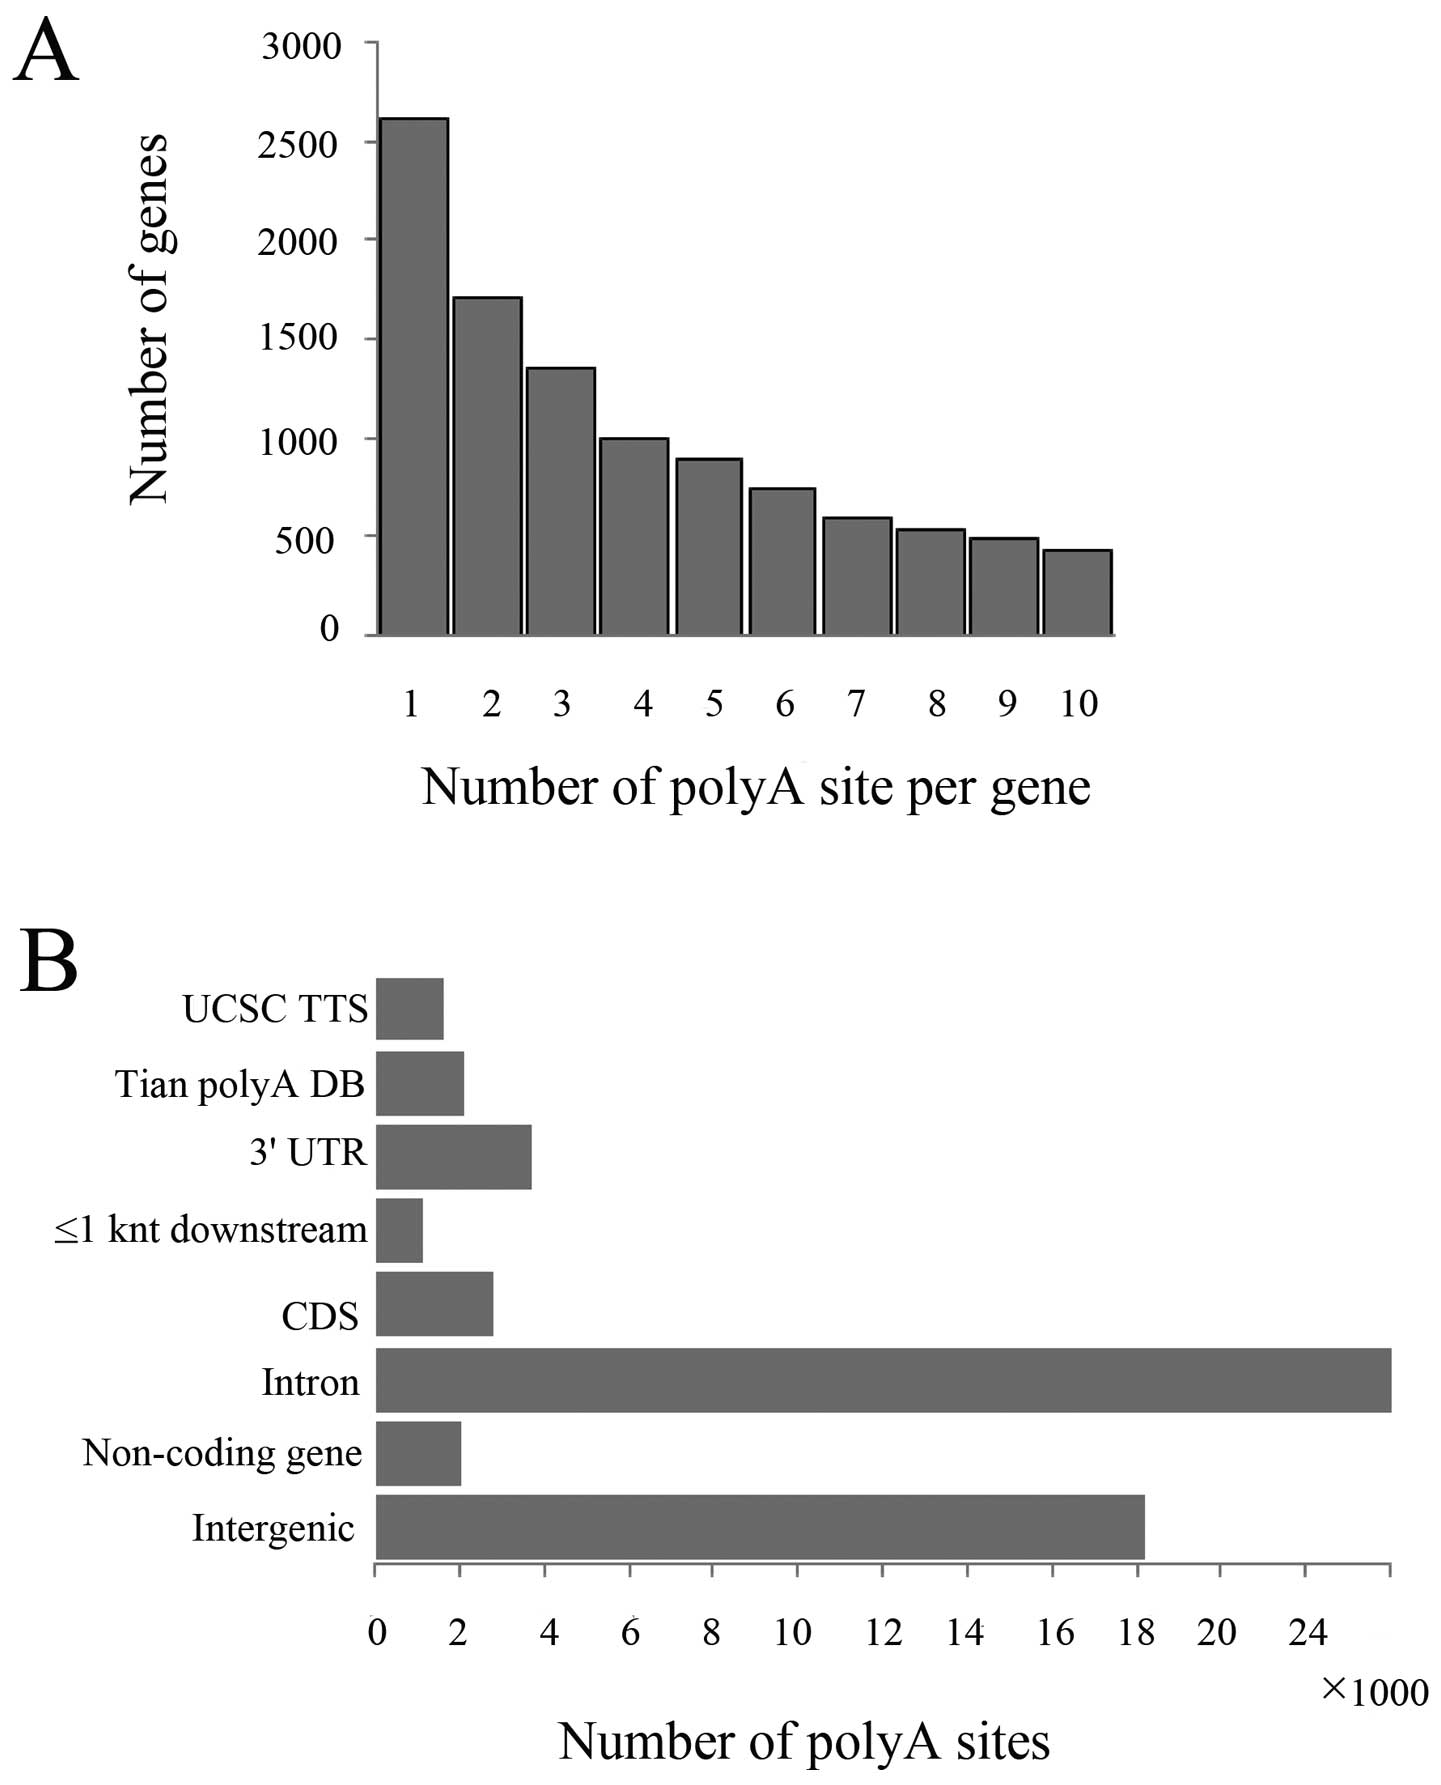
(Fig. 2). In addition, in the
normal tissue, 16,356 genes (86.2%) were annotated with more than
one poly(A) site, while 14,641 genes (77.2%) were annotated with
more than 2 poly(A) sites. The distribution of gene number with
1–10 poly(A) sites per gene is shown in Fig. 3A. Among the 206,585 annotated
poly(A) sites in the normal tissue, 5.71% of the sites were
recorded in the UCSC transcript ends database and polyA_DB2
database and another 51.62, 5.62 and 4.28% of the poly(A) sites in
the introns, 3′UTRs and coding sequences (CDSs) from the UCSC
canonical genes, respectively. This indicates that a large number
of novel poly(A) sites are detected in the mRNAs through the SAPAS
method, particularly in lowly expressed mRNAs (Fig. 3B).
| Table IIISummary statistics of SAPAS data from
Illumina GAIIx sequencing. |
Table III
Summary statistics of SAPAS data from
Illumina GAIIx sequencing.
| s1 | s2 |
|---|
| Raw reads | 27,392,854 | 26,620,195 |
| Clean reads, n
(%) | 27,277,251
(99.6) | 26,510,992
(99.6) |
| Mapped to genome, n
(%) | 25,188,415
(92.0) | 24,492,603
(92.0) |
| Uniquely mapped to
genome, n (%) | 18,928,605
(69.1) | 18,042,088
(67.8) |
| Mapped to nuclear
genome, n (%) | 16,684,903
(60.9) | 15,181,455
(57.0) |
| Passed internal
priming filter, n (%) | 11,452,320
(41.8) | 10,866,946
(40.8) |
| Genes sampled by
reads | 18,448 | 18,970 |
| Poly(A) sites | 206,585 | 263,911 |
| Known poly(A)
sites sampled | 28,651 | 29,338 |
| Putative novel
poly(A) sites | 177,934 | 234,573 |
| Genes sampled by
poly(A) sites | 16,880 | 17,432 |
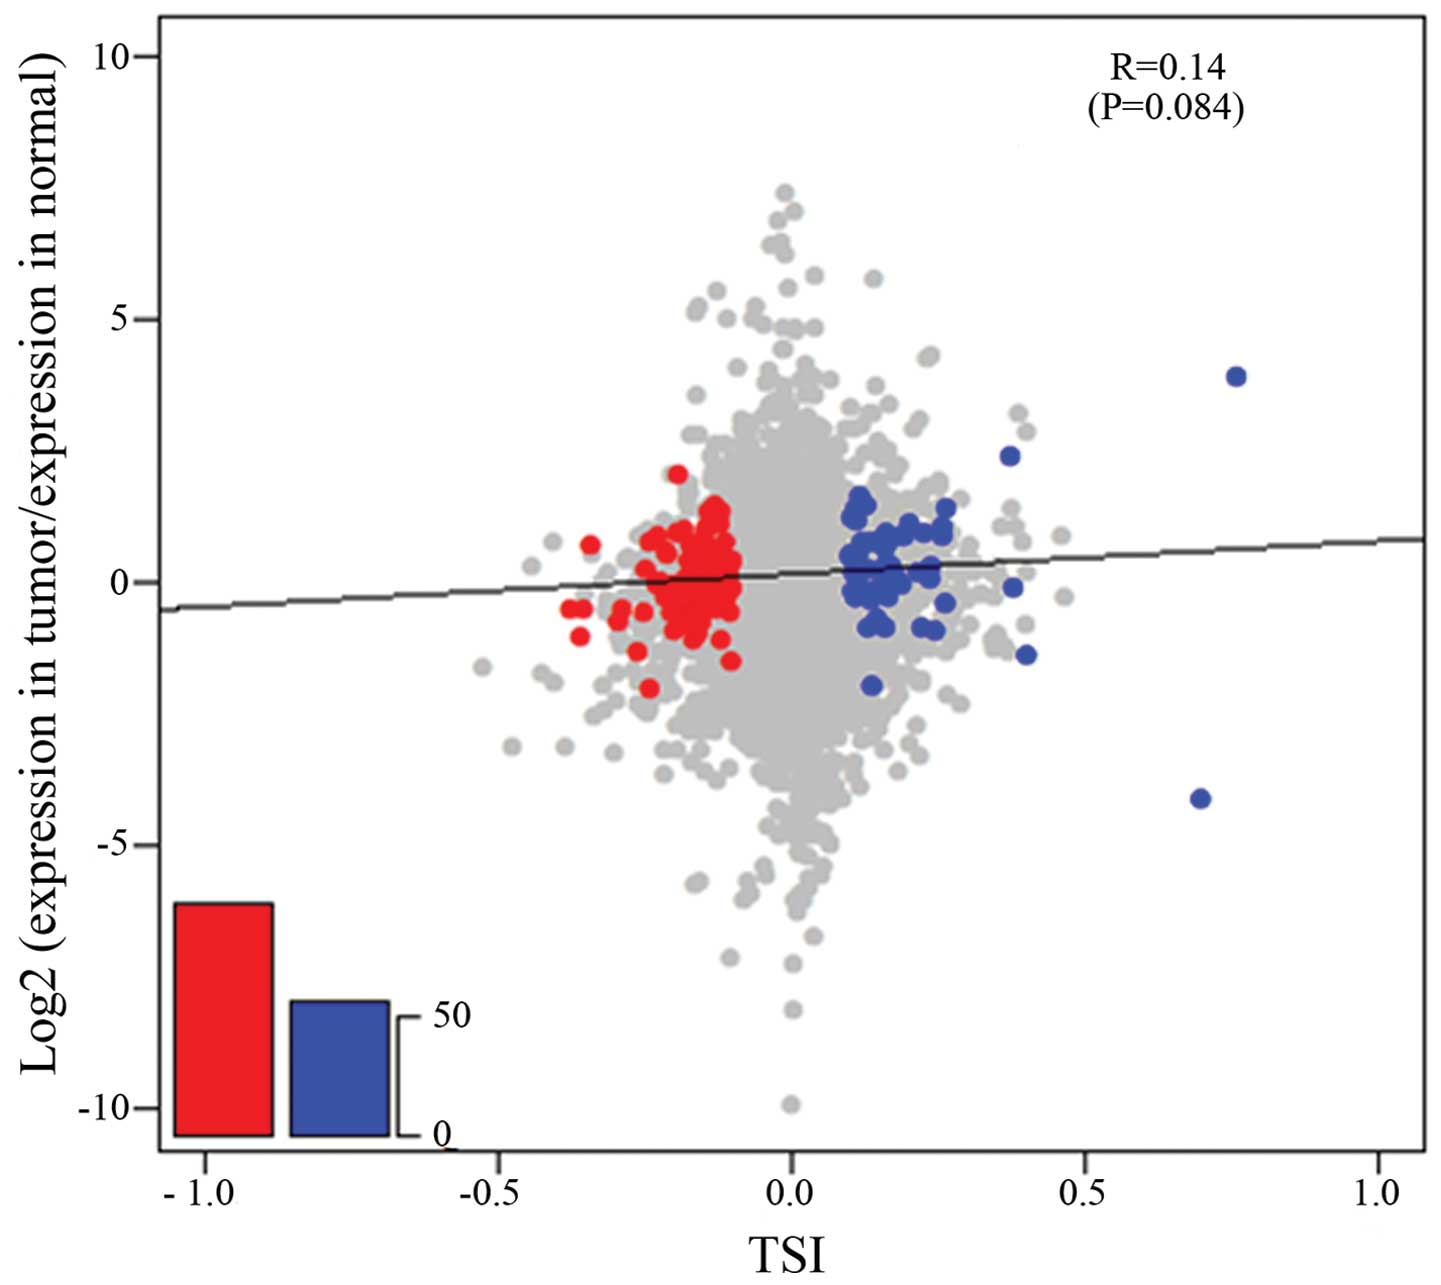
After poly(A) sites annotation, a total of 153 genes
were indentified to be with a significant difference in tandem
3′UTR length (FDR <0.01). Among these genes, 97 genes (63.4%)
had a negative TSI, which suggests that the number of genes with
shortened 3′UTRs in the cancerous tissue was slightly more than
that of the genes with lengthened 3′UTRs (Fig. 4). The results of statistical
analysis using the χ2 test (P=9.176×E-04) of the
quantitative difference of the shortened and lengthened genes were
significant.
DEGs
Using the reads mapped to the genes, the expression
levels in the 2 samples were profiled. The reads supported for each
gene were then normalized by the minimum number of the reads after
internal priming. Fisher’s exact test and the Benjamini-Hochberg
method for rectification were performed to select the DEGs. The
genes with a FDR <0.01 and fold-change >3 were regarded as
DEGs. Therefore, a total of 1,296 genes was identified as DEGs.
Among these, 495 were upregulated by 3-fold in the cancerous tissue
compared with those in the normal tissue (FDR <0.01), while 801
genes were downregulated.
Functional enrichment
The shortened genes in the cancerous tissue were
enriched in 39 BP of GO terms primarily associated with negative
regulation of macromolecule metabolic process, establishment of RNA
localization and RNA transport (FDR <0.05; data not shown). All
genes with shortened 3′UTRs were enriched in spliceosome
(P<0.05) (Table IV).
| Table IVEnrichment of genes with tandem 3′UTR
involved in various important GO and KEGG pathways. |
Table IV
Enrichment of genes with tandem 3′UTR
involved in various important GO and KEGG pathways.
| GO category | ID | Name | Counts | Fold | P-value |
|---|
| Shortened genes
(n=97) |
| KEGG_PATHWAY | hsa03040 | Spliceosome | 4 | 6.46 | 2.06E-02 |
| GOTERM_BP_FAT | GO:0016055 | Wnt receptor
signaling pathway | 4 | 5.98 | 2.82E-02 |
| Lengthened genes
(n=56) |
| KEGG_PATHWAY | hsa04510 | Focal adhesion | 4 | 5.95 | 2.33E-02 |
| KEGG_PATHWAY | hsa05215 | Prostate
cancer | 3 | 10.08 | 3.10E-02 |
| KEGG_PATHWAY | hsa04630 | Jak-STAT signaling
pathway | 3 | 5.79 | 8.38E-02 |
A decrease in breast cancer cell growth was
associated with the reduction of macromolecule biosynthesis and the
induction of apoptosis by global transcriptional profiling
(25). There are 11 genes with
shortened 3′UTRs which were enriched in the GO category of negative
regulation of macromolecule metabolic process (Table V). Among these genes, the tissue
inhibitor of metalloproteinase 3 (TIMP3), was found to
encode proteins which are inhibitors of the matrix
metalloproteinases, a group of peptidases involved in the
degradation of the extracellular matrix (ECM). The expression of
TIMP3 is induced in response to mitogenic stimulation and
this netrin domain-containing protein is localized to the ECM
(http://www.ncbi.nlm.nih.gov/nuccore/NG_009117.1).
Acording to UniProtKB, complexes with metalloproteinases (such as
collagenases) irreversibly inactivates them by binding to their
catalytic zinc cofactor. This may form part of a tissue-specific
acute response to remodeling stimuli. Studies have demonstrated
that TIMP3, a mammalian tissue inhibitor, significantly
reduces the potential for metastasis for the transfected human BC
cell line (26,27). Moreover, mRNAs with shortened
3′UTR often lose the miRNA binding site, which may decrease the
expression of the mRNA through miRNA inhibition (20). Thus, switching to the proximal
poly(A) site of this gene may enhance the inhibition of ECM
degradation and improve the inducement of response to extracellular
stimuli, which collectively increases the metastatic potential in
the progression of BC. Another gene is v-ski sarcoma viral oncogene
homolog (avian) (SKI), which also stimulates growth by
activating the Wnt signaling pathway (28). Furthermore, 3 genes termed ArfGAP
with FG repeats 1 (AGFG1), heterogeneous nuclear
ribonucleoprotein A2/B1 (HNRNPA2B1) and nucleoporin 153 kDa
(NUP153) were found to be enriched in the establishment of
RNA localization and RNA transport. All these genes have ben
reported to be related with HIV RNA transport (29–31).
| Table VEleven genes enriched in GO terms
associated with the negative regulation of macromolecule metabolic
process. |
Table V
Eleven genes enriched in GO terms
associated with the negative regulation of macromolecule metabolic
process.
| ucscID | Gene symbol | Description | Pearson’s r |
|---|
| uc010wbb.1 | PHF12 | PHD finger protein
12 isoform 1 | −0.18 |
| uc011ebr.1 | HEY2 |
Hairy/enhancer-of-split related with YRPW
motif | −0.36 |
| uc001aqk.1 |
CTNNBIP1 | Catenin, β
interacting protein 1 | −0.21 |
| uc010ikt.2 | SNCA | α-synuclein isoform
NACP112 | −0.38 |
| uc003anb.2 | TIMP3 | Tissue inhibitor of
metalloproteinase 3 | −0.12 |
| uc003geu.1 | MXD4 | MAD4 | −0.19 |
| uc001aja.3 | SKI | v-ski sarcoma viral
oncogene homolog | −0.17 |
| uc003oql.2 | FOXP4 | Forkhead box P4
isoform 1 | −0.23 |
| uc003bqf.2 | BHLHE40 | Basic
helix-loop-helix family, member e40 | −0.25 |
| uc002vyg.2 | ASB1 | Ankyrin repeat and
SOCS box-containing protein | −0.12 |
| uc003ccx.3 | THRB | Thyroid hormone
receptor, β | −0.24 |
Several genes with shorter 3′UTRs were observed to
be enriched in the spliceosome pathway. Among these genes,
U2-associated SR140 protein (SR140), also known as U2
snRNP-associated SURP domain containing (U2SURP), were
summarized to be associated with BC by GeneCards (http://www.genecards.org/).
The lengthened genes were enriched in 37 BP of GO
terms, which were associated with protein localization and
transport (P<0.01; data not shown). Furthermore, these genes
were involved in the following 3 pathways: focal adhesion, prostate
cancer and Jak-signal transducer and activator of transcription
(STAT) signaling pathway (P<0.1) (Table IV). Among the genes enriched in
protein localization and transport, trichorhinophalangeal syndrome
I (TRPS1) was found to encode the TRPS-1 protein, which has
been found to be overexpressed in >90% of early- and late-stage
BC cases by immunohistochemical analysis (32). However, switching to the distal
APA site of this gene may decrease the expression due to miRNA
combination. Therefore, further investigations may be required to
explain the phenomenon in detail. Strikingly, another gene, termed
STAT6 [interleukin-4 (IL-4)-induced] was enriched in the
regulation of transcription. IL-4-induced STAT6 signaling is active
in a variety of cell types, including immune cells and cancer
cells, and plays an important role in the regulation of gene
expression. Zhang et al (33) reported that BC cells carrying
STAT6 (null) phenotype exhibited increased spontaneous apoptosis
compared with those carrying STAT6 (high) phenotype. Using the
longer 3′UTR, the role for STAT6 in the cancerous tissue may
be relatively close with the former status.
Moreover, several genes with lengthened 3′UTRs were
observed to be enriched in the focal adhesion pathway (Table VI). Among these genes, B-cell
lymphoma protein 2α isoform (Bcl-2), was discovered to have
a significantly lower positive expression rate in the BCs than in
the normal tissue (34). Another
study showed that the overexpression of the Bcl-2 or Bcl-x(L)
associated with the loss of apoptosis in BC cells in vivo
may account for their metastatic behavior (35). Univariate analysis indicated a
decreased Bcl-2 protein expression to be significantly (P=0.0089)
associated with a worse disease-free survival (DFS) in BC (36). Real et al (37) suggested that an increased
activation of the STAT3-Bcl-2 pathway in estrogen receptor-negative
metastatic BC cell lines conferred a survival advantage to these
cells and contributed to their chemoresistance. Neri et al
(38) reported that the
expression of Bcl-2 improved the prognosis of peritumor
lymphovascular invasion (LVI)-positive tumors up to values similar
to LVI negative cases, while its absence associated with the
presence of LVI resulted in a poor outcome with only 28% of
patients alive at 8 years. Therefore, with the lengthened 3′UTR in
cancerous tissue, the expression of Bcl-2 may be relatively lower
since miRNA binding, which was in accordance with the reported
situation above. Furthermore, the lower expression may be
associated with the increase in apoptosis, which may lead to the
avoidance from the metastatic behavior in BC. From this aspect, the
prognosis of BC may be improved with the shortened 3′UTR of this
gene. However, detailed and comprehensive experiments and studies
are required for further confirmation. Another gene is
phosphoinositide-3-kinase, regulatory subunit 1 (PIK3R1). It
has been demonstrated that Akt is activated by a variety of
stimuli, through such growth factor receptors as HER2, in a
phosphoinositide-3-OH kinase (PI3K)-dependent manner. A loss of
phosphatase and tensin homolog deleted on chromosome 10 (PTEN)
function also activates Akt, which is then associated with a worse
outcome among BC patients treated with endocrine therapy (39). These data suggest that the
PIK3R1 gene with a longer 3′UTR is involved in the
associatino between endogenous and extracellular stimuli and the
prognosis of BC.
| Table VIFour genes enriched in GO terms
associated with focal adhesion. |
Table VI
Four genes enriched in GO terms
associated with focal adhesion.
| ucscID | Gene symbol | Description | Pearson’s r |
|---|
| uc002lit.1 | Bcl-2 | B-cell lymphoma
protein 2α isoform | 0.21 |
| uc003ung.1 | COL1A2 | α2 type I collagen
precursor | 0.18 |
| uc011cir.1 | PDGFC | Platelet-derived
growth factor C precursor | 0.16 |
| uc003jva.2 | PIK3R1 |
Phosphoinositide-3-kinase, regulatory
subunit 1 | 0.14 |
The upregulated genes were mainly enriched in
mitotic cell cycle, nuclear division, mitosis M phase of mitotic
cell cycle, cell cycle phase, organelle fission, M phase, cell
cycle process, cell cycle, cell division and chromosome segregation
(FDR <0.01). The GO categories of response to endogenous and
extracellular stimuli, including steroid hormones (such as
glucocorticoids, corticosteroids and estrogen) and nutrient levels
(organic substances and vitamins), chemical homeostasis, locomotory
behavior, cell-cell signaling, regulation of cell proliferation,
neuronal differentiation, pattern specification process, cellular
component morphogenesis, cell projection morphogenesis were
enriched among the downregulated genes (FDR <0.05).
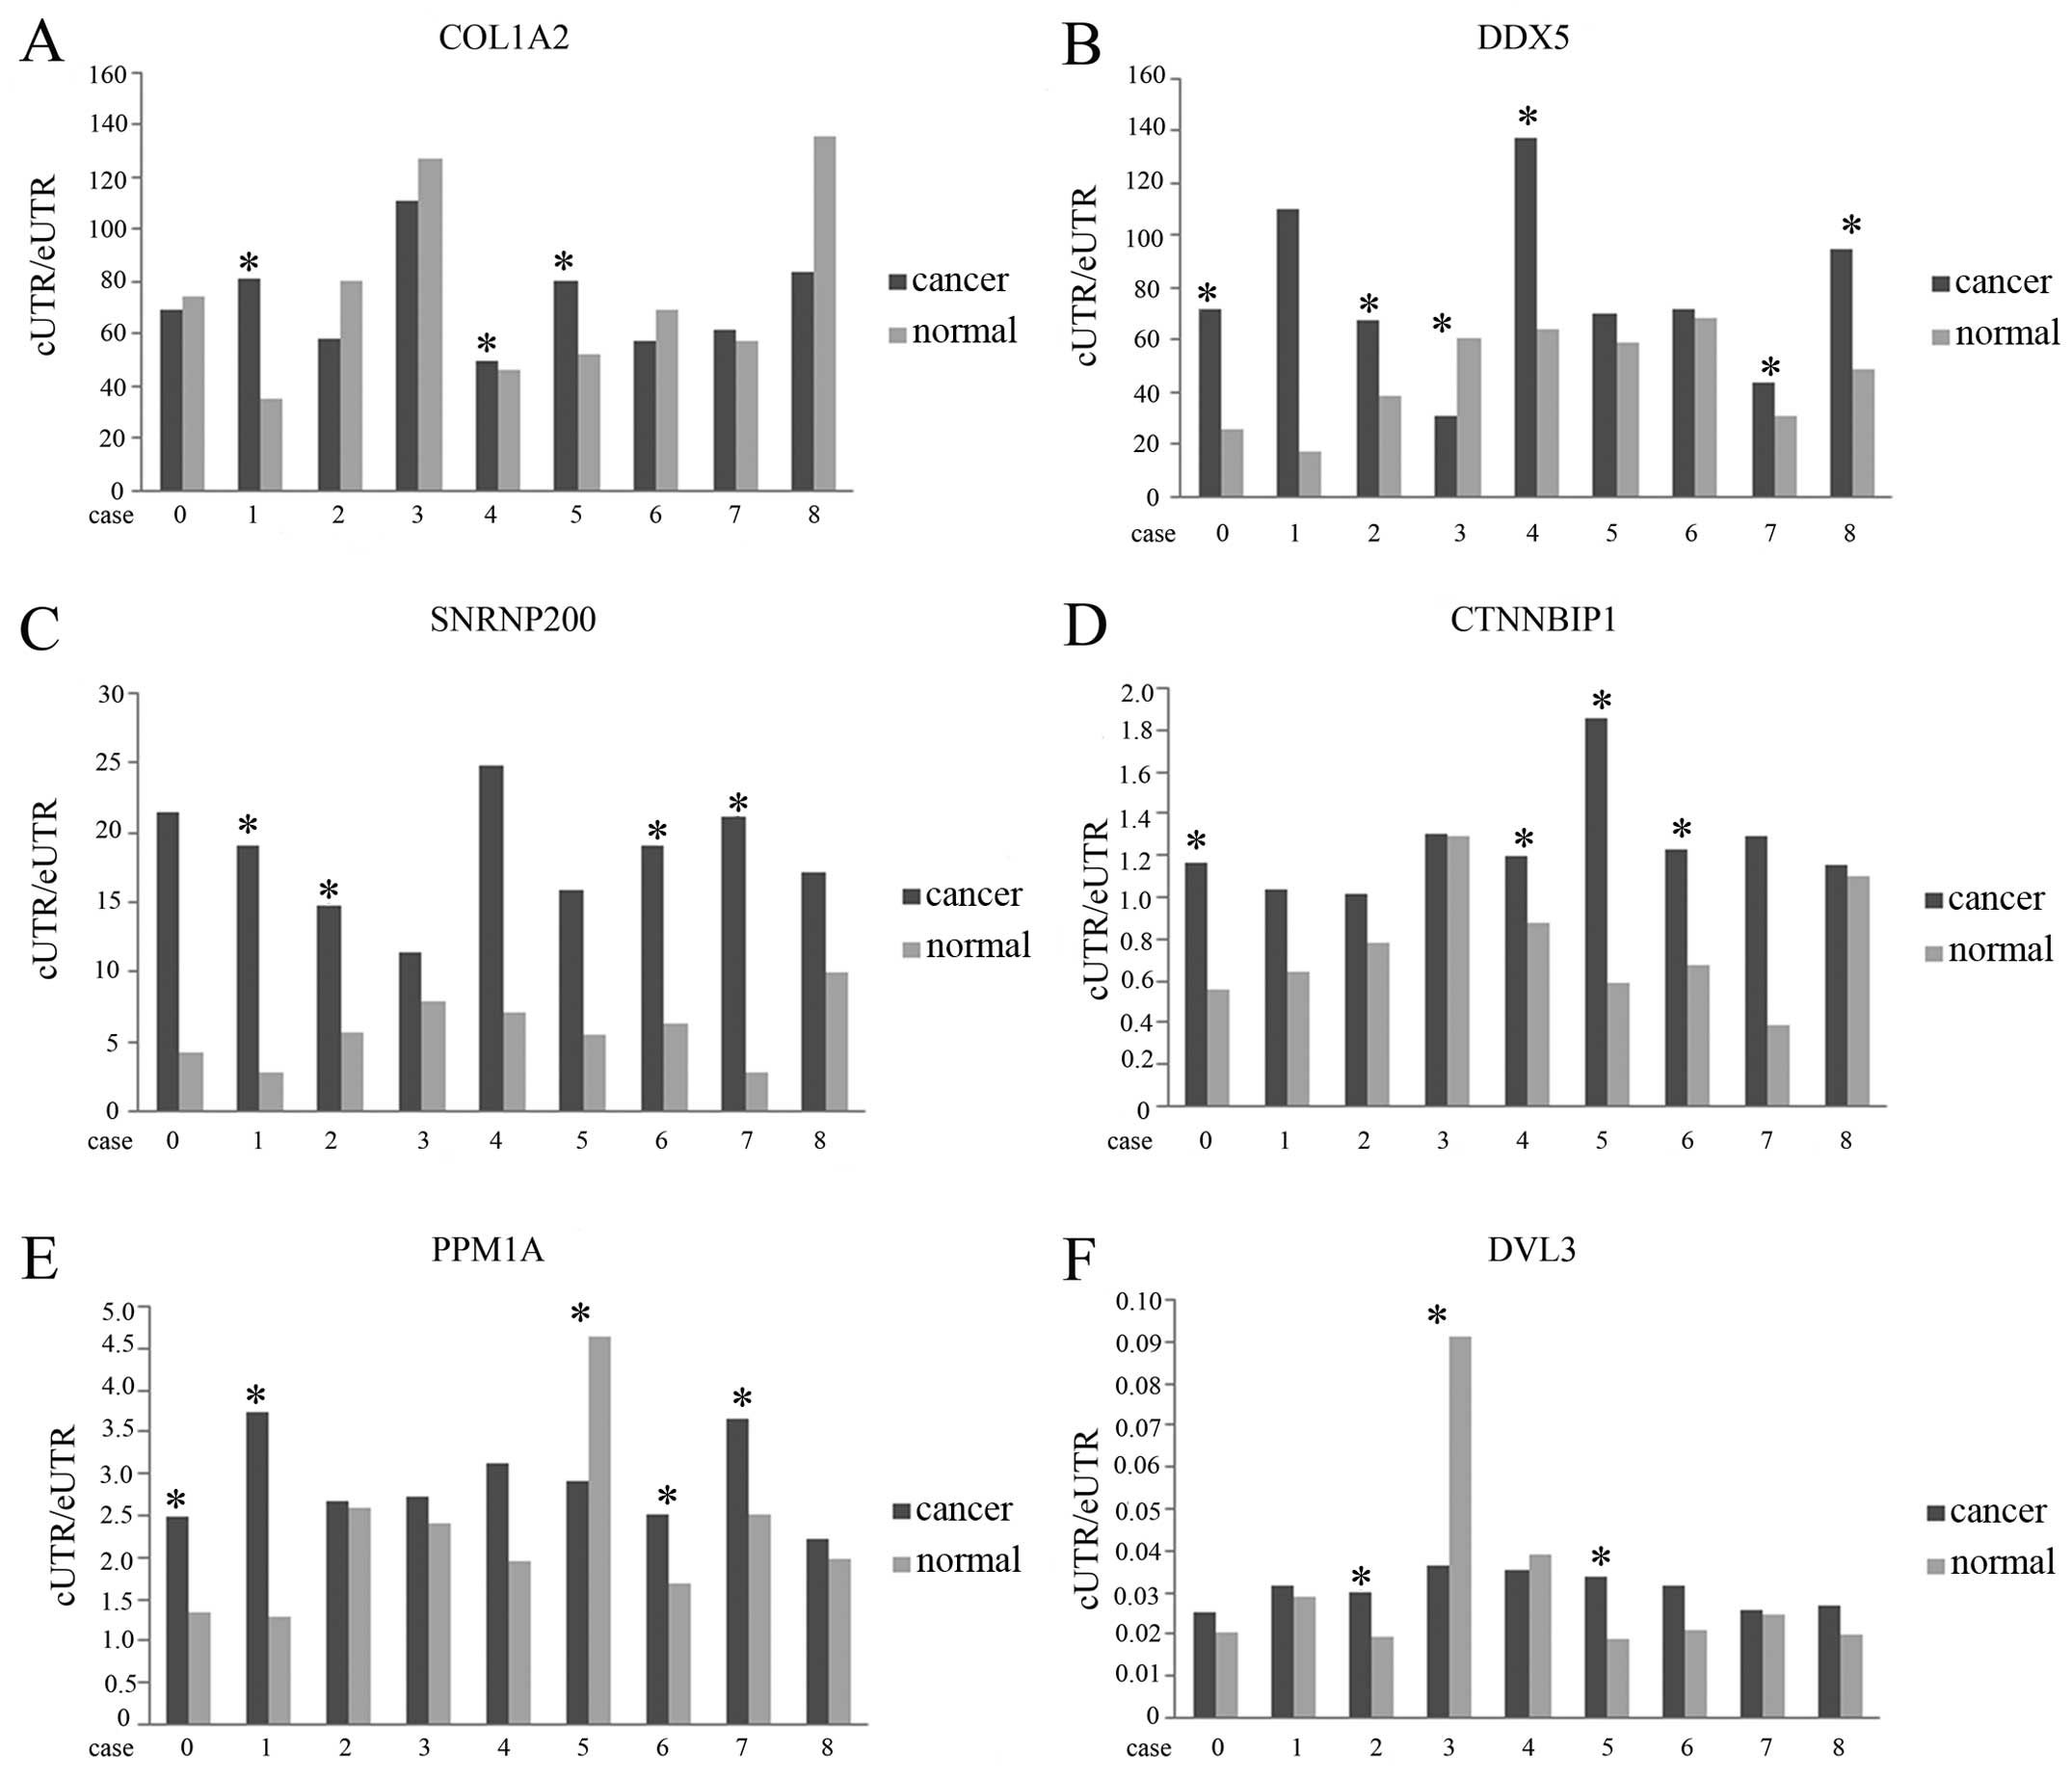
Validation by RT-qPCR
For further confirmation of the poly(A)
site-switching regulation of the tandem 3′UTR genes, 6 genes with
switched APA sites (COL1A2, DDX5, SNRNP200,
CTNNBIP1, DVL3 and PPM1A) (Table VII) were subjected to RT-qPCR in
the sequenced patient and an additional 8 patients. Among the 6
genes, SNRNP200 and DDX5 were enriched in the
spliceosome. Another 2 genes (PPM1A and DVL3) were
enriched in the Wnt receptor signaling pathway. According to
UniProtKB, DVL3 may play a role in the signal transduction
pathway mediated by multiple Wnt genes. Furthermore,
CTNNBIP1 is involved in the negative regulation of
macromolecule metabolic process, regulation of transcription, Wnt
receptor signaling pathway, negative regulation of transcription
from RNA polymerase II promoter, negative regulation of signal
transduction. The lengthened gene, COL1A2, was enriched in
focal adhesion. Three transcripts, resulting from the use of APA
signals, have been identified for this gene (http://www.ncbi.nlm.nih.gov/gene/1278). It has been
demonstrated that the COOH-terminal fragment of procollagen type I
(C3) is produced in tissues with high synthesis of collagen I, such
as in BC stroma and in bone (40). However, this represented a paradox
between the lower expression of certain genes, which tended to use
longer 3′UTR, with the high synthesis in BC. Further investigation
is required to reconcile this paradox. All these candidate genes
with switched APA sites were validated in the sequenced patients.
Furthermore, for the shortened genes, 2 genes (SNRNP200 and
CTNNBIP1) tended to use shortened 3′UTR transcripts in all
the 9 patients, 3 genes (DDX5, PPM1A and DVL3)
tended to be the same as the sequenced patients in 7–8 patients.
Moreover, in the lengthened genes, COL1A2 was validated in 5
patients (Fig. 5).
| Table VIISix tandem 3′UTR genes validated by
qRT-PCR. |
Table VII
Six tandem 3′UTR genes validated by
qRT-PCR.
| ucscID | Gene symbol | Description | Pearson_r |
|---|
| uc003ung.1 | COL1A2 | α2 type I collagen
precursor | 0.18 |
| uc010deh.2 | DDX5 | DEAD
(Asp-Glu-Ala-Asp) box polypeptide 5 | −0.14 |
| uc002svt.2 | SNRNP200 | Activating signal
cointegrator 1 complex subunit | −0.16 |
| uc001aqk.1 | CTNNBIP1 | Catenin, β
interacting protein 1 | −0.21 |
| uc001xew.3 | PPM1A | Protein phosphatase
1A isoform 3 | −0.13 |
| uc003fms.2 | DVL3 | Dishevelled 3 | −0.21 |
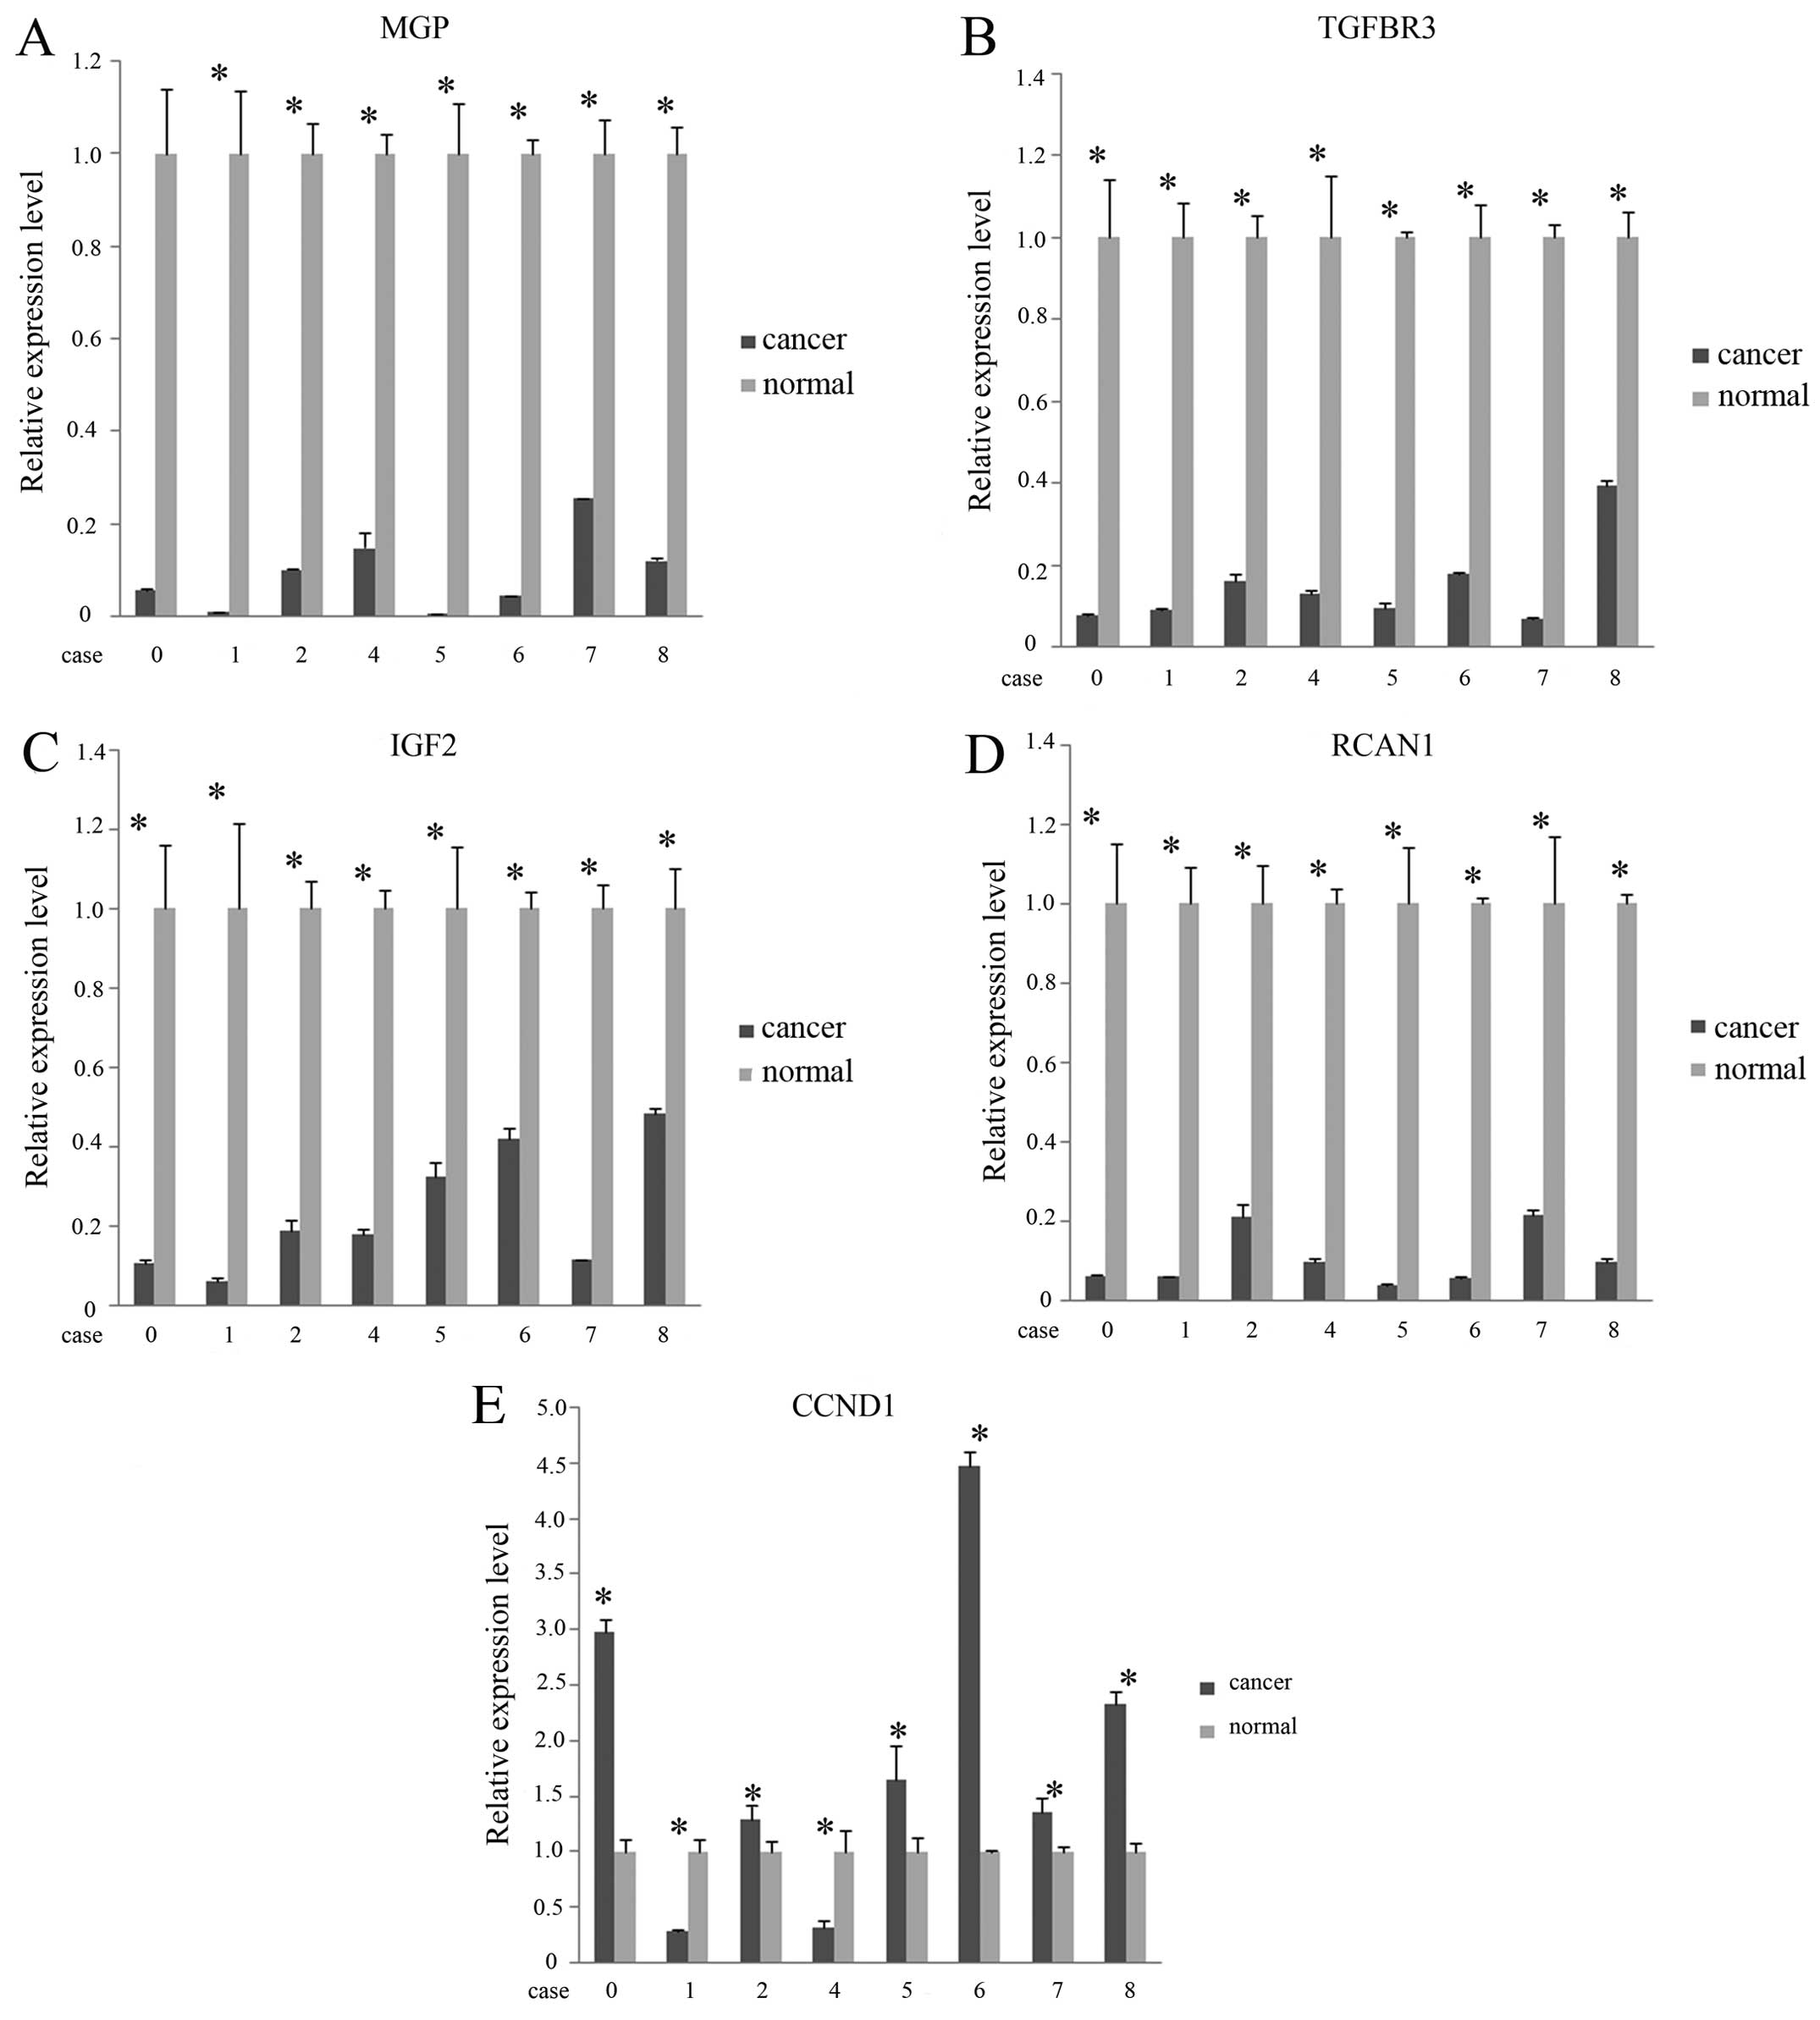
Five DEGs (MGP, TGFBR3, IGF2,
RCAN1 and CCND1) were selected to be confirmed by
RT-qPCR in 9 patients. The 4 upregulated genes in cancerous tissue
(MGP precursor response to hormone stimulus, response to
nutrient), TGFBR3, IGF2 isoform 1, RCAN1
isoform c were enriched in response to hormone stimulus, nutrient
and wounding, regulation of cell proliferation, cell morphogenesis,
homeostatic process and cell-cell signaling. The downregulated
gene, CCND1, was enriched in the mitotic cell cycle. As for
the 5 DEGs, the regulation pattern detected by RT-qPCR in the
sequenced patient revealed a consistent tendency with the one by
SAPAS. Further, the 4 upregulated genes tended to be significantly
upregulated in the cancerous tissue in 8 patients (P<0.05;
t-test ), while the one downregulated gene tended to be
significantly downregulated in 6 patients (Fig. 6).
Discussion
Although BC cell lines have been used widely to
investigate pathobiology and new therapies in the disease, and one
of the major benefits is that they offer an infinite supply of a
relatively homogeneous cell population that is capable of
self-replication in standard cell culture medium (41), at the genomic level, it is
uncertain as to how well cell line subtypes faithfully represent
tumor subtype counterparts. In a previous study, gene expression
patterns in 2 tumor samples from the same individual were almost
always more similar to each other than either was to any other
sample (42). Taken together, it
is essential to further investigate the transcriptional profiles in
BC in vivo. In the present study, we obtained the
comprehensive profiles of APA sites in the luminal B subtype of BC
using the SAPAS method.
The study by Singh et al (43) suggested that alternative mRNA
processing, particularly APA, can be a powerful molecular biomarker
with prognostic potential. By the global shortening of 3′UTRs in
vitro and in vivo (16,43), the 3′UTRs show distinct features
in primary cancer samples. With shortened 3′UTRs, functional
consequences have been produced by genes, which has led to greater
mRNA stability and increased protein output (8). Through forcing the expression of
shorter 3′UTR isoforms, phenotypic consequences were observed,
which suggests that 3′UTR shortening is associated with cell
proliferation, including T-cell activation or early embryogenesis
(7,44). Furthermore, unlike primary tumors,
there are significantly more genes with lengthened 3′UTRs in a
metastatic cell line (15). These
discoveries suggest that there may be a dynamic deregulation of APA
during the life cycle of cancer cells. In this study, we found a
significantly greater number of genes with shortened 3′UTRs in the
samples with luminal B type BC, which belonged to primary cancer
with a relatively low proliferation. Thus, it can be deduced that
the global profile of alternative 3′UTRs may be used to classify
different tumor stages in the process of the cancer.
Through detailed functional enrichment analysis, we
discovered that the global functional enrichment indicates the
importance of 3′UTR switching in the spliceosome and focal adhesion
pathway, as well as the negative regulation of macromolecule
metabolic process, regulation of transcription, the Wnt receptor
signaling pathway and negative regulation of signal transduction.
It has been identified that the spliceosome and Wnt receptor
signaling are among the most commonly identified KEGG pathways and
GO processes (45). Moreover, WNT
signaling has been reported to be enhanced and may contribute to
the proliferation of human breast tumor cells (46). The study by Lamb et al
(47) demonstrated that WNT
pathway activation is significantly higher in populations enriched
for BC stem-like cells (BCSCs), while populations enriched for
normal stem-like cells have lower levels of WNT signaling. In
addition, global transcriptional profiling revealed that a decrease
in cell growth is associated with the reduction of macromolecule
biosynthesis and the induction of apoptosis (25). These data demonstrate that the
related biological progresses and pathways involved in 3′UTR
switching are partly confirmed.
A total of 495 upregulated genes were discovered to
be involved in the mitotic cell cycle, nuclear division, mitosis M
phase of mitotic cell cycle, cell cycle phase, organelle fission, M
phase, cell cycle process, cell cycle, cell division and chromosome
segregation. A previous study revealed that chromosome 2 open
reading frame 40 (C2ORF40), which acts as a tumor suppressor
gene in BC pathogenesis and progression, functions at the G2/M
phase by downregulation of mitotic gene expression (48). Another study demonstrated the
ability of dimethyl melaleucate (DMM), a pentacyclic triterpene to
exhibit cell cycle arrest at the G0/G1 phase by the downregulation
of cyclin D1 through PI3K/AKT inhibition (49). Both studies confirmed the
upregulation of mitotic cell cycle genes in BC formation. A
clinical study found that BC is caused by a homeostatic imbalance
of cell division (50). The GO
categories of response to endogenous and extracellular stimuli
(including steroid hormones, such as glucocorticoids,
corticosteroids and estrogen) and nutrient levels (organic
substances and vitamins), chemical homeostasis, locomotory
behavior, cell-cell signaling, regulation of cell proliferation,
neuronal differentiation, pattern specification process, cellular
component morphogenesis, cell projection morphogenesis were
enriched among the 801 downregulated genes. Among these pathways
and biological progresses, response to hormone stimuli, response to
endogenous stimuli and response to steroid hormone stimuli were
considered to play an important role in the occurrence and
development of breast invasive ductal carcinoma (IDC) (51). These data suggest that apart from
the processes and pathways identifed by previous studies, novel and
correlative functions involved in differential expression were
discovered.
In conclusion, the trend of APA site-switching
events in 3′UTRs in the luminal B subtype of BC were found to be
the same as those in MCF7 cell lines despite of less prevalence.
From the aspect of the APA profile, it can suggest that the luminal
B subtype of BC is not highly proliferative in vivo, which
may provide novel information on the clinical diagnosis and
prognosis on a molecular level. Several potential biomarkers with
significantly differential tandem 3′UTRs and expression levels were
found and validated. The related biological progresses and pathways
involved were partially confirmed by a previous study (15). Nevertheless, further, more
detailed investigations and research are required to fully
elucidate the association between APA profiles and BC
tumorigenesis.
References
|
1
|
Sørlie T, Perou CM, Tibshirani R, et al:
Gene expression patterns of breast carcinomas distinguish tumor
subclasses with clinical implications. Proc Natl Acad Sci USA.
98:10869–10874. 2001. View Article : Google Scholar : PubMed/NCBI
|
|
2
|
Sorlie T, Tibshirani R, Parker J, et al:
Repeated observation of breast tumor subtypes in independent gene
expression data sets. Proc Natl Acad Sci USA. 100:8418–8423. 2003.
View Article : Google Scholar : PubMed/NCBI
|
|
3
|
Kao J, Salari K, Bocanegra M, et al:
Molecular profiling of breast cancer cell lines defines relevant
tumor models and provides a resource for cancer gene discovery.
PLoS One. 4:e61462009. View Article : Google Scholar : PubMed/NCBI
|
|
4
|
Tran B and Bedard PL: Luminal-B breast
cancer and novel therapeutic targets. Breast Cancer Res.
13:2212011. View
Article : Google Scholar
|
|
5
|
Cadoo KA, Fornier MN and Morris PG:
Biological subtypes of breast cancer: current concepts and
implications for recurrence patterns. Q J Nucl Med Mol Imaging.
57:312–321. 2013.PubMed/NCBI
|
|
6
|
Rouzier R, Perou CM, Symmans WF, et al:
Breast cancer molecular subtypes respond differently to
preoperative chemotherapy. Clin Cancer Res. 11:5678–5685. 2005.
View Article : Google Scholar : PubMed/NCBI
|
|
7
|
Sandberg R, Neilson JR, Sarma A, Sharp PA
and Burge CB: Proliferating cells express mRNAs with shortened 3′
untranslated regions and fewer microRNA target sites. Science.
320:1643–1647. 2008. View Article : Google Scholar : PubMed/NCBI
|
|
8
|
Mayr C and Bartel DP: Widespread
shortening of 3′UTRs by alternative cleavage and polyadenylation
activates oncogenes in cancer cells. Cell. 138:673–684. 2009.
View Article : Google Scholar : PubMed/NCBI
|
|
9
|
Vlasova IA, Tahoe NM, Fan D, et al:
Conserved GU-rich elements mediate mRNA decay by binding to
CUG-binding protein 1. Mol Cell. 29:263–270. 2008. View Article : Google Scholar : PubMed/NCBI
|
|
10
|
Tian B, Hu J, Zhang H and Lutz CS: A
large-scale analysis of mRNA polyadenylation of human and mouse
genes. Nucleic Acids Res. 33:201–212. 2005. View Article : Google Scholar : PubMed/NCBI
|
|
11
|
Wang ET, Sandberg R, Luo S, et al:
Alternative isoform regulation in human tissue transcriptomes.
Nature. 456:470–476. 2008. View Article : Google Scholar : PubMed/NCBI
|
|
12
|
Pickrell JK, Marioni JC, Pai AA, et al:
Understanding mechanisms underlying human gene expression variation
with RNA sequencing. Nature. 464:768–772. 2010. View Article : Google Scholar : PubMed/NCBI
|
|
13
|
Mangone M, Manoharan AP, Thierry-Mieg D,
et al: The landscape of C. elegans 3′UTRs. Science. 329:432–435.
2010. View Article : Google Scholar : PubMed/NCBI
|
|
14
|
Jan CH, Friedman RC, Ruby JG and Bartel
DP: Formation, regulation and evolution of Caenorhabditis elegans
3′UTRs. Nature. 469:97–101. 2011. View Article : Google Scholar :
|
|
15
|
Fu Y, Sun Y, Li Y, Rao X, Chen C and Xu A:
Differential genome-wide profiling of tandem 3′ UTRs among human
breast cancer and normal cells by high-throughput sequencing.
Genome Res. 21:741–747. 2011. View Article : Google Scholar : PubMed/NCBI
|
|
16
|
Ozsolak F, Kapranov P, Foissac S, et al:
Comprehensive polyadenylation site maps in yeast and human reveal
pervasive alternative polyadenylation. Cell. 143:1018–1029. 2010.
View Article : Google Scholar : PubMed/NCBI
|
|
17
|
Subtelny AO, Eichhorn SW, Chen GR, Sive H
and Bartel DP: Poly(A)-tail profiling reveals an embryonic switch
in translational control. Nature. 508:66–71. 2014. View Article : Google Scholar : PubMed/NCBI
|
|
18
|
Sun Y, Fu Y, Li Y and Xu A: Genome-wide
alternative polyadenylation in animals: insights from
high-throughput technologies. J Mol Cell Biol. 4:352–361. 2012.
View Article : Google Scholar : PubMed/NCBI
|
|
19
|
Rhead B, Karolchik D, Kuhn RM, et al: The
UCSC Genome Browser database: update 2010. Nucleic Acids Res.
38:D613–D619. 2010. View Article : Google Scholar :
|
|
20
|
Langmead B: Aligning short sequencing
reads with Bowtie. Curr Protoc Bioinformatics. Chapter 11(Unit
11.7)2010. View Article : Google Scholar : PubMed/NCBI
|
|
21
|
Tian P, Sun Y, Li Y, et al: A global
analysis of tandem 3′UTRs in eosinophilic chronic rhinosinusitis
with nasal polyps. PLoS One. 7:e489972012. View Article : Google Scholar
|
|
22
|
Lee JY, Yeh I, Park JY and Tian B:
PolyA_DB 2: mRNA polyadenylation sites in vertebrate genes. Nucleic
Acids Res. 35:D165–D168. 2007. View Article : Google Scholar : PubMed/NCBI
|
|
23
|
Sun M, Ju H, Zhou Z and Zhu R: Pilot
genome-wide study of tandem 3′UTRs in esophageal cancer using
high-throughput sequencing. Mol Med Rep. 9:1597–1605.
2014.PubMed/NCBI
|
|
24
|
Huang da W, Sherman BT and Lempicki RA:
Bioinformatics enrichment tools: paths toward the comprehensive
functional analysis of large gene lists. Nucleic Acids Res.
37:1–13. 2009. View Article : Google Scholar :
|
|
25
|
Kimbung S, Biskup E, Johansson I, et al:
Co-targeting of the PI3K pathway improves the response of BRCA1
deficient breast cancer cells to PARP1 inhibition. Cancer Lett.
319:232–241. 2012. View Article : Google Scholar : PubMed/NCBI
|
|
26
|
Lei H, Hemminki K, Altieri A, et al:
Promoter polymorphisms in matrix metalloproteinases and their
inhibitors: few associations with breast cancer susceptibility and
progression. Breast Cancer Res Treat. 103:61–69. 2007. View Article : Google Scholar
|
|
27
|
Han X, Zhang H, Jia M, Han G and Jiang W:
Expression of TIMP-3 gene by construction of a eukaryotic cell
expression vector and its role in reduction of metastasis in a
human breast cancer cell line. Cell Mol Immunol. 1:308–310.
2004.
|
|
28
|
Chen D, Xu W, Bales E, et al: SKI
activates Wnt/beta-catenin signaling in human melanoma. Cancer Res.
63:6626–6634. 2003.PubMed/NCBI
|
|
29
|
Sánchez-Velar N, Udofia EB, Yu Z and Zapp
ML: hRIP, a cellular cofactor for Rev function, promotes release of
HIV RNAs from the perinuclear region. Genes Dev. 18:23–34. 2004.
View Article : Google Scholar : PubMed/NCBI
|
|
30
|
Lévesque K, Halvorsen M, Abrahamyan L, et
al: Trafficking of HIV-1 RNA is mediated by heterogeneous nuclear
ribonucleoprotein A2 expression and impacts on viral assembly.
Traffic. 7:1177–1193. 2006. View Article : Google Scholar : PubMed/NCBI
|
|
31
|
Varadarajan P, Mahalingam S, Liu P, et al:
The functionally conserved nucleoporins Nup124p from fission yeast
and the human Nup153 mediate nuclear import and activity of the Tf1
retrotransposon and HIV-1 Vpr. Mol Biol Cell. 16:1823–1838. 2005.
View Article : Google Scholar : PubMed/NCBI
|
|
32
|
Radvanyi L, Singh-Sandhu D, Gallichan S,
et al: The gene associated with trichorhinophalangeal syndrome in
humans is overexpressed in breast cancer. Proc Natl Acad Sci USA.
102:11005–11010. 2005. View Article : Google Scholar : PubMed/NCBI
|
|
33
|
Zhang WJ, Li BH, Yang XZ, et al:
IL-4-induced Stat6 activities affect apoptosis and gene expression
in breast cancer cells. Cytokine. 42:39–47. 2008. View Article : Google Scholar : PubMed/NCBI
|
|
34
|
He Q, Zhang SQ, Chu YL, Jia XL and Wang
XL: The correlations between HPV16 infection and expressions of
c-erbB-2 and bcl-2 in breast carcinoma. Mol Biol Rep. 36:807–812.
2009. View Article : Google Scholar
|
|
35
|
Fernández Y, Gu B, Martínez A, Torregrosa
A and Sierra A: Inhibition of apoptosis in human breast cancer
cells: role in tumor progression to the metastatic state. Int J
Cancer. 101:317–326. 2002. View Article : Google Scholar : PubMed/NCBI
|
|
36
|
Tsutsui S, Yasuda K, Suzuki K, Takeuchi H,
Nishizaki T, Higashi H and Era S: Bcl-2 protein expression is
associated with p27 and p53 protein expressions and MIB-1 counts in
breast cancer. BMC Cancer. 6:1872006. View Article : Google Scholar : PubMed/NCBI
|
|
37
|
Real PJ, Sierra A, De Juan A, Segovia JC,
Lopez-Vega JM and Fernandez-Luna JL: Resistance to chemotherapy via
Stat3-dependent overexpression of Bcl-2 in metastatic breast cancer
cells. Oncogene. 21:7611–7618. 2002. View Article : Google Scholar : PubMed/NCBI
|
|
38
|
Neri A, Marrelli D, Roviello F, et al:
Bcl-2 expression correlates with lymphovascular invasion and
long-term prognosis in breast cancer. Breast Cancer Res Treat.
99:77–83. 2006. View Article : Google Scholar : PubMed/NCBI
|
|
39
|
Tokunaga E, Oki E, Kimura Y, et al:
Coexistence of the loss of heterozygosity at the PTEN locus and
HER2 overexpression enhances the Akt activity thus leading to a
negative progesterone receptor expression in breast carcinoma.
Breast Cancer Res Treat. 101:249–257. 2007. View Article : Google Scholar
|
|
40
|
Palmieri D, Astigiano S, Barbieri O, et
al: Procollagen I COOH-terminal fragment induces VEGF-A and CXCR4
expression in breast carcinoma cells. Exp Cell Res. 314:2289–2298.
2008. View Article : Google Scholar : PubMed/NCBI
|
|
41
|
Holliday DL and Speirs V: Choosing the
right cell line for breast cancer research. Breast Cancer Res.
13:2152011. View Article : Google Scholar : PubMed/NCBI
|
|
42
|
Perou CM, Sørlie T, Eisen MB, et al:
Molecular portraits of human breast tumours. Nature. 406:747–752.
2000. View Article : Google Scholar : PubMed/NCBI
|
|
43
|
Singh P, Alley TL, Wright SM, et al:
Global changes in processing of mRNA 3′ untranslated regions
characterize clinically distinct cancer subtypes. Cancer Res.
69:9422–9430. 2009. View Article : Google Scholar : PubMed/NCBI
|
|
44
|
Ji Z, Lee JY, Pan Z, Jiang B and Tian B:
Progressive lengthening of 3′ untranslated regions of mRNAs by
alternative polyadenylation during mouse embryonic development.
Proc Natl Acad Sci USA. 106:7028–7033. 2009. View Article : Google Scholar
|
|
45
|
Daemen A, Griffith OL, Heiser LM, et al:
Modeling precision treatment of breast cancer. Genome Biol.
14:R1102013. View Article : Google Scholar : PubMed/NCBI
|
|
46
|
Schlange T, Matsuda Y, Lienhard S, Huber A
and Hynes NE: Autocrine WNT signaling contributes to breast cancer
cell proliferation via the canonical WNT pathway and EGFR
transactivation. Breast Cancer Res. 9:R632007. View Article : Google Scholar : PubMed/NCBI
|
|
47
|
Lamb R, Ablett MP, Spence K, Landberg G,
Sims AH and Clarke RB: Wnt Pathway activity in breast cancer
sub-types and stem-like cells. PLoS One. 8:e678112013. View Article : Google Scholar : PubMed/NCBI
|
|
48
|
Lu J, Wen M, Huang Y, et al: C2ORF40
suppresses breast cancer cell proliferation and invasion through
modulating expression of M phase cell cycle genes. Epigenetics.
8:571–583. 2013. View Article : Google Scholar : PubMed/NCBI
|
|
49
|
Sathya S, Sudhagar S, Sarathkumar B and
Lakshmi BS: EGFR inhibition by pentacyclic triterpenes exhibit cell
cycle and growth arrest in breast cancer cells. Life Sci. 95:53–62.
2014. View Article : Google Scholar
|
|
50
|
Clancy J and McVicar A: Homeostasis 5:
nurses as external agents of control in breast cancer. Br J Nurs.
20:426428–430. 432–437. 2011. View Article : Google Scholar : PubMed/NCBI
|
|
51
|
Zhang BH, Liu J, Zhou QX, Zuo D and Wang
Y: Analysis of differentially expressed genes in ductal carcinoma
with DNA microarray. Eur Rev Med Pharmacol Sci. 17:758–766.
2013.PubMed/NCBI
|