Introduction
Epithelial ovarian cancer (EOC) is one of the most
common types of ovarian tumors and is the leading cause of
mortality among gynecological malignancies (1,2).
Despite the rapid development of surgical and chemotherapy
treatments, the 5-year survival rate for patients with EOC remains
at approximately 30–50% due to the lack of effective early
diagnostic methods. Thus, there is an urgent need for the
identification of biological factors with sensitivity and
specificity in order to improve prognosis and reduce the threat to
the lives and health of women.
It is well known that cell physiology, including
cell-cell junctions, cytoskeletal structure and cell morphology
regulate cancer cell migration and invasion. The actin cytoskeleton
plays a key role in cancer cell motility and metastasis, as its
remodeling regulates a number of important cellular processes, such
as cell adhesion, migration and morphological changes (3–5).
Cyclase-associated proteins (CAPs) which exist in organisms from
mammals to apicomplexan parasites (6) are a family of evolutionarily
conserved proteins which are key to regulating actin dynamics and
participate in Ras-mediated adenylyl cyclase activity (7,8).
In mammal, cells have 2 CAP genes encoding the related CAP1 and
CAP2 (9), both of which localize
in the cell membrane and cytoplasm, and contain a C-CAP/co-factor
C-like domain (10–13). The adenylate CAP1 gene, which
encodes an actin monomer-binding protein is thought to facilitate
processes, such as the establishment of cell polarity and mRNA
localization (14). It also has
the ability to control the cytoskeleton (15–19). The reorganization of the actin
filament is regulated by actin-binding proteins in some signaling
pathways that are essential for cell migration and several other
intracellular events (20,21).
CAP1 also plays an important role in actin filament turnover by
effectively recycling cofilin and actin (22). On both ends of the actin filament,
CAP1 rapidly translocates to the mitochondria upon treatment with
agents that induce apoptosis (23). Studies have demonstrated that CAP1
is overexpressed in hepatocelluar carcinoma (24), breast cancer (25), lung cancer (26) and esophageal squamous cell
carcinoma (27). However, to the
best of our knowledge, no more information is available to date
regarding the role of CAP1 in ovarian tumorigenesis.
Therefore, in the present study, we aimed to
investigate the expression and function of CAP1 in EOC. We analyzed
the expression of CAP1 protein in 119 EOC tissue specimens by
immunohistochemistry and western blot analysis. We also determined
the correlation of CAP1 expression with clinicopathological
characteristics and evaluated the prognostic value of CAP1 in EOC
by survival analysis. In addition, we knocked down CAP1 expression
in order to explore the potential involvement of CAP1 in the
regulation of cell proliferation. Our results indicate that CAP1 is
a newly identified biomarker for EOC and may be used as a
therapeutic target for the treatment of EOC in the future.
Materials and methods
Patients and tissue samples
All investigations described in this study were
carried out after obtaining informed consent and in accordance with
an Institutional Review Board protocol approved by the Partners
Human Research Committee at the Affiliated Hospital of Nantong
University, Nantong, China. A total of 119 human EOC tissue
specimens (45 papillary serous adenocarcinoma, 16 papillary
mucinous carcinoma, 14 endometrioid adenocarcinoma and 14 clear
cell carcinoma specimens, as well as 30 specimens classified as
‘other’) were provided by the Department of Pathology, the
Affiliated Hospital of Nantong University from 2004 to 2009. None
of the patients had received chemotherapy or radiotherapy prior to
surgery. A total of 10 tissue samples were obtained at the time of
surgery and were immediately stored in liquid nitrogen and
maintained at −80°C until used in western blot analysis, including
1 normal tissue sample from a woman who underwent hysterectomy for
benign disease. The clinicopathological characteristics of all the
participants are shown in Table
I. According to the WHO system, the histological classification
of tumors was graded as follows: well differentiated [grade 1 (G1);
n=15], moderately differentiated [grade 2 (G2); n=33] and poorly
differentiated [grade 3 (G3); n=71].
 | Table IExpression of CAP1 in the 119 human
ovarian cancer specimens. |
Table I
Expression of CAP1 in the 119 human
ovarian cancer specimens.
| Clinicopathological
characteristics | No. of cases | CAP1 expression
| P-valuea |
|---|
| Low | High |
|---|
| Age (years) | | | | 0.775 |
| ≤50 | 35 | 16 | 19 | |
| >50 | 84 | 36 | 48 | |
| FIGO stage, n
(%) | | | | 0.477 |
| I | 38 | 18 | 20 | |
| II | 31 | 10 | 21 | |
| III | 33 | 15 | 18 | |
| IV | 17 | 9 | 8 | |
| Histological grade,
n (%) | | | | 0.010b |
| 1 | 15 | 12 | 3 | |
| 2 | 33 | 13 | 20 | |
| 3 | 71 | 27 | 44 | |
| Histological
subtype, n (%) | | | | 0.071 |
| Serous | 45 | 20 | 25 | |
| Mucinous | 16 | 10 | 6 | |
| Endometrioid | 14 | 7 | 7 | |
| Clear cell | 14 | 8 | 6 | |
| Others | 30 | 7 | 23 | |
| Menopause | | | | 0.395 |
| Absent | 43 | 21 | 22 | |
| Present | 76 | 31 | 45 | |
| Lymph node status,
n (%) | | | | 0.209 |
| Negative | 87 | 35 | 52 | |
| Positive | 32 | 17 | 15 | |
| Ascites, n (%) | | | | 0.666 |
| Absent | 66 | 30 | 36 | |
| Present | 53 | 22 | 31 | |
| Malignant tumor
cells in peritoneal fluid, n (%) | | | | 0.472 |
| Absent | 90 | 41 | 49 | |
| Present | 29 | 11 | 18 | |
| Metastases to other
organs, n (%) | | | | 0.666 |
| Absent | 66 | 30 | 36 | |
| Present | 53 | 22 | 31 | |
| Ki-67 | | | | <0.001b |
| Low
expression | 50 | 37 | 13 | |
| High
expression | 69 | 15 | 54 | |
Antibodies
The antibodies used for western blot analysis and
immunohistochemistry were as follows: mouse anti-CAP1 monoclonal
antibody (SC-376286), mouse anti-human Ki-67 monoclonal antibody
(SC-101861), mouse anti-human proliferating cell nuclear antigen
(PCNA) monoclonal antibody (sc-56), rabbit anti-human cyclin A
polyclonal antibody (sc-751) and rabbit anti-human glyceraldehyde
3-phosphate dehydrogenase (GAPDH) polyclonal antibody (sc-25778;
all from Santa Cruz Biotechnology, Inc., Santa Cruz, CA, USA).
Western blot analysis
Total protein extracts (100 mg) were subjected to
10% sodium dodecyl sulfate-polyacrylamide gels electrophoresis
(SDS-PAGE) and then transferred onto polyvinylidene difluoride
(PVDF) filter membranes (Millipore, Bedford, MA, USA). After the
membranes were blocked in 5% non-fat milk in TBST (150 mM NaCl, 20
mM Tris, 0.05% Tween-20) for 2 h, they were incubated with the
primary antibodies overnight at 4°C. After washing the membranes
with TBST 3 times for 5 min each, horseradish peroxidase-linked IgG
secondary antibodies (donkey anti-mouse IgG-HRP, sc-2314; Santa
Cruz Biotechnology, Inc.) were added followed by incubation for 2 h
at room temperature. The membranes were developed using the ECL
detection system.
Immunohistochemistry
Serial sections (5-μm-thick) were mounted on
glass slides coated with 10% polylysine and were dewaxed in xylene
and rehydrated in graded ethanol. Endogenous peroxidase activity
was blocked by soaking in 0.3% hydrogen peroxide. The sections were
then processed in 10 mmol/l citrate buffer (pH 6.0) and heated to
121°C in an autoclave for 20 min to retrieve the antigen. After
rinsing in phosphate-buffered saline (PBS, pH 7.2), the sections
were incubated with mouse anti-human CAP1 antibody (diluted
1:10,000) and mouse anti-human Ki-67 antibody (diluted 1:600) for 2
h at room temperature. Negative control slides were also processed
in parallel using a non-specific immunoglobulin IgG (Santa Cruz
Biotechnology, Inc.) at the same concentration as the primary
antibody. All slides were processed using the
peroxidase-anti-peroxidase method (Dako, Hamburg, Germany).
Following rinsing with PBS, the peroxidase reaction was visualized
by incubating the sections with the liquid mixture, DAB (0.1%
phosphate buffer solution, 0.02% diaminobenzidine
tetrahydrochloride and 3% H2O2). After
rinsing in water, the sections were counterstained with
hematoxylin, dehydrated and cover-slipped. All the immunostained
sections were observed under a Leica fluorescence microscope (Leica
Microsystems, Wetzlar, Germany).
For the assessment of CAP1 and Ki-67, at least 10
high-power fields in each specimen were randomly selected, and the
percentage of cells with nuclear and cytoplasmic staining was
examined with a total number of >500 cells counted to determine
the labeling index in a single section. Tissues with no staining
were rated as 0, with a faint staining or moderate to strong
staining in ≤25% of cells as 1, with moderate staining or strong
staining in 25–50% of cells as 2, and strong staining in ≥50% of
cells as 3. For statistical analysis, a score of <2 was counted
as low expression, while a score of ≥2 was counted as
overexpression, as previously described (24). When evaluating Ki-67 protein
immunoreaction, staining was scored in a semi-quantitative manner.
A cut-off value of 50.7% or more positively stained nuclei in 5
high-power fields were used to identify Ki-67 staining as follows:
the high expression group (≥50.7%) and low expression group
(<50.7%). All the immunostained sections were evaluated in a
blinded manner without knowledge of the clinicopathological
variables of the patients. In half of the samples, staining was
repeated twice to avoid technical errors, but similar results were
obtained in these samples.
Cell culture
The human EOC cells, HO-8910, were purchased from
the Shanghai Institute of Cell Biology and cultured in RPMI-1640
supplemented with 10% heat-inactivated fetal calf serum and 100
U/ml penicillin-streptomycin mixture (both from Gibco-BRL, Grand
Island, NY, USA) at 37°C and 5% CO2.
Cell cycle analysis
Cells were harvested at the proper time and fixed in
70% ethanol overnight at 4°C and then incubated with 1 mg/ml RNase
A for 30 min at 37°C. Subsequently, the cells were stained with
propidium iodide (PI, 50 mg/ml; Becton-Dickinson, San Jose, CA,
USA) in PBS, 0.5% Tween-20, and analyzed using a flow cytometer BD
FACScan (Becton-Dickinson, San Jose, CA, USA) as well as CellQuest
acquisition and analysis programs. As regards cell synchronization,
serum deprivation was used for cell cycle G1-S phase arrest.
siRNA and transfection
Duplex siRNAs were synthesized as follows by Biomics
Biotechnologies Co., Ltd. (Nantong, China): The sequences were as
follows CAP1-specific, 5′-GAAAUGAA UGAUGCCAdTdT-3′ and control,
5′-UGGCGGCAUUCAUU UCdTdT-3′. The HO-8910 cells were seeded the day
prior to transfection at a confluence of 50–70%. In addition, a
Mock group with no transfection was also used as a control. The
transient transfection of CAP1 and non-specific siRNA oligos was
carried out using Lipofectamine 2000 (Invitrogen, St. Louis, MO,
USA) in accordance with the manufacturer’s instructions. The cells
were harvested 48 h after transfection and used for the experiment.
The experiments were repeated at least 3 times.
Cell proliferation assay
The cell counting kit-8 (CCK-8) was used to measure
cell proliferation according to the manufacturer’s instructions
(Dojindo, Kumamoto, Japan). The cells were seeded into a 96-well
cell culture cluster plates (Corning, Inc., Corning, NY, USA) at a
concentration of 2×10⁴ cells/well in a volume of 100
μl culture medium and grown overnight. CCK-8 reagents
(Dojindo) were then added to each well followed by incubation for
an additional 2 h at 37°C. The absorbency was measured at a test
wavelength of 490 nm and a reference wavelength of 630 nm using a
microplate reader (Bio-Rad, Hercules, CA, USA). The experiments
were repeated at least 3 times.
Statistical analysis
All statistical analyses were performed using SPSS
17.0 statistical software. The association between CAP1 and Ki-67
expression and clinicopathological characteristics was analyzed
using Pearson’s χ2 test. Multivariate analysis was
performed using Cox’s proportional hazards model. CAP1 and Ki-67
expression was quantified using Pearson’s correlation co-efficient.
Kaplan-Meier analysis was used to evaluate the survival curve, and
the log-rank test was performed for analysis.
Results
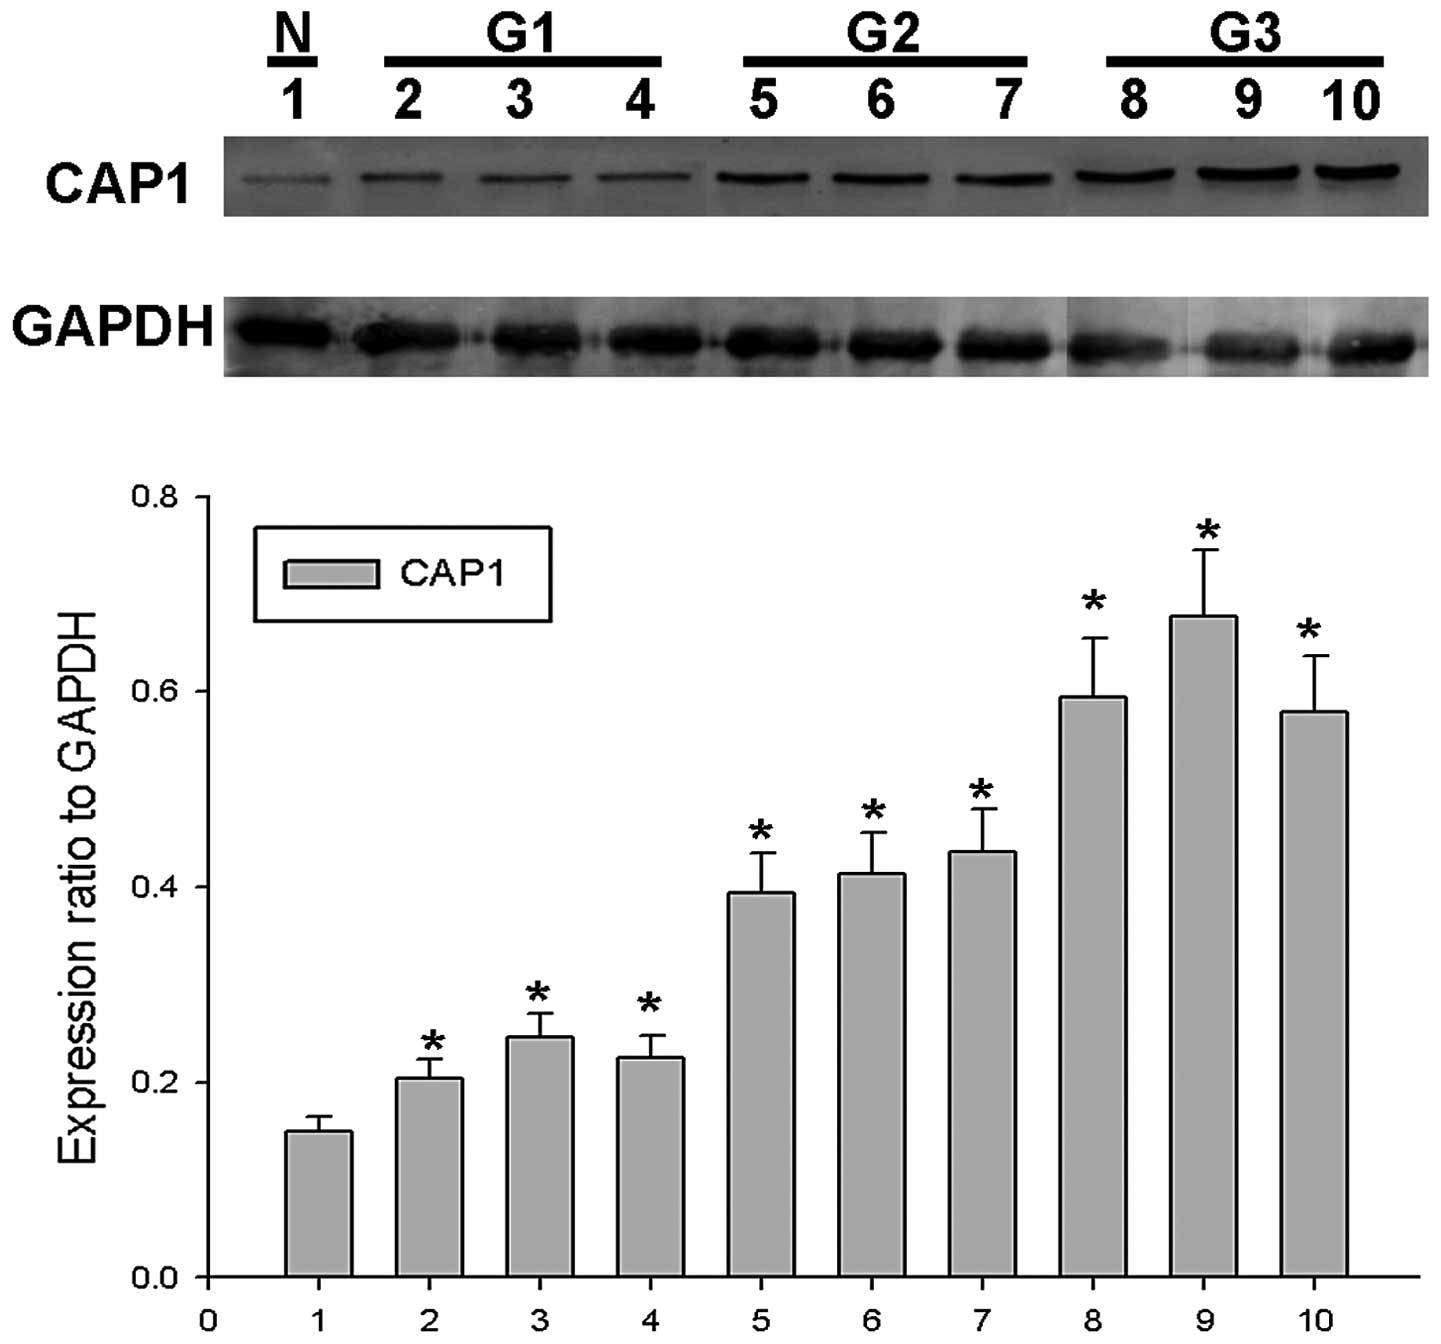
CAP1 is overexpressed in EOC tissues
To confirm the role of CAP1 in EOC, western blot
analysis for CAP1 was performed using surgical specimens. We found
that CAP1 protein expression gradually increased in 9 EOC tissues
from 3 tumors classified as G1 to G3 (3 tissues from each tumor) in
comparison with 1 normal ovarian tissue sample in which CAP1
expression was barely detected (Fig.
1). In order to determine the role of CAP1 in the progression
and development of EOC, we examined the intracellular expression of
CAP1 and Ki-67 in 119 specimens of EOC by immunohistochemical
analysis. We found that CAP1 was mainly located in the cytoplasm of
the EOC cells (Fig. 2). The high
expression of CAP1 was accompanied by the high expression of Ki-67
localized in the nucleus. In addition, CAP1 was highly expressed in
the poorly differentiated tumor specimens compared to the well
differentiated ones; similar results were obtained for Ki-67
expression.
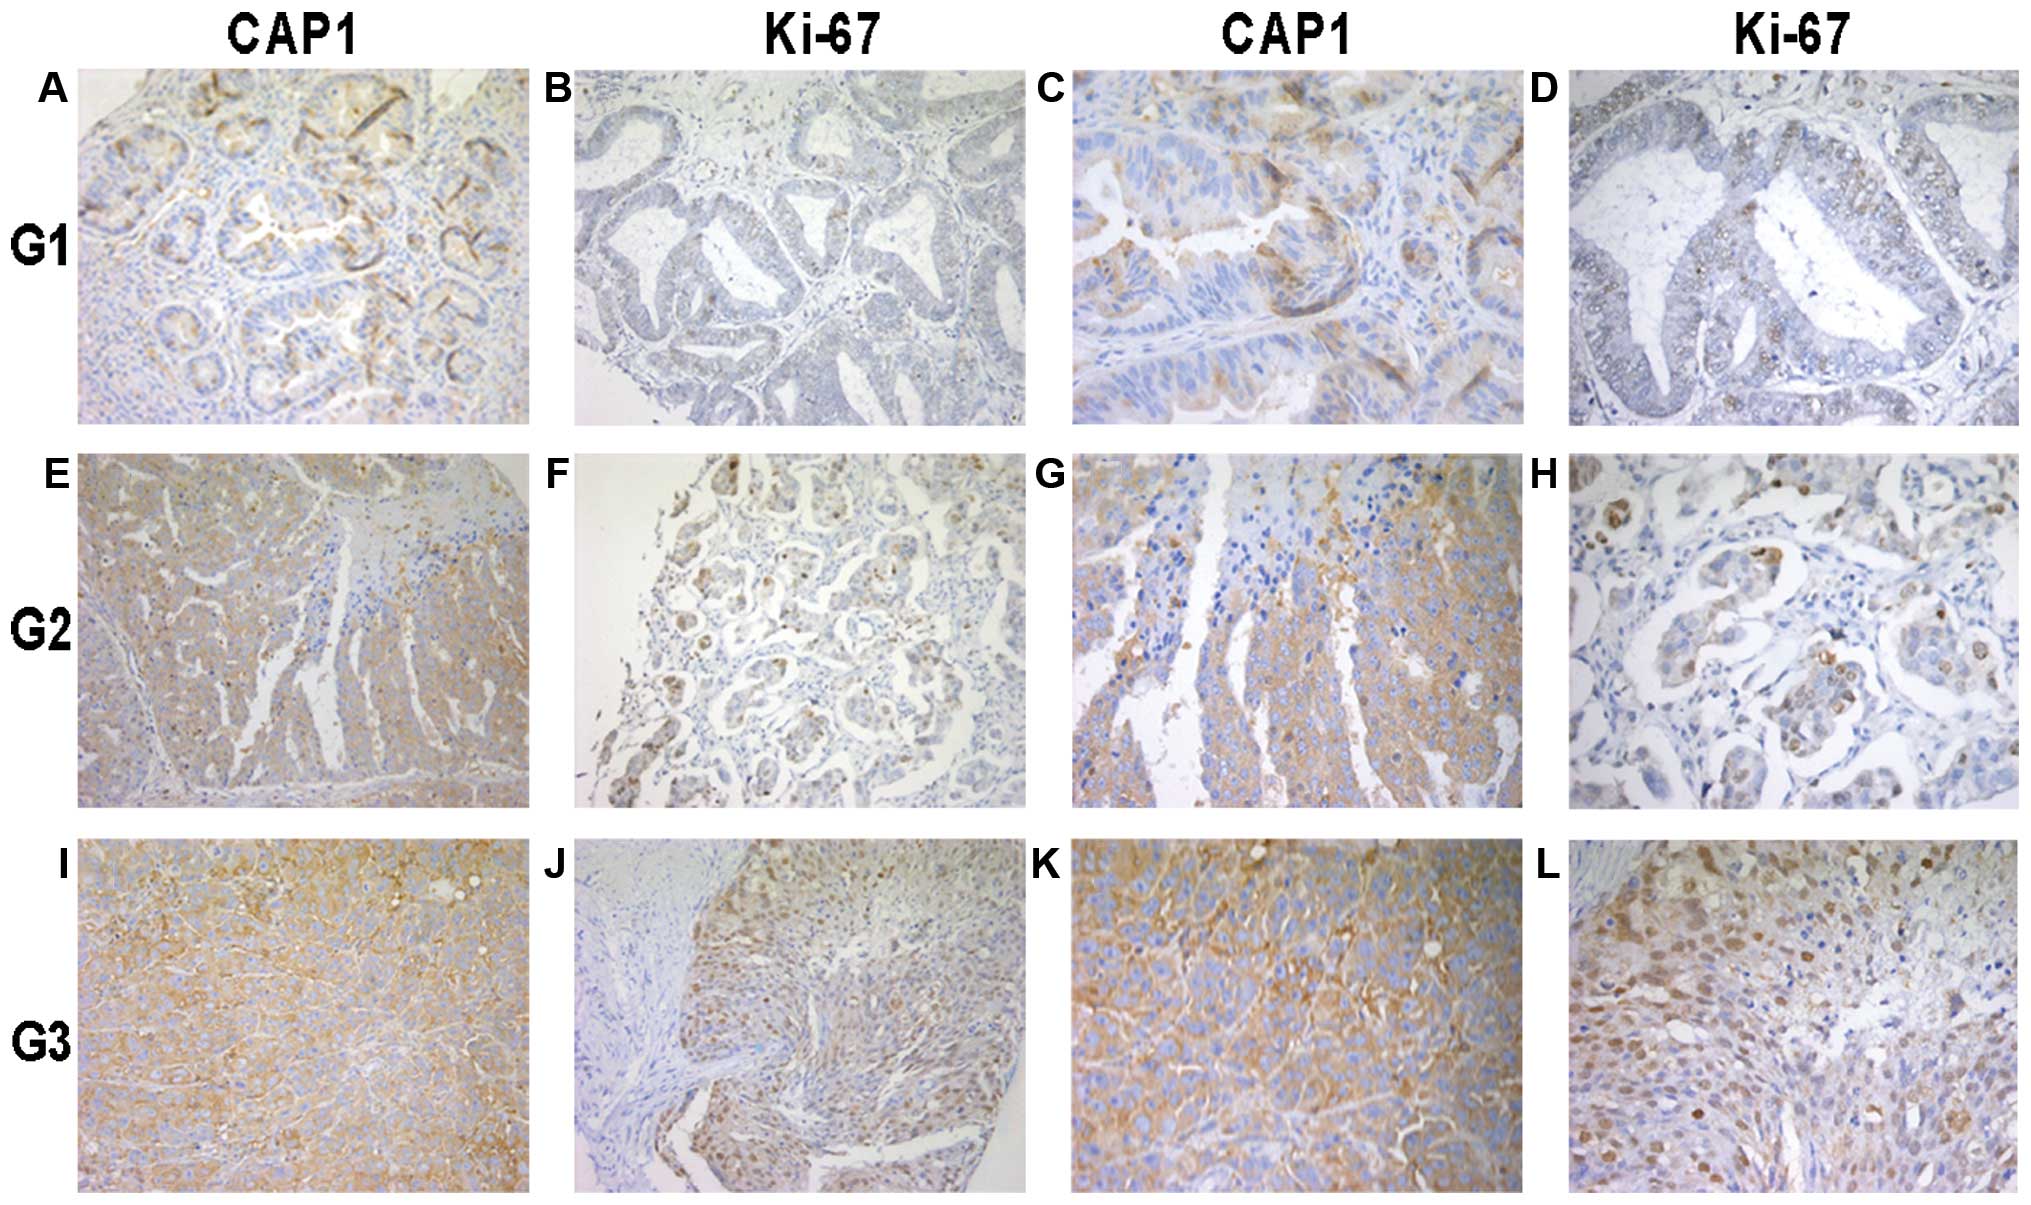 | Figure 2Immunohistochemical analysis of
cyclase-associated protein 1 (CAP1) and Ki-67 expression in the 119
epithelial ovarian cancer (EOC) tissue specimens. Paraffin-embedded
tissue sections were stained with antibodies to CAP1 and Ki-67 and
counterstained with hematoxylin. (A-D) CAP1 and Ki-67
immunoreactivity in cancer tissue from a tumor classified as grade
1 (G1). (E-H) CAP1 and Ki-67 staining in cancer tissue from a tumor
classified as grade 2 (G2). (I-L) CAP1 and Ki-67 staining in cancer
tissue from a tumor classified as grade 3 (G3). The experiment
details were described in ‘Materials and methods’. (A, B, E, F, I
and J) images at magnification, x200. (C, D, G, H, K and L) images
at magnification, x400. |
Correlation of CAP1 expression with
clinicopathologic characteristics in EOC
To clarify the clinicopathological significance of
CAP1, we analyzed the correlation of CAP1 expression with the
clinicopathologic characteristics of patients with EOC (Table I). We divided the tumor specimens
into 2 groups according to the expression of CAP1. CAP1 expression
was significantly associated with the histological grade (P=0.010)
and Ki-67 expression (P<0.001), whereas there was no correlation
observed with the FIGO stage (P=0.477), menopause (P=0.395),
ascites (P=0.666), lymph node status (P=0.209), malignant tumor
cells (P=0.472), metastases to other organs (P=0.666), age
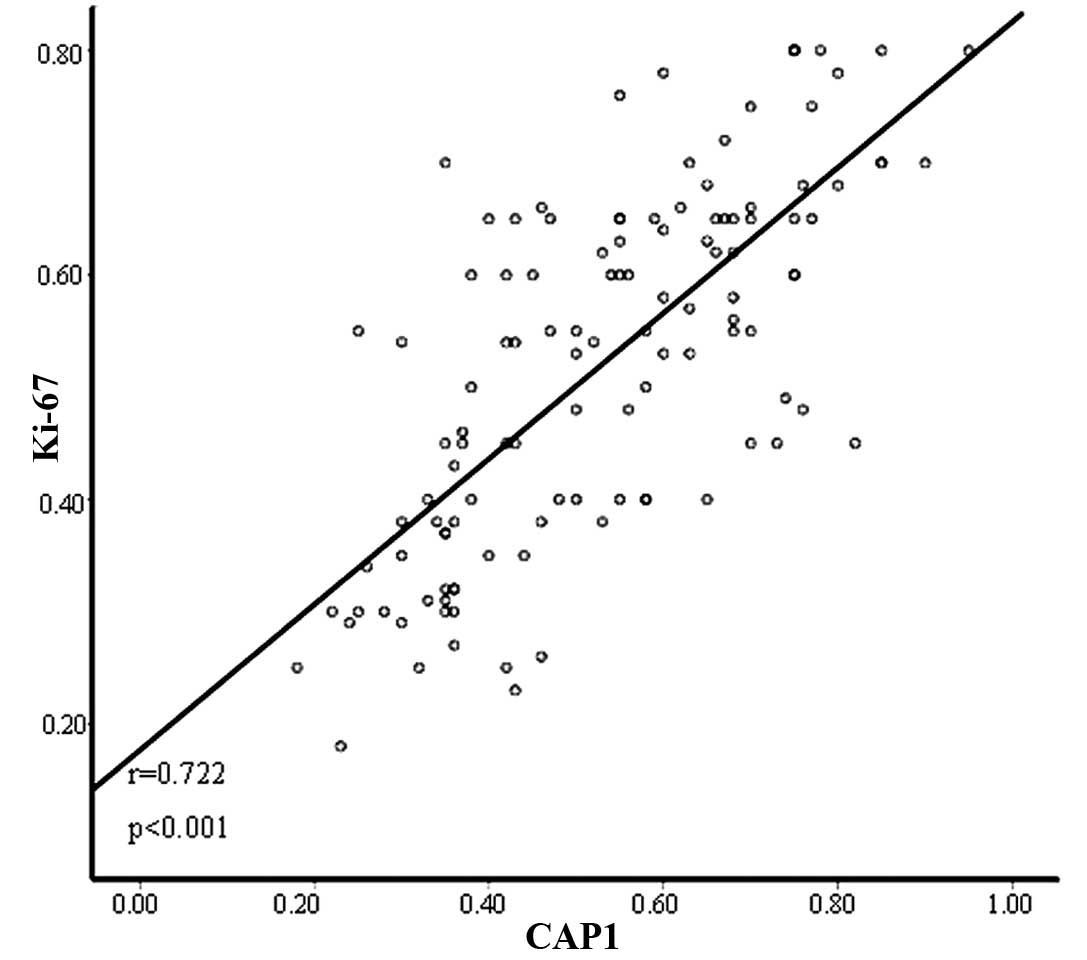
(P=0.775) and histologic subtype (P=0.071). In addition, Pearson’s
correlation co-efficient revealed that there was a positive
correlation between CAP1 expression and Ki-67 expression (r=0.722,
P<0.001) (Fig. 3).
Expression of CAP1 and prognosis of
EOC
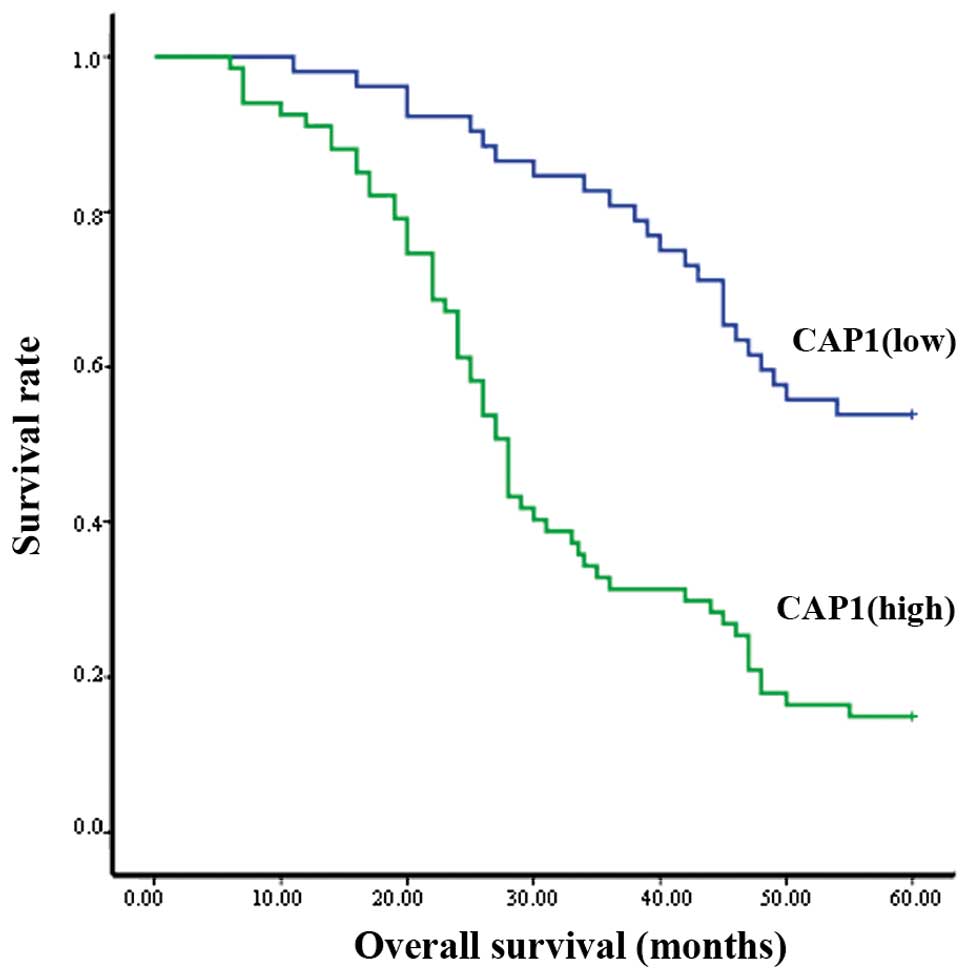
Kaplan-Meier analysis revealed that out of the 119
clinical cases examined, the patients with a high expression of
CAP1 had a poorer overall survival than those with a lower
expression (P<0.001; Fig. 4).
Pearson’s χ2 test indicated that the histological grade
(P=0.047), CAP1 (P<0.001) and Ki-67 (P<0.001) were
independent prognostic indicators of EOC (Table II). Moreover, multivariate
analysis using Cox’s proportional hazards model showed that the
histological grade (P<0.001), CAP1 (P= 0.029) and Ki-67
(P<0.001) were independent prognostic indicators for patient
overall survival (Table III).
The survival curve indicated that the median survival for patients
with a high CAP1 expression was significantly shorter than the
median survival for those patients with a low CAP1 expression
(Fig. 4).
| Table IISurvival status and
clinicopathological characteristics in the 119 human ovarian cancer
specimens. |
Table II
Survival status and
clinicopathological characteristics in the 119 human ovarian cancer
specimens.
| Clinicopathological
characteristics | Total | Survival status
| P-valuea |
|---|
| Alive | Deceased |
|---|
| Age (years) | | | | 0.099 |
| ≤50 | 35 | 15 | 20 | |
| >50 | 84 | 23 | 61 | |
| FIGO stage, n
(%) | | | | 0.655 |
| I | 38 | 15 | 23 | |
| II | 31 | 8 | 23 | |
| III | 33 | 10 | 23 | |
| IV | 17 | 5 | 12 | |
| Histological grade,
n (%) | | | | 0.047b |
| 1 | 15 | 5 | 10 | |
| 2 | 33 | 5 | 28 | |
| 3 | 71 | 28 | 43 | |
| Histological
subtype, n (%) | | | | 0.229 |
| Serous | 45 | 19 | 26 | |
| Mucinous | 16 | 3 | 13 | |
| Endometrioid | 14 | 5 | 9 | |
| Clear cell | 14 | 5 | 9 | |
| Others | 30 | 6 | 24 | |
| Menopause | | | | 0.081 |
| Absent | 43 | 18 | 25 | |
| Present | 76 | 20 | 56 | |
| Lymph node status,
n (%) | | | | 0.217 |
| Negative | 87 | 25 | 62 | |
| Positive | 32 | 13 | 19 | |
| Ascites, n (%) | | | | 0.051 |
| Absent | 66 | 26 | 40 | |
| Present | 53 | 12 | 41 | |
| Malignant tumor
cells in peritoneal fluid, n (%) | | | | 0.135 |
| Absent | 90 | 32 | 58 | |
| Present | 29 | 6 | 23 | |
| Metastases to other
organs, n (%) | | | | 0.051 |
| Absent | 66 | 26 | 40 | |
| Present | 53 | 12 | 41 | |
| CAP1 | | | | <0.001b |
| Low
expression | 52 | 28 | 24 | |
| High
expression | 67 | 10 | 57 | |
| Ki-67 | | | | <0.001b |
| Low
expression | 50 | 34 | 16 | |
| High
expression | 69 | 4 | 65 | |
| Table IIIContribution of various potential
prognostic factors to survival by Cox regression analysis of the
119 human ovarian cancer specimens. |
Table III
Contribution of various potential
prognostic factors to survival by Cox regression analysis of the
119 human ovarian cancer specimens.
| Hazard ratio | P-value | 95.0% CI |
|---|
| Histological
grade | 0.552 | <0.001a | 0.396–0.770 |
| CAP1
expression | 0.548 | 0.029a | 0.319–0.941 |
| Ki-67
expression | 6.161 | <0.001a | 3.256–11.655 |
CAP1 expression and cell cycle
progression
It has been reported that the knockdown of the
expression of CAP1 affects the breast cancer cell cycle, inhibiting
the growth of breast cancer cancer (25). In this study, we found that a high
CAP1 expression associated with a poor prognosis of patients with
EOC. Thus, we hypothesized that CAP1 participates in the cell cycle
of HO-8910 cells. We subjected the cells to serum starvation and
serum re-feeding and found that the expression of CAP1 gradually
increased, as well as that of the proliferation markers, PCNA and
cyclin A, during cell progression. Flow cytometric analysis
revealed that the HO-8910 cells subjected to serum deprivation for
48 h were arrested in the G1 phase, and following serum re-feeding,
the population of HO-8910 cells in the S phase increased from 18.08
to 61.12% (Fig. 5C). To further
validate these results, we collected HO-8910 cellular protein at
different time points, and western blot analysis was performed to
determine whether CAP1 expression is cell cycle-dependent in
HO-8910 cells. We found that CAP1 expression was significantly
increased as early as 4 h following serum re-feeding in the HO-8910
cells. The expression of the cell proliferation markers, PCNA and
cyclin A, showed a similar tendency (Fig. 5A and B).
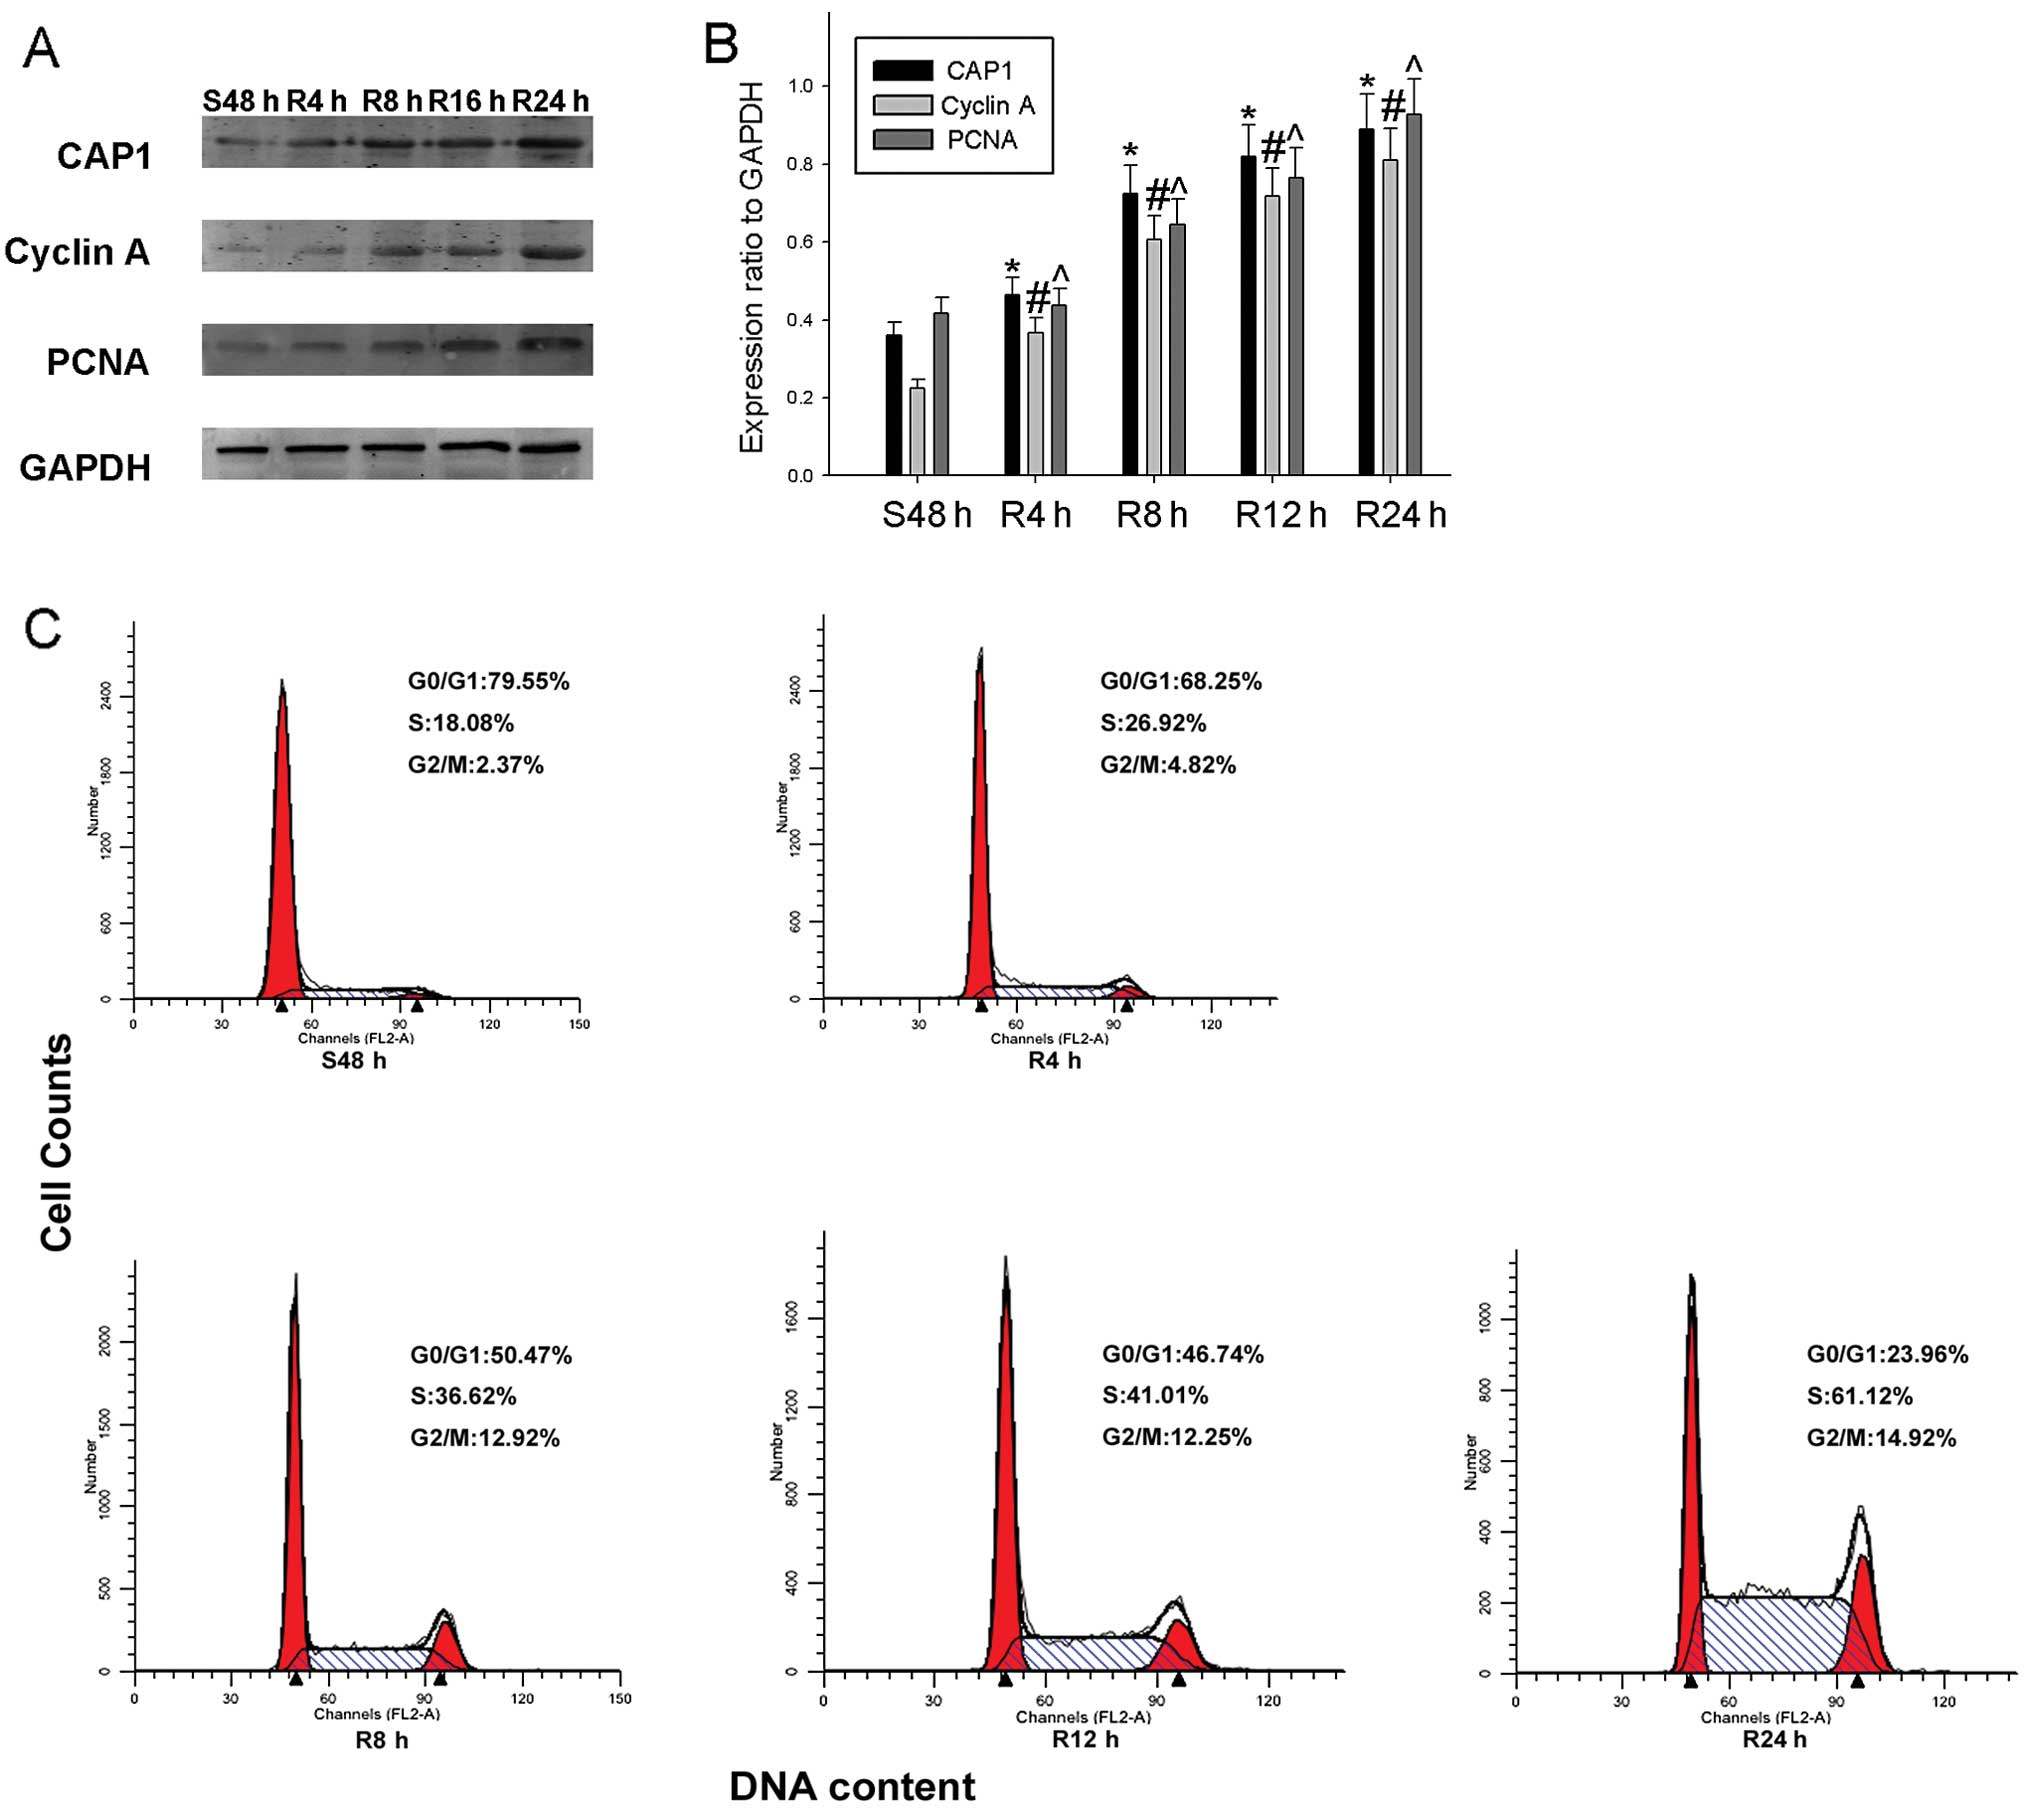 | Figure 5Expression of cyclase-associated
protein 1 (CAP1) and cell cycle-related molecules in proliferating
HO-8910 cells. (A) Cells were serum-starved for 48 h and following
serum re-feeding, cell lysates were prepared and analyzed by
western blot analysis using antibodies directed against CAP1,
proliferating cell nuclear antigen (PCNA) and cyclin A. GAPDH was
used as a control for protein loading and integrity. (B) The
histogram demonstrates the ratio of CAP1, PCNA and cyclin A protein
to GAPDH for each time point by densitometry. (C) Flow cytometric
quantification of cell cycle progression in HO-8910. The cells were
serum-starved for 48 h, and medium containing 10% fetal bovine
serum (FBS) was then added for the indicated periods of time (0, 4,
8, 12 and 24 h). Data are the means ± standard error of the mean
(SEM) of 3 independent experiments. n=3, *,#,^P<0.05,
compared with control cells serum-starved for 48 h. |
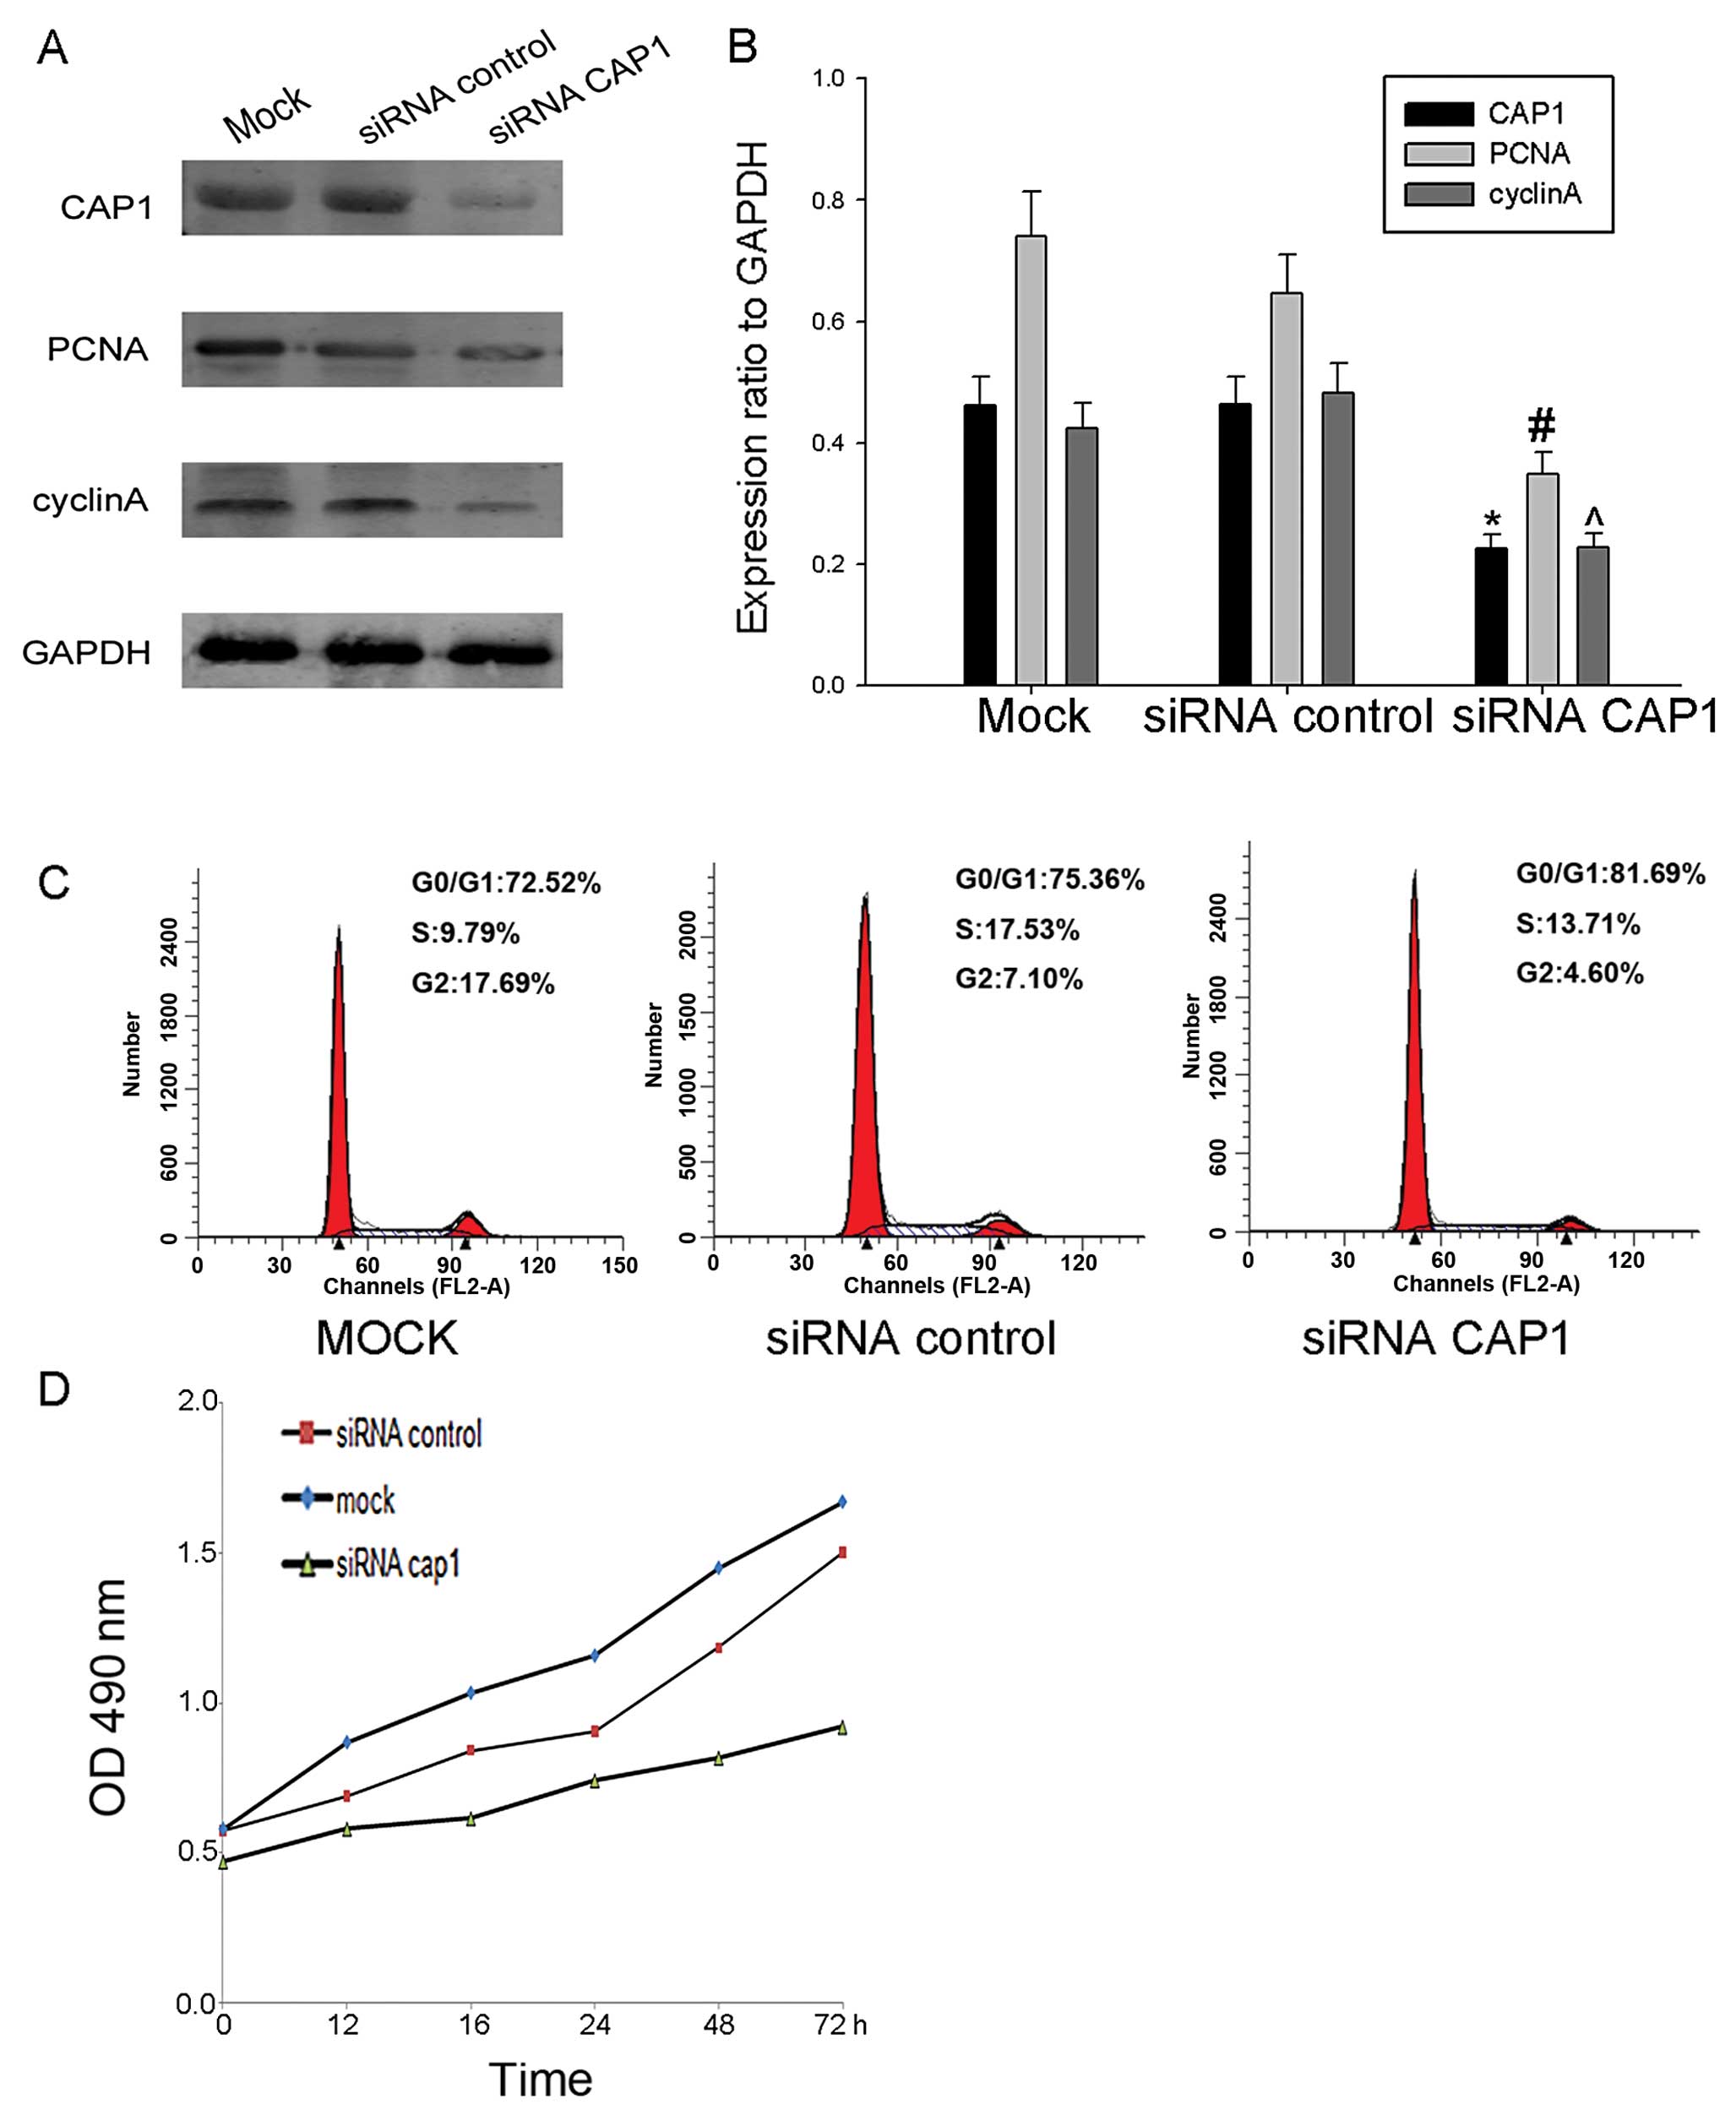
Knockdown of CAP1 inhibits the
proliferation of HO-8910 cells
To further determine the effect of CAP1 on cell
proliferation, we knocked down endogenous CAP1 in HO-8910 cells
using siRNA targeting CAP1 and the effects to the cells transfected
with control siRNA and mock siRNA (Fig. 6A and B). The knockdown of CAP1
using siRNA inhibited the accumulation of cyclin A and PCNA
compared with control- and mock-transfected cells (Fig. 6A and B). Additionally, we found
that the proliferation rate of the HO-8910 cells transfected with
siRNA exhibited a decrease compared with the cells transfected with
the control siRNA and the mock-transfected cells (Fig. 6D). From these results, we
ascertained that CAP1 plays a positive role in the regulation of
cell proliferation.
Discussion
CAP1, a member of the CAP family in mammalian cells,
was first identified as a component of the yeast adenylyl cyclase
complex and conserved in all eukaryotic organisms. The CAP family
contains 4 highly conserved protein domains, one of which is the
N-terminal which interacts with adenylyl cyclase and induces the
activity of RAS following exogenous signals, whereas the C-terminal
half of CAPs is involved in the cell differentiation and
depolymerization of the F-actin filamentactin (28). As a monomeric actin binding
protein, CAP is involved in cell polarization, the distribution of
actin filaments and mRNA in a Dictyostelium (29). The expression of CAP is associated
with an abnormally large cell size, random budding pattern and an
abnormal actin distribution in yeast (30,31).
A number of scholars have started to investigate the
association between CAP1 and cancer. CAP1 has been to be commonly
overexpressed in pancreatic cancers, and its level in clinical
cases has been shown to be associated with neuronal invasion and
lymph node metastasis. The knockdown CAP1 has been shown to reduce
cell motility and migration (32). It has been reported that CAP1 is
upregulated in breast cancer. After knocking down its expression,
the proliferation and migration of MDA-MB-231 cells was shown to
decrease, inducing changes in morphology, which were associated
with the arrangement of F-actin (25). Western blot analysis, real-time
PCR and immunohistochemical analysis have been used to prove that
CAP1 is overexpressed in hepatocellular carcinoma compared with
adjacent non-cancerous liver tissues, and that it is positively
associated with HCC cell metastasis (24). CAP1 overexpression has been shown
to be significantly associated with lymph node status in esophageal
squamous cell carcinoma. The knockdown of CAP1 in TE1 cells has
been shown to result in a decreased migration capability and the
overexpression of CAP1 promotes TE1 cell migration (27). In this study, we found that CAP1
was overexpressed in EOC. Using immunohistochemistry, we found that
CAP1 was highly expressed in poorly differentiated specimens
compared to well differentiated ones, and similar results were
obtained for Ki-67 expression. Kaplan-Meier analysis revealed that
out of the 119 clinical cases, the patients with a high expression
of CAP1 had a poorer overall survival than those with a lower CAP1
expression. In addition, the knockdown of CAP1 expression in an
in vitro experiment revealed that the loss of CAP1 inhibit
the proliferation of HO-8910 cells.
It has been demonstrated that the morphologic
changes of malignant tumor cells enhance the migration capacity of
the cells and lead to invasion and metastasis (33). To a certain degree, the
maintainance and changes in the structure and function of cells are
achieved by regulating the structure and function of the actin
cytoskeleton, which is the key to the reorganization of the actin
cytoskeleton. When stimulated, CAP regulates the polymerization and
disassembly of downstream actin protein, thus affecting the growth
and differentiation of cells. CAP1 also takes part in accelerating
the turnover of actin filaments by the recycling of cofilin and
actin on both ends of the actin filament (34). Therefore, we hyopthesized that the
molecular mechanisms of action of CAP1 in the pathogenesis of EOC
may involve its downstream actin protein. However, further studies
are required to identify the precise signaling pathways
involved.
As CAP1 is overexpressed in EOC, it may thus serve
as a prognostic marker for EOC. Using western blot analysis, we
found that the expression of CAP1 was higher in the 9 EOC tissues
compared to the 1 normal tissue, in which CAP1 expression was
barely detected. Furthermore, immunohistochemistry of the 119
paraffin-embedded tissue sections of EOC also revealed that CAP1
immunostaining was located in the cytoplasm and was upregulated in
the poorly differentiated tumor cells compared to the well
differentiated ones. These results were similar to those obtained
for Ki-67 expression, highlighting that CAP1 expression
significantly correlated with the proliferation of EOC cells. The
association between CAP1 and markers of the cell cycle was then
detected by a starvation-release experiment.
In conclusion, this study demonstrates that CAP1 is
an independent prognostic factor in EOC. Our data suggest that CAP1
plays an important role in cell proliferation in EOC and that CAP1
may be a potential therapeutic target in EOC chemotherapy.
Acknowledgments
This study was supported by a grant from the
National Natural Science Foundation of China (no. 81302285).
References
|
1
|
Menczer J, Chetrit A and Sadetzki S;
National Israel Ovarian Cancer Group: Uterine metastases in ovarian
carcinoma: frequency and survival in women who underwent
hysterectomy. J Gynecol Oncol. 21:191–195. 2010. View Article : Google Scholar : PubMed/NCBI
|
|
2
|
Park B, Park S, Kim TJ, et al:
Epidemiological characteristics of ovarian cancer in Korea. J
Gynecol Oncol. 21:241–247. 2010. View Article : Google Scholar
|
|
3
|
Chang E, Heo KS, Woo CH, et al: MK2
SUMOylation regulates actin filament remodeling and subsequent
migration in endothelial cells by inhibiting MK2 kinase and HSP27
phosphorylation. Blood. 117:2527–2537. 2011. View Article : Google Scholar :
|
|
4
|
Kirfel G, Rigort A, Borm B and Herzog V:
Cell migration: mechanisms of rear detachment and the formation of
migration tracks. Eur J Cell Biol. 83:717–724. 2004. View Article : Google Scholar
|
|
5
|
Hall A: The cytoskeleton and cancer.
Cancer Metastasis Rev. 28:5–14. 2009. View Article : Google Scholar : PubMed/NCBI
|
|
6
|
Makkonen M, Bertling E, Chebotareva NA,
Baum J and Lappalainen P: Mammalian and malaria parasite
cyclase-associated proteins catalyze nucleotide exchange on G-actin
through a conserved mechanism. J Biol Chem. 288:984–994. 2013.
View Article : Google Scholar :
|
|
7
|
Fedor-Chaiken M, Deschenes RJ and Broach
JR: SRV2, a gene required for RAS activation of adenylate cyclase
in yeast. Cell. 61:329–340. 1990. View Article : Google Scholar : PubMed/NCBI
|
|
8
|
Field J, Vojtek A, Ballester R, et al:
Cloning and characterization of CAP, the S. cerevisiae gene
encoding the 70 kd adenylyl cyclase-associated protein. Cell.
61:319–327. 1990. View Article : Google Scholar : PubMed/NCBI
|
|
9
|
Peche V, Shekar S, Leichter M, et al:
CAP2, cyclase-associated protein 2, is a dual compartment protein.
Cell Mol Life Sci. 64:2702–2715. 2007. View Article : Google Scholar : PubMed/NCBI
|
|
10
|
Matviw H, Yu G and Young D: Identification
of a human cDNA encoding a protein that is structurally and
functionally related to the yeast adenylyl cyclase-associated CAP
proteins. Mol Cell Biol. 12:5033–5040. 1992.PubMed/NCBI
|
|
11
|
Zelicof A, Gatica J and Gerst JE:
Molecular cloning and characterization of a rat homolog of CAP, the
adenylyl cyclase-associated protein from Saccharomyces cerevisiae.
J Biol Chem. 268:13448–13453. 1993.PubMed/NCBI
|
|
12
|
Yu G, Swiston J and Young D: Comparison of
human CAP and CAP2, homologs of the yeast adenylyl
cyclase-associated proteins. J Cell Sci. 107:1671–1678.
1994.PubMed/NCBI
|
|
13
|
Swiston J, Hubberstey A, Yu G and Young D:
Differential expression of CAP and CAP2 in adult rat tissues. Gene.
165:273–277. 1995. View Article : Google Scholar : PubMed/NCBI
|
|
14
|
Pollard TD and Cooper JA: Actin, a central
player in cell shape and movement. Science. 326:1208–1212. 2009.
View Article : Google Scholar : PubMed/NCBI
|
|
15
|
Baum B, Li W and Perrimon N: A
cyclase-associated protein regulates actin and cell polarity during
Drosophila oogenesis and in yeast. Curr Biol. 10:964–973. 2000.
View Article : Google Scholar : PubMed/NCBI
|
|
16
|
Baum B and Perrimon N: Spatial control of
the actin cytoskeleton in Drosophila epithelial cells. Nat Cell
Biol. 3:883–890. 2001. View Article : Google Scholar : PubMed/NCBI
|
|
17
|
Hubberstey AV and Mottillo EP:
Cyclase-associated proteins: CAPacity for linking signal
transduction and actin polymerization. FASEB J. 16:487–499. 2002.
View Article : Google Scholar : PubMed/NCBI
|
|
18
|
Kang CM and Jiang YW: Genome-wide survey
of non-essential genes required for slowed DNA synthesis-induced
filamentous growth in yeast. Yeast. 22:79–90. 2005. View Article : Google Scholar : PubMed/NCBI
|
|
19
|
Yusof AM, Hu NJ, Wlodawer A and Hofmann A:
Structural evidence for variable oligomerization of the N-terminal
domain of cyclase-associated protein (CAP). Proteins. 58:255–262.
2005. View Article : Google Scholar
|
|
20
|
Loisel TP, Boujemaa R, Pantaloni D and
Carlier MF: Reconstitution of actin-based motility of Listeria and
Shigella using pure proteins. Nature. 401:613–616. 1999. View Article : Google Scholar : PubMed/NCBI
|
|
21
|
Pollard TD, Blanchoin L and Mullins RD:
Molecular mechanisms controlling actin filament dynamics in
nonmuscle cells. Annu Rev Biophys Biomol Struct. 29:545–576. 2000.
View Article : Google Scholar : PubMed/NCBI
|
|
22
|
Bertling E, Hotulainen P, Mattila PK,
Matilainen T, Salminen M and Lappalainen P: Cyclase-associated
protein 1 (CAP1) promotes cofilin-induced actin dynamics in
mammalian nonmuscle cells. Mol Biol Cell. 15:2324–2334. 2004.
View Article : Google Scholar : PubMed/NCBI
|
|
23
|
Wang C, Zhou GL, Vedantam S, Li P and
Field J: Mitochondrial shuttling of CAP1 promotes actin- and
cofilin-dependent apoptosis. J Cell Sci. 121:2913–2920. 2008.
View Article : Google Scholar : PubMed/NCBI
|
|
24
|
Liu Y, Cui X, Hu B, et al: Upregulated
expression of CAP1 is associated with tumor migration and
metastasis in hepatocellular carcinoma. Pathol Res Pract.
210:169–175. 2014. View Article : Google Scholar
|
|
25
|
Yu XF, Ni QC, Chen JP, et al: Knocking
down the expression of adenylate cyclase-associated protein 1
inhibits the proliferation and migration of breast cancer cells.
Exp Mol Pathol. 96:188–194. 2014. View Article : Google Scholar : PubMed/NCBI
|
|
26
|
Tan M, Song X, Zhang G, et al:
Overexpression of adenylate cyclase-associated protein 1 is
associated with metastasis of lung cancer. Oncol Rep. 30:1639–1644.
2013.PubMed/NCBI
|
|
27
|
Li M, Yang X, Shi H, et al: Downregulated
expression of the cyclase-associated protein 1 (CAP1) reduces
migration in esophageal squamous cell carcinoma. Jpn J Clin Oncol.
43:856–864. 2013. View Article : Google Scholar : PubMed/NCBI
|
|
28
|
Zelicof A, Protopopov V, David D, Lin XY,
Lustgarten V and Gerst JE: Two separate functions are encoded by
the carboxyl-terminal domains of the yeast cyclase-associated
protein and its mammalian homologs. Dimerization and actin binding.
J Biol Chem. 271:18243–18252. 1996. View Article : Google Scholar : PubMed/NCBI
|
|
29
|
Noegel AA, Blau-Wasser R, Sultana H, et
al: The cyclase-associated protein CAP as regulator of cell
polarity and cAMP signaling in Dictyostelium. Mol Biol Cell.
15:934–945. 2004. View Article : Google Scholar :
|
|
30
|
Gerst JE, Ferguson K, Vojtek A, Wigler M
and Field J: CAP is a bifunctional component of the Saccharomyces
cerevisiae adenylyl cyclase complex. Mol Cell Biol. 11:1248–1257.
1991.PubMed/NCBI
|
|
31
|
Vojtek A, Haarer B, Field J, et al:
Evidence for a functional link between profilin and CAP in the
yeast S cerevisiae. Cell. 66:497–505. 1991. View Article : Google Scholar : PubMed/NCBI
|
|
32
|
Yamazaki K, Takamura M, Masugi Y, et al:
Adenylate cyclase-associated protein 1 overexpressed in pancreatic
cancers is involved in cancer cell motility. Lab Invest.
89:425–432. 2009. View Article : Google Scholar : PubMed/NCBI
|
|
33
|
Friedl P and Wolf K: Tumour-cell invasion
and migration: diversity and escape mechanisms. Nat Rev Cancer.
3:362–374. 2003. View
Article : Google Scholar : PubMed/NCBI
|
|
34
|
Moriyama K and Yahara I: Human CAP1 is a
key factor in the recycling of cofilin and actin for rapid actin
turnover. J Cell Sci. 115:1591–1601. 2002.PubMed/NCBI
|