Introduction
Esophageal cancer (EC) is one of the most common
human malignancies with a high mortality rate worldwide, and is
much more common (by 3–4-fold) in males than females (1). The etiological factors of EC have
been well-established by epidemiological studies, investigating
living conditions, diet, nutrition and genetic susceptibility. EC
occurs in the middle or upper one-third of the esophagus in form of
esophageal squamous cell carcinoma (ESCC), while in the lower
one-third or junction of the esophagus and stomach, EC occurs as
esophageal adenocarcinoma (EAC) (2). Only a small number of patients with
EC survive for >5 years with surgical treatment, and >60% of
patients succumb to the disease due to distant metastasis and local
recurrence. One reason for the high mortality rate associated with
EC is that the majority of patients are diagnosed at the advanced
stage of EC when they hospitalized (3). Therefore, it is important to
identify the biological markers of EC in order to improve the rate
of early diagnosis and to develop new treatment strategies to
combat the disease.
MicroRNAs (miRNAs or miRs) are a recently discovered
class of short non-coding RNAs, approximately 18–24 nucleotides in
length (4), which bind to the
3′-untranslated regions (3′-UTRs) of target mRNAs mainly through
complementary base pairing in their mature form, leading to target
mRNA degradation or the inhibition of protein synthesis,
consequently regulating gene expression at the post-transcriptional
level (5,6). miRNAs can serve as either oncogenes
or tumor suppressor and play a vital role in cancer development and
cellular processes, including proliferation, apoptosis and
migration. Furthermore, it has been demonstrated that the abnormal
expression of miRNAs is associated with the development and
progression of cancer and has prognostic significance for ESCC
(7,8). Therefore, miRNAs may be new
biological markers for ESCC.
Previous studies have reported that miR-218 is
significantly downregulated in ESCC tissues compared with adjacent
non-cancerous tissues (9,10). In addition, recent studies have
indicated that miR-218 inhibits cancer occurrence and development
in various types of cancer, mainly through the inhibition of cancer
cell proliferation and invasion by targeting cancer genes (11,12). However, the role of miR-218 in
regulating ESCC development is poorly understood. BMI1, a
component of the polycomb repressive complex 1, was initially
identified as an oncogene that cooperates with c-Myc in inducing
lymphomas in double transgenic mice (13). In the present study, we
demonstrated the decreased expression of miR-218 and the high
expression of BMI1 in ESCC tissues from 33 clinical patients
and in ESCC cell lines. We systematically verified that miR-218
targets BMI1 and downregulates its expression in ESCC cells,
and identified an inverse correlation between BMI1 levels
and miR-218 in ESCC cell lines and tissues.
Materials and methods
Patient sample collection
A total of 33 pairs of eligible esophageal mucosa
samples from patients with ESCC were collected from the First
Affiliated Hospital of Soochow University, Suzhou, China between
July 2011 and April 2013. Each patient provided written informed
consent for their tissue samples to be used for research purposes.
The present study was approved by the Ethics Committee of Soochow
University and the Scientific Advisory Panel of our institute.
Cell culture
Human esophageal epithelial cells (HEECs) and ESCC
cell lines (EC109, TE-1, EC9706 and KYSE150) were obtained from the
Chinese Academy of Sciences (Shanghai, China) and cultured in
RPMI-1640 medium (Invitrogen, Carlsbad, CA, USA) containing 10%
fetal bovine serum (FBS) and 1% penicillin/streptomycin
(Invitrogen). All cells were cultured in a humidified chamber
containing 5% CO2 at 37°C.
Bioinformatics analysis
TargetScan software (http://www.targetscan.org), miDRB software (http://mirdb.org/cgi-bin/search.cgi) and
miRecords software (http://www.mirbase.org) use two ways to search for
predicted miRNA targets. One is searching the name of the miRNA
(enter the name of the required miRNA and view its predicted
targets). Another is searching by gene target information (enter
the GenBank Accession No., NCBI Gene ID or Gene Symbol and view the
miRNAs which target the gene of interest.
Construction of plasmids, cell
transfection and dual-luciferase assay
To construct a BMI1 overexpression plasmid,
the BMI1 expression construct was generated by PCR to
amplify a 2293-bp fragment encoding the BMI1 cDNA (without
3′-UTR) which was obtained by reverse transcription-polymerase
chain reaction (RT-PCR) using RNA from the EC109 cells. The sense
primer (5′-CGCGGATCCATGAGAGGCAGAGATCGGGG-3′) contains a
BamHI restriction site and the antisense primer
(5′-CCGGAATTCAGGTCGAACCAGTTGGGAGA-3′) contains an EcoRI
restriction site. The PCR products were purified and then cloned
into pcDNA3.1(+) (Invitrogen). The construct was verified by DNA
sequencing.
To construct a luciferase reporter plasmid
containing the BMI1 3′-UTR fused to the 3′ end of a
luciferase reporter gene, the psiCHECK-2 dual luciferase vector
(Promega, Madison, WI, USA) was used. Briefly, a 388-bp fragment
containing 2 predicted miR-218 target sites (position 1470–1477 and
position 1751–1758) was amplified by PCR using the following
primers: forward, 5′-CCGCTCGAGTGTTCATCACCCATCAGTTATT-3′
(underlined letters indicate the XhoI site) and reverse,
5′-ATAAGAATGCGGCCGCAGCAATGTATTCTCTTTAACG-3′
(underlined letters indicate the NotI site). The XhoI
and NotI-digested PCR product was then cloned into a
psiCHECK-2 vector digested with XhoI and NotI to
generate the psiCHECK-2-BMI1-3′-UTR-wild type. To prepare
mutants, 4 bases in the predicted miR-218 target sites were changed
(Fig. 3D). The mutated fragment
was directly synthesized (Genewiz, Beijing, China), digested with
XhoI and NotI, and cloned into the psiCHECK-2 vector
to generate the psiCHECK-2-BMI1-3′-UTR-mutant. Subsequently,
the EC109 cells were plated in a 24-well plate and co-transfected
with 50 ng of psiCHECK-2-BMI1-3′-UTR-wild type or
psiCHECK-2-BMI1-3′-UTR-mutant type and with 20 nM of either
miR-218 mimics (5′-UUGUGCUUGAUCUAACCAUGU-3′) or the miR negative
control (miR-NC). A scrambled sequence
(5′-UUCUCCGAACGUGUCACGUTT-3′) was used as the miR-NC. At 48 h
post-transfection, the EC109 were collected, and the luciferase
activities were measured using the Dual-Luciferase Reporter assay
kit (Promega) on a TD-20/20 Luminometer (Turner Designs, Sunnyvale,
CA, USA).
Each experiment was carried out in triplicate. The
results were expressed as relative Renilla luciferase
activities, which were obtained by normalization to Firefly
luciferase activities. All the transient transfections, including
transfection with anti-miR-218 (5′-ACAU GGUUAGAUCAAGCACAA-3′) and
anti-miR-NC, were performed using Lipofectamine 2000 (Life
Technologies, Carlsbad, CA, USA). The scrambled sequence
(5′-CAGUACUUUUGUGUAGUACAA-3′) was used as the anti-miR-NC. The
knockdown of BMI1 was performed by using BMI-siRNA
(CAAGCAGAAAUGCAUCGAATT) (Genepharma, Shanghai, China). A scrambled
sequence (5′-UUCUCCGAACGUGUCACGUTT-3′) was used as the control.
RNA extraction and reverse
transcription-quantitative PCR
Total RNA was extracted from the ESCC tissue samples
and adjacent non-tumor tissues using TRIzol reagent (Invitrogen,
Oslo, Norway) according to the manufacturer’s instructions. The
amount of RNA was measured on a NanoDrop spectrophotometer (Thermo
Fisher Scientific, Waltham, MA, USA). The synthesis of cDNA with
reverse transcriptase (RT) was performed using a M-MLV First Strand
kit (Life Technologies). The concept of a stem-loop RT primer was
used to design the RT primer for mature miR-218. The primer
sequences for miR-218 and U6 detection are listed in Table I. To analyze the expression of
miRNA, quantitative PCR (qPCR) was performed using the Platinum
SYBR-Green qPCR SuperMix-UDG (Invitrogen) and an ABI 7500 Real-Time
PCR system (Applied Biosystems, Foster City, CA, USA). GAPDH mRNA
and U6 small nuclear RNA (U6 snRNA) were used as endogenous
controls to normalize BMI1 and miR-218 input. Relative
expression was calculated using the ΔΔCt method.
 | Table IPrimers used for reverse
transcription or amplification of the mature miR-218, U6 and
BMI1 mRNA. |
Table I
Primers used for reverse
transcription or amplification of the mature miR-218, U6 and
BMI1 mRNA.
| Name | Sequence,
5′→3′ |
|---|
| RT primers | |
| U6 |
CGAGCACAGAATCGCTTCACGAATTTGCGTGTCAT |
| miR-218 |
GTCGTATCCAGTGCAGGGTCCGAGGTATTCGCACTGGATACGACACATGGTTA |
| qRT-PCR
primers | |
| U6 | F:
CGAGCACAGAATCGCTTCA; R: CTCGCTTCGGCAGCACATAT |
| GAPDH | F:
GAAGGTGAAGGTCGGAGTC; R: GAAGATGGTGATGGGATTTC |
| BMI1 | F:
GTGCTTTGTGGAGGGTACTTCAT; R: TTGGACATCACAAATAGGACAATACTT |
Western blot analysis
Total protein was extracted using RIPA buffer (Cell
Signaling Technology, Danvers, MA, USA) containing protease
inhibitor and phosphatase inhibitor cocktail (Sigma-Aldrich, St.
Louis, MO, USA) at 72 h post-transfection and the protein
concentration was measured using the BCA Protein Assay kit
(Beyotime, Haimen, China). Protein (50 µg) was separated on
SDS-PAGE and transferred onto PVDF membranes. The membranes were
blocked by 1% BSA for 1 h and incubated overnight at 4°C with the
primary antibody (anti-BMI1, #5856S; Cell Signaling Technology; and
anti-GAPDH, AP0063; Bioworld Technology, St. Louis Park, MN, USA).
The membranes were washed 4 times for 15 min with TBST
(Tris-buffered saline and Tween-20). The membranes were then
incubated with anti-rabbit secondary antibodies (goat anti-rabbit,
sc-2004; Santa Cruz Biotechnology, Santa Cruz, CA, USA) at room
temperature for 2 h and washed again. Finally, the proteins were
visualized using an ECL detection system (Pierce, Rockford, IL,
USA). The band density was quantified using Quantity One 4.6
software (Bio-Rad Laboratories, Hercules, CA, USA).
Colony formation assay
A total of 400 EC109 cells were seeded in a dish
with a diameter of 6 cm and transfected with miR-218 mimics,
anti-miR-218 or the negative control(NC), using Lipofectamine 2000
(Life Technologies). The cells were collected and seeded in a
6-well plate in triplicate at 24 h post-transfection. FBS then (0.2
ml) was added to each well after 5 days. Following incubation for
another 9–10 days, the plates were gently washed with PBS. Colonies
were visualized by staining with 0.1% crystal violet and the colony
number was counted (>50 cells).
Cell proliferation assay
Cells at the logarithmic phase were seeded into
96-well plates at a density of 4×10⁴ cells/well. Cell
proliferation was determined by MTT assay and the
5-ethynyl-2′-deoxyuridine (EdU) (Cell Light EdU DNA imaging kit;
Guangzhou RiboBio Co., Ltd., Guangzhou, China). MTT assay was used
to evaluate cell proliferation using the CCK-8 kit (Beyotime,
Haimen, China) to calculate the cell absorbance value. The optical
density (OD) was measured daily over 4 consecutive days at a
wavelength of 450 nm (OD450) to estimate the viable cell
numbers.
Another method for the determination of cell
proliferation was the labeling of the cells undergoing DNA
replication with EdU. Cell proliferation was quantified by
measurement of the uptake of EdU. At 48 h after transfection, EdU
was discerned in the DNA synthesis (S phase) of the cell cycle
during 2 h of incubation, and medium containing EdU and 4%
paraformaldehyde was then added to fix cells at room temperature
for 30 min. The fixed cells were incubated with glycine (2 mg/ml)
for 5 min in a shaker, and washed with PBS for 5 min. Following
permeabilzation with 0.5% Trion X-100 for 10 min, the cells were
washed with PBS for 5 min, followed by the addition of 1X Apollo
dyeing reaction buffer to each well for 30 min while protecting the
cells from light in a shaker at room temperature. DNA was stained
with 1X Hoechst 33342 for 30 min and washed with PBS 3 times. The
nucleated cells incorporated with EdU were observed by under a
fluorescence microscope (Olympus IX71; Olympus, Tokyo, Japan) and
the proportion of EdU uptake was determined.
Cell migration and Transwell invasion
assay
A wound healing assay was used to assess cell
migration. The transfected cells were plated in 6-well culture
plates to form cell monolayer (approximately 80% confluence).
Following serum starvation for 6 h, a wound was made using a
sterile 200 µl pipette tip to scrape off the cells followed
by washing twice with PBS to remove the detached cells. The cells
were then incubated with 1% FBS. Cell migration was monitored at 0
and 48 h after the wound was made. The distances between the
migration fronts were measured using ImageJ software (National
Institutes of Health, Bethesda, MD, USA). The assessment of the
migration rate by the percentage wound closure was performed as
previously described (14).
For invasion assay, a Transwell chamber (Corning
Costar, Cambridge, MA, USA) coated with Matrigel was used (BD
Biosciences, Franklin Lakes, NJ, USA). Cells in serum-free medium
(200 µl) were seeded into the top chamber of wells in a
24-Transwell plate with inserts of 8 µm pores (Corning
Costar) at a density of 2.5×10⁵ cells/ml, while the
bottom chamber was filled with 500 µl medium containing 20%
FBS. Following incubation at 37°C in a humidified incubator with 5%
CO2 for 24 h, the cells which had invaded to the bottom
chamber were fixed with 4% paraformaldehyde at room temperature for
30 min, stained with 0.1% crystal violet for 15 min and the cell
number was counted in 5 randomly selected fields under an inverted
microscope (Olympus CKX41; Olympus).
Apoptosis assay
The miR-218-transfected cells were harvested at 48 h
post-transfection and the cell density was adjusted to
1×10⁶ cells/ml. Apoptosis was induced by the addition of
200 µM hydrogen peroxide (H2O2) to
each well for 30 min. The cells were stained using the Annexin
V-FITC Apoptosis detection kit (Beyotime, Beijing, China) according
to the manufacturer’s instructions. Briefly, the cells were
harvested and washed twice with cold PBS, and then resuspended in
195 µl binding buffer. Annexin V-FITC (5 µl) was
added to this suspension, followed by incubation for 10 min at room
temperature in the dark. After washing and resuspension, the cells
were centrifuged at 1000 rpm to pellet the cells. Finally,
apoptosis was assessed by flow cytometry.
Statistical analysis
All the results were performed at least 3 times and
the data are presented as the means ± standard deviation (SD). The
data were analyzed using the SPSS 17.0 software package and
GraphPad Prism 5.02 software (GraphPad Software, San Diego, CA,
USA). For the cell lines, differences between 2 groups were
assessed by an unpaired t-test (two-tailed). Comparisons between
the clinicopathological characteristics and the mRNA expression
levels in the ESCC samples were performed using non-parametric
tests (Mann-Whitney U test for 2 groups). The correlation between
the expression of miR-218 and BMI1 mRNA was evaluated by
calculation of Spearman’s correlation co-efficient. A value of
P<0.05 was considered to indicate a statistically significant
difference.
Results
Expression of miR-218 is decreased in
ESCC tissues and cell lines
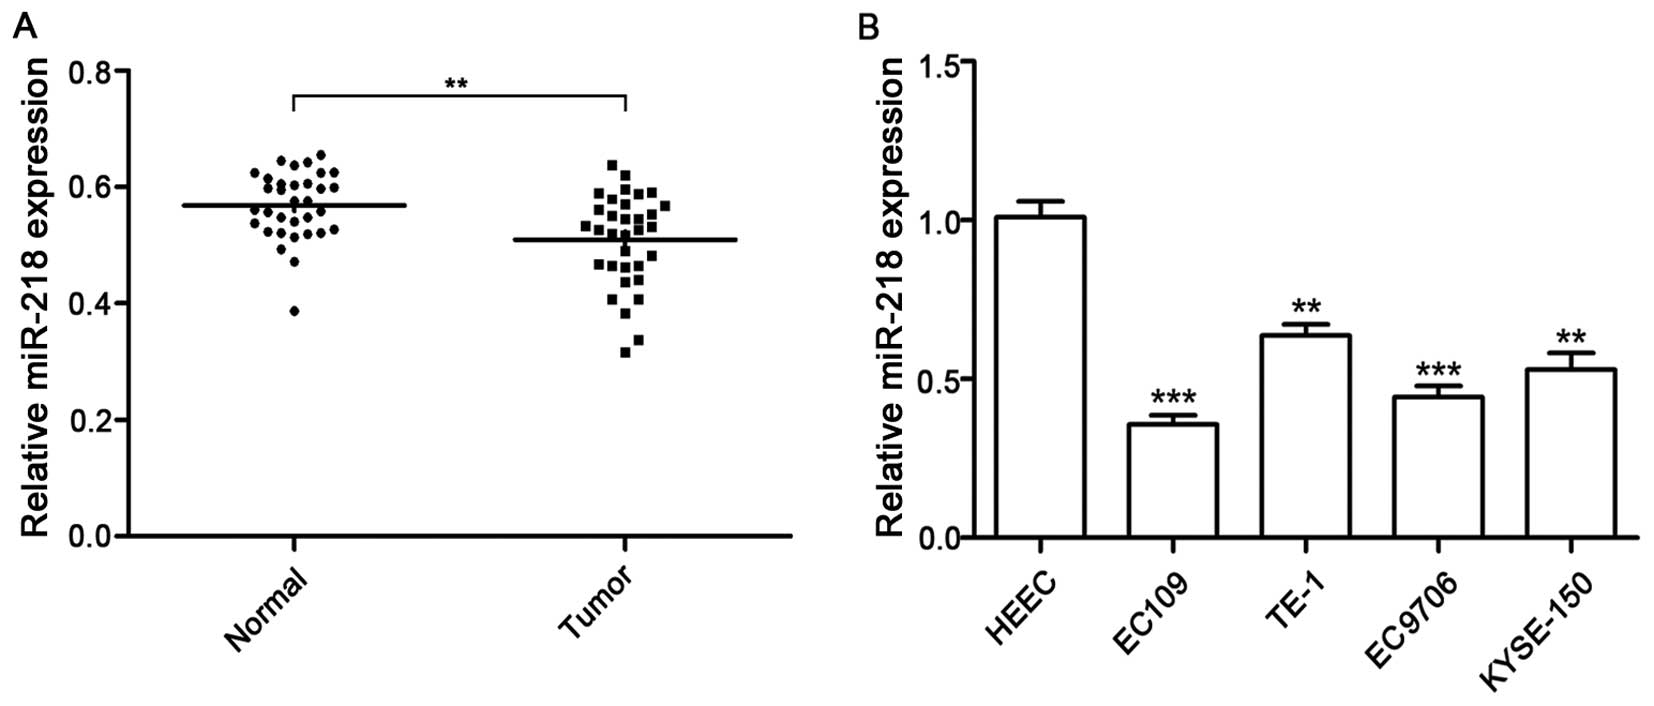
In order to determine the role of miR-218 in ESCC,
the miR-218 expression levels were determined in tissue samples
from 33 patient with ESCC and their paired adjacent normal tissue
samples. As shown in Fig. 1A,
miR-218 expression was significantly decreased in the ESCC tissues
when compared with the paired normal tissues. More importantly, the
decreased expression of miR-218 was also associated with the
clinicopathological stages of ESCC; the miR-218 expression levels
were downregulated to a greater extent in the tissue samples from
patients with stage III ESCC than those from patients with stageI
and II ESCC (Table II). In
addition, the decreased miR-218 expression correlated with the ESCC
differentiation stage.
| Table IICorrelation between the miR-218
levels and clinicopathological characteristics. |
Table II
Correlation between the miR-218
levels and clinicopathological characteristics.
| Clinicopathological
variables | N | miR-218
expression | P-value |
|---|
| Gender | | | |
| Male | 25 | 0.511±0.133 | 0.561 |
| Female | 8 | 0.549±0.141 | |
| Age (years) | | | |
| ≤60 | 19 | 0.525±0.118 | 0.326 |
| >60 | 14 | 0.584±0.145 | |
| Tumor location | | | |
| Up/middle | 20 | 0.538±0.131 | 0.217 |
| Lower | 13 | 0.570±0.114 | |
| Lymph node
metastasis | | | |
| Negative | 24 | 0.545±0.073 | <0.05 |
| Positive | 9 | 0.442±0.142 | |
|
Differentiation | | | |
| Well | 13 | 0.614±0.121 | <0.01 |
| Moderate/poor | 20 | 0.422±0.117 | |
| TNM stage | | | |
| I/II | 26 | 0.621±0.185 | <0.01 |
| III | 7 | 0.475±0.048 | |
Moreover, the relative expression levels of miR-218
were measured in 5 cell lines. Compared with the HEECs, the miR-218
expression levels were markedly lower in the ESCC cell lines,
including the EC109, TE-1, EC9706 and KYSE150 cells (Fig. 1B).
miR-218 inhibits EC109 cell
proliferation, migration and invasion, and induces apoptosis
Since the decreased expression of miR-218 was
detected in the ESCC tissues and cell lines, we hypothesized that
miR-218 acts as tumor suppressor gene and regulates tumor formation
and development. We then investigated whether treatment with
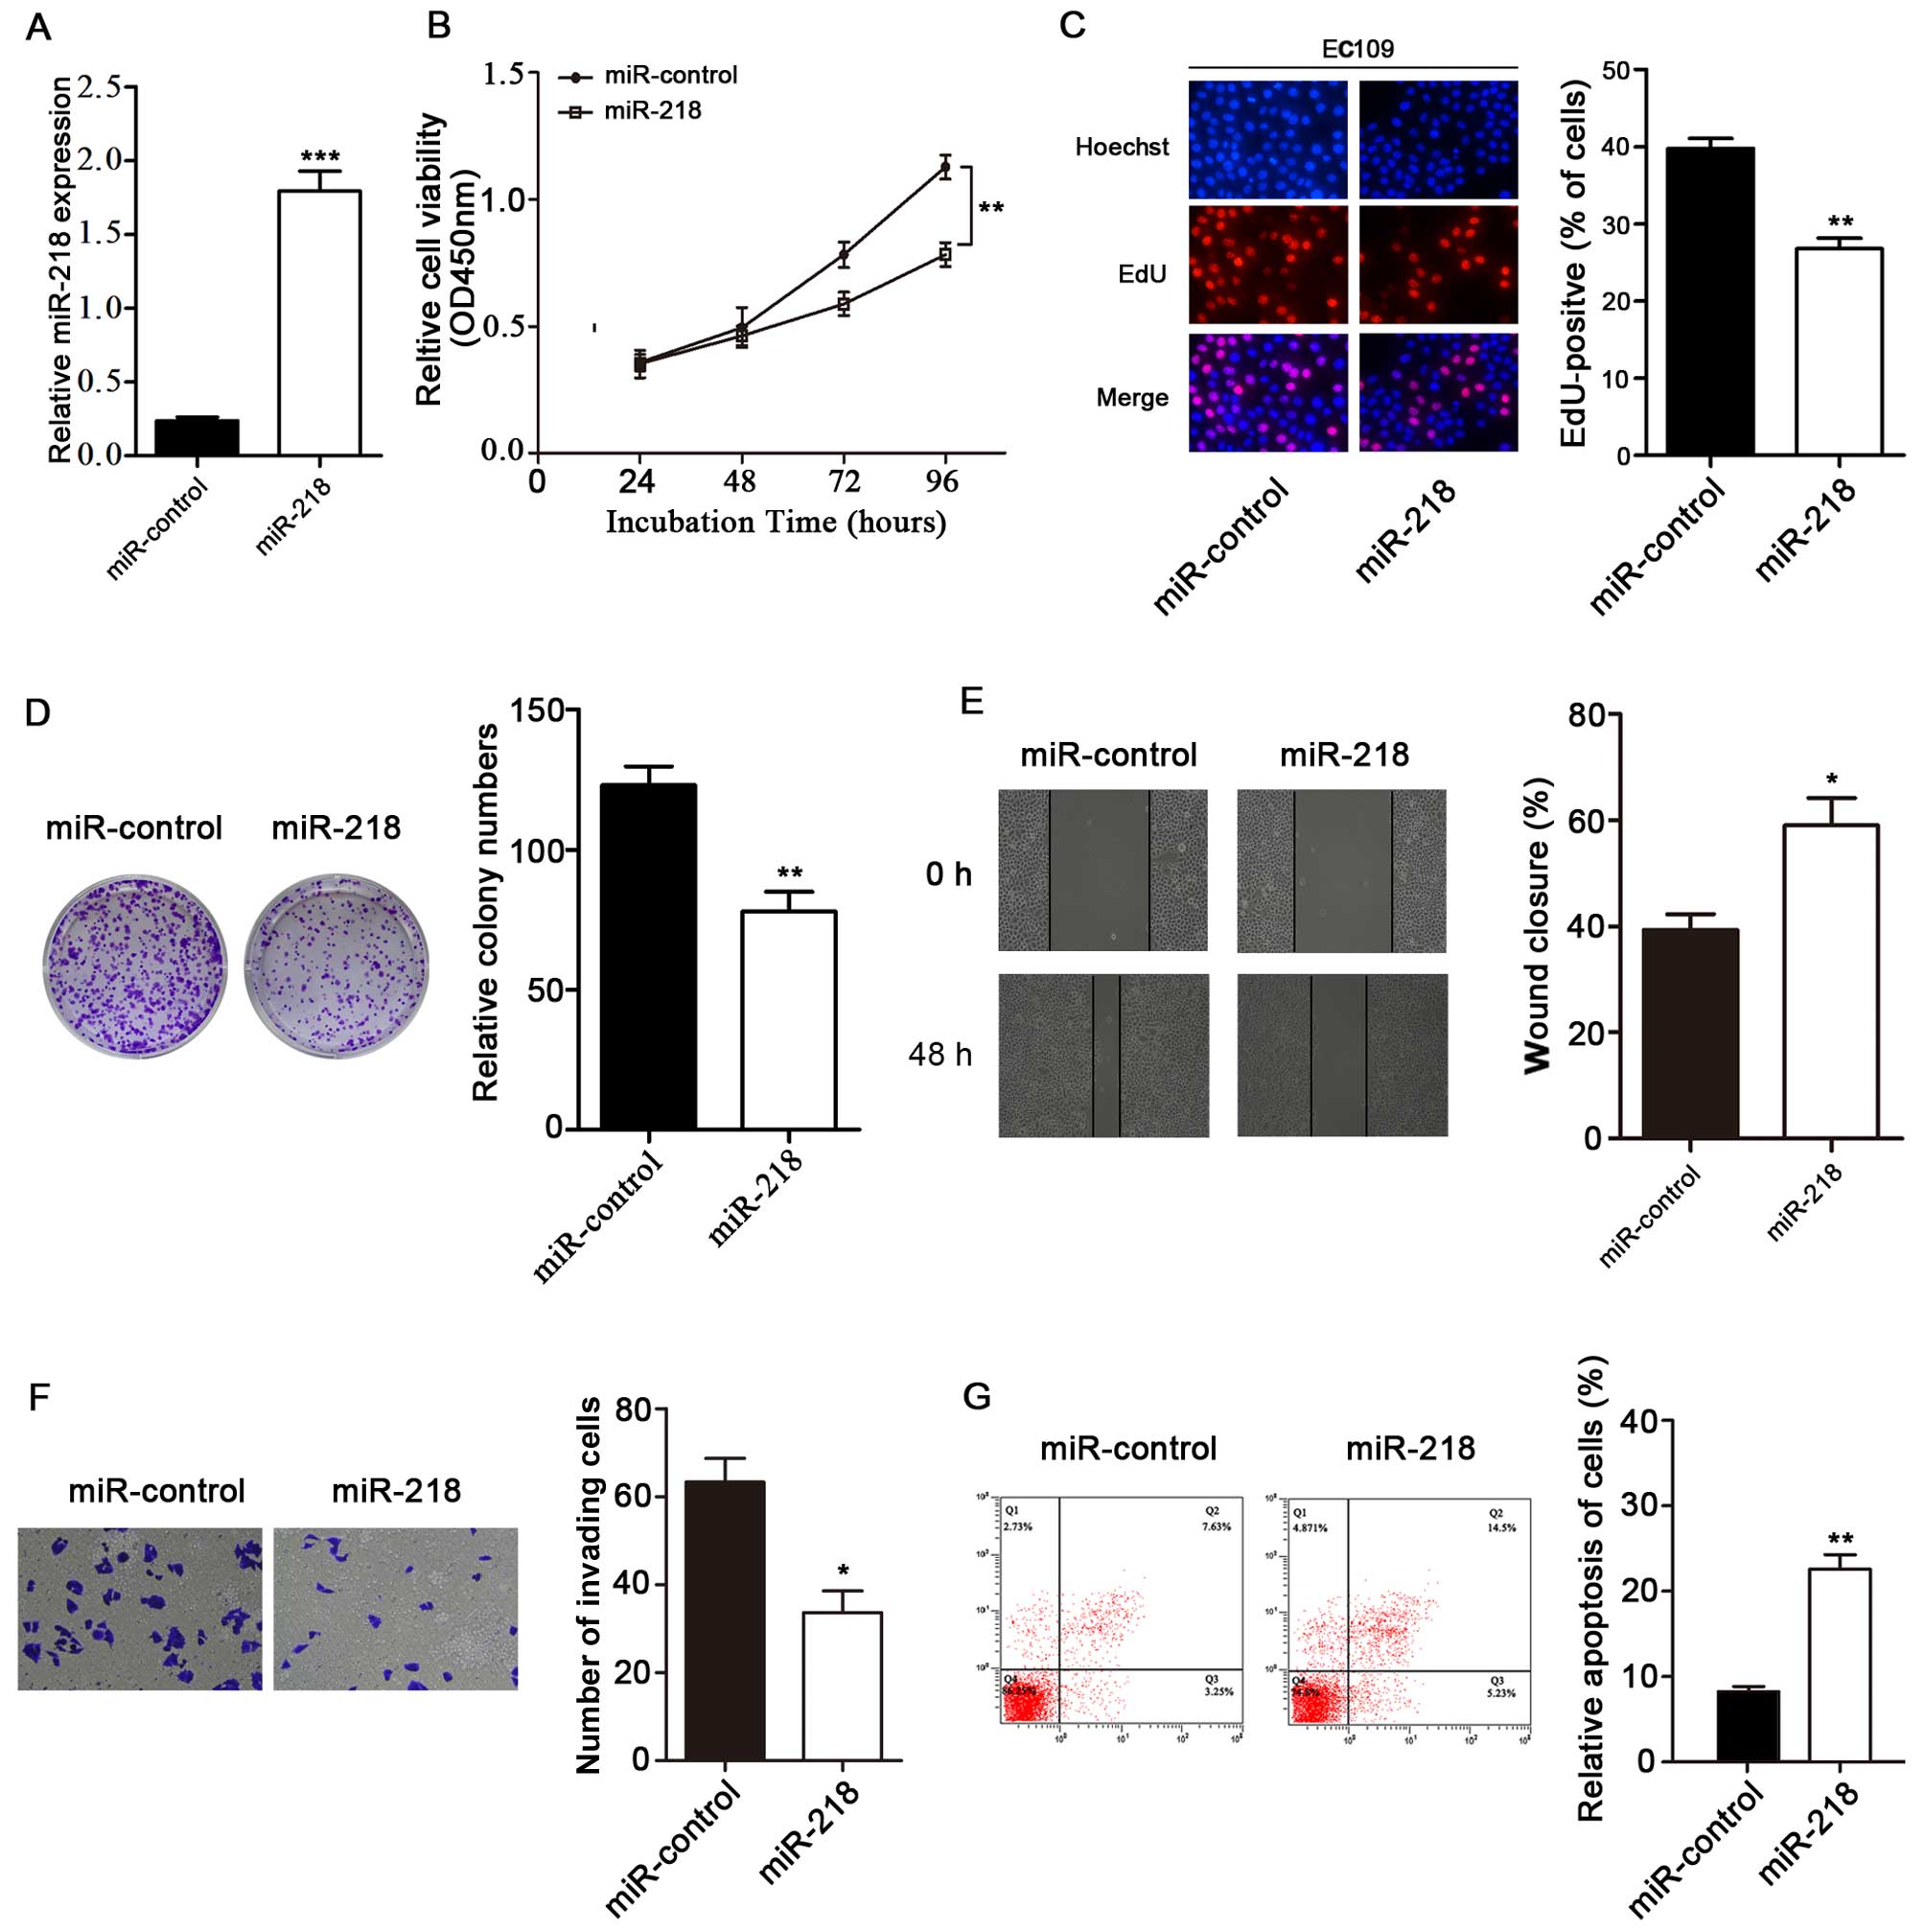
miR-218 exerts an inhibitory effect on the growth of ESCC cells. We
found that miR-218 expression in the mimics-transfected group was
significantly higher than that in the miR-control-transfected group
(Fig. 2A). The corresponding cell
growth curves indicated that the OD450 of the miR-218 group was
significantly decreased on the fourth day post-transfection in the
EC109 cells (Fig. 2B). In
addition, we found that the extent of EdU staining was decreased in
the EC109 cells transfected with the miR-218 mimics. EdU assay
revealed that the number of EC109 cells was significantly decreased
in the group transfected with miR-218 mimics (Fig. 2C). Moreover, colony formation
assay also validated that transfection with miR-218 mimics was
effective. The restoration of miR-218 expression markedly inhibited
clonogenic cell growth, since transfection with miR-218 mimics led
to the inhibition of colony formation compared to the
miR-control-transfected group (P<0.01; Fig. 2D). These results indicate that
miR-218 has the ability to effectively suppress ESCC cell
growth.
In addition, the effects of miR-218 on cell
migration and invasion were detected in the EC109 cells. Our
results revealed that the overexpression of miR-218 significantly
suppressed cell migration and invasion in the ESCC cells
(P<0.05; Fig. 2E and F).
Next, we examined the effects of miR-218 restoration
on the induction of apoptosis in EC109 cells. The EC109 cells were
transfected with the miR-218 mimics for 72 h. The apoptosis of the
miR-218-transfected cells was significantly increased compared with
that of the miR-control-transfected cells (P<0.01; Fig. 2G).
miR-218 downregulates BMI1 expression by
targeting the 3′-UTR of BMI1 mRNA
Our results thus far suggested that the ectopic
expression of miR-218 exerted an effect on ESCC cell proliferation,
invasion and apoptosis. The upregulation of miR-218 expression has
a potentially tumor suppressive funciton for EC development. To
determine whether miR-218 plays a negative regulatory role in
downregulating proteins and genes, we used TargetScan, miRDB and
miRecords software to predict the potential genes inolved. Based on
the results of TargetScan, we found 1,067 conserved sites and 279
poorly conserved sites among biological species. Among these genes,
we found that BMI1 was previously identifed in glioma stem
cells by directly targeting the 3′-UTR of BMI1 (15). Therefore, we selected BMI1
as a determinant factor for BMI1 expression in ESCC cells
based on the prediction by a variety of software and as potential
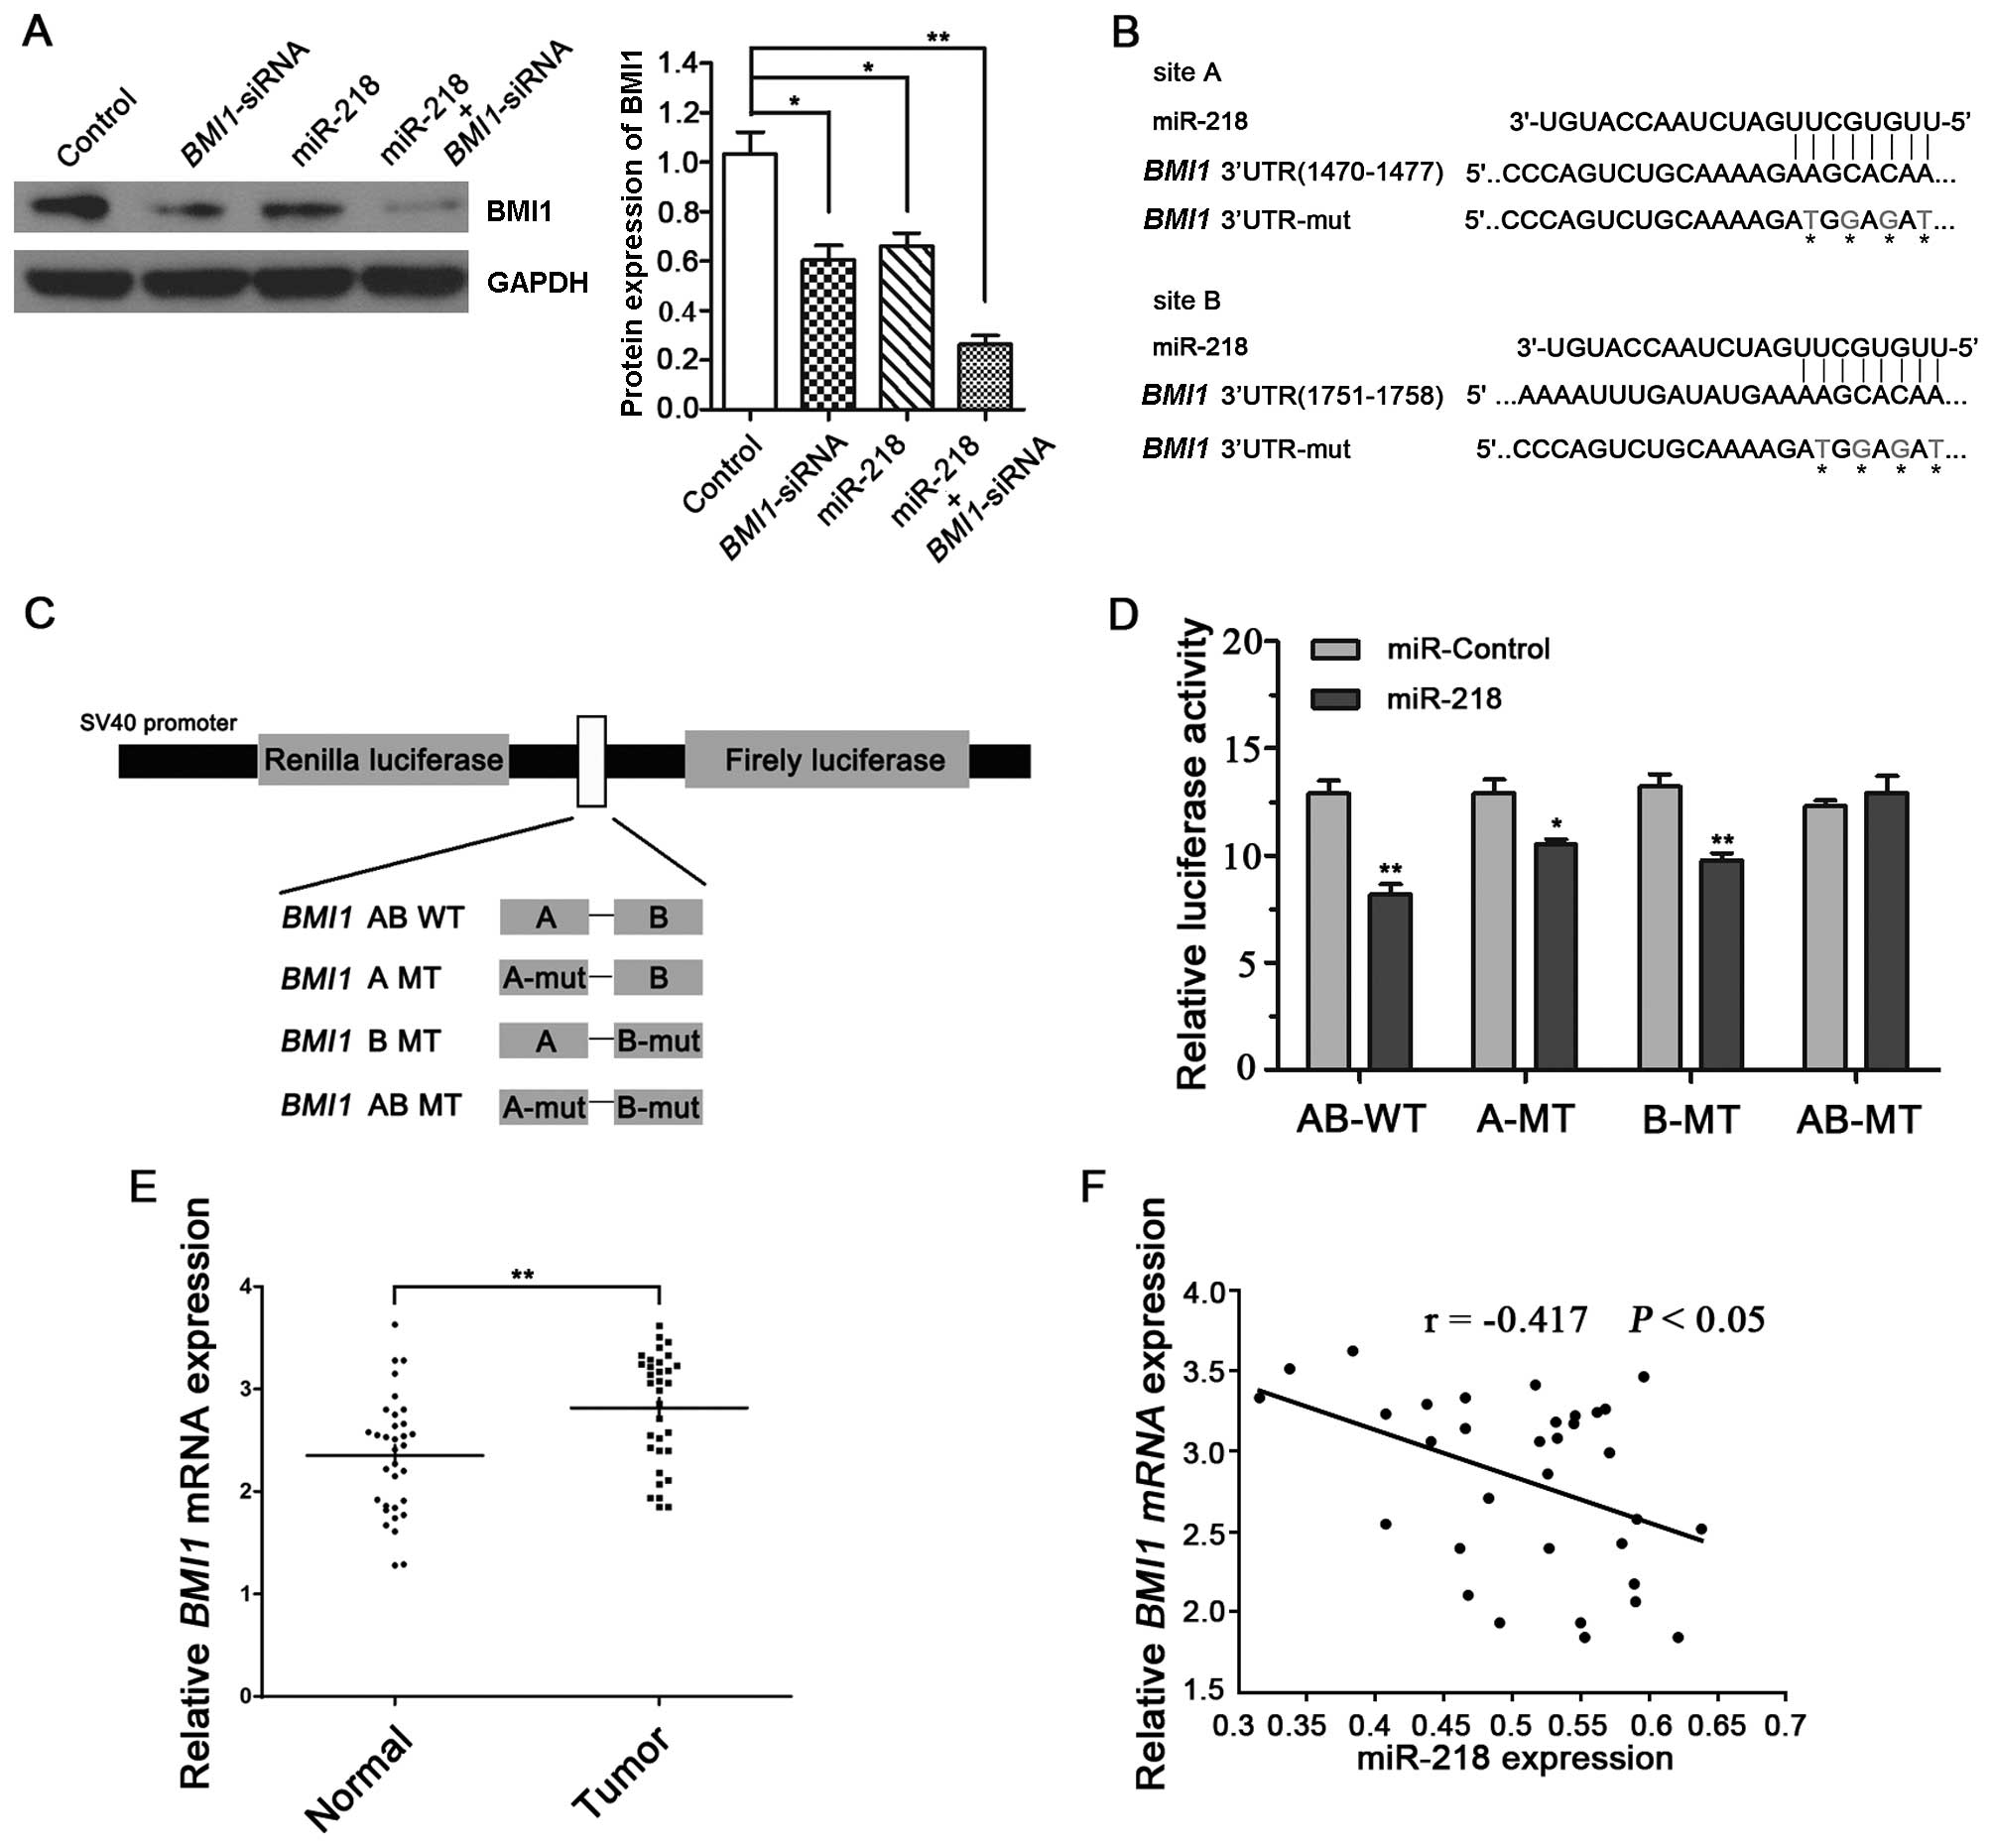
target gene of miR-218. We first investigated the protein
expression of BMI1 in ESCC cells by western blot analysis, and
found that the protein expression of BMI1 was decreased by the
restoration of miR-218 expression (Fig. 3A). BMI1 protein expression was
also downregulated by transfection with BMI1-siRNA.
The potential binding sites of miR-218 in the 3′-UTR
of BMI1 were perdicted using 2 types of bioinformatics
software (TargetScan and miDRB). We found there were 2 binding
sites, and one of them was a poorly conserved sequence. In order to
confirm that miR-218 regulates the expression of BMI1 by
directly binding to the putative binding sites in its 3′-UTR, we
constructed a luciferase reporter plasmid containing the
full-length wild-type BMI1 3′-UTR and mutant-type
BMI1 3′-UTR that had 4 point mutations predicted to disrupt
miR-218 binding in each of the seed match regions (Fig. 3B and C). Co-transfection of the
EC109 cells was performed with miR-218 mimics or miR-control. The
luciferase reporter activities of both wild-type BMI1 3′-UTR
binding sites were significantly decreased following transfection
with miR-218 mimics compared with the miR-control; however, no
significant difference was observed in the 2 point mutation groups
(BMI1-AB-MT) (Fig. 3D). In
conclusion, our results revealed that miR-218 directly binds to the
3′-UTR of BMI1 mRNA and downregulates its expression.
We further investigated the BMI1 mRNA
expression levels in 33 pairs of ESCC samples by RT-qPCR. We found
that the mRNA expression of BMI1 was significantly higher in
the cancer specimens compared with their paired non-tumor specimens
(n=33; P<0.01; Fig. 3E).
miR-218 expression and the mRNA levels of BMI1 showed a
significant inverse correlation in the 33 ESCC specimens by
Spearman’s correlation analysis (r=−0.417; P<0.05; Fig. 3F). These data further suggest that
the downregulation of miR-218 inversely correlates with the
upregulation of BMI1 in ESCC tissues.
Knockdown of BMI1 by siRNA shows the same
phenocopy as the effect of miR-218 on ESCC cells
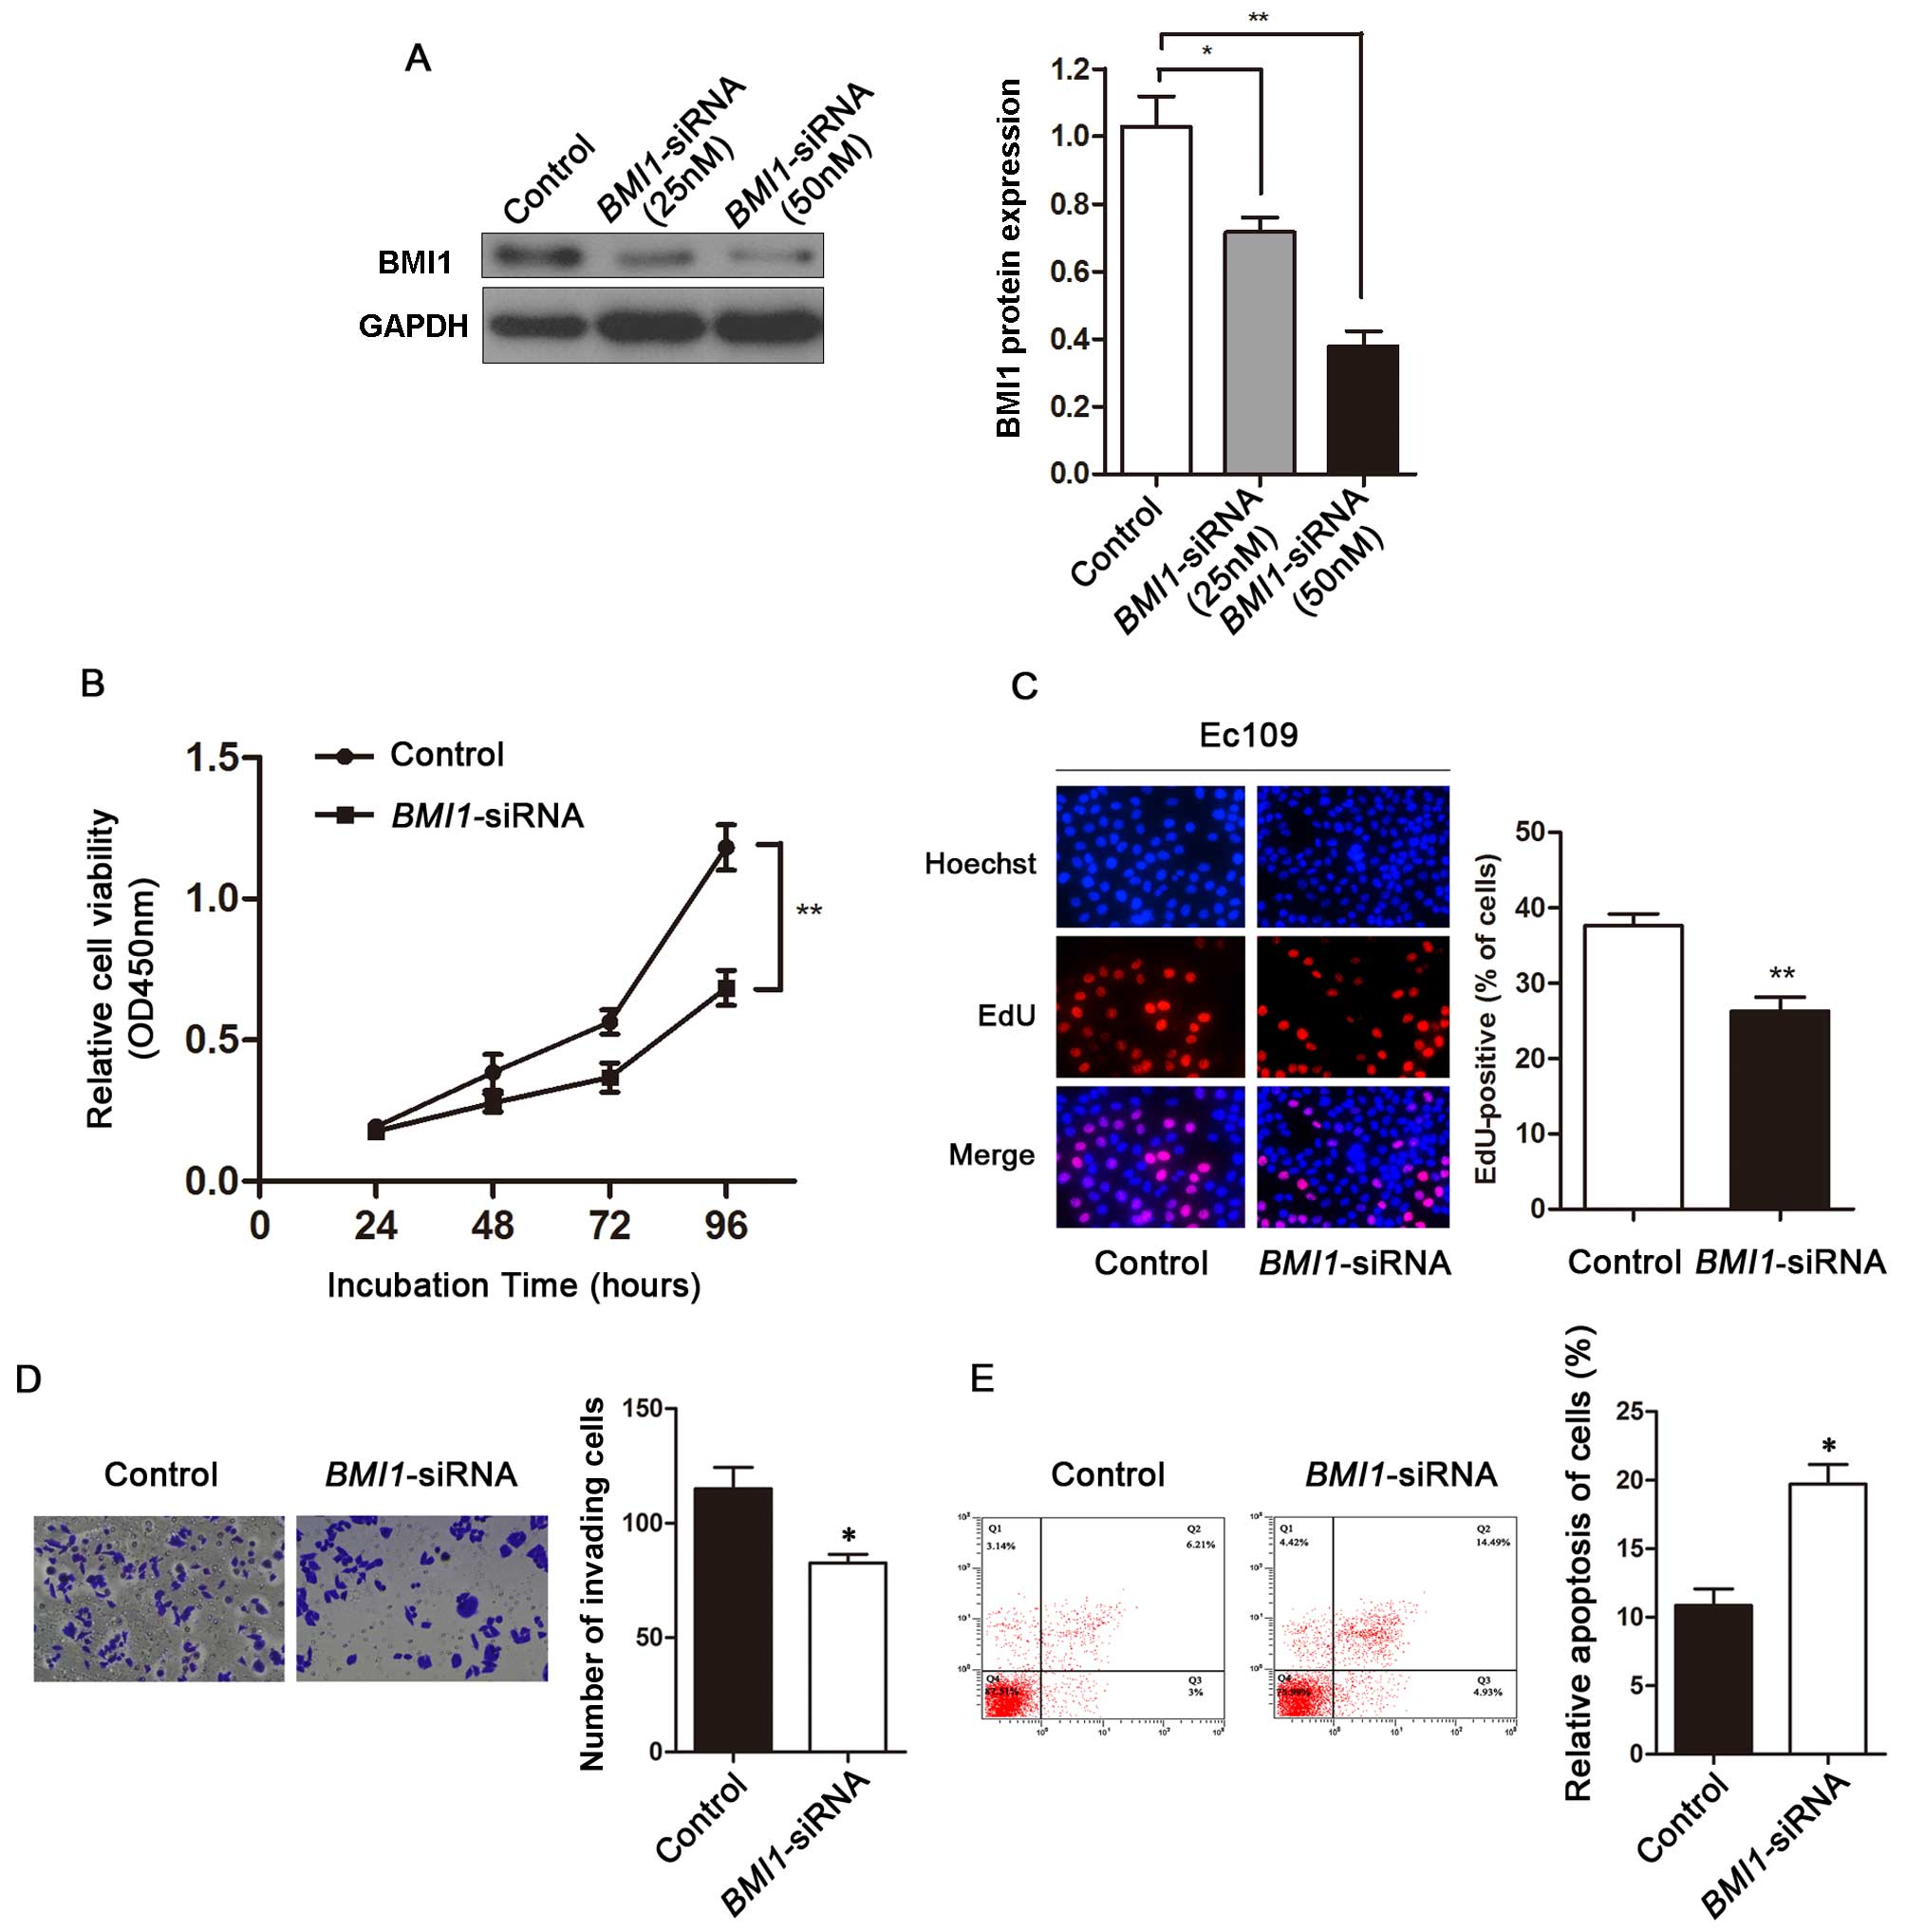
To explore the effects of BMI1 on ESCC, we
used BMI1-siRNA to knockdown BMI1 expression in the
EC109 cells. The protein expression level of BMI1 was significantly
reduced in the BMI1-siRNA-transfected EC109 cells compared
with the siRNA-control-transfected EC109 cells (Fig. 4A). MTT assay revealed that the
growth rate of EC109 cells transfected with BMI1-siRNA was
significantly lower than that of the siRNA-control-transfected
cells (Fig. 4B). In order to
further elucidate the effects of BMI1-siRNA on cancer cell
proliferation, we used EdU incorporation assay to determine the
effects of BMI1 on ESCC cell proliferation. EdU assay
revealed that cell number was significantly reduced in the
BMI1-siRNA-transfected EC109 cells (Fig. 4C). Transwell assay revealed that
BMI1 knockdown inhibited the invasion of ESCC cells
(Fig. 4D). The number of
apoptotic cells were significantly increased in the
BMI1-siRNA-transfected EC109 cells compared with the
siRNA-control-transfected cells (Fig.
4E).
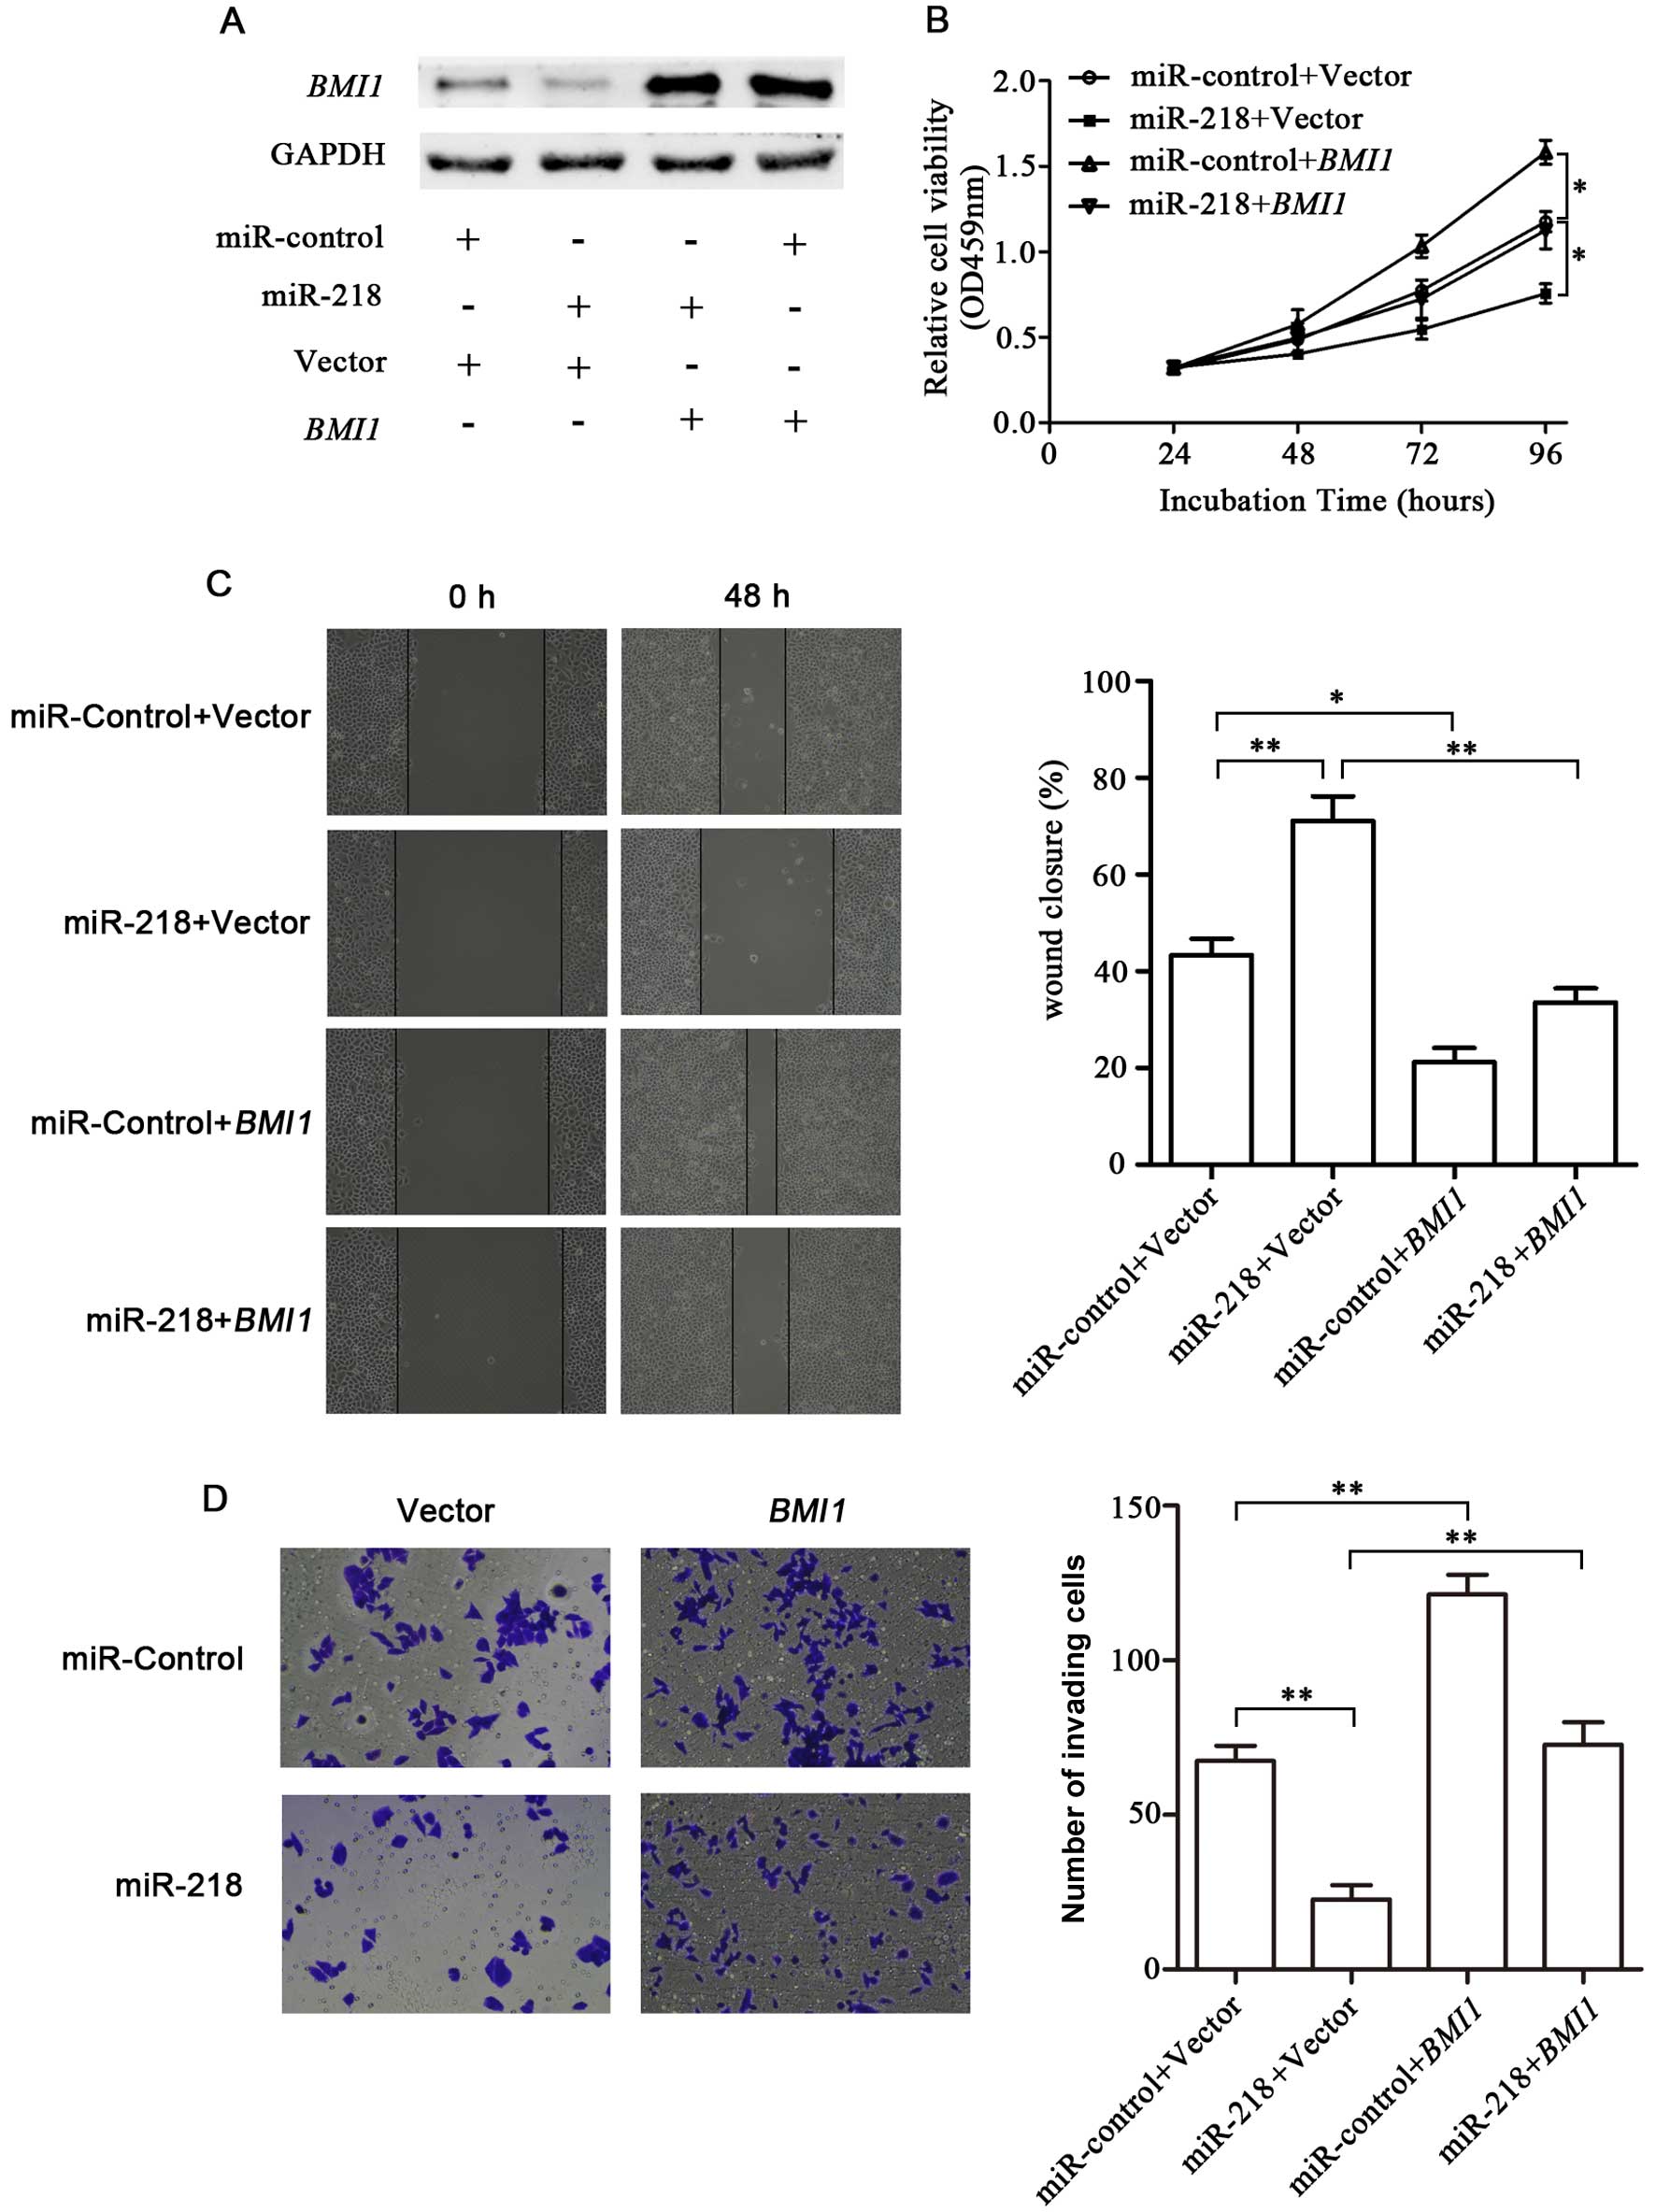
Overexpression of BMI1 reverses the
effects of miR-218 on ESCC cells
Since our results suggested that miR-218 inhibited
cell growth and invasion through teh downregulation of BMI1,
we explored whether BMI1 is a direct functional mediator of
the inhibitory effects of miR-218. The EC109 cells were transfected
with BMI1 plasmid without the 3′-UTR or control plasmid, in
combination with transfection with miR-218 or miR-control. Forty
hours after the BMI1 plasmid or the control vector were
co-transfected with the miR-218 or miR-control into the cells,
western blot analysis confirmed that miR-218 downregulated
BMI1 expression; however, this effect was reversed by
transfection with BMI1 plasmid (Fig. 5A). It was also suggested that the
BMI1 construct without the 3′-UTR was insensitive to
miR-218-mediated inhibition. MTT assay revealed that the
overexpression of BMI1 significantly reversed
miR-218-induced cell growth inhibition (Fig. 5B). Furthermore, BMI1
partially reversed the inhibitory effects of miR-218 on EC109 cell
migration and invasion (Fig. 5C and
D). These results suggested that the overexpression of
BMI1 reversed the effects of the aberrant expression of
miR-218 on the phenotype of ESCC cells.
Discussion
In the present study, we demonstrated that miR-218
expression was significantly downregulated in the ESCC tissues
compared with the adjacent normal tissue. This result was
consistent with that of a previous study (16). We also found that the decreased
expression of miR-218 was associated with the ESCC differentiation
stage and the metastasis of ESCC cells, as well as with the
clinicopathological stages of ESCC (miR-218 expression was lower in
the samples of stage III ESCC than in the samples of stage I and II
ESCC). Moreover, we demonstrated that miR-218 negatively regulated
BMI1 expression in ESCC cells, suggesting an important role
for miR-218 dysregulation in tumorigenesis and the metastasis of
ESCC cells.
miRNAs are a class of endogenous small non-coding
RNA molecules which function at the post-transcriptional level by
partially combination with the 3′-UTR of the target mRNA (17). Ample evidence indicates that
miRNAs play pivotal roles in regulating cell differentiation,
proliferation and apoptosis (18). A number of miRNAs have been
reported to regulate ESCC development. Previous studies have
demonstrated that miR-218 mainly functions as tumor suppressor in
various of types of cancer, including glioma, nasopharyngeal,
gastric and colon cancers (15,19–21), but no consensus has yet been
reached on the relevance of miR-218 in the development and
progression of ESCC. In the present study, we demonstrated that
miR-218 was significantly downregulated in ESCC tissues.
We then investigated whether the dysregulation of
miR-218 is responsible for ESCC cell growth. First, we transfected
EC109 cells with miR-218 mimics and analyzed cell growth in
vitro, and found that cell growth was suppressed by miR-218. We
also found that the overexpression of miR-218 decreased the
migratory and invasive potential of the ESCC cells. Moreover, the
apoptotic rate of the EC109 cells increased following transfection
with miR-218 mimics. These findings suggest a important role of
miR-218 ESCC; the downregulation of in miR-218 in ESCC cells
promotes anchorage-independent cell growth, resistance to apoptosis
and is a prerequisite for metastasis.
BMI1 is a member of the polycomb group (PcG)
of transcription repressors that repress targeted gene
transcription through an epigenetic mechanism (22). In addition to its effect on EC,
BMI1 is also a pivotal factor in many other types of cancer.
It has been found that BMI1 is highly expressed in cervical,
breast and ovarian tumor tissue compared to normal tissue (23,24). Immunohistochemical analysis has
shown that BMI1 expression in glioma tissues is markedly
higher compared with ther normal tissue (25). The aberrant expression of
BMI1 is involved in cell proliferation,
epithelial-mesenchymal transition (EMT), tumor invasion and
metastasis in many types of cancer (26–29). Our results revealed that the
downregulation of BMI1 inhibited ESCC cell proliferation. In
agreement with our results, the increased expression level of
BMI1 has been shown to promote the proliferation of ovarian
cancer cells (30). BMI1
has been shown to be a target of other miRNAs, including miR-128,
miR-15a and miR-203 and these miRNAs regulate cancer cell
proliferation, differentiation and invasion (31–33).
Our study demonstrated that BMI1 was directly
regulated by miR-218 in ESCC. It contains two binding sites, one is
a conserved site, the other is a poorly conserved site. Using a
luciferase reporter assay, we demonstrated that miR-218 directly
targeted BMI1 by binding to the 2 potential 3′UTR binding
sites. We also identified miR-218 as a potential tumor suppressor
that regulated cell proliferation and promoted apoptosis in ESCC
cells. In agreement with our results, miR-218 has been shown to
have a similar function in other types of cancer (34–36), thus, confirming the tumor
suppressor role of miR-218. Concomitantly, similar results were
obtained by the downregulation of BMI1 using siRNA which
better explained that miR-218 functions by inhibiting BMI1
expression. Furthermore, the inverse correlation between miR-218
and BMI1 mRNA expression was significant in the ESCC
tissues. This result indicates that the downregulation of miR-218
is a remarkable event that may correlate with the upregulation of
BMI1 expression. Therefore, the decrease in miR-218
expression contributes to an enhanced cell proliferation and
metastasis observed in ESCC by influencing BMI1
expression.
In conclusion, in the present study, miR-218 was
found to be significantly decreased expression in ESCC, and miR-218
targets BMI1 and downregulates its expression in ESCC cells,
which is important in regulating cancer cell growth and metastasis.
Our data suggest that miR-218 and BMI1 may function as novel
biomarkers for monitoring the initiation and development of
ESCC.
Acknowledgments
The present study was supported by grants from the
Natural Science Foundation of P.R. China (no. 30972768), the
Natural Science Foundation of Jiangsu province (no. BK2011286,
BK20131159), the Jiangsu Province’s Key Provincial Talents Program
(RC2011106), the Jiangsu Province’s Provincial Talents of Six
Summits Program (the eighth, 2011-WS-056 to J.Z.), and the Jiangsu
Overseas Research and Training Program for University Prominent
Young and Middle-aged Teachers and Presidents.
References
|
1
|
Jemal A, Bray F, Center MM, Ferlay J, Ward
E and Forman D: Global cancer statistics. CA Cancer J Clin.
61:69–90. 2011. View Article : Google Scholar : PubMed/NCBI
|
|
2
|
Jemal A, Center MM, DeSantis C and Ward
EM: Global patterns of cancer incidence and mortality rates and
trends. Cancer Epidemiol Biomarkers Prev. 19:1893–1907. 2010.
View Article : Google Scholar : PubMed/NCBI
|
|
3
|
Song Q, Liu H, Wang J, et al:
Dinner-to-bed time and post-dinner walk: new potential independent
factors in esophageal cancer development. J Cancer Res Clin Oncol.
140:817–821. 2014. View Article : Google Scholar : PubMed/NCBI
|
|
4
|
Wong TS, Man OY, Tsang CM, et al: MicroRNA
let-7 suppresses nasopharyngeal carcinoma cells proliferation
through downregulating c-Myc expression. J Cancer Res Clin Oncol.
137:415–422. 2011. View Article : Google Scholar :
|
|
5
|
Wang C, Wang X, Liang H, et al: miR-203
inhibits cell proliferation and migration of lung cancer cells by
targeting PKCalpha. PLoS One. 8:e739852013. View Article : Google Scholar
|
|
6
|
Thulin P, Wei T, Werngren O, et al:
MicroRNA-9 regulates the expression of peroxisome
proliferator-activated receptor delta in human monocytes during the
inflammatory response. Int J Mol Med. 31:1003–1010. 2013.PubMed/NCBI
|
|
7
|
Ratner ES, Tuck D, Richter C, et al:
MicroRNA signatures differentiate uterine cancer tumor subtypes.
Gynecol Oncol. 118:251–257. 2010. View Article : Google Scholar : PubMed/NCBI
|
|
8
|
Zhao BS, Liu SG, Wang TY, et al: Screening
of microRNA in patients with esophageal cancer at same tumor node
metastasis stage with different prognoses. Asian Pac J Cancer Prev.
14:139–143. 2013. View Article : Google Scholar : PubMed/NCBI
|
|
9
|
Kinoshita T, Hanazawa T, Nohata N, et al:
Tumor suppressive microRNA-218 inhibits cancer cell migration and
invasion through targeting laminin-332 in head and neck squamous
cell carcinoma. Oncotarget. 3:1386–1400. 2012.PubMed/NCBI
|
|
10
|
Yamamoto N, Kinoshita T, Nohata N, et al:
Tumor suppressive microRNA-218 inhibits cancer cell migration and
invasion by targeting focal adhesion pathways in cervical squamous
cell carcinoma. Int J Oncol. 42:1523–1532. 2013.PubMed/NCBI
|
|
11
|
Tatarano S, Chiyomaru T, Kawakami K, et
al: miR-218 on the genomic loss region of chromosome 4p15.31
functions as a tumor suppressor in bladder cancer. Int J Oncol.
39:13–21. 2011.PubMed/NCBI
|
|
12
|
Uesugi A, Kozaki K, Tsuruta T, et al: The
tumor suppressive microRNA miR-218 targets the mTOR component
Rictor and inhibits AKT phosphorylation in oral cancer. Cancer Res.
71:5765–5778. 2011. View Article : Google Scholar : PubMed/NCBI
|
|
13
|
Jacobs JJ, Kieboom K, Marino S, DePinho RA
and van Lohuizen M: The oncogene and Polycomb-group gene bmi-1
regulates cell proliferation and senescence through the ink4a
locus. Nature. 397:164–168. 1999. View
Article : Google Scholar : PubMed/NCBI
|
|
14
|
Zheng F, Liao YJ, Cai MY, et al: The
putative tumour suppressor microRNA-124 modulates hepatocellular
carcinoma cell aggressiveness by repressing ROCK2 and EZH2. Gut.
61:278–289. 2012. View Article : Google Scholar
|
|
15
|
Tu Y, Gao X, Li G, et al: MicroRNA-218
inhibits glioma invasion, migration, proliferation, and cancer
stem-like cell self-renewal by targeting the polycomb group gene
Bmi1. Cancer Res. 73:6046–6055. 2013. View Article : Google Scholar : PubMed/NCBI
|
|
16
|
Chen Z, Li J, Tian L, et al: MiRNA
expression profile reveals a prognostic signature for esophageal
squamous cell carcinoma. Cancer Lett. 350:34–42. 2014. View Article : Google Scholar : PubMed/NCBI
|
|
17
|
Huang X, Lv W, Zhang JH and Lu DL: miR96
functions as a tumor suppressor gene by targeting NUAK1 in
pancreatic cancer. Int J Mol Med. 34:1599–1605. 2014.PubMed/NCBI
|
|
18
|
Wang A, Landen NX, Meisgen F, et al:
MicroRNA-31 is overexpressed in cutaneous squamous cell carcinoma
and regulates cell motility and colony formation ability of tumor
cells. PloS One. 9:e1032062014. View Article : Google Scholar : PubMed/NCBI
|
|
19
|
Alajez NM, Lenarduzzi M, Ito E, et al:
MiR-218 suppresses nasopharyngeal cancer progression through
downregulation of survivin and the SLIT2-ROBO1 pathway. Cancer Res.
71:2381–2391. 2011. View Article : Google Scholar : PubMed/NCBI
|
|
20
|
Tie J, Pan Y, Zhao L, et al: MiR-218
inhibits invasion and metastasis of gastric cancer by targeting the
Robo1 receptor. PLoS Genet. 6:e10008792010. View Article : Google Scholar : PubMed/NCBI
|
|
21
|
He X, Dong Y, Wu CW, et al: MicroRNA-218
inhibits cell cycle progression and promotes apoptosis in colon
cancer by downregulating BMI1 polycomb ring finger oncogene. Mol
Med. 18:1491–1498. 2012.PubMed/NCBI
|
|
22
|
van der Lugt NM, Domen J, Linders K, et
al: Posterior transformation, neurological abnormalities, and
severe hematopoietic defects in mice with a targeted deletion of
the bmi-1 proto-oncogene. Genes Dev. 8:757–769. 1994. View Article : Google Scholar : PubMed/NCBI
|
|
23
|
Vrzalikova K, Skarda J, Ehrmann J, et al:
Prognostic value of Bmi-1 oncoprotein expression in NSCLC patients:
a tissue microarray study. J Cancer Res Clin Oncol. 134:1037–1042.
2008. View Article : Google Scholar : PubMed/NCBI
|
|
24
|
Gavrilescu MM, Todosi AM, Anitei MG, Filip
B and Scripcariu V: Expression of bmi-1 protein in cervical, breast
and ovarian cancer. Rev Med Chir Soc Med Nat Iasi. 116:1112–1117.
2012.
|
|
25
|
Wu Z, Wang Q, Wang L, et al: Combined
aberrant expression of Bmi1 and EZH2 is predictive of poor
prognosis in glioma patients. J Neurol Sci. 335:191–196. 2013.
View Article : Google Scholar : PubMed/NCBI
|
|
26
|
Hamada S, Satoh K, Masamune A and
Shimosegawa T: Regulators of epithelial mesenchymal transition in
pancreatic cancer. Front Physiol. 3:2542012. View Article : Google Scholar : PubMed/NCBI
|
|
27
|
Paranjape AN, Balaji SA, Mandal T, Krushik
EV, Nagaraj P, Mukherjee G and Rangarajan A: Bmi1 regulates
self-renewal and epithelial to mesenchymal transition in breast
cancer cells through Nanog. BMC Cancer. 14:7852014. View Article : Google Scholar : PubMed/NCBI
|
|
28
|
He Q, Liu Z, Zhao T, Zhao L, Zhou X and
Wang A: Bmi1 drives stem-like properties and is associated with
migration, invasion, and poor prognosis in tongue squamous cell
carcinoma. Int J Biol Sci. 11:1–10. 2015. View Article : Google Scholar : PubMed/NCBI
|
|
29
|
Chen Y, Lian G, Zhang Q, Zeng L, Qian C,
Chen S and Huang K: Overexpression of Bmi-1 induces the malignant
transformation of gastric epithelial cells in vitro. Oncol Res.
21:33–41. 2013. View Article : Google Scholar : PubMed/NCBI
|
|
30
|
Xin T, Zhang FB, Sui GJ and Jin XM: Bmi-1
siRNA inhibited ovarian cancer cell line growth and decreased
telomerase activity. Br J Biomed Sci. 69:62–66. 2012.PubMed/NCBI
|
|
31
|
Peruzzi P, Bronisz A, Nowicki MO, et al:
MicroRNA-128 coordinately targets Polycomb Repressor Complexes in
glioma stem cells. Neuro Oncol. 15:1212–1224. 2013. View Article : Google Scholar : PubMed/NCBI
|
|
32
|
Guo S, Xu X, Tang Y, et al: miR-15a
inhibits cell proliferation and epithelial to mesenchymal
transition in pancreatic ductal adenocarcinoma by down-regulating
Bmi-1 expression. Cancer Lett. 344:40–46. 2014. View Article : Google Scholar
|
|
33
|
Okumura T, Shimada Y, Moriyama M, et al:
MicroRNA-203 inhibits the progression of esophageal squamous cell
carcinoma with restored epithelial tissue architecture in vivo. Int
J Oncol. 44:1923–1932. 2014.PubMed/NCBI
|
|
34
|
Kogo R, How C, Chaudary N, Bruce J, Shi W,
Hill RP, Zahedi P, Yip KW and Liu FF: The microRNA-218~Survivin
axis regulates migration, invasion, and lymph node metastasis in
cervical cancer. Oncotarget. 6:1090–1100. 2015.
|
|
35
|
Sui C, Xu F, Shen W, Geng L, Xie F, Dai B,
Lu J, Zhang M and Yang J: Overexpression of miR-218 inhibits
hepatocellular carcinoma cell growth through RET. Tumour Biol.
36:1511–1518. 2015. View Article : Google Scholar
|
|
36
|
Nishikawa R, Goto Y, Sakamoto S, Chiyomaru
T, Enokida H, Kojima S, Kinoshita T, Yamamoto N, Nakagawa M, Naya
Y, et al: Tumor-suppressive microRNA-218 inhibits cancer cell
migration and invasion via targeting of LASP1 in prostate cancer.
Cancer Sci. 105:802–811. 2014. View Article : Google Scholar : PubMed/NCBI
|