Introduction
In the growing field of personalised medicine, the
increasing number of molecular targets for individualised therapies
requires the analysis of numerous, potential genetic alterations,
which is becoming a challenge in terms of workload, tissue
availability, as well as costs (1). For non-small cell lung cancer
(NSCLC), molecular analysis has shifted from the analysis of the
epidermal growth factor receptor (EGFR) mutation status to
the analysis of additional gene target regions, including
resistance mutations and gene fusion events (2).
Taking these developments into account, massive
parallel sequencing (MPS) has come into focus, as it allows rapid,
comprehensive and cost-effective mutation testing for routine
molecular pathological diagnostics, even on small formalin-fixed,
paraffin-embedded (FFPE) biopsies (3–6).
However, the implementation of MPS platforms into routine
diagnostics raises questions about feasibility, sensitivity and
specificity, as the results of mutation testing are the basis for
therapeutic decision making (1,7).
The ever-increasing pace of MPS adoption presents enormous
challenges, in terms of data processing, storage, management and
interpretation, as well as sequencing quality control, which impede
the translation of research into clinical practice (8,9).
Additionally, the preanalytical steps are important
to consider: the manual macrodissection of selected tumour areas
has become a standard procedure in molecular pathology and is a
powerful tool to reduce false negative results resulting from
wild-type contamination (10).
Selecting the right tumour area influences not only the result of
the analysis, but also the allele frequency, the value of which is
pivotal when reporting diagnostic findings (11). Automated DNA extraction systems
are helpful in a routine laboratory with respect to expenditure of
time, sample tracking and reproducible sample quality. In addition,
an accurate and reliable DNA quantification system is necessary for
good and constant MPS performance (12).
In the present study, we compared three different
MPS platforms: PGM Ion Torrent™ from Life Technologies™, MiSeq™
from Illumina® and GS Junior from Roche. We used lung
cancer samples, obtained from the clinical setting, with a known
EGFR and KRAS mutation status. Samples included large
tumour resections, as well as small fine needle biopsies. In our
comparison, three different multiplex primer panels, tailored to
the needs of the respective sequencing platforms were used in the
participating institutes, mirroring the individual approaches that
may be used for routine testing.
Materials and methods
Samples
A total of 30 tumour samples was collected from 2010
to 2013. All samples were lung adenocarcinomas and each institute
contributed 10 samples. Tumours were diagnosed by experienced
pathologists and the tumour content was determined by the visual
inspection of hematoxylin and eosin (H&E)-stained corresponding
sections. The mutation status of the samples was determined
previously in routine molecular diagnostics in each institute using
conventional methods.
DNA isolation
All tissue specimens were fixed in neutral-buffered
formalin prior to paraffin embedding (FFPE samples). Tumour areas
were marked by a pathologist on an H&E-stained slide and DNA
was extracted from corresponding unstained 10-µm-thick
slides by manual macrodissection. Following treatment with
proteinase K, the DNA was isolated by either automated or manual
extraction: BioRobot M48 (institute A), the QIAamp DNA FFPE Tissue
kit (institute B), QIASymphony SP (institute C) (all from Qiagen,
Hilden, Germany) or the Maxwell 16 Research system (institute C;
Promega, Madison, WI, USA) following the manufacturer's
instructions.
DNA quality and quantity
The quality and quantity of the isolated DNA samples
were assessed by agarose gel electrophoresis and measured
fluorimetrically using the Qubit® HS DNA assay (Life
Technologies, Darmstadt, Germany) in institute A. The quantity of
the isolated DNA was measured spectrophotometrically using the
NanoDrop 2000c spectrophotometer (Thermo Fisher Scientific,
Waltham, MA, USA) in institute B. In institute C, the DNA content
was measured fluorimetrically using the Qubit HS DNA assay (Life
Technologies) and using a qPCR-based method (RNaseP Detection
system; Life Technologies).
Massive parallel sequencing
Illumina® MiSeq™
platform
MiSeq (Illumina, San Diego, CA, USA) was used in
institute A. The custom-made lung cancer panel consisted of 102
amplicons for the detection of hotspot mutations in 14 lung
cancer-related genes. A full list of the covered amplicons is
provided in Table I. Isolated DNA
(20 ng) was amplified with 2 customised Ion AmpliSeq™ Primer Pools
for 15 sec at 99°C and 4 min at 60°C for 29 cycles, with an initial
denaturating step at 99°C for 2 min. PCR products from the same
patient were pooled following treatment with FuPa reagent.
Following purification with Agencourt AMPure XP (Beckman Coulter,
Brea, CA, USA), the PCR products were incubated with NEXTflex™ DNA
Adenylation Mix (Bioo Scientific Corp., Austin, TX, USA). Adapters
were supplied by NEXTflex™ DNA Barcodes (Bioo Scientific Corp.).
After the bead-mediated size selection, NEXTflex™ PCR Master Mix
(Bioo Scientific Corp.) was used for the final PCR amplification at
98°C for 15 sec and 60°C for 1 min for 10 cycles, with an initial
denaturating step at 98°C for 2 min. Library products were
quantified using a Qubit® 2.0 Fluorometer
(Qubit® dsDNA HS kit; Life Technologies), diluted and
pooled in equal amounts. A total of 6–8 pM was spiked with 5% PhiX
DNA and sequenced using the MiSeq™ reagent kit V2 (300 cycles)
(both from Illumina). Data were exported as FASTQ files.
 | Table IOverview of the institute-specific
gene panels. |
Table I
Overview of the institute-specific
gene panels.
| Chromosome | From (hg19) | To (hg19) | Gene name | Exon |
|---|
| Custom panel
Heidelberg |
| chr1 | 27056234 | 27056365 | ARID1A | 2 |
| chr1 | 27057662 | 27057775 | ARID1A | 3 |
| chr1 | 27057875 | 27058001 | ARID1A | 3 |
| chr1 | 27092899 | 27093023 | ARID1A | 10 |
| chr1 | 27094337 | 27094460 | ARID1A | 11 |
| chr1 | 27099336 | 27099464 | ARID1A | 14 |
| chr1 | 27100275 | 27100411 | ARID1A | 17 |
| chr1 | 27105906 | 27106030 | ARID1A | 20 |
| chr1 | 27106449 | 27106570 | ARID1A | 20 |
| chr1 | 27106750 | 27106883 | ARID1A | 20 |
| chr1 | 115256484 | 115256587 | NRAS | 3 |
| chr1 | 115258676 | 115258805 | NRAS | 2 |
| chr1 | 150549826 | 150549952 | MCL-1 | 3 |
| chr1 | 150551531 | 150551670 | MCL-1 | 1 |
| chr2 | 178098765 | 178098890 | NFE2L2 | 2 |
| chr3 | 41266029 | 41266147 | CTNNB1 | 3 |
| chr3 | 41266893 | 41267010 | CTNNB1 | 5 |
| chr3 | 41275089 | 41275211 | CTNNB1 | 9 |
| chr3 | 178916892 | 178917000 | PIK3CA | 2 |
| chr3 | 178921523 | 178921633 | PIK3CA | 5 |
| chr3 | 178928050 | 178928160 | PIK3CA | 8 |
| chr3 | 178936022 | 178936106 | PIK3CA | 10 |
| chr3 | 178938830 | 178938960 | PIK3CA | 14 |
| chr3 | 178952038 | 178952157 | PIK3CA | 21 |
| chr3 | 181430178 | 181430283 | SOX2 | 1 |
| chr3 | 181430516 | 181430649 | SOX2 | 1 |
| chr4 | 1803550 | 1803636 | FGFR3 | 7 |
| chr4 | 1808277 | 1808409 | FGFR3 | 16 |
| chr4 | 55131108 | 55131222 | PDGFRA | 5 |
| chr4 | 55139749 | 55139881 | PDGFRA | 10 |
| chr4 | 55140692 | 55140818 | PDGFRA | 11 |
| chr4 | 55141036 | 55141156 | PDGFRA | 12 |
| chr4 | 55152001 | 55152128 | PDGFRA | 18 |
| chr4 | 55156632 | 55156764 | PDGFRA | 22 |
| chr4 | 55592107 | 55592203 | KIT | 9 |
| chr4 | 55593595 | 55593684 | KIT | 11 |
| chr4 | 153245407 | 153245522 | FBXW7 | 11 |
| chr4 | 153247237 | 153247369 | FBXW7 | 10 |
| chr4 | 153249405 | 153249530 | FBXW7 | 9 |
| chr5 | 1264501 | 1264634 | TERT | 11 |
| chr5 | 1293392 | 1293528 | TERT | 2 |
| chr6 | 66115100 | 66115214 | EYS | 7 |
| chr6 | 66204680 | 66204810 | EYS | 5 |
| chr7 | 55241602 | 55241732 | EGFR | 18 |
| chr7 | 55242411 | 55242544 | EGFR | 19 |
| chr7 | 55248974 | 55249100 | EGFR | 20 |
| chr7 | 55259416 | 55259546 | EGFR | 21 |
| chr7 | 92300724 | 92300853 | CDK6 | 5 |
| chr7 | 92403995 | 92404124 | CDK6 | 3 |
| chr7 | 116411944 | 116412066 | MET | 14 |
| chr7 | 116417426 | 116417508 | MET | 16 |
| chr7 | 140453110 | 140453232 | BRAF | 15 |
| chr7 | 140481387 | 140481511 | BRAF | 11 |
| chr8 | 38275705 | 38275835 | FGFR1 | 10 |
| chr8 | 38282107 | 38282241 | FGFR1 | 7 |
| chr8 | 128751156 | 128751293 | MYC | 2 |
| chr8 | 128752956 | 128753086 | MYC | 3 |
| chr9 | 5069993 | 5070100 | JAK2 | 12 |
| chr9 | 5073678 | 5073788 | JAK2 | 14 |
| chr9 | 5126715 | 5126797 | JAK2 | 25 |
| chr9 | 21970912 | 21971032 | CDKNA2 | 2 |
| chr9 | 21971086 | 21971218 | CDKNA2 | 2 |
| chr9 | 21974672 | 21974792 | CDKNA2 | 1 |
| chr9 | 139401722 | 139401834 | NOTCH1 | 22 |
| chr9 | 139404170 | 139404306 | NOTCH1 | 18 |
| chr9 | 139412260 | 139412400 | NOTCH1 | 8 |
| chr9 | 139413034 | 139413159 | NOTCH1 | 6 |
| chr10 | 89624207 | 89624322 | PTEN | 1 |
| chr10 | 89685258 | 89685374 | PTEN | 3 |
| chr10 | 89692864 | 89692987 | PTEN | 5 |
| chr10 | 89711806 | 89711936 | PTEN | 6 |
| chr10 | 89717622 | 89717747 | PTEN | 7 |
| chr10 | 89720778 | 89720902 | PTEN | 8 |
| chr10 | 123256020 | 123256129 | FGFR2 | 13 |
| chr10 | 123279495 | 123279622 | FGFR2 | 7 |
| chr11 | 533800 | 533929 | HRAS | 3 |
| chr11 | 534220 | 534349 | HRAS | 2 |
| chr11 | 69456096 | 69456216 | CCND1 | 1 |
| chr11 | 69458624 | 69458747 | CCND1 | 3 |
| chr11 | 119103162 | 119103275 | CBL | 2 |
| chr11 | 119148912 | 119149006 | CBL | 8 |
| chr11 | 119149215 | 119149290 | CBL | 9 |
| chr12 | 25380249 | 25380348 | KRAS | 3 |
| chr12 | 25398183 | 25398310 | KRAS | 2 |
| chr12 | 69210596 | 69210679 | MDM2 | 4 |
| chr12 | 69233038 | 69233165 | MDM2 | 11 |
| chr13 | 48881433 | 48881526 | RB1 | 2 |
| chr13 | 48916793 | 48916902 | RB1 | 3 |
| chr13 | 48923124 | 48923208 | RB1 | 6 |
| chr13 | 48951050 | 48951160 | RB1 | 13 |
| chr13 | 48954320 | 48954437 | RB1 | 16 |
| chr13 | 48955427 | 48955539 | RB1 | 17 |
| chr13 | 49027105 | 49027191 | RB1 | 18 |
| chr13 | 49033834 | 49033935 | RB1 | 20 |
| chr13 | 49037844 | 49037955 | RB1 | 21 |
| chr13 | 49039144 | 49039221 | RB1 | 22 |
| chr13 | 49039304 | 49039410 | RB1 | 23 |
| chr14 | 36987081 | 36987213 | NKX-2.1 | 2 |
| chr14 | 36988227 | 36988351 | NKX-2.1 | 1 |
| chr14 | 105246470 | 105246589 | AKT1 | 3 |
| chr17 | 7573886 | 7574019 | TP53 | 10 |
| chr17 | 7576836 | 7576950 | TP53 | 9 |
| chr17 | 7577028 | 7577157 | TP53 | 8 |
| chr17 | 7577492 | 7577629 | TP53 | 7 |
| chr17 | 7578180 | 7578289 | TP53 | 6 |
| chr17 | 7578425 | 7578555 | TP53 | 5 |
| chr17 | 7579278 | 7579397 | TP53 | 4 |
| chr17 | 7579454 | 7579566 | TP53 | 4 |
| chr17 | 37880169 | 37880287 | ERBB2 | 19 |
| chr17 | 37880958 | 37881089 | ERBB2 | 20 |
| chr18 | 48581196 | 48581323 | SMAD4 | 5 |
| chr18 | 48584702 | 48584826 | SMAD4 | 7 |
| chr18 | 48591813 | 48591934 | SMAD4 | 9 |
| chr18 | 48604680 | 48604811 | SMAD4 | 12 |
| chr19 | 1206977 | 1207113 | STK11 | 1 |
| chr19 | 1218379 | 1218488 | STK11 | 2 |
| chr19 | 1220390 | 1220504 | STK11 | 4 |
| chr19 | 1220594 | 1220684 | STK11 | 5 |
| chr19 | 1221205 | 1221340 | STK11 | 6 |
| chr19 | 1223020 | 1223155 | STK11 | 8 |
| chr19 | 10599879 | 10600011 | KEAP1 | 5 |
| chr19 | 10600372 | 10600496 | KEAP1 | 4 |
| chr19 | 10602263 | 10602390 | KEAP1 | 3 |
| chr19 | 10602579 | 10602708 | KEAP1 | 3 |
| chr19 | 10602796 | 10602912 | KEAP1 | 3 |
| chr19 | 10610088 | 10610218 | KEAP1 | 2 |
| chr19 | 10610289 | 10610416 | KEAP1 | 2 |
| chr19 | 10610465 | 10610599 | KEAP1 | 2 |
| chr19 | 11094812 | 11094945 | SMARCA4 | 2 |
| chr19 | 11136088 | 11136220 | SMARCA4 | 22 |
| chr19 | 11138426 | 11138556 | SMARCA4 | 23 |
| chr19 | 11141448 | 11141561 | SMARCA4 | 25 |
| chr19 | 11144042 | 11144179 | SMARCA4 | 26 |
| chr19 | 30308024 | 30308156 | CCNE1 | 5 |
| chr19 | 30313134 | 30313262 | CCNE1 | 10 |
| chrX | 47028755 | 47028888 | RBM10 | 3 |
| chrX | 47034396 | 47034523 | RBM10 | 5 |
| chrX | 63411268 | 63411399 | FAM123B/AMER1 | 1 |
| chrX | 63412836 | 63412964 | FAM123B/AMER1 | 1 |
| Custom panel
Cologne |
| chr1 | 115256352 | 115256453 | NRAS | 3 |
| chr1 | 115256453 | 115256550 | NRAS | 3 |
| chr1 | 115256550 | 115256672 | NRAS | 3 |
| chr1 | 115258676 | 115258798 | NRAS | 2 |
| chr1 | 162688829 | 162688951 | DDR2 | 3 |
| chr1 | 162722872 | 162722995 | DDR2 | 4 |
| chr1 | 162724359 | 162724466 | DDR2 | 5 |
| chr1 | 162724466 | 162724586 | DDR2 | 5 |
| chr1 | 162724586 | 162724687 | DDR2 | 5 |
| chr1 | 162724850 | 162724967 | DDR2 | 6 |
| chr1 | 162724967 | 162725094 | DDR2 | 6 |
| chr1 | 162725447 | 162725572 | DDR2 | 7 |
| chr1 | 162729566 | 162729694 | DDR2 | 8 |
| chr1 | 162729681 | 162729782 | DDR2 | 8 |
| chr1 | 162730973 | 162731107 | DDR2 | 9 |
| chr1 | 162731107 | 162731197 | DDR2 | 9 |
| chr1 | 162731197 | 162731276 | DDR2 | 9 |
| chr1 | 162735765 | 162735879 | DDR2 | 10 |
| chr1 | 162736904 | 162737029 | DDR2 | 11 |
| chr1 | 162737029 | 162737154 | DDR2 | 11 |
| chr1 | 162740090 | 162740201 | DDR2 | 12 |
| chr1 | 162740201 | 162740327 | DDR2 | 12 |
| chr1 | 162741756 | 162741887 | DDR2 | 13 |
| chr1 | 162741887 | 162742002 | DDR2 | 13 |
| chr1 | 162742002 | 162742088 | DDR2 | 13 |
| chr1 | 162743204 | 162743301 | DDR2 | 14 |
| chr1 | 162743301 | 162743421 | DDR2 | 14 |
| chr1 | 162745384 | 162745513 | DDR2 | 15 |
| chr1 | 162745513 | 162745634 | DDR2 | 15 |
| chr1 | 162745915 | 162746038 | DDR2 | 16 |
| chr1 | 162746038 | 162746162 | DDR2 | 16 |
| chr1 | 162748317 | 162748432 | DDR2 | 17 |
| chr1 | 162748432 | 162748519 | DDR2 | 17 |
| chr1 | 162749866 | 162749977 | DDR2 | 18 |
| chr1 | 162749977 | 162750066 | DDR2 | 18 |
| chr2 | 29432650 | 29432776 | ALK | 25 |
| chr2 | 29436843 | 29436974 | ALK | 24 |
| chr2 | 29443565 | 29443688 | ALK | 23 |
| chr2 | 29443688 | 29443772 | ALK | 23 |
| chr2 | 29445200 | 29445332 | ALK | 22 |
| chr2 | 29445369 | 29445489 | ALK | 21 |
| chr3 | 41266072 | 41266193 | CTNNB1 | 3 |
| chr3 | 178935940 | 178936023 | PIK3CA | 9 |
| chr3 | 178936023 | 178936105 | PIK3CA | 9 |
| chr3 | 178936092 | 178936180 | PIK3CA | 9 |
| chr3 | 178951824 | 178951942 | PIK3CA | 20 |
| chr3 | 178951942 | 178952063 | PIK3CA | 20 |
| chr3 | 178952063 | 178952155 | PIK3CA | 20 |
| chr7 | 55241596 | 55241679 | EGFR | 18 |
| chr7 | 55241679 | 55241800 | EGFR | 18 |
| chr7 | 55242411 | 55242539 | EGFR | 19 |
| chr7 | 55248984 | 55249117 | EGFR | 20 |
| chr7 | 55249117 | 55249200 | EGFR | 20 |
| chr7 | 55259367 | 55259486 | EGFR | 21 |
| chr7 | 55259484 | 55259567 | EGFR | 21 |
| chr7 | 116411701 | 116411801 | cMET | intron 13/14 |
| chr7 | 116411801 | 116411909 | cMET | 14 |
| chr7 | 116411894 | 116411998 | cMET | intron 13/14 |
| chr7 | 116411998 | 116412072 | cMET | 14 |
| chr7 | 140453023 | 140453099 | BRAF | 15 |
| chr7 | 140453099 | 140453224 | BRAF | 15 |
| chr7 | 140481297 | 140481387 | BRAF | 11 |
| chr7 | 140481387 | 140481511 | BRAF | 11 |
| chr10 | 89624207 | 89624322 | PTEN | 1 |
| chr10 | 89653745 | 89653817 | PTEN | 2 |
| chr10 | 89653816 | 89653930 | PTEN | 2 |
| chr10 | 89685258 | 89685374 | PTEN | 3 |
| chr10 | 89690819 | 89690917 | PTEN | 4 |
| chr10 | 89692713 | 89692819 | PTEN | 5 |
| chr10 | 89692819 | 89692920 | PTEN | 5 |
| chr10 | 89692920 | 89693032 | PTEN | 5 |
| chr10 | 89711802 | 89711928 | PTEN | 6 |
| chr10 | 89711917 | 89712018 | PTEN | 6 |
| chr10 | 89717580 | 89717695 | PTEN | 7 |
| chr10 | 89717694 | 89717792 | PTEN | 7 |
| chr10 | 89720692 | 89720768 | PTEN | 8 |
| chr10 | 89720769 | 89720842 | PTEN | 8 |
| chr10 | 89724948 | 89725061 | PTEN | 9 |
| chr10 | 89725058 | 89725147 | PTEN | 9 |
| chr10 | 89725207 | 89725320 | PTEN | 9 |
| chr12 | 25380167 | 25380240 | KRAS | 3 |
| chr12 | 25380240 | 25380357 | KRAS | 3 |
| chr12 | 25398183 | 25398304 | KRAS | 2 |
| chr12 | 25398304 | 25398379 | KRAS | 2 |
| chr14 | 105246406 | 105246502 | AKT1 | 4 |
| chr14 | 105246500 | 105246583 | AKT1 | 4 |
| chr15 | 66727356 | 66727487 | MAP2K1 | 2 |
| chr15 | 66727487 | 66727602 | MAP2K1 | 2 |
| chr17 | 7577017 | 7577142 | TP53 | 8 |
| chr17 | 7577140 | 7577233 | TP53 | 8 |
| chr17 | 7577392 | 7577509 | TP53 | 7 |
| chr17 | 7577508 | 7577611 | TP53 | 7 |
| chr17 | 7578141 | 7578234 | TP53 | 6 |
| chr17 | 7578234 | 7578362 | TP53 | 6 |
| chr17 | 7578310 | 7578425 | TP53 | 5 |
| chr17 | 7578425 | 7578555 | TP53 | 5 |
| chr17 | 7579278 | 7579385 | TP53 | 4 |
| chr17 | 7579385 | 7579502 | TP53 | 4 |
| chr17 | 7579502 | 7579590 | TP53 | 4 |
| chr17 | 37880155 | 37880283 | HER2 | 19 |
| chr17 | 37880960 | 37881074 | HER2 | 20 |
| chr17 | 37881074 | 37881206 | HER2 | 20 |
GS Junior platform
GS Junior (Roche, Basel, Switzerland) was used in
institute B. Genomic DNA (10–250 ng) was used for the amplification
of EGFR exons 18–21 in a single multiplex reaction using the EGFR
18–21 MASTR assay and the 454 MID kit 1–8 (both from Multiplicom
N.V., Niel, Belgium) according to the manufacturer's instructions.
Libraries were purified, quantified, diluted to a final
concentration of 1×10⁶ molecules, multiplexed, clonally
amplified by emulsion PCR and sequenced on the GS Junior (Roche)
following the manufacturer's instructions. Amplicon libraries were
sequenced in two runs on 454 GS Junior with 15 samples each.
PGM Ion Torrent platform
PGM Ion Torrent (Life Technologies) was used in
institute C. For library preparation, the multiplex PCR-based Ion
Torrent™ AmpliSeq™ technology (Life Technologies) with a
custom-made lung cancer panel was used. The panel consisted of 139
primer pairs for the detection of hotspot mutations in 41 lung
cancer-related genes. A full list of the covered amplicons is
provided in Table I. Amplicon
library preparation was performed with the Ion AmpliSeq™ Library
kit v2.0 using approximately 10 ng of DNA as advised by the
manufacturer. The PCR cycling conditions were as follows: initial
denaturation: 99°C for 2 min, cycling: 21 cycles of 99°C, 15 sec
and 60°C, 4 min. PCR products were partially digested using FuPa
reagent as instructed, followed by the ligation of barcoded
sequencing adapters (Ion Xpress Barcode Adapters 1–16 kit; Life
Technologies). The final library was purified using Agencourt
AMPure XP magnetic beads (Beckman Coulter) and quantified using
qPCR (Ion Library Quantitation kit) on a StepOne qPCR machine (both
from Life Technologies). The individual libraries were diluted to a
final concentration of 100 pM and eight to ten libraries were
pooled and processed to library amplification on Ion Spheres using
an Ion PGM™ Template OT2 200 kit. Unenriched libraries were
quality-controlled using Ion Sphere quality control measurement on
a Qubit instrument. Following library enrichment (Ion OneTouch ES),
the library was processed for sequencing using the Ion Torrent 200
bp sequencing v2 chemistry and the barcoded libraries were loaded
onto a single 318 chip.
Data analysis
Illumina MiSeq platform
The FASTQ files were aligned against reference NCBI
build 37 (hg19) and annotated using a modified version of a
previously described method (13). The resulting BAM files were
visualized using the Integrative Genomics Viewer (IGV; http://www.broadinstitute.org/igv/). Called
variants were then imported into a FileMaker (FileMaker GmbH,
Germany) database for further analysis, annotation and reporting. A
5% cut-off for variant calls was used and the results were only
interpreted if the coverage was >100x.
GS Junior platform
Alignment against reference NCBI build 37 (hg19) and
variant calling was carried out using AVA software (Roche).
Thresholds for variant calling were set to a minimum allele
frequency of 5% with a coverage of at least 100x. All variants were
visually inspected using the AVA software (Roche). Annotation of
variants was done according to the HGVS nomenclature.
PGM Ion Torrent platform
Raw data processing, sequence generation and
alignment to the reference hg19 genome were conducted using the
Torrent Suite software (version 4.0; Life Technologies). Variants
were identified using the variant caller plug-in package. For
hotspot mutations, a minimum allele frequency of 3% was set and for
novel mutations, at least a 5% allele frequency was set as the
cut-off level (with coverage >100x). Annotation of variants was
performed with the CLC genomics workbench (version 6.5) followed by
the visual inspection of putative mutations using the IGV
browser.
Results
DNA concentration
DNA extraction from the 30 NSCLC samples was carried
out with three different DNA extraction systems and the DNA
concentration was measured using individual methods as described
above. Table II summarises the
resulting DNA concentrations. While the DNA concentration ranges
measured with the Qubit 2.0 fluorometer in institutes A and C were
comparable, the values measured using the NanoDrop 2000c
spectrophotometer in institute B were generally higher due to the
different principles of measurement. We observed a 1.4- to 856-fold
and a 3.9- to 156-fold difference in the concentrations of
institute B compared with the concentration values in institutes A
and C, respectively with average differences of 133- and 30-fold.
Particulary in samples with concentrations below 10 ng/µl,
the measurements showed high deviations (Table II). Although only minimal amounts
of DNA were measured in some samples from institutes A and C, the
maximum volume possible was used for the massive parallel analysis
for comparative purposes.
| Table IIDNA concentration. |
Table II
DNA concentration.
| Sample no. | Institute A
(ng/µl) | Institute B
(ng/µl) | Institute C
(ng/µl) |
|---|
| 1 | 31 | 362.9 | 20.8 |
| 2 | 2.9 | 7.84 | 0.85 |
| 3 | 3.32 | 109.16 | 7.81 |
| 4 | 0.1 | 4.03 | 0.41 |
| 5 | 12.8 | 186.49 | 11.7 |
| 6 | 7.5 | 14.92 | 1.15 |
| 7 | 16.6 | 374.76 | 4.55 |
| 8 | 2.44 | 24.24 | 1.48 |
| 9 | 26.6 | 504.4 | 44.8 |
| 10 | 0.1 | 3.61 | <0.5 |
| 11 | 10.3 | 26.1 | 3.42 |
| 12 | 5.7 | 266.83 | 2.36 |
| 13 | 8.06 | 11.58 | 2.94 |
| 14 | 4.56 | 21.62 | 1.18 |
| 15 | 2.06 | 28.72 | 4.94 |
| 16 | 2.7 | 15.64 | 1.25 |
| 17 | 1.29 | 25.68 | 3.58 |
| 18 | 3.78 | 17.32 | 1.99 |
| 19 | 0.1 | 19.24 | 4.3 |
| 20 | 8.8 | 204.08 | 1.3 |
| 21 | 0.1 | 1.3 | 0.1 |
| 22 | 18.4 | 470.92 | 12.2 |
| 23 | 0.83 | 204.61 | 6.08 |
| 24 | 0.97 | 52.5 | 5.34 |
| 25 | 0.16 | 103.01 | 2.85 |
| 26 | 0.3 | 103.01 | 8.52 |
| 27 | 0.24 | 60.02 | 1.31 |
| 28 | 0.1 | 85.57 | 1.06 |
| 29 | 0.1 | 47.74 | 0.7 |
| 30 | 0.1 | 56.77 | 4.2 |
Platform comparison summary
The median amplicon sizes for all platforms ranged
from 125–345 bp, allowing the amplification of target sequences
from degraded DNA obtained from FFPE material (Table III). The number of analysed
amplicons ranged from 4 up to 137. Depending on the platform used,
the number of samples analysed in one single run varied from 8 up
to 48. The maximum number of median reads per sample was
approximately 500.000 on the PGM followed by approximately 350.000
on the MiSeq and 5007 reads on the GS Junior. In general, the read
coverage for each amplicon was considered to be sufficient for each
sample with median values of between 1290 and 7409.
| Table IIISequencing statistics. |
Table III
Sequencing statistics.
| MiSeq™ | PGM Ion
Torrent™ | GS Junior |
|---|
| No. of
Amplicons | 102 | 137 | 4 |
| Median amplicon
size | 150 bp | 125 bp | 345 bp |
| Samples/run | 48 | 8–10 | 15 |
| Median
reads/sample | ~350.000 | ~ 500.000 | 5007 |
| Median
coverage/amplicon | 7409x | 2500x | 1290x |
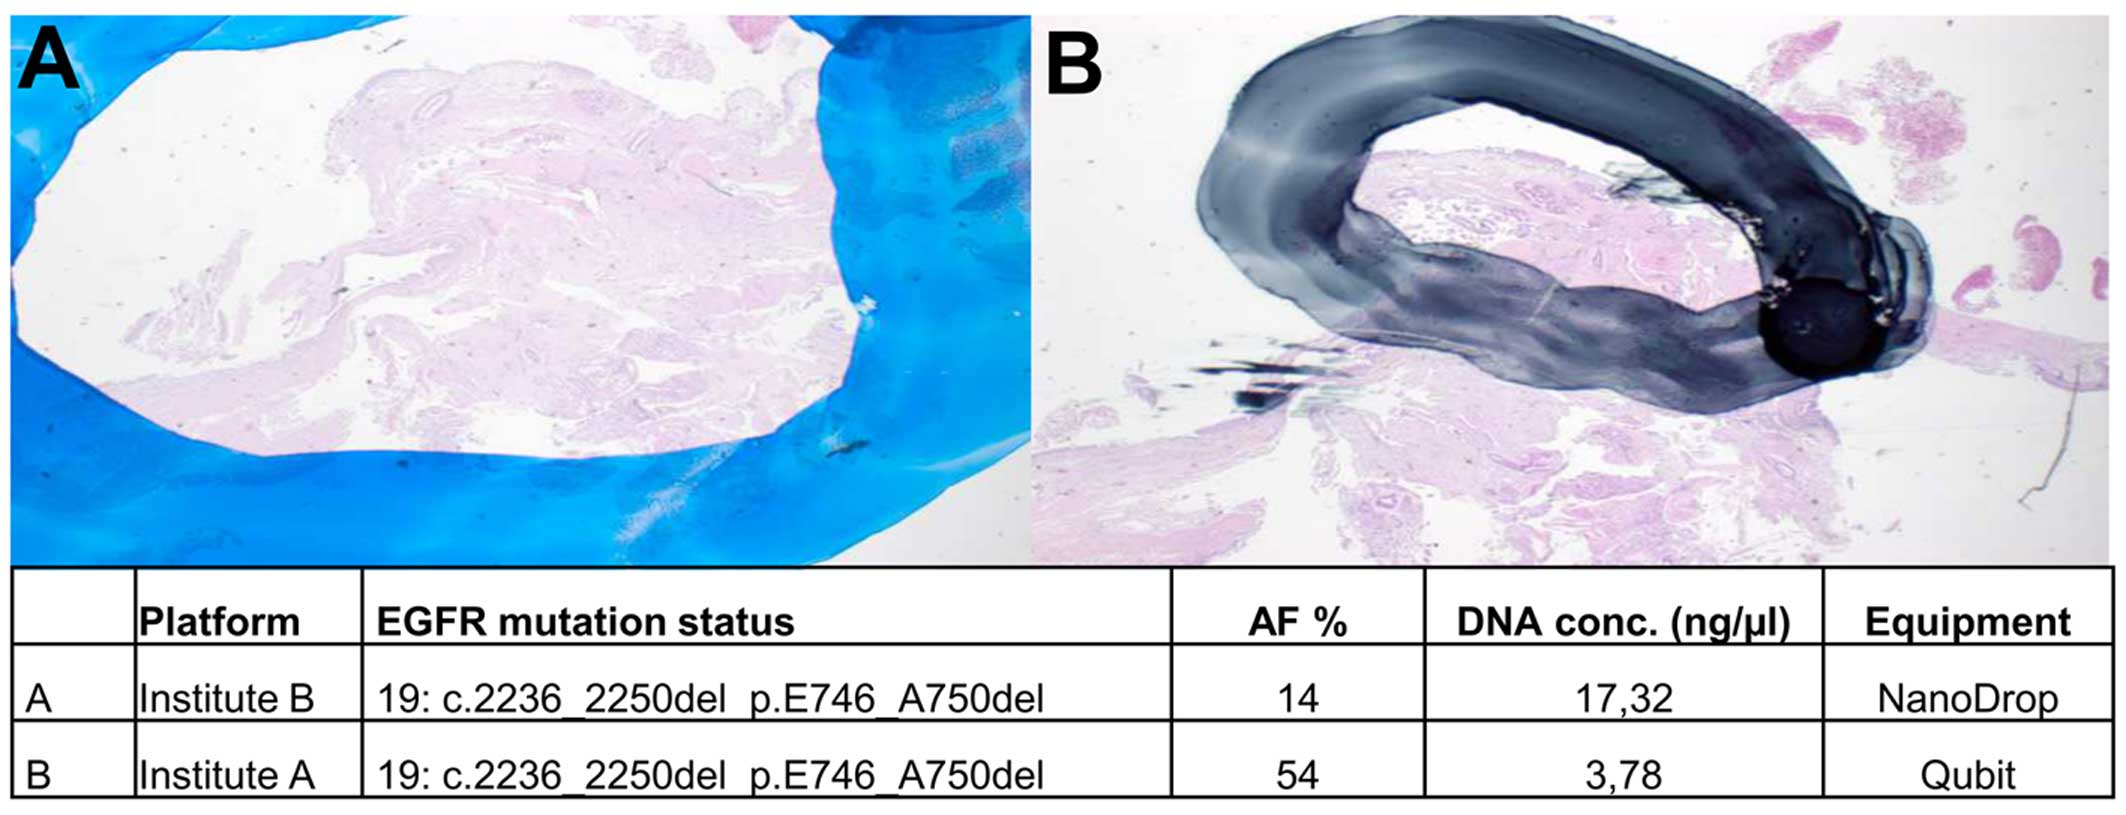
Influence of macrodissection
Manual macrodissection of marked regions on
unstained sections was performed to enrich for tumour cells in the
extraction. Depending on the strictness of separating tumour cells
from normal cells, the resulting allele frequencies for mutant vs.
wild-type alleles can vary. This is of particular importance when
analysing samples with low tumour cell content or when allele
frequencies are expected to be low. Depending on the size of the
marked area, the proportion of tumour and normal cells and
therewith the allele frequencies could differ in the same sample.
This is exemplified in Fig. 1;
the area used for DNA extraction was larger in institute B than in
institute A. Thus, the corresponding allele frequencies for the
EGFR mutation of this sample were determined to be 14 and
54%, respectively.
Detection of EGFR mutations
Concerning the expected EGFR mutation status,
we found concordance in 26 out of 26 samples (Table IV). In all samples, the
EGFR mutation status was correctly identified by all
participants using a 5% threshold for allele frequencies and at
least a coverage rate of 100 (Table
IV). The EGFR mutation status of our sample cohort was
comprised of 12 single point mutations, 9 complex exon 19
deletions/insertions and 11 wild-type samples. In three cases, two
EGFR mutations were present (Table IV, nos. 1, 20 and 21).
| Table IVEGFR mutation status. |
Table IV
EGFR mutation status.
| Case | Expected
result | A | B | C | Tumor cell
content | A | B | C | A AF% | B AF% | C AF% |
|---|
| 1 | p.G719A | √ | √ | √ | 50 | 13936 | 4917 | 3001 | 20 | 15 | 24 |
| 1 | p.V834L | √ | √ | √ | 50 | 9112 | 4917 | 4829 | 17 | 18 | 22 |
| 2 | p.L838R | √ | √ | √ | 80 | 1430 | 10143 | 5885 | 17 | 17 | 17 |
| 3 | p.E746_A750del | √ | √ | √ | 60 | 10584 | 3379 | 9216 | 79 | 45 | 44 |
| 4 | p.E746_A750del | √ | √ | √ | 10 | 1102 | 512 | 5116 | 23 | 18 | 22 |
| 5 | wt | √ | √ | √ | 90 | wt | wt | wt | | | |
| 6 | wt | √ | √ | √ | 70 | wt | wt | wt | | | |
| 7 | wt | √ | √ | √ | 60 | wt | wt | wt | | | |
| 8 | wt | √ | √ | √ | 30 | wt | wt | wt | | | |
| 9 | wt | √ | √ | √ | 30 | wt | wt | wt | | | |
| 10 | – | n.a. | n.a. | n.a. | 80 | n.a. | n.a. | n.a. | | | |
| 11 | p.E746_A750del | √ | √ | √ | 60 | 9562 | 5020 | 1947 | 67 | 60 | 49 |
| 12 | p.L858R | √ + p.T790M | √ | √ | 50 | 29429/34779 | 8291 | 2820 | 28/1.03 | 21 | 12 |
| 13 | p.E746_A750del | √ | √ | √ | 40 | 9936 | 11132 | 2820 | 31 | 29 | 25 |
| 14 | p.L858R | √ | √ | √ | 30 | 35355 | 6911 | 5693 | 36 | 33 | 13 |
| 15 | p.L858R | √ | √ | √ | 50 | 14143 | 1381 | 3407 | 31 | 41 | 31 |
| 16 | p.E746_A750del | √ | √ | √ | 70 | 11546 | 1472 | 1975 | 34 | 51 | 33 |
| 17 | p.L858R | n.a. | n.a. | √ | 70 | n.a. | n.a. | 3336 | n.a. | n.a. | 20 |
| 18 | p.E746_A750del | √ | √ | √ | n.d. | 4179 | 406 | 1521 | 54 | 14 | 10 |
| 19 |
p.L747_A751delinsP | √ | n.a. | √ | 70 | 7445 | n.a. | 1585 | 75 | n.a. | 54 |
| 20 |
p.L747_P753delinsS | √ | √ | √ | 80 | 8010 | 5816 | 4221 | 75 | 59 | 49 |
| 20 | p.A755D | √ | √ | √ | 80 | 7297 | 5816 | 4221 | 74 | 59 | 59 |
| 21 | p.E709A | √ | √ | √ | 80 | 716 | 3273 | 4662 | 23 | 24 | 22 |
| 21 | p.G719S | √ | √ | √ | 80 | 2102 | 3273 | 4640 | 9 | 24 | 20 |
| 22 | p.E746_A750del | √ | √ | √ | 50 | 8391 | 33615 | 1968 | 62 | 56 | 50 |
| 23 | p.L858R | √ + p.T790M | √ | √ | 30 | 20413/10246 | 11389 | 1994 | 27/1.42 | 20 | 18 |
| 24 | p.L858R | √ | √ | √ | 30 | 9794 | 16509 | 1714 | 34 | 26 | 30 |
| 25 | wt | n.a. | √ | √ | 60 | wt | wt | wt | | | |
| 26 | wt | √ | √ | √ | 60 | wt | wt | wt | | | |
| 27 | wt | √ | √ | √ | 70 | wt | wt | wt | | | |
| 28 | wt | √ | √ | √ | 60 | wt | wt | wt | | | |
| 29 | wt | √ | √ | √ | 70 | wt | wt | wt | | | |
| 30 | wt | √ | √ | √ | n.d. | wt | wt | wt | | | |
In only one case (no. 10), parallel sequencing was
unsuccessful due to either failed PCR amplification or insufficient
coverage. This case, which could not be analysed by conventional
methods previously, was included intentionally to test the limits
of parallel sequencing. In three cases (nos. 17, 19 and 25) with
limited tumour material, parallel sequencing failed depending on
the DNA extraction method. Institute A, using the BioRobot M48, did
not get any sequencing results for samples 17 and 25, which was due
to high salt concentrations that inhibited the multiplex PCR.
Samples 17 and 19 could not be analysed by institute B due to the
high degradation of samples and failed amplification.
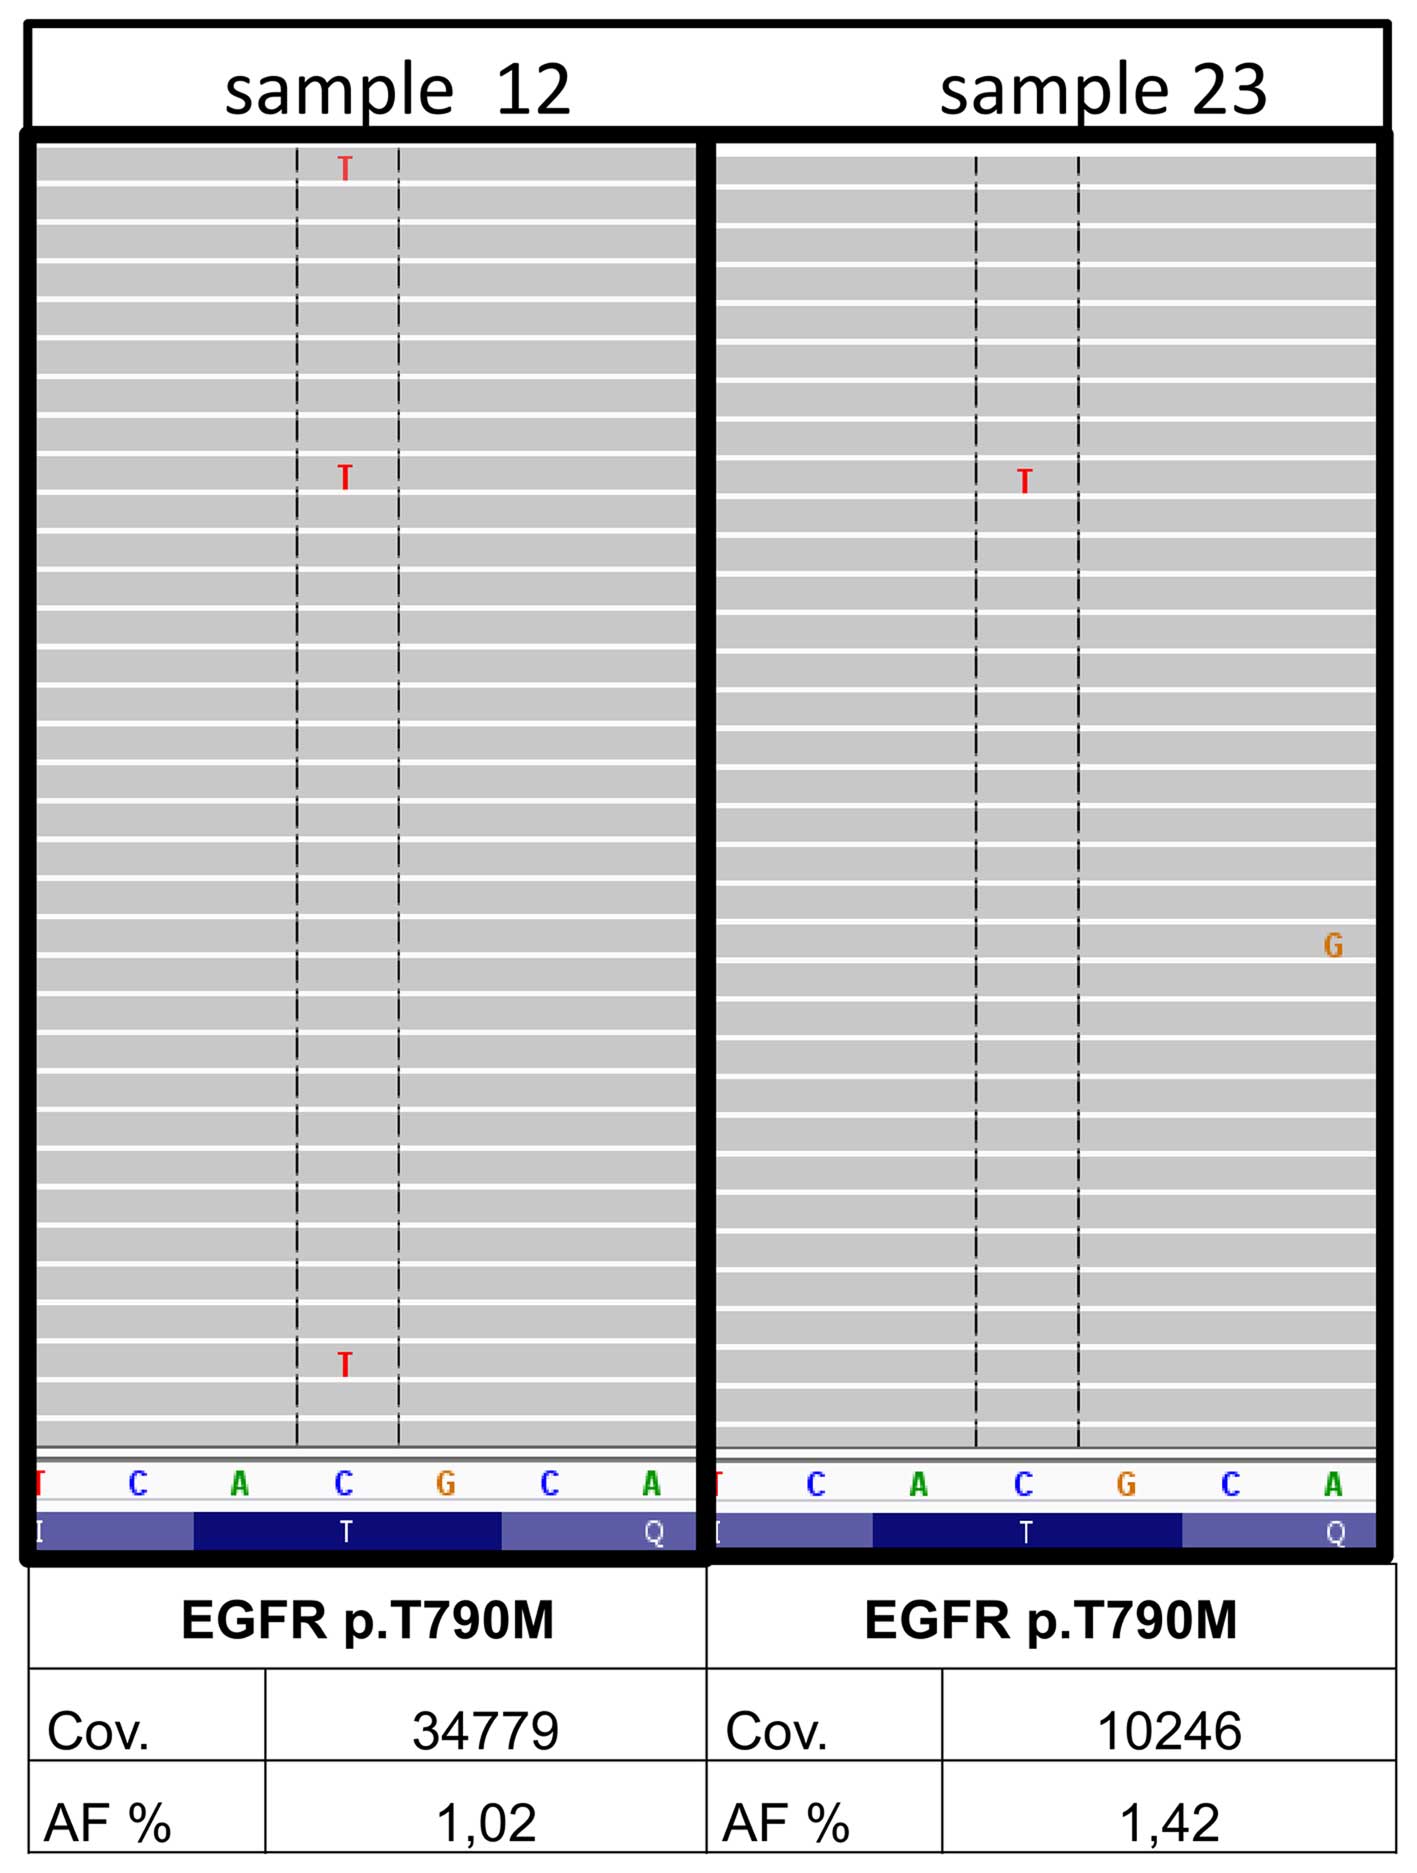
In 2 out of the 30 samples, minor p.T790M clones of
the EGFR gene were detected (nos. 12 and 23) by institute A.
The underlying mutation was found with 1.03 and 1.42% allele
frequency with a coverage of 34779 and 10246, respectively and
balanced forward and reverse reads (Fig. 3). A qPCR system
(therascreen® EGFR RGQ PCR kit; Qiagen) with a detection
limit of 1% allele frequency was used for the verification of
originally extracted DNA samples (BioRobot M48; Qiagen), newly
extracted DNA samples (Maxwell 16 Research system; Promega) from
both samples as well as the corresponding DNA samples from
institutes B and C. The minor variants could not be confirmed in
any of the DNA samples. Thus, the EGFR p.T790M found in the
first analysis most likely constitutes a fixation artefact.
Additional mutations and fixation
artefacts
Besides the EGFR mutations, additional
variants were identified by institutes A and C using more
comprehensive primer sets (Table
V). Concordance was found in 15 additional variants, whereas 16
variants could not be confirmed due to the missing inclusion of the
respective primers in the individual panels. Seven samples (nos. 1,
4, 8, 13, 20, 24 and 30) showed no additional mutations, which was
confirmed by both institutes.
| Table VAdditional variations. |
Table V
Additional variations.
| Case | Gene | Nucleotide
change | AA change | AF A (%) | AF C (%) |
|---|
| 1 | – | – | – | – | – |
| 2 | TP53 | c.469G>T | p.V157F | 80 | 79 |
| 3 | TP53 | c.637C>T | p.R213* | 79 | 34 |
| 4 | – | – | – | – | – |
| 5 | NKX2.1 | c.515A>C | p.Q172P | n.i. | 23 |
| RB1 | c.2267delA | p.Y756fs | n.i. | 91 |
| TP53 | c.733G>T | p.G245C | 87 | 91 |
| 6 | TP53 | c.641A>G | p.H214R | 33 | 23 |
| 7 | TP53 | c.830G>T | p.C277F | 23 | 44 |
| 8 | – | – | – | – | – |
| 9 | KRAS | c.35G>A | p.G12D | 2 | 5 |
| 10 | | | | n.a. | n.a. |
| 11 | TP53 | c.1073C>T | p.P295S | 1 | 5 |
| JAK3 | c.2164G>A | p.V722I | n.i. | 37 |
| 12 | TP53 | c.610G>T | p.E204* | 7 | 25 |
| 13 | – | – | – | – | – |
| 14 | ATM | c.2572T>C | p.F858L | n.i. | 66 |
| 15 | TP53 | c.913A>T | p.K305 | 26 | 20 |
| KIT | c.1621A>C | p.M541L | n.i. | 57 |
| 16 | SMO | c.979G>A | p.A327T | n.i. | 45 |
| 17 | – | – | – | n.a. | – |
| 18 | TP53 | c.530C>G | p.P177R | 26 | 8 |
| 19 | TP53 | c.725G>A | p.C242Y | 81 | 34 |
| TP53 | c.555C>G | p.S185R | 73 | n.i. |
| KIT | c.1621A>C | p.M541L | n.i. | 78 |
| PIK3CA | c.1633G>A | p.E545K | 44 | 4 |
| 20 | – | – | – | – | – |
| 21 | PIK3CA | c.1624G>A | p.E542K | 18 | 17 |
| 22 | CTNNB1 | c.98C>G | p.S33C | 33 | 31 |
| 23 | NOTCH1 | c.3604C>T | p.P1202S | n.i. | 5 |
| RBM10 | c.79delG | p.G27fs | n.i. | 17 |
| 24 | – | – | – | – | – |
| 25 | SMARCA4 | c.3634G>A | p.E1212K | n.i./n.a. | 5 |
| KRAS | c.35G>A | p.G12D | n.a. | 10 |
| 26 | KRAS | c.35G>A | p.G12D | 26 | 29 |
| 27 | KEAP1 | c.1426G>T | p.G476W | n.i. | 45 |
| MAP2K1 | c.171G>T | p.K57N | 45 | n.i. |
| 28 | CDK6 | c.584G>T | p.S195I | n.i. | 13 |
| CDKN2A | c.253C>T | p.Q85 | n.i. | 6 |
| 29 | HRAS | c.59C>T | p.T20I | n.i. | 5 |
| BRAF | c.1406G>A | p.G469E | FA | – |
| NRAS | c.178G>A | p.G60R | FA | – |
| PIK3CA | c.1633G>A | p.E545K | FA | – |
| 30 | – | – | – | – | – |
Concordant results were found in the genes
CTNNB1 (no. 22), PIK3CA (nos. 19 and 21) and most
frequently in TP53 (nos. 2, 3, 5, 6, 7, 11, 12, 15, 18 and
19). In two samples (nos. 9 and 26), a recurrent KRAS p.G12D
mutation was identified. Notably, in sample 9 this KRAS
mutation with a low allele frequency of 2.36 and 5%, respectively,
was identified by both institutes, thereby confirming the true
nature of this mutation (Table
V).
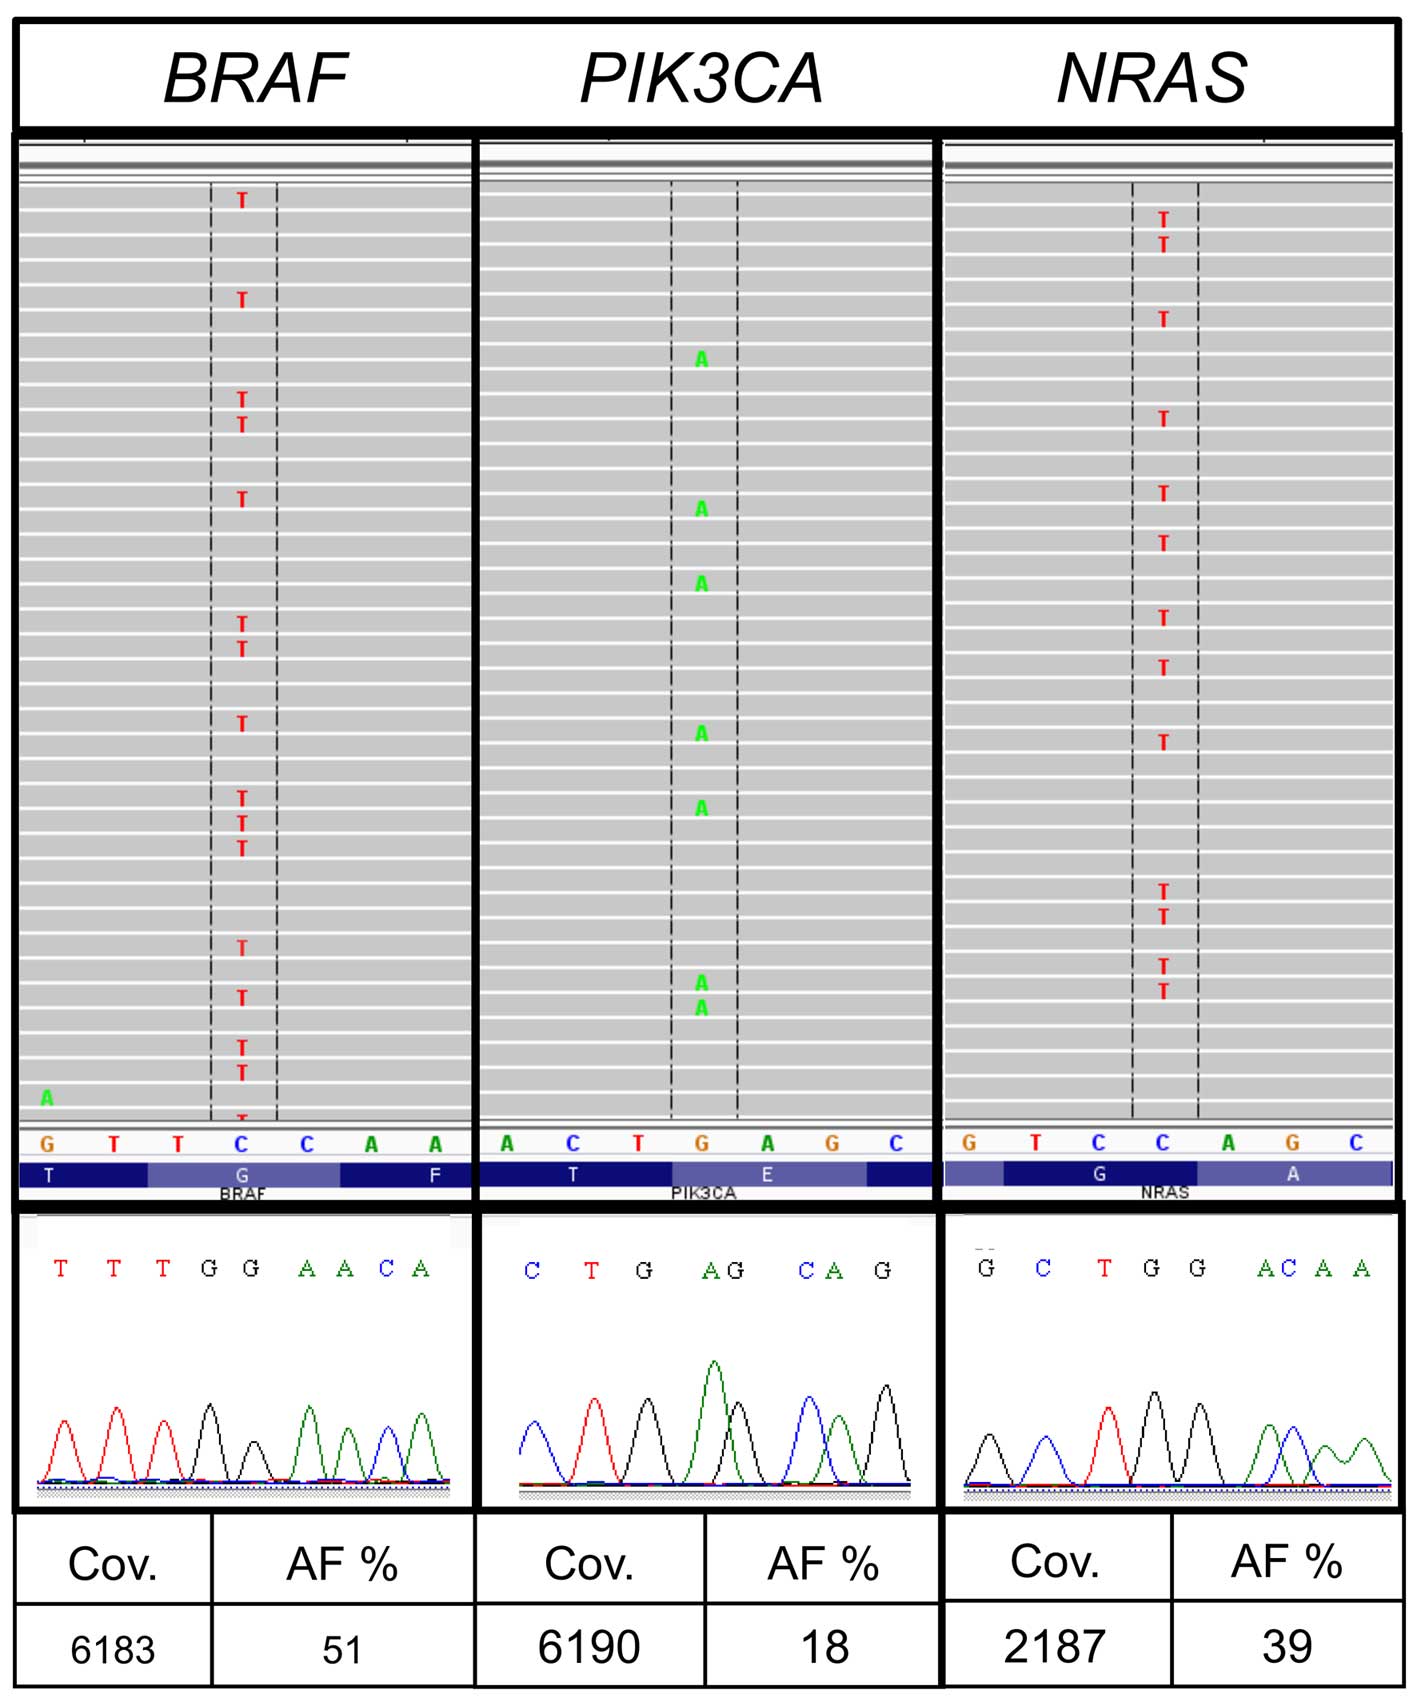
Divergent results were discovered in sample no. 29.
The average number of reported variants for each sample was 172 for
all allele frequencies and 23 for allele frequencies above 5% in
institute A. Sample no. 29 showed a markedly higher number of
variants (157) following bioinformatic analysis institute A. The
sample from institute A had a very low DNA concentration (Table II) and the variants were
predominantly G>A or T>C substitutions. The results included
besides other variants different hotspot mutations such as
BRAF c.1406G>A, p.G469E [allele frequency (AF), 51%;
coverage (cov), 6813], PIK3CA c.1633G>A, p.E545K (AF,
18%; cov, 6190) and NRAS c.178G>A, p.G60R (AF, 39%; cov,
2187) (Table V and Fig. For
verification, the respective regions were reanalysed with Sanger
sequencing as previously described (14). The mutations could not be
confirmed and were categorized as fixation artefacts.
Discussion
In routine pathological diagnostics mostly FFPE
material is available for molecular characterisation. With
decreasing sample sizes and increasing numbers of molecular
analyses, a targeted sequencing approach using MPS systems seems to
be required. Since it is well known that DNA extracted from FFPE is
degraded, with a maximum size of about 350 bp (15), approaches such as whole genome,
transcriptome or exome sequencing are, besides being
labour-intensive and expensive, not suitable for routine
diagnostics. Targeted sequencing with the focus on hotspot regions
is suitable for analysing FFPE material, in a cost-effective and
technically feasible way. Comparing the benchtop systems available
for parallel sequencing, they show all method-specific advantages
and disadvantages. The 454 GS Junior has a low throughput, but
generates at the same time long runs (16,17). The Ion Torrent PGM™ is a
cost-saving and fast system, but has a limited accuracy in
homopolymeric regions, which also applies to the 454 GS Junior
(1,16). The MiSeq has a very high
throughput and low error rates, but the runtime is long (17) and it needs a higher number of
samples per run to be cost efficient.
In this study, in comparing 30 lung cancer samples
with three different MPS platforms, we observed good concordance in
the detection of mutations using different DNA extraction methods,
quantification systems and individually designed primer panels. All
institutes analysed 26 out of 26 samples accurately concerning the
EGFR status.
Independently of the downstream methods used, the
crucial step in mutation analyses from tumour material is
macrodissection and therewith the selection of the right areas. A
tumour burden of 40% is recommended for Sanger sequencing (18). As MPS is more sensitive than
Sanger sequencing, the amount of tumour cells required may be lower
(19,20). Samples with low tumour cell
content are at risk of being reported as false-negative. In
contrast to our results (21)
found no correlation between H&E-based morphologic assessment
of tumour burden and the actual mutant allele frequency. In our
cohort, the absolute allele frequencies for certain variants showed
differences between the three laboratories, depending mainly on the
selection of the macrodissected area. Restricted marking of tumour
cells increases the detection thresholds, which may be critical for
variants with low allele frequencies. Unfortunately at the same
time there is an enhanced risk of 'mispicking' during the manual
dissecting process. The important role of manual macrodissection is
also emphasized by Ausch et al because the combination of
the content of tumour cells and the allele frequency leads to the
diagnostic study (22). We
recommend a careful pathologic review of each individual case
because the minimum percentage of tumour cells for doubtless
results has not yet been defined (23). From our results, we suggest a
tumour cell burden of at least 10%, which can also be reached in
small biopsies.
Through the development of minimally invasive
techniques biopsy sizes are decreasing. This is in contrast to the
ever increasing demands of immunohistochemistry stainings and
molecular analyses. Minimally invasive biopsies often deliver
insufficient amounts of tissue material for subsequent analyses. We
included one extra small tissue sample (no. 10) on purpose, which
was originally difficult to analyse by conventional methods, to
explore how the different MPS systems would cope with such a
sample. None of the institutes were able to extract sufficient DNA
for a reliable molecular analysis using next-generation sequencing
(NGS) technologies.
In institute A, two further samples could not be
analysed due to the high salt concentrations in BioRobot M48
extracts (12). The multiplex PCR
for the library generation was inhibited and samples failed
completely. Institute B could not analyse two samples as well due
to strong DNA degradation. This can be attributed to the manual
extraction method chosen byin institute B as it has been reported
that automated nucleic acid extraction ensures a standardisation of
sample processing and decreases time and variability in the
clinical laboratory (24,25). Additionally, it is well known that
manual extraction delivers less DNA than automated extraction
(26). In this study, a
comparison of the total DNA amounts is not possible due to the
different systems used for measuring of DNA concentration. In
institute C, using the automated QIASymphony SP system, only one
sample failed. This extraction system was previously shown to
generate DNA extracts with higher quality and concentration [Heydt
et al (12)].
In FFPE material, non-reproducible sequence
artefacts caused by DNA deamination induced by the sample fixation
are frequently detected by all sequence analysis methods. The
characteristic nucleotide transitions G>A and T>C had been
found by several groups (27–29). Sequence artefacts arising from
FFPE DNA are especially problematic when only limited amounts of
template DNA are used for PCR amplification [Wong et al
(29)]. In one of our samples, we
detected mutations in hotspot regions with the typical C>T and
G>A exchange which could not be validated by Sanger sequencing
although they had sufficient allele frequency and coverage in MPS
(Fig. 2).
Since the fixation artefacts are amplified during
all PCR-based methods and appear as false-positive variants, it is
advisable to reduce the DNA amplification steps during mutational
analyses. Hybrid selection methods like Nanostring® or
SureSelect (Agilent Technologies) work without a preamplification
step. Also, an approach from Udar et al where the two DNA
strands were processed individually minimises fixation artefacts
(30). Two independent libraries
were combined and sequenced on the MiSeq (Illumina) instrument.
Variant frequencies were calculated using information from both
strands and are narrowed down.
Notably, the KRAS mutation (c.35G>A, p.G12D) in
sample nine, which could also be attributed to a fixation artefact,
was identified by two institutes with allele frequencies of 2.36
and 5% confirming the true nature of this mutation (Table V). Most of the artefacts appear
once but not in duplicates so one solution to detect C>T (and
G>A) sequence artefacts when using FFPE-DNA is to prepare
analysis in duplicates. Verification of such low allele frequencies
with an alternative method is a challenge, because most methods
(Sanger sequencing, high resolution melting) have a higher
detection limit than MPS.
The majority of patients with lung cancer receiving
EGFR-tyrosine kinase inhibitor (TKI) therapy acquire resistance
after a median of 10–16 months (31). Intense study in these NSCLCs has
identified two major mechanisms of developing resistance to first
generation TKIs: secondary resistance mutations within the same
gene and 'oncogene kinase switch' systems with an overlap into
another pathway (32). Also, new
sensitive detection methods like MPS have identified a proportion
of TKI-naive tumours that carry the secondary resistance mutation
p.T790M in the EGFR gene; these resistant clones may be
selected after exposure to TKI inhibitors (32–35). In institute A, two samples (nos.
12 and 23) with minor clones for the EGFR resistance
mutation p.T790M were found (Table
IV). Due to the low allele frequency, validation with Sanger
sequencing seemed to be impossible. We therefore used a qPCR
approach with a detection limit of 1%. Neither the DNA extracts
from institutes B and C, nor the newly prepared or the primary DNA
extracts from institute A, showed the resistance mutation (data not
shown). Therefore, for the analysis of DNA from FFPE tissues, a
general detection limit of 5% seems to balance sensitivity vs.
reproducibility.
Acknowledgments
We thank Professor Wolfgang Hartmann (Institute of
Pathology, University Hospital Muenster) for performing the
pathological review of clinical material.
References
|
1
|
Endris V, Penzel R, Warth A, Muckenhuber
A, Schirmacher P, Stenzinger A and Weichert W: Molecular diagnostic
profiling of lung cancer specimens with a semiconductor-based
massive parallel sequencing approach: feasibility, costs, and
performance compared with conventional sequencing. J Mol Diagn.
15:765–775. 2013. View Article : Google Scholar : PubMed/NCBI
|
|
2
|
Clinical Lung Cancer Genome Project
(CLCGP); Network Genomic Medicine (NGM): A genomics-based
classification of human lung tumors. Sci Transl Med.
5:209ra1532013.PubMed/NCBI
|
|
3
|
Ulahannan D, Kovac MB, Mulholland PJ,
Cazier JB and Tomlinson I: Technical and implementation issues in
using next-generation sequencing of cancers in clinical practice.
Br J Cancer. 109:827–835. 2013. View Article : Google Scholar : PubMed/NCBI
|
|
4
|
Hagemann IS, Devarakonda S, Lockwood CM,
Spencer DH, Guebert K, Bredemeyer AJ, Al-Kateb H, Nguyen TT,
Duncavage EJ, Cottrell CE, et al: Clinical next-generation
sequencing in patients with non-small cell lung cancer. Cancer.
121:631–639. 2015. View Article : Google Scholar
|
|
5
|
Tops BB, Normanno N, Kurth H, Amato E,
Mafficini A, Rieber N, Le Corre D, Rachiglio AM, Reiman A, Sheils
O, et al: Development of a semi-conductor sequencing-based panel
for genotyping of colon and lung cancer by the Onconetwork
consortium. BMC Cancer. 15:262015. View Article : Google Scholar : PubMed/NCBI
|
|
6
|
Han JY, Kim SH, Lee YS, Lee SY, Hwang JA,
Kim JY, Yoon SJ and Lee GK: Comparison of targeted next-generation
sequencing with conventional sequencing for predicting the
responsiveness to epidermal growth factor receptor-tyrosine kinase
inhibitor (EGFR-TKI) therapy in never-smokers with lung
adenocarcinoma. Lung Cancer. 85:161–167. 2014. View Article : Google Scholar : PubMed/NCBI
|
|
7
|
de Koning TJ, Jongbloed JD,
Sikkema-Raddatz B and Sinke RJ: Targeted next-generation sequencing
panels for monogenetic disorders in clinical diagnostics: the
opportunities and challenges. Expert Rev Mol Diagn. 15:61–70. 2014.
View Article : Google Scholar : PubMed/NCBI
|
|
8
|
Meldrum C, Doyle MA and Tothill RW:
Next-generation sequencing for cancer diagnostics: A practical
perspective. Clin Biochem Rev. 32:177–195. 2011.PubMed/NCBI
|
|
9
|
Sikkema-Raddatz B, Johansson LF, de Boer
EN, Almomani R, Boven LG, van den Berg MP, van Spaendonck-Zwarts
KY, van Tintelen JP, Sijmons RH, Jongbloed JD and Sinke RJ:
Targeted next-generation sequencing can replace Sanger sequencing
in clinical diagnostics. Hum Mutat. 34:1035–1042. 2013. View Article : Google Scholar : PubMed/NCBI
|
|
10
|
Snow AN, Stence AA, Pruessner JA, Bossler
AD and Ma D: A simple and cost-effective method of DNA extraction
from small formalin-fixed paraffin-embedded tissue for molecular
oncologic testing. BMC Clin Pathol. 14:302014. View Article : Google Scholar : PubMed/NCBI
|
|
11
|
Marchetti I, Iervasi G, Mazzanti CM, Lessi
F, Tomei S, Naccarato AG, Aretini P, Alberti B, Di Coscio G and
Bevilacqua G: Detection of the BRAF(V600E) mutation in fine needle
aspiration cytology of thyroid papillary microcarcinoma cells
selected by manual macrodissection: an easy tool to improve the
preoperative diagnosis. Thyroid. 22:292–298. 2012. View Article : Google Scholar
|
|
12
|
Heydt C, Fassunke J, Künstlinger H, Ihle
MA, König K, Heukamp LC, Schildhaus HU, Odenthal M, Büttner R and
Merkelbach-Bruse S: Comparison of pre-analytical FFPE sample
preparation methods and their impact on massively parallel
sequencing in routine diagnostics. PLoS One. 9:e1045662014.
View Article : Google Scholar : PubMed/NCBI
|
|
13
|
Peifer M, Fernández-Cuesta L, Sos ML,
George J, Seidel D, Kasper LH, Plenker D, Leenders F, Sun R, Zander
T, et al: Integrative genome analyses identify key somatic driver
mutations of small-cell lung cancer. Nat Genet. 44:1104–1110. 2012.
View Article : Google Scholar : PubMed/NCBI
|
|
14
|
Ihle MA, Fassunke J, König K, Grünewald I,
Schlaak M, Kreuzberg N, Tietze L, Schildhaus HU, Büttner R and
Merkelbach-Bruse S: Comparison of high resolution melting analysis,
pyrosequencing, next generation sequencing and immunohistochemistry
to conventional Sanger sequencing for the detection of p.V600E and
non-p.V600E BRAF mutations. BMC Cancer. 14:132014. View Article : Google Scholar : PubMed/NCBI
|
|
15
|
Wang JH, Gouda-Vossos A, Dzamko N,
Halliday G and Huang Y: DNA extraction from fresh-frozen and
formalin-fixed, paraffin-embedded human brain tissue. Neurosci
Bull. 29:649–654. 2013. View Article : Google Scholar : PubMed/NCBI
|
|
16
|
Frey KG, Herrera-Galeano JE, Redden CL,
Luu TV, Servetas SL, Mateczun AJ, Mokashi VP and Bishop-Lilly KA:
Comparison of three next-generation sequencing platforms for
metagenomic sequencing and identification of pathogens in blood.
BMC Genomics. 15:962014. View Article : Google Scholar : PubMed/NCBI
|
|
17
|
Loman NJ, Misra RV, Dallman TJ,
Constantinidou C, Gharbia SE, Wain J and Pallen MJ: Performance
comparison of benchtop high-throughput sequencing platforms. Nat
Biotechnol. 30:434–439. 2012. View
Article : Google Scholar : PubMed/NCBI
|
|
18
|
Warth A, Penzel R, Brandt R, Sers C,
Fischer JR, Thomas M, Herth FJ, Dietel M, Schirmacher P and Bläker
H: Optimized algorithm for Sanger sequencing-based EGFR mutation
analyses in NSCLC biopsies. Virchows Arch. 460:407–414. 2012.
View Article : Google Scholar : PubMed/NCBI
|
|
19
|
Moskalev EA, Stöhr R, Rieker R, Hebele S,
Fuchs F, Sirbu H, Mastitsky SE, Boltze C, König H, Agaimy A, et al:
Increased detection rates of EGFR and KRAS mutations in NSCLC
specimens with low tumour cell content by 454 deep sequencing.
Virchows Arch. 462:409–419. 2013. View Article : Google Scholar : PubMed/NCBI
|
|
20
|
Hlinkova K, Babal P, Berzinec P, Majer I,
Mikle-Barathova Z, Piackova B and Ilencikova D: Evaluation of
2-year experience with EGFR mutation analysis of small diagnostic
samples. Diagn Mol Pathol. 22:70–75. 2013. View Article : Google Scholar : PubMed/NCBI
|
|
21
|
Portier BP, Kanagal-Shamanna R, Luthra R,
Singh R, Routbort MJ, Handal B, Reddy N, Barkoh BA, Zuo Z, Medeiros
LJ, et al: Quantitative assessment of mutant allele burden in solid
tumors by semiconductor-based next-generation sequencing. Am J Clin
Pathol. 141:559–572. 2014. View Article : Google Scholar : PubMed/NCBI
|
|
22
|
Ausch C, Buxhofer-Ausch V, Oberkanins C,
Holzer B, Minai-Pour M, Jahn S, Dandachi N, Zeillinger R and
Kriegshäuser G: Sensitive detection of KRAS mutations in archived
formalin-fixed paraffin-embedded tissue using mutant-enriched PCR
and reverse-hybridization. J Mol Diagn. 11:508–513. 2009.
View Article : Google Scholar : PubMed/NCBI
|
|
23
|
Pirker R, Herth FJ, Kerr KM, Filipits M,
Taron M, Gandara D, Hirsch FR, Grunenwald D, Popper H, Smit E, et
al: Consensus for EGFR mutation testing in non-small cell lung
cancer: results from a European workshop. J Thorac Oncol.
5:1706–1713. 2010. View Article : Google Scholar : PubMed/NCBI
|
|
24
|
Dundas N, Leos NK, Mitui M, Revell P and
Rogers BB: Comparison of automated nucleic acid extraction methods
with manual extraction. J Mol Diagn. 10:311–316. 2008. View Article : Google Scholar : PubMed/NCBI
|
|
25
|
Esona MD, McDonald S, Kamili S, Kerin T,
Gautam R and Bowen MD: Comparative evaluation of commercially
available manual and automated nucleic acid extraction methods for
rotavirus RNA detection in stools. J Virol Methods. 194:242–249.
2013. View Article : Google Scholar : PubMed/NCBI
|
|
26
|
van Eijk R, Stevens L, Morreau H and van
Wezel T: Assessment of a fully automated high-throughput DNA
extraction method from formalin-fixed, paraffin-embedded tissue for
KRAS, and BRAF somatic mutation analysis. Exp Mol Pathol.
94:121–125. 2013. View Article : Google Scholar
|
|
27
|
Do H and Dobrovic A: Sequence artifacts in
DNA from formalin-fixed tissues: Causes and strategies for
minimization. Clin Chem. 61:64–71. 2015. View Article : Google Scholar
|
|
28
|
Marchetti A, Felicioni L and Buttitta F:
Assessing EGFR mutations. N Engl J Med. 354:526–528. 2006.
View Article : Google Scholar : PubMed/NCBI
|
|
29
|
Wong SQ, Li J, Tan AY, Vedururu R, Pang
JM, Do H, Ellul J, Doig K, Bell A, MacArthur GA, et al: CANCER 2015
Cohort: Sequence artefacts in a prospective series of
formalin-fixed tumours tested for mutations in hotspot regions by
massively parallel sequencing. BMC Med Genomics. 7:232014.
View Article : Google Scholar
|
|
30
|
Udar N, Haigis R, Gros T, Kerry N, Barnes
B, Pokholok D, Ross M, Lucio-Eterovic AK, Zhang Q, Zenali M and
Jaeger E: A novel technique that distinguishes low-level somatic
DNA variants from FFPE-induced artifacts in solid tumors by
next-generation sequencing (NGS). International Association for the
Study of Lung Cancer. 2013.
|
|
31
|
Oxnard GR, Arcila ME, Sima CS, Riely GJ,
Chmielecki J, Kris MG, Pao W, Ladanyi M and Miller VA: Acquired
resistance to EGFR tyrosine kinase inhibitors in EGFR-mutant lung
cancer: distinct natural history of patients with tumors harboring
the T790M mutation. Clin Cancer Res. 17:1616–1622. 2011. View Article : Google Scholar :
|
|
32
|
Nguyen KS, Kobayashi S and Costa DB:
Acquired resistance to epidermal growth factor receptor tyrosine
kinase inhibitors in non-small-cell lung cancers dependent on the
epidermal growth factor receptor pathway. Clin Lung Cancer.
10:281–289. 2009. View Article : Google Scholar : PubMed/NCBI
|
|
33
|
Mok TS, Wu YL, Thongprasert S, Yang CH,
Chu DT, Saijo N, Sunpaweravong P, Han B, Margono B, Ichinose Y, et
al: Gefitinib or carboplatin-paclitaxel in pulmonary
adenocarcinoma. N Engl J Med. 361:947–957. 2009. View Article : Google Scholar : PubMed/NCBI
|
|
34
|
Rosell R, Molina MA, Costa C, Simonetti S,
Gimenez-Capitan A, Bertran-Alamillo J, Mayo C, Moran T, Mendez P,
Cardenal F, et al: Pretreatment EGFR T790M mutation and BRCA1 mRNA
expression in erlotinib-treated advanced non-small-cell lung cancer
patients with EGFR mutations. Clin Cancer Res. 17:1160–1168. 2011.
View Article : Google Scholar : PubMed/NCBI
|
|
35
|
Su KY, Chen HY, Li KC, Kuo ML, Yang JC,
Chan WK, Ho BC, Chang GC, Shih JY, Yu SL and Yang PC: Pretreatment
epidermal growth factor receptor (EGFR) T790M mutation predicts
shorter EGFR tyrosine kinase inhibitor response duration in
patients with non-small-cell lung cancer. J Clin Oncol. 30:433–440.
2012. View Article : Google Scholar : PubMed/NCBI
|