Introduction
In 2012, colorectal cancer was estimated to be the
third most common type of cancer after lung and prostate cancer in
men, and the second most common after breast cancer in women
worldwide. In terms of the mortality rate, it ranked fourth, after
cancer of the lungs, liver and stomach in both men and women
(1). Although colorectal cancer
is principally treated by surgery, chemotherapy and radiotherapy
may be given priority, depending on the stage of the disease. For
many years, 5-fluo-rouracil (5-FU) alone or 5-FU and leucovorin
were effectively used as chemotherapeutic agents for the treatment
of colorectal cancer. However, the survival benefit in patients
with metastatic colorectal cancer has been reported to be markedly
increased by the combined use of chemotherapeutic agents, such as
irinotecan and oxaliplatin with biological agents, such as
bevacizumab for anti-vascular endothelial growth factor (VEGF)
antibody therapy and cetuximab for anti-epidermal growth factor
receptor (EGFR) antibody therapy, in addition to cytotoxic agents
(2).
To increase the effectiveness of chemotherapy for
patients with colorectal cancer, it is necessary to establish
individualized treatment strategies and, therefore, identifying
factors associated with the effects of chemotherapy for colorectal
cancer also becomes important. Thymidylate synthase (TYMS), a 5-FU
target, requires 5,10-methylenetetrahydrofolate
(5,10-methylene-THF), a folate co-factor, as a methyl group donor
and methylates deoxyuridine monophosphate (dUMP) to become
deoxythymidine monophosphate (dTMP). It acts as a rate-limiting
enzyme during DNA synthesis (3).
As an active metabolite of 5-FU, 5-fluoro-dUMP (FdUMP) covalently
links with TYMS and 5,10-methylene-THF, forming a ternary complex
and inhibiting the TYMS response (3). Dihydropyrimidine dehydrogenase
(DPYD) is a rate-limiting enzyme catalyzing the response during the
first step of the catabolism of 5-FU (4). Thymidine phosphorylase (TYMP), which
is associated with the metabolism of 5-FU, is an enzyme catalyzing
the reversible phosphorolysis of 5-FU to 5-fluoro-2′-deoxyuridine.
TYMP is identical to platelet-derived endothelial-cell growth
factor and is thought to be involved in angiogenesis (5). Salonga et al (6) and Soong et al (7) reported that the mRNA or protein
expression of TYMS, DPYD and TYMP was associated with the antitumor
effects of 5-FU. Leucovorin is metabolized in vivo into
5,10-methylene-THF, strengthens the ternary complex of FdUMP, TYMS
and 5,10-methylene-THF, and strengthens the antitumor effects of
5-FU (8). Dihydrofolate reductase
(DHFR) catalyzes the conversion of dihydrofolate into
tetrahydrofolate, which is an important step in the generation of
5,10-methylene-THF (3). In
addition, folate is converted from the monoglutamate to the
polyglutamate form by folylpolyglutamate synthase (FPGS) and can
therefore be easily maintained within the cells, while the
polyglutamate chain is cleaved by gamma-glutamyl hydrolase (GGH)
and is converted into the monoglutamate form. It is thought that
the catalyzing of opposite reactions by FPGS and GGH in folate
metabolism is associated with the adjustment of folate levels in
cells, as well as with the augmentation of the effects of 5-FU by
leucovorin (9). Topoisomerase I
(TOP1), a target enzyme of irinotecan, destroys the superhelicity
observed in DNA during DNA metabolic processes, such as replication
and transcription; consequently, TOP1 plays a role in the
regulation of DNA topology (10).
The association of excision repair cross-complementing 1 (ERCC1),
reportedly associated with the effects of oxaliplatin, is an
excision nuclease involved in the nucleotide excision repair of DNA
and plays an important role in the repair of platinum-induced DNA
adducts (11,12). Both TOP1 and ERCC1 maintain the
normal structure of DNA and are important for DNA functionality.
VEGF is a key mediator in angiogenesis, consisting of multiple
steps, and its high-level expression is thought to be closely
associated with tumor growth and metastasis (13). EGFR plays an important role in the
signaling pathway of epithelial cell growth, and its activation is
thought to be closely associated with tumor invasion, metastasis
and angiogenesis (14). Both VEGF
and EGFR play important roles in signaling pathways associated with
cell growth, such as angiogenesis and proliferation.
It is well known that not only embryological,
morphological, physiological and molecular features, but also the
prognosis of patients and their sensitivity to chemotherapy depend
on whether the primary lesion of colorectal cancer is located on
the right or left side (15–18). Consequently, the location of the
colorectal cancer is thought to be important for deciding
individualized treatment for patients with colorectal cancer.
However, to the best of our knowledge, to date, there are few
studies available on the association between the location of the
colorectal cancer and the level of expression of genes related to
the effects of chemotherapy for colorectal cancer.
Previously, we performed large-scale population
studies investigating TYMS and DPYD activity, as well as protein
and mRNA expression in various types of solid tumors and reported
basic data regarding the comparisons of assays and the level of
expression, according to the carcinoma (19,20). In this study, primary tumors
obtained from 1,129 patients with colorectal cancer who received no
chemotherapy were used. After measuring the genes related to
standard chemotherapy for colorectal cancer (TYMS,
DPYD, TYMP, DHFR, FPGS, GGH,
TOP1, ERCC1, VEGF and EGFR), a
large-scale population analysis was performed for the purpose of
determining the association with clinicopathological features, and
in particular, the location of the colorectal cancer.
Patients and methods
Patients and samples
Between January 2008 and June 2012, we collected
samples from primary tumor surgeries conducted on 2,017 patients
with colorectal cancer in 39 hospitals across Japan. All the
hospitals participated in this study after approval was obtained
from the ethical review board of each hospital. Formalin-fixed
paraffin-embedded (FFPE) tumor specimens were used for the
measurement of mRNA expression. The primary lesions of 1,129
patients with colorectal cancer who did not receive any
chemotherapy were analyzed for the mRNA expression of 10 target
genes (TYMS, DPYD, TYMP, DHFR,
FPGS, GGH, TOP1, ERCC1, VEGF and
EGFR). Of these, 888 patients were not included in the
analysis: 80 patients (4.0%) who received pre-operative
chemotherapy; 6 patients (0.3%) who were diagnosed with
non-colorectal cancer based on a final pathological examination;
630 patients (31.2%) for whom some of the 10 target genes were not
analyzed, at the hospitals' request; 62 patients (3.1%) for whom
none of the 10 target genes were analyzable due to an inadequate
number of cancer cells in the FFPE tumor specimens; 110 patients
(5.5%) for whom one or more targeted genes were not analyzable due
to insufficient tumor volume or considerable variability in the
measured values. In addition, not detectable (n.d.) results were
included in the analyzed data. The clinicopathological features of
the patients were investigated based on the Japanese classification
of colorectal cancer: General Rules for Clinical and Pathological
Studies on Cancer of the Colon, Rectum and Anus, 7th edition
(21).
Analysis of mRNA expression
The analysis of mRNA expression was performed as
previously described (20).
Briefly, the tumor sections (10-µm-thick) were stained with
neutral fast red to enable histological visualization during
laser-capture microdissection (PALM Robot-microbeam system;
P.A.L.M. Microlaser Technologies AG, Munich, Germany), which was
performed to ensure that only the tumor cells were collected. RNA
was isolated from the FFPE tumor specimens using a novel
proprietary procedure (Response Genetics, Los Angeles, CA, USA;
United States Patent No. 6,248,535) and cDNA was obtained as
previously described (22). The
target cDNA sequences were amplified using quantitative polymerase
chain reaction (qPCR) and a fluorescence-based real-time detection
method [ABI PRISM 7900 Sequence Detection System (TaqMan); Applied
Biosystems, Foster City, CA, USA] as previously described (23–25). The qPCR reaction mixture consisted
of primers, dATP, dCTP, dGTP, dUTP, MgCl2 and TaqMan
buffer (all reagents were supplied by Applied Biosystems). The qPCR
conditions were 50°C for 10 sec and 95°C for 10 min, followed by 42
cycles at 95°C for 15 sec and 60°C for 1 min. The mRNA expression
levels were expressed as values relative to those of β-actin
(ACTB), which was used as the internal reference. If the
threshold cycle value for a gene of interest was ≥39.0, the
expression for that gene was considered to be not detectable
(n.d.), but in the case of ACTB it was measured
normally.
Statistical analysis
mRNA expression was analyzed as a variable which was
converted by using the natural logarithm and producing a normal
distribution. Pearson's pairwise correlation coefficient was used
to calculate the correlation of intergenic mRNA expression. For
hierarchical cluster analysis of mRNA expression, the data were
standardized using the means and standard deviation, while Ward's
method was used to calculate the distance between clusters. For the
equality of means, Welch's t-test or one-way analysis of variance
(ANOVA) was performed. The analysis of the contingency table was
performed using Fisher's exact test or χ2 test. JMP
version 9.0.2 (SAS Institute Japan Co., Ltd., Japan) was used for
analysis, and a p-value <0.05 (two-tailed) was considered to
indicate a statistically significant difference. The multiplicity
of the test was not considered, as the analysis of this study was
exploratory.
Results
Patient characteristics
The clinicopathological features of the 1,129
patients are presented in Table
I. With regard to tumor location, the percentages obtained were
similar for the right- and left-sided colon, and the rectum showed
a slightly higher percentage. With regard to the depth of tumor
invasion, tumor invasion of mucosa (M), tumor invasion of submucosa
(SM) and tumor invasion of muscularis propria (MP) were equivalent
to ≤T2 (Tis, T1 and T2) according to the TNM classification, 7th
edition, developed by the Union for International Cancer Control
(UICC), and accounted for a low percentage of 17.4% of the total.
Tumor invasion of subserosa (SS), tumor invasion of serosa (SE),
direct tumor invasion of other organs or structure in the intestine
with serosa (SI), tumor invasion through muscularis propria into
non-peritonealized, pericolic, or perirectal tissues (A) and direct
tumor invasion of other organs or structure in the intestine
without serosa (AI) were equivalent to ≥T3 (T3, T4a and T4b)
according to the TNM classification and accounted for 79.8%. In
addition, non-lymph node metastasis (N0) and lymph node metastases
(≥N1) were 41.4 and 56.1%, respectively; stage I/II and stage
III/IV disease were 34.0 and 59.6%, respectively, which indicated
that the percentage of stage I/II disease tended to be lower.
 | Table IClinicopathological features of the
1,129 patients. |
Table I
Clinicopathological features of the
1,129 patients.
| Clinicopathological
features | No. of
patients | % |
|---|
| Age (mean, 66
years; median, 67 years; range, 24–94 years) | | |
| <67 | 525 | 46.5 |
| ≥67 | 558 | 49.4 |
| No available
data | 46 | 4.1 |
| Gender | | |
| Male | 662 | 58.6 |
| Female | 459 | 40.7 |
| No available
data | 8 | 0.7 |
| Tumor location | | |
| Right-sided colon
(C, A, T) | 324 | 28.7 |
| Left-sided colon
(D, S) | 317 | 28.1 |
| Rectosigmoid | 117 | 10.4 |
| Rectum | 358 | 31.7 |
| Proctos | 4 | 0.4 |
| No available
data | 9 | 0.8 |
| Histology | | |
| Well/moderately
differentiated | 1004 | 88.9 |
| Poorly
differentiated | 35 | 3.1 |
| Mucinos | 32 | 2.8 |
| Others | 16 | 1.4 |
| No available
data | 42 | 3.7 |
| Lymphatic
invasion | | |
| ly0 | 292 | 25.9 |
| ly1, ly2, ly3 | 746 | 66.1 |
| No available
data | 91 | 8.1 |
| Venous
invasion | | |
| v0 | 364 | 32.2 |
| v1, v2, v3 | 670 | 59.3 |
| No available
data | 95 | 8.4 |
| Depth of tumor
invasion | | |
| M, SM, MP | 197 | 17.4 |
| SS, SE, SI, A,
AI | 901 | 79.8 |
| No available
data | 31 | 2.7 |
| Lymph node
metastasis | | |
| N0 | 467 | 41.4 |
| N1, N2, N3 | 633 | 56.1 |
| No available
data | 29 | 2.6 |
| Stage | | |
| 0 | 9 | 0.8 |
| I | 106 | 9.4 |
| II | 278 | 24.6 |
| III | 482 | 42.7 |
| IV | 191 | 16.9 |
| No available
data | 63 | 5.6 |
Intergenic correlation and hierarchical
cluster analysis
A summary of the results of the mRNA expression of
the 10 target genes is presented in Table II, and the intergenic
correlations obtained are listed in Table III. For the patients whose mRNA
expression was not detectable (n.d.), the minimum mRNA expression
of that gene was inserted as an alternative. The frequency of n.d.
was as follows: TYMS, 1 (0.1%); DPYD, 35 (3.1%);
TYMP, 9 (0.8%); DHFR, 1 (0.1%); FPGS, 2
(0.2%); GGH, 5 (0.4%); TOP1, 1 (0.1%); ERCC1,
2 (0.2%); VEGF, 1 (0.1%); and EGFR, 2 (0.2%) (data
not shown). The frequency of n.d. was the highest in the
DPYD gene but was in lower than 9 patients (0.8%) for the
other genes; therefore, it was considered to have little influence
on the results of the analysis.
| Table IISummary of the mRNA expression levels
of the 10 genes analyzed in this study in the 1,129 patients. |
Table II
Summary of the mRNA expression levels
of the 10 genes analyzed in this study in the 1,129 patients.
| Gene | Gene
expression/β-actin values
| Log-transformed
values
|
|---|
| Median | Min | Max | Mean | SD |
|---|
| TYMS | 3.86 | 0.40 | 64.20 | 1.34 | 0.66 |
| DPYD | 0.28 | 0.03 | 4.61 | −1.30 | 0.85 |
| TYMP | 2.72 | 0.22 | 45.30 | 1.02 | 0.79 |
| DHFR | 4.33 | 0.40 | 27.46 | 1.43 | 0.63 |
| FPGS | 0.59 | 0.15 | 4.49 | −0.53 | 0.49 |
| GGH | 12.71 | 0.26 | 166.47 | 2.45 | 1.09 |
| TOP1 | 2.79 | 0.41 | 107.07 | 1.02 | 0.52 |
| ERCC1 | 1.67 | 0.27 | 18.06 | 0.52 | 0.55 |
| VEGF | 7.39 | 0.93 | 73.19 | 1.99 | 0.65 |
| EGFR | 1.35 | 0.11 | 55.07 | 0.29 | 0.61 |
| Table IIICorrelations of the mRNA expression
of the 10 log-transformed genes. |
Table III
Correlations of the mRNA expression
of the 10 log-transformed genes.
| Gene | TYMS | DPYD | TYMP | DHFR | FPGS | GGH | TOP1 | ERCC1 | VEGF | EGFR |
|---|
| TYMS | 1 | | | 0.596 | | | | 0.427 | | |
| DPYD | | 1 | 0.629 | | | | | | | |
| TYMP | | 0.629 | 1 | | | | | | | |
| DHFR | 0.596 | | | 1 | | 0.438 | 0.387 | 0.373 | | |
| FPGS | | | | | 1 | | | 0.456 | | |
| GGH | | | | 0.438 | | 1 | 0.487 | | | |
| TOP1 | | | | 0.387 | | 0.487 | 1 | | 0.341 | |
| ERCC1 | 0.427 | | | 0.373 | 0.456 | | | 1 | | |
| VEGF | | | | | | | 0.341 | | 1 | |
| EGFR | | | | | | | | | | 1 |
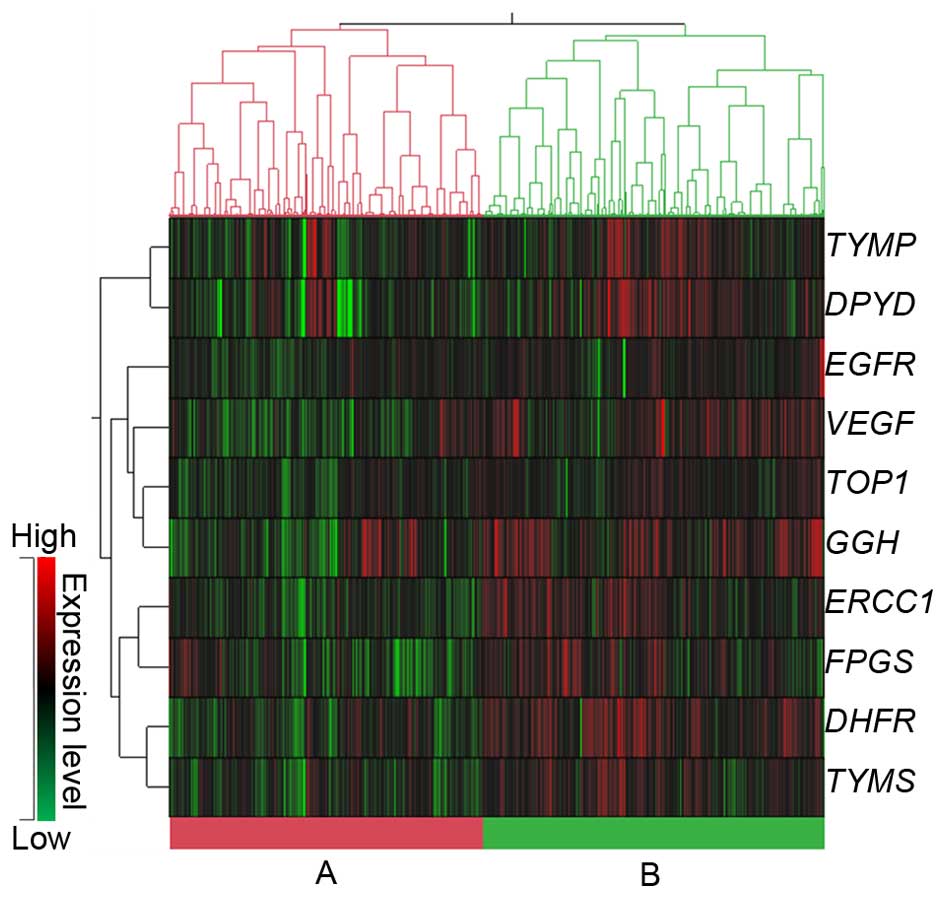
Additionally, the strongest correlation was noted
between DPYD and TYMP (r= 0.629), followed by
TYMS and DHFR (r=0.596), GGH and TOP1
(r=0.487) and FPGS and ERCC1 (r=0.456). In a
hierarchical cluster analysis of mRNA expression, the data were
roughly classified into 2 groups: cluster A, in which the mRNA
expression of all 10 genes was significantly low, and cluster B, in
which the mRNA expression was significantly higher (Fig. 1 and Table IV). The associations between the
2 clusters and the clinicopathological features are summarized in
Table V. A significant difference
was noted between the histology, lymphatic invasion, lymph node
metastasis and stage. There was a tendency for low-frequency
mucinous adenocarcinoma in cluster B and the frequencies of
non-lymphatic invasion (ly0), N0 and stage I/II disease were also
higher in cluster B.
| Table IVLog-transformed mRNA expression
levels of two clusters. |
Table IV
Log-transformed mRNA expression
levels of two clusters.
| Gene | Gene
expression/β-actin values
| p-value |
|---|
| Cluster A
(n=539) | Cluster B
(n=590) |
|---|
| TYMS | 1.04±0.61 | 1.61±0.60 | <0.0001 |
| DPYD | −1.62±0.88 | −1.00±0.72 | <0.0001 |
| TYMP | 0.82±0.81 | 1.20±0.72 | <0.0001 |
| DHFR | 1.08±0.56 | 1.75±0.51 | <0.0001 |
| FPGS | −0.71±0.46 | −0.37±0.46 | <0.0001 |
| GGH | 1.97±1.11 | 2.90±0.86 | <0.0001 |
| TOP1 | 0.84±0.48 | 1.19±0.49 | <0.0001 |
| ERCC1 | 0.24±0.44 | 0.78±0.52 | <0.0001 |
| VEGF | 1.69±0.59 | 2.26±0.59 | <0.0001 |
| EGFR | 0.11±0.54 | 0.45±0.64 | <0.0001 |
| Table VComparison of clinicopathological
features in two clusters of gene expression. |
Table V
Comparison of clinicopathological
features in two clusters of gene expression.
| Clinicopathological
features | No. of patients
| p-value |
|---|
| Cluster A | Cluster B |
|---|
| Age (years) | | | |
| <67 | 252 | 273 | 0.394 |
| ≥67 | 253 | 305 | |
| Gender | | | |
| Male | 312 | 350 | 0.761 |
| Female | 221 | 238 | |
| Tumor location | | | |
| Right-sided
colon | 150 | 174 | 0.305 |
| Left-sided
colon | 156 | 161 | |
| Rectosigmoid | 47 | 70 | |
| Rectum | 177 | 181 | |
| Histology | | | |
| Well/moderately
differentiated | 479 | 525 | 0.008 |
| Poorly
differentiated | 15 | 20 | |
| Mucinous | 24 | 8 | |
| Lymphatic
invasion | | | |
| ly0 | 129 | 163 | 0.039 |
| ly1, ly2, ly3 | 383 | 363 | |
| Venous
invasion | | | |
| v0 | 171 | 193 | 0.241 |
| v1, v2, v3 | 341 | 329 | |
| Depth of tumor
invasion | | | |
| T1, T2 | 102 | 95 | 0.238 |
| T3, T4 | 424 | 477 | |
| Lymph node
metastasis | | | |
| N0 | 202 | 265 | 0.006 |
| N1, N2, N3 | 327 | 306 | |
| Stage | | | |
| I, II | 166 | 218 | 0.013 |
| III, IV | 345 | 328 | |
Association of mRNA expression and
clinicopathological features
The association between the mRNA expression of 10
target genes and the clinicopathological features is presented in
Table VI. In relation to the
location of the tumor, a significant difference was noted in all
genes apart from VEGF when 4 locations were compared (the
right- and left-sided colon, rectosigmoid and rectum), with the
exception of the proctos; only 4 patients had a tumor at this
location. Specifically, TYMS and DPYD showed the
highest level of expression in the right-sided colon; GGH
and EGFR showed the highest level of expression in the
left-sided colon; DHFR, FPGS, TOP1 and
ERCC1 showed the highest level of expression in the
recto-sigmoid; TYMP showed approximately equivalent
expression levels in the right-sided colon and rectum, where the
expression was higher than in the other locations. On comparing two
locations (right- and left-sided colon cancer) in patients with
colon cancer only, a significantly high level of expression was
noted in right-sided colon cancer for TYMS (fold change,
1.22; p=0.0001), DPYD (1.27-fold; p=0.001), TYMP
(1.31-fold; p<0.0001), and FPGS (1.09-fold; p=0.020). By
contrast, a significantly high level of expression was observed in
left-sided colon cancer for the GGH (1.74-fold;
p<0.0001), TOP1 (1.17-fold; p<0.0001) and EGFR
(1.15-fold; p=0.006) genes, and no significant difference was noted
for DHFR (1.06-fold; p=0.226), ERCC1 (1.08-fold;
p=0.084) and VEGF (1.07-fold; p=0.191) (data not shown). For
histology, there was a significant difference in 7 genes, excluding
DHFR, VEGF and EGFR. For TYMS,
DPYD and TYMP, the highest levels of expression were
observed in patients with poorly differentiated adenocarcinoma,
while the lowest levels of expression were observed in patients
with well/moderately differentiated adenocarcinoma. For
FPGS, GGH, TOP1 and ERCC1, the lowest
levels of expression were observed in patients with mucinous
adenocarcinoma; for FPGS and ERCC1, the highest level
of expression was observed in patients with poorly differentiated
adenocarcinoma; and for GGH and TOP1, the highest
level of expression was observed in patients with well/moderately
differentiated adenocarcinoma. As regards the depth of tumor
invasion, a significantly higher level of expression was found in
T1/2 as compared to T3/4 for TYMS, TYMP, DHFR,
and ERCC1, while higher expression was found in T3/4 for
VEGF only. For lymph node metastasis, there was a
significant difference in TYMS, DHFR and
ERCC1; a significantly higher level of expression was found
in N0 than N≥1. For stage, there was a significant difference in
TYMS, TYMP, DHFR and ERCC1, whereas a
significantly higher level of expression was found in stage I/II
than stage III/IV disease.
| Table VIAssociations between log-transformed
mRNA expression levels and clinicopathological features. |
Table VI
Associations between log-transformed
mRNA expression levels and clinicopathological features.
| Clinicopathological
features |
Log-transformed mRNA expression levels
(means ± SD)
|
|---|
| TYMS | DPYD | TYMP | DHFR | FPGS | GGH | TOP1 | ERCC1 | VEGF | EGFR |
|---|
| Age (years) | | | | | | | | | | |
| <67 | 1.30±0.63 | −1.33±0.84 | 1.03±0.75 | 1.42±0.63 | −0.55±0.49 | 2.52±1.04 | 1.04±0.51 | 0.51±0.55 | 1.96±0.64 | 0.31±0.59 |
| ≥67 | 1.39±0.67 | −1.24±0.87 | 1.01±0.82 | 1.48±0.60 | −0.50±0.49 | 2.43±1.13 | 1.02±0.52 | 0.57±0.55 | 2.01±0.68 | 0.26±0.62 |
| p-value | 0.024 | 0.084 | 0.687 | 0.161 | 0.122 | 0.174 | 0.715 | 0.069 | 0.178 | 0.195 |
| Gender | | | | | | | | | | |
| Male | 1.34±0.65 | −1.25±0.82 | 1.03±0.77 | 1.43±0.63 | −0.52±0.48 | 2.53±1.07 | 1.06±0.53 | 0.51±0.54 | 2.02±0.65 | 0.30±0.61 |
| Female | 1.34±0.68 | −1.36±0.90 | 1.00±0.82 | 1.44±0.63 | −0.53±0.51 | 2.36±1.12 | 0.97±0.49 | 0.55±0.57 | 1.94±0.65 | 0.27±0.62 |
| p-value | 0.973 | 0.045 | 0.519 | 0.741 | 0.715 | 0.014 | 0.004 | 0.292 | 0.053 | 0.505 |
| Tumor location | | | | | | | | | | |
| Right-sided
colon | 1.45±0.66 | −1.20±0.92 | 1.11±0.87 | 1.48±0.63 | −0.50±0.47 | 2.15±1.05 | 0.91±0.52 | 0.54±0.58 | 1.95±0.67 | 0.22±0.57 |
| Left-sided
colon | 1.25±0.67 | −1.44±0.78 | 0.84±0.73 | 1.42±0.60 | −0.59±0.49 | 2.71±0.89 | 1.07±0.49 | 0.47±0.52 | 2.02±0.67 | 0.36±0.71 |
| Rectosigmoid | 1.43±0.60 | −1.25±0.86 | 0.99±0.73 | 1.54±0.52 | −0.45±0.48 | 2.65±1.08 | 1.11±0.43 | 0.66±0.58 | 1.98±0.55 | 0.34±0.64 |
| Rectum | 1.29±0.66 | −1.26±0.83 | 1.11±0.75 | 1.35±0.67 | −0.53±0.51 | 2.46±1.12 | 1.05±0.53 | 0.52±0.55 | 1.99±0.65 | 0.27±0.55 |
| p-value | 0.0002 | 0.004 | <0.0001 | 0.014 | 0.028 | <0.0001 | <0.0001 | 0.016 | 0.610 | 0.022 |
| Histology | | | | | | | | | | |
|
Well/moderately | 1.31±0.65 | −1.35±0.81 | 0.98±0.76 | 1.42±0.62 | −0.54±0.49 | 2.51±1.05 | 1.03±0.52 | 0.52±0.55 | 1.99±0.65 | 0.30±0.59 |
|
differentiated | | | | | | | | | | |
| Poorly
differentiated | 1.82±0.67 | −0.52±1.18 | 1.80±1.03 | 1.47±0.82 | −0.38±0.44 | 1.84±1.28 | 1.02±0.38 | 0.64±0.63 | 1.85±0.79 | 0.08±1.12 |
| Mucinous | 1.48±0.62 | −0.70±0.96 | 1.22±0.65 | 1.26±0.70 | −0.69±0.53 | 1.19±1.13 | 0.76±0.50 | 0.27±0.50 | 1.88±0.65 | 0.24±0.52 |
| p-value | <0.0001 | <0.0001 | <0.0001 | 0.307 | 0.035 | <0.0001 | 0.016 | 0.017 | 0.309 | 0.113 |
| Lymphatic
invasion | | | | | | | | | | |
| ly0 | 1.42±0.66 | −1.26±0.90 | 1.16±0.75 | 1.45±0.66 | −0.52±0.51 | 2.46±1.15 | 1.03±0.52 | 0.56±0.61 | 1.98±0.62 | 0.31±0.59 |
| ly1, ly2, ly3 | 1.29±0.66 | −1.32±0.84 | 0.94±0.79 | 1.39±0.62 | −0.53±0.49 | 2.43±1.08 | 1.01±0.52 | 0.49±0.54 | 1.95±0.66 | 0.28±0.63 |
| p-value | 0.006 | 0.326 | <0.0001 | 0.204 | 0.736 | 0.751 | 0.651 | 0.086 | 0.447 | 0.595 |
| Venous
invasion | | | | | | | | | | |
| v0 | 1.42±0.67 | −1.21±0.89 | 1.08±0.79 | 1.45±0.63 | −0.49±0.50 | 2.37±1.09 | 1.02±0.51 | 0.54± 0.59 | 1.94±0.63 | 0.28±0.61 |
| v1, v2, v3 | 1.28±0.66 | −1.36±0.83 | 0.96±0.78 | 1.38±0.64 | −0.50±0.49 | 2.47±1.10 | 1.02±0.53 | 0.49± 0.54 | 1.96±0.65 | 0.30±0.63 |
| p-value | 0.001 | 0.012 | 0.026 | 0.117 | 0.048 | 0.179 | 0.876 | 0.218 | 0.608 | 0.668 |
| Depth of tumor
invasion | | | | | | | | | | |
| T1, T2 | 1.46±0.61 | −1.25±0.95 | 1.13±0.79 | 1.54±0.58 | −0.53±0.50 | 2.47±1.03 | 1.07±0.48 | 0.60±0.57 | 1.79±0.57 | 0.30±0.52 |
| T3, T4 | 1.32±0.67 | −1.32±0.82 | 0.98±0.78 | 1.40±0.64 | −0.52±0.49 | 2.44±1.10 | 1.01±0.52 | 0.51±0.55 | 2.03±0.66 | 0.28±0.64 |
| p-value | 0.003 | 0.381 | 0.015 | 0.004 | 0.924 | 0.722 | 0.118 | 0.041 | <0.0001 | 0.700 |
| Lymph node
metastasis | | | | | | | | | | |
| N0 | 1.43±0.68 | −1.30±0.88 | 1.05±0.80 | 1.49±0.62 | −0.51±0.49 | 2.50±1.09 | 1.04±0.53 | 0.59±0.58 | 1.97±0.67 | 0.26±0.56 |
| N1, N2, N3 | 1.28±0.64 | −1.30±0.82 | 0.99±0.77 | 1.38±0.63 | −0.54±0.49 | 2.41±1.09 | 1.00±0.51 | 0.48±0.53 | 2.00±0.64 | 0.31±0.65 |
| p-value | 0.0002 | 0.889 | 0.193 | 0.004 | 0.486 | 0.186 | 0.214 | 0.001 | 0.366 | 0.195 |
| Stage | | | | | | | | | | |
| I, II | 1.43±0.67 | −1.29±0.88 | 1.10±0.79 | 1.48±0.62 | −0.51±0.50 | 2.48±1.09 | 1.03±0.53 | 0.58±0.58 | 1.95±0.66 | 0.27±0.56 |
| III, IV | 1.29±0.65 | −1.32±0.83 | 0.95±0.79 | 1.39±0.63 | −0.53±0.49 | 2.42±1.09 | 1.02±0.51 | 0.48±0.53 | 1.99±0.65 | 0.29±0.65 |
| p-value | 0.002 | 0.706 | 0.004 | 0.019 | 0.575 | 0.370 | 0.610 | 0.004 | 0.302 | 0.556 |
Comparison of clinicopathological
features in right- or left-sided colon cancer
A comparison of the clinicopathological features
between the patients with right- and left-sided colon cancer is
presented in Table VII. A
significant difference was found with respect to age, histology,
lymph node metastasis and stage. The frequencies of elderly
individuals, poorly differentiated and mucinous adenocarcinomas, N0
and stage I/II disease tended to be higher in right-sided colon
cancer than left-sided colon cancer. The frequency of female
patients tended to be higher for right- than left-sided colon
cancer although the difference was not significant.
| Table VIIComparison of clinicopathological
features with the location of the colorectal cancer. |
Table VII
Comparison of clinicopathological
features with the location of the colorectal cancer.
| Clinicopathological
features | No. of patients
| p-value |
|---|
| Right-sided
colon | Left-sided
colon |
|---|
| Age (years) | | | |
| <67 | 105 | 159 | <0.0001 |
| ≥67 | 205 | 148 | |
| Gender | | | |
| Male | 166 | 183 | 0.175 |
| Female | 151 | 133 | |
| Histology | | | |
| Well/moderately
differentiated | 279 | 291 | 0.001 |
| Poorly
differentiated | 16 | 9 | |
| Mucinous | 17 | 2 | |
| Lymphatic
invasion | | | |
| ly0 | 88 | 73 | 0.197 |
| ly1, ly2, ly3 | 211 | 224 | |
| Venous
invasion | | | |
| v0 | 115 | 96 | 0.145 |
| v1, v2, v3 | 184 | 199 | |
| Depth of tumor
invasion | | | |
| T1, T2 | 40 | 32 | 0.382 |
| T3, T4 | 278 | 282 | |
| Lymph node
metastasis | | | |
| N0 | 146 | 115 | 0.029 |
| N1, N2, N3 | 173 | 196 | |
| Stage | | | |
| I, II | 118 | 93 | 0.041 |
| III, IV | 186 | 210 | |
Discussion
In this study, FFPE tumor specimens of primary
tumors obtained from 1,129 patients with colorectal cancer were
used. We measured mRNA expression levels of 10 genes associated
with the effects of standard chemotherapy for colorectal cancer
(TYMS, DPYD, TYMP, DHFR, FPGS,
GGH, TOP1, ERCC1, VEGF and
EGFR), and determined their association with
clinicopathological features, in particular, the location of
colorectal cancer.
From the results of mRNA expression analysis of the
10 genes included in this study, the strongest correlation was
noted between DPYD and TYMP. Several studies have
reported a similar correlation between expression levels in
colorectal cancer (26–33). DPYD and TYMP encode
enzymes related to the metabolism of 5-FU, and it seems likely that
the expression levels of these genes in colorectal cancer tissues
are co-regulated. In addition, the results from this study indicate
a weaker correlation between TYMS and DHFR than that
between DPYD and TYMP. Uetake et al also
reported a similar correlation in stage III colon cancer (33). Considering that DHFR plays an
important role in the generation of 5,10-methylene-THF as a
co-factor of the TYMS response, it is plausible that the level of
gene expression of both enzymes is correlated.
It has previously been reported that colorectal
cancer, particularly colon cancer, exhibits embryologic,
morphologic, physiologic and molecular differences between the
right and left sides, which leads to differences in the prognosis
of patients and their sensitivity to chemotherapy (15–18). In relation to the
clinicopathological features, in these studies, it has been posited
that the numbers of elderly individuals, women, mucinous
adenocarcinoma, high grade (poorly differentiated/undifferentiated)
and negative lymph node metastasis is higher in right- than
left-sided colon cancer. In our study, similar, reproducible
results were noted. As regards the molecular features, a
microsatellite instability phenotype (MSI+) and CpG
island methylator phenotype (CIMP+) are common in
right-sided colon cancer, whereas chromosomal instability is common
in left-sided colon cancer (15–18). Kawakami et al (34) analyzed the association between the
CIMP+ status and the expression level of gene-related
folate and nucleotide metabolism in the primary tumors of 114
patients from Australia with colorectal cancer. They reported that
the low-level expression of GGH and high-level expression of
TYMP were very strongly associated with CIMP+ and
CIMP+-related clinicopathological and molecular
features. They also reported that a significantly higher level of
TYMP expression and a significantly lower level of
GGH expression were found in right- as compared to
left-sided colorectal cancer (34). Moreover, they pointed out the
possibility that low-level GGH expression may lead to the
maintenance of folate in the polyglutamate form in the cells, which
is associated with DNA hypermethylation, and that 5-FU plus
leucovorin therapy may then be more effective (34). In a study of 76 Japanese patients
with stage II/III colorectal cancer, Sadahiro et al reported
that a significantly high level of TYMP expression was found
in cases of right rather than left-sided colorectal cancer and that
preoperative uracil-tegafur (UFT) plus leucovorin therapy resulted
in a significantly strong histological response (35). In the present study, in relation
to right-sided colon cancer, we noted a significantly higher level
of TYMP expression and a lower level GGH expression
than in left-sided colon cancer. Considering these results, it may
be worthwhile to determine the physiological significance of
TYMP and GGH expression in patients with colorectal
cancer in the future, in order to examine the hypothesis that
5-FU-based chemotherapy combined with leucovorin may be more
effective in cases of right-sided colon cancer.
Ricciardiello et al reported that TYMS
protein expression, as assessed by immunohistochemistry (IHC), did
not differ significantly between right- and left-sided colorectal
cancer, but a significantly high level of expression in
MSI+ colorectal cancer was noted (36). Jensen et al also reported
that the protein expression of TYMS (studied by IHC) was
significantly high in MSI+ colorectal cancer (37). On the other hand, Sinicrope et
al reported that there was no correlation between the
MSI+ status and TYMS protein expression (as measured by
IHC) (38). Thus, the association
between TYMS protein expression and the MSI+ status
remains controversial. In our study, as regards TYMS, its
mRNA expression was found to be higher in right-sided colon cancer
in which MSI+ was common, than in left-sided colon
cancer. The analysis of the clinicopathological features of all the
patients with colorectal cancer in this study revealed a high level
of TYMS expression in the elderly, those with poorly
differentiated adenocarcinoma and N0, which are common in
right-sided colon cancer. However, as regards the association
between TYMS expression and the location of colorectal
cancer, further studies, which will include the association of
TYMS with molecular features, such as the MSI+
status, are warranted in the future.
Recently, Missiaglia et al performed gene
expression analysis of a colon cancer dataset on 914 patients who
were registered in The Cancer Genome Atlas (TCGA) collection and
Pan European Trial Adjuvant Colon Cancer (PETACC3) adjuvant
chemotherapy trial. According to their study, the expression of
EGFR and human epidermal growth factor receptor 2
(HER2) was advanced in left- rather than right- sided colon
cancer, which activated EGF signaling, and the usefulness of
anti-EGFR agents was suggested (39). Similarly, the results of our study
demonstrated that a significantly higher level of EGFR
expression was noted in left- rather than right-sided colon cancer.
Hence, it is necessary to perform research on individualized
treatment which combines the location of colorectal cancer and
EGFR expression levels with the mutation status of
KRAS and BRAF, as well as EGFR inhibitors.
Loupakis et al analyzed three independent
cohorts in order to examine the association between the primary
tumor of metastatic colorectal cancer and the efficacy of
first-line chemotherapy. They reported that patients with primary
tumors on the left side of the colon achieved significantly
superior overall survival than those with primary tumors on the
right side (40). They also
analyzed gene expression in an exploratory manner using the
archival series of 181 independent primary tumor samples. They
inferred that the mRNA expression of ERCC1 was significantly
higher in right- rather than left-sided colorectal cancer, although
the mRNA expression level of VEGF ligands A, B
and C, as well as VEGF receptors 1 and 2
showed no difference between right- and left-sided colorectal
cancer. This is, perhaps, one of the factors involved in
chemo-resistance in patients with right-sided colorectal cancer
(40). In our study, although
VEGF exhibited few differences in the level of expression
according to the location of the tumor and the expression of
ERCC1 was the lowest in the patients with left-sided colon
cancer, the level of expression for ERCC1 was the highest in
the rectosigmoid. Additionally, for ERCC1, there was no
significant difference in the comparison between right- and
left-sided colon cancer. Further research on the differences in
sensitivity to oxaliplatin between patients with right- and
left-sided colorectal cancer and the association with ERCC1
expression is warranted.
In our analysis of the association between gene
expression and five factors related to the extent of cancer, namely
lymphatic invasion, vein invasion, depth of tumor invasion, lymph
node metastasis and stage, a significant difference was noted in
all the five factors for TYMS; whereas DPYD,
TYMP, DHFR, FPGS, ERCC1 and VEGF
showed a significant difference in 1–4 factors. Of these, with the
exception that the VEGF gene showed a significantly higher
level of expression in T3/4 than T1/2, high-level expression was
found in the group at a less-advanced stage rather than the group
in the more advanced stages of cancer. This tendency is consistent
with the results of the hierarchical cluster analysis. However, a
comparison of patient characteristics was made between the 1,129
Japanese patients with colorectal cancer in our study and the data
from 30,002 patients who were registered with the Japanese Society
for Cancer of the Colon and Rectum between 1993 and 1997 (41), as well as the data from 621
patients who were registered in a single institution in Japan
between 1992 and 2002 (42). This
comparison revealed that, although age, gender, tumor location and
histology had generally similar distributions, the percentages of
T1/2, N0 and stage I/II were clearly low, and as a whole, the stage
of cancer tended to be more advanced in our study. Consequently, it
is likely necessary to consider the data on the association between
gene expression levels in this study and the clinicopathological
features associated with the progress of cancer with caution.
In this large-scale population study, we clarified
the association between the mRNA expression of genes associated
with the effects of standard chemotherapy for colorectal cancer and
clinicopathological features, particularly the location of the
colorectal cancer. It is hoped that the results of this study will
become useful reference data for conducting research on
individualized chemotherapy for colorectal cancer that takes into
consideration the location of colorectal cancer.
Appendices
Appendix
Collaborating hospitals: Chiba University Hospital,
Fujita Health University Hospital, Gifu University Hospital,
Hachioji Digestive Disease Hospital, Handa City Hospital, Himeji
Medical Center, Hyogo Prefectural Kakogawa Medical Center, JCHO
Kobe Central Hospital, Kanto Rosai Hospital, Keio University
Hospital, Kinki University Hospital, Kitano Hospital, Kobe City
Medical Center General Hospital, Kobe City Medical Center West
Hospital, Kohsei Chuo General Hospital, Nagoya University Hospital,
National Center for Global Health and Medicine Center Hospital,
Nihon University Itabashi Hospital, Niitsu Medical Center Hospital,
Omori Red Cross Hospital, Osaka Rosai Hospital, Osaka University
Hospital, Saitama Medical Center, Sakai City Hospital, Sendai Red
Cross Hospital, Showa University Fujigaoka Hospital, Showa
University Hospital, The Jikei University Hospital, Tohoku Rosai
Hospital, Tohoku University Hospital, Toho University Omori Medical
Center, Tokushima Red Cross Hospital, Tokyo Medical University
Hachioji Medical Center, Tokyo Metropolitan Cancer and Infectious
Diseases Center Komagome Hospital, Tokyo Metropolitan Tama Medical
Center, Totsuka Kyoritsu Second Hospital, Toyohashi Municipal
Hospital, University of Yamanashi Hospital, Yamaguchi University
Hospital.
Acknowledgments
The authors wish to thank all of the patients who
participated in this study, and the clinicians at the hospitals
named in the Appendix, who
collaborated with us in measuring gene expression in the colorectal
cancer specimens. In addition, we would like to thank Editage
(www.editage.jp) for English language
editing.
References
|
1
|
Ferlay J, Soerjomataram I, Dikshit R, Eser
S, Mathers C, Rebelo M, Parkin DM, Forman D and Bray F: Cancer
incidence and mortality worldwide: sources, methods and major
patterns in GLOBOCAN 2012. Int J Cancer. 136:E359–E386. 2015.
View Article : Google Scholar
|
|
2
|
Meyerhardt JA and Mayer RJ: Systemic
therapy for colorectal cancer. N Engl J Med. 352:476–487. 2005.
View Article : Google Scholar : PubMed/NCBI
|
|
3
|
Wilson PM, Danenberg PV, Johnston PG, Lenz
HJ and Ladner RD: Standing the test of time: targeting thymidylate
biosynthesis in cancer therapy. Nat Rev Clin Oncol. 11:282–298.
2014. View Article : Google Scholar : PubMed/NCBI
|
|
4
|
van Kuilenburg AB: Dihydropyrimidine
dehydrogenase and the efficacy and toxicity of 5-fluorouracil. Eur
J Cancer. 40:939–950. 2004. View Article : Google Scholar : PubMed/NCBI
|
|
5
|
Toi M, Atiqur Rahman M, Bando H and Chow
LW: Thymidine phosphorylase (platelet-derived endothelial-cell
growth factor) in cancer biology and treatment. Lancet Oncol.
6:158–166. 2005. View Article : Google Scholar : PubMed/NCBI
|
|
6
|
Salonga D, Danenberg KD, Johnson M,
Metzger R, Groshen S, Tsao-Wei DD, Lenz HJ, Leichman CG, Leichman
L, Diasio RB and Danenberg PV: Colorectal tumors responding to
5-fluoro-uracil have low gene expression levels of
dihydropyrimidine dehydrogenase, thymidylate synthase, and
thymidine phos-phorylase. Clin Cancer Res. 6:1322–1327.
2000.PubMed/NCBI
|
|
7
|
Soong R, Shah N, Salto-Tellez M, Tai BC,
Soo RA, Han HC, Ng SS, Tan WL, Zeps N, Joseph D, et al: Prognostic
significance of thymidylate synthase, dihydropyrimidine
dehydrogenase and thymidine phosphorylase protein expression in
colorectal cancer patients treated with or without
5-fluorouracil-based chemotherapy. Ann Oncol. 19:915–919. 2008.
View Article : Google Scholar : PubMed/NCBI
|
|
8
|
Laufman LR, Krzeczowski KA, Roach R and
Segal M: Leucovorin plus 5-fluorouracil: an effective treatment for
metastatic colon cancer. J Clin Oncol. 5:1394–1400. 1987.PubMed/NCBI
|
|
9
|
Sakamoto E, Tsukioka S, Oie S, Kobunai T,
Tsujimoto H, Sakamoto K, Okayama Y, Sugimoto Y and Oka T, Fukushima
M and Oka T: Folylpolyglutamate synthase and gamma-glutamyl
hydrolase regulate leucovorin-enhanced 5-fluorouracil anticancer
activity. Biochem Biophys Res Commun. 365:801–807. 2008. View Article : Google Scholar
|
|
10
|
Pommier Y: Topoisomerase I inhibitors:
camptothecins and beyond. Nat Rev Cancer. 6:789–802. 2006.
View Article : Google Scholar : PubMed/NCBI
|
|
11
|
Shirota Y, Stoehlmacher J, Brabender J,
Xiong YP, Uetake H, Danenberg KD, Groshen S, Tsao-Wei DD, Danenberg
PV and Lenz HJ: ERCC1 and thymidylate synthase mRNA levels predict
survival for colorectal cancer patients receiving combination
oxaliplatin and fluorouracil chemotherapy. J Clin Oncol.
19:4298–4304. 2001.PubMed/NCBI
|
|
12
|
Bohanes P, Labonte MJ and Lenz HJ: A
review of excision repair cross-complementation group 1 in
colorectal cancer. Clin Colorectal Cancer. 10:157–164. 2011.
View Article : Google Scholar : PubMed/NCBI
|
|
13
|
Hicklin DJ and Ellis LM: Role of the
vascular endothelial growth factor pathway in tumor growth and
angiogenesis. J Clin Oncol. 23:1011–1027. 2005. View Article : Google Scholar
|
|
14
|
Baselga J and Arteaga CL: Critical update
and emerging trends in epidermal growth factor receptor targeting
in cancer. J Clin Oncol. 23:2445–2459. 2005. View Article : Google Scholar : PubMed/NCBI
|
|
15
|
Elsaleh H, Joseph D, Grieu F, Zeps N, Spry
N and Iacopetta B: Association of tumour site and sex with survival
benefit from adjuvant chemotherapy in colorectal cancer. Lancet.
355:1745–1750. 2000. View Article : Google Scholar : PubMed/NCBI
|
|
16
|
Iacopetta B: Are there two sides to
colorectal cancer? Int J Cancer. 101:403–408. 2002. View Article : Google Scholar : PubMed/NCBI
|
|
17
|
Gervaz P, Bucher P and Morel P: Two
colons-two cancers: paradigm shift and clinical implications. J
Surg Oncol. 88:261–266. 2004. View Article : Google Scholar : PubMed/NCBI
|
|
18
|
Söreide K, Janssen EA, Söiland H, Körner H
and Baak JP: Microsatellite instability in colorectal cancer. Br J
Surg. 93:395–406. 2006. View Article : Google Scholar : PubMed/NCBI
|
|
19
|
Fukushima M, Morita M, Ikeda K and
Nagayama S: Population study of expression of thymidylate synthase
and dihydropyrimidine dehydrogenase in patients with solid tumors.
Int J Mol Med. 12:839–844. 2003.PubMed/NCBI
|
|
20
|
Fukui Y, Oka T, Nagayama S, Danenberg PV,
Danenberg KD and Fukushima M: Thymidylate synthase,
dihydropyrimidine dehydrogenase, orotate phosphoribosyltransferase
mRNA and protein expression levels in solid tumors in large scale
population analysis. Int J Mol Med. 22:709–716. 2008.PubMed/NCBI
|
|
21
|
General Rules for Clinical and
Pathological Studies on Cancer of the Colon, Rectum and Anus.
Japanese Society for Cancer of the Colon and Rectum: 7th edition.
Kanehara & Co, Ltd; Kanehara, Tokyo; 2006
|
|
22
|
Lord RV, Salonga D, Danenberg KD, Peters
JH, DeMeester TR, Park JM, Johansson J, Skinner KA, Chandrasoma P,
DeMeester SR, et al: Telomerase reverse transcriptase expression is
increased early in the Barrett's metaplasia, dysplasia,
adenocarcinoma sequence. J Gastrointest Surg. 4:135–142. 2000.
View Article : Google Scholar : PubMed/NCBI
|
|
23
|
Heid CA, Stevens J, Livak KJ and Williams
PM: Real time quantitative PCR. Genome Res. 6:986–994. 1996.
View Article : Google Scholar : PubMed/NCBI
|
|
24
|
Gibson UE, Heid CA and Williams PM: A
novel method for real time quantitative RT-PCR. Genome Res.
6:995–1001. 1996. View Article : Google Scholar : PubMed/NCBI
|
|
25
|
Kuramochi H, Hayashi K, Uchida K, Miyakura
S, Shimizu D, Vallböhmer D, Park S, Danenberg KD, Takasaki K and
Danenberg PV: Vascular endothelial growth factor messenger RNA
expression level is preserved in liver metastases compared with
corresponding primary colorectal cancer. Clin Cancer Res. 12:29–33.
2006. View Article : Google Scholar : PubMed/NCBI
|
|
26
|
Ichikawa W, Uetake H, Shirota Y, Yamada H,
Takahashi T, Nihei Z, Sugihara K, Sasaki Y and Hirayama R: Both
gene expression for orotate phosphoribosyltransferase and its ratio
to dihydropyrimidine dehydrogenase influence outcome following
fluoropyrimidine-based chemotherapy for metastatic colorectal
cancer. Br J Cancer. 89:1486–1492. 2003. View Article : Google Scholar : PubMed/NCBI
|
|
27
|
Yoshinare K, Kubota T, Watanabe M, Wada N,
Nishibori H, Hasegawa H, Kitajima M, Takechi T and Fukushima M:
Gene expression in colorectal cancer and in vitro chemosensitivity
to 5-fluorouracil: a study of 88 surgical specimens. Cancer Sci.
94:633–638. 2003. View Article : Google Scholar : PubMed/NCBI
|
|
28
|
Inokuchi M, Uetake H, Shirota Y, Yamada H,
Tajima M and Sugihara K: Gene expression of 5-fluorouracil
metabolic enzymes in primary colorectal cancer and corresponding
liver metastasis. Cancer Chemother Pharmacol. 53:391–396. 2004.
View Article : Google Scholar : PubMed/NCBI
|
|
29
|
Uchida K, Danenberg PV, Danenberg KD and
Grem JL: Thymidylate synthase, dihydropyrimidine dehydrogenase,
ERCC1, and thymidine phosphorylase gene expression in primary and
metastatic gastrointestinal adenocarcinoma tissue in patients
treated on a phase I trial of oxaliplatin and capecitabine. BMC
Cancer. 8:3862008. View Article : Google Scholar : PubMed/NCBI
|
|
30
|
Sameshima S, Tomozawa S, Kojima M, Koketsu
S, Motegi K, Horikoshi H, Okada T, Kon Y and Sawada T:
5-Fluorouracil-related gene expression in primary sites and hepatic
metastases of colorectal carcinomas. Anticancer Res. 28(3A):
1477–1481. 2008.PubMed/NCBI
|
|
31
|
Kumamoto K, Kuwabara K, Tajima Y, Amano K,
Hatano S, Ohsawa T, Okada N, Ishibashi K, Haga N and Ishida H:
Thymidylate synthase and thymidine phosphorylase mRNA expression in
primary lesions using laser capture microdissection is useful for
prediction of the efficacy of FOLFOX treatment in colorectal cancer
patients with liver metastasis. Oncol Lett. 3:983–989.
2012.PubMed/NCBI
|
|
32
|
Goto T, Shinmura K, Yokomizo K, Sakuraba
K, Kitamura Y, Shirahata A, Saito M, Kigawa G, Nemoto H, Sanada Y
and Hibi K: Expression levels of thymidylate synthase,
dihydropyrimidine dehydrogenase, and thymidine phosphorylase in
patients with colorectal cancer. Anticancer Res. 32:1757–1762.
2012.PubMed/NCBI
|
|
33
|
Uetake H, Ishikawa T, Matsui S and
Sugihara K: Gene expression analysis as a biomarker study for
ACTS-CC trial (TRICC0706), a phase III trial for adjuvant
chemotherapy of S-1 and UFT/LV against stage III colon cancer in
Japan. Cancer Res. 72(8 Suppl): 45162012. View Article : Google Scholar
|
|
34
|
Kawakami K, Ooyama A, Ruszkiewicz A, Jin
M, Watanabe G, Moore J, Oka T, Iacopetta B and Minamoto T: Low
expression of gamma-glutamyl hydrolase mRNA in primary colorectal
cancer with the CpG island methylator phenotype. Br J Cancer.
98:1555–1561. 2008. View Article : Google Scholar : PubMed/NCBI
|
|
35
|
Sadahiro S, Suzuki T, Tanaka A, Okada K,
Nagase H and Uchida J: Association of right-sided tumors with high
thymidine phosphorylase gene expression levels and the response to
oral uracil and tegafur/leucovorin chemotherapy among patients with
colorectal cancer. Cancer Chemother Pharmacol. 70:285–291. 2012.
View Article : Google Scholar : PubMed/NCBI
|
|
36
|
Ricciardiello L, Ceccarelli C, Angiolini
G, Pariali M, Chieco P, Paterini P, Biasco G, Martinelli GN, Roda E
and Bazzoli F: High thymidylate synthase expression in colorectal
cancer with micro-satellite instability: Implications for
chemotherapeutic strategies. Clin Cancer Res. 11:4234–4240. 2005.
View Article : Google Scholar : PubMed/NCBI
|
|
37
|
Jensen SA, Vainer B, Kruhøffer M and
Sørensen JB: Microsatellite instability in colorectal cancer and
association with thymidylate synthase and dihydropyrimidine
dehydrogenase expression. BMC Cancer. 9:252009. View Article : Google Scholar : PubMed/NCBI
|
|
38
|
Sinicrope FA, Rego RL, Halling KC, Foster
NR, Sargent DJ, La Plant B, French AJ, Allegra CJ, Laurie JA,
Goldberg RM, et al: Thymidylate synthase expression in colon
carcinomas with microsatellite instability. Clin Cancer Res.
12:2738–2744. 2006. View Article : Google Scholar : PubMed/NCBI
|
|
39
|
Missiaglia E, Jacobs B, D'Ario G, Di Narzo
AF, Soneson C, Budinska E, Popovici V, Vecchione L, Gerster S, Yan
P, et al: Distal and proximal colon cancers differ in terms of
molecular, pathological, and clinical features. Ann Oncol.
25:1995–2001. 2014. View Article : Google Scholar : PubMed/NCBI
|
|
40
|
Loupakis F, Yang D, Yau L, Feng S,
Cremolini C, Zhang W, Maus MK, Antoniotti C, Langer C, Scherer SJ,
et al: Primary tumor location as a prognostic factor in metastatic
colorectal cancer. J Natl Cancer Inst. 107:dju4272015. View Article : Google Scholar : PubMed/NCBI
|
|
41
|
Kotake K, Honjo S, Sugihara K, Kato T,
Kodaira S, Takahashi T, Yasutomi M, Muto T and Koyama Y: Changes in
colorectal cancer during a 20-year period: an extended report from
the multi-institutional registry of large bowel cancer, Japan. Dis
Colon Rectum. 46(Suppl): S32–S43. 2003.PubMed/NCBI
|
|
42
|
Sakamoto K, Machi J, Prygrocki M, Watanabe
T, Hosoda S, Sugano M, Tomiki Y and Kamano T: Comparison of
characteristics and survival of colorectal cancer between
Japanese-Americans in Hawaii and native Japanese in Japan. Dis
Colon Rectum. 49:50–57. 2006. View Article : Google Scholar
|