Introduction
Activating transcription factor 6 (ATF6) is an
important transcription factor that is involved in the regulation
of the endoplasmic reticulum (ER) stress-induced unfolded protein
response (UPR) (1,2). When large quantities of unfolded
proteins accumulate in the ER, ATF6 translocates from the ER to the
Golgi apparatus, where it is sequentially hydrolyzed by site-1 and
-2 proteases (S1P and S2P). Cleaved ATF6 then translocates to the
nucleus, where it acts on the ER stress response element (ERSE) to
induce the transcription of ER stress-related genes and subsequent
ER stress-related cellular responses, including apoptosis (3,4).
Previous studies have reported that ER stress and ATF6-activated
transcription play a role in the pathogenesis and development of
various diseases; these include neurodegeneration, hereditary
cerebellar atrophy and ataxia, type 2 diabetes mellitus and
diabetic nephropathy, as well as cardiovascular diseases, such as
myocardial atrophy, heart failure, ischemic heart disease and
atherosclerosis (5–10). Therefore, the inhibition of
ATF6-activated transcription may provide a novel therapeutic
strategy for the above-mentioned diseases. Indeed, exendin-4 has
been shown to attenuate ER stress partly through the inhibition of
ATF6-mediated transcription (11). Nucleobindin-1 was also found to
control the UPR by inhibiting ATF6 activation (12). Citron et al reported that
the inhibitor of ATF6, 4-(2-aminoethyl)-benzenesulfonyl fluoride
(AEBSF), inhibited the production of amyloid β-protein, which is an
early and critical characteristic of Alzheimer's disease (13).
One method for screening inhibitors of ATF6 nuclear
translocation/activation involves the ATF6-activated expression of
the luciferase reporter gene; this requires the use of
ERSE-containing promoters fused with the luciferase reporter gene
(14). The activity of ATF6 can
then be deduced from the light intensity of luciferase. An
alternative indirect method involves the quantification of the
cellular levels of ATF6 and related proteins by western blot
analysis (15). Recently,
high-content screening (HCS) has emerged as a novel technology for
the high throughput screening of drugs. It allows for the
quantitative and multi-parametric analysis of living cells in a
single experiment (16).
Specifically, the biological activities and cytotoxicity of tested
compounds can be monitored simultaneously. Thus, HCS has remarkable
advantages over other drug-screening techniques. Using HCS
analytical techniques, the effect of various pharmacological
treatments on the nuclear-cytoplasm distribution of ATF6 may be
quantified. Hence, the information concerning ATF6 activation and
activities of the pharmacological agents can be obtained.
Furthermore, the selectivity of the tested compounds on ATF6
activation may be verified using information, such as cellular and
nuclear morphologies.
In this study, we employed the HCS technique to
screen for inhibitors of ATF6 activation. The reliability of HCS
was also validated by luciferase reporter assay and western blot
analysis. Finally, the effectiveness of the screened compounds was
tested by cellular viability assays.
Materials and methods
Compounds and cell lines
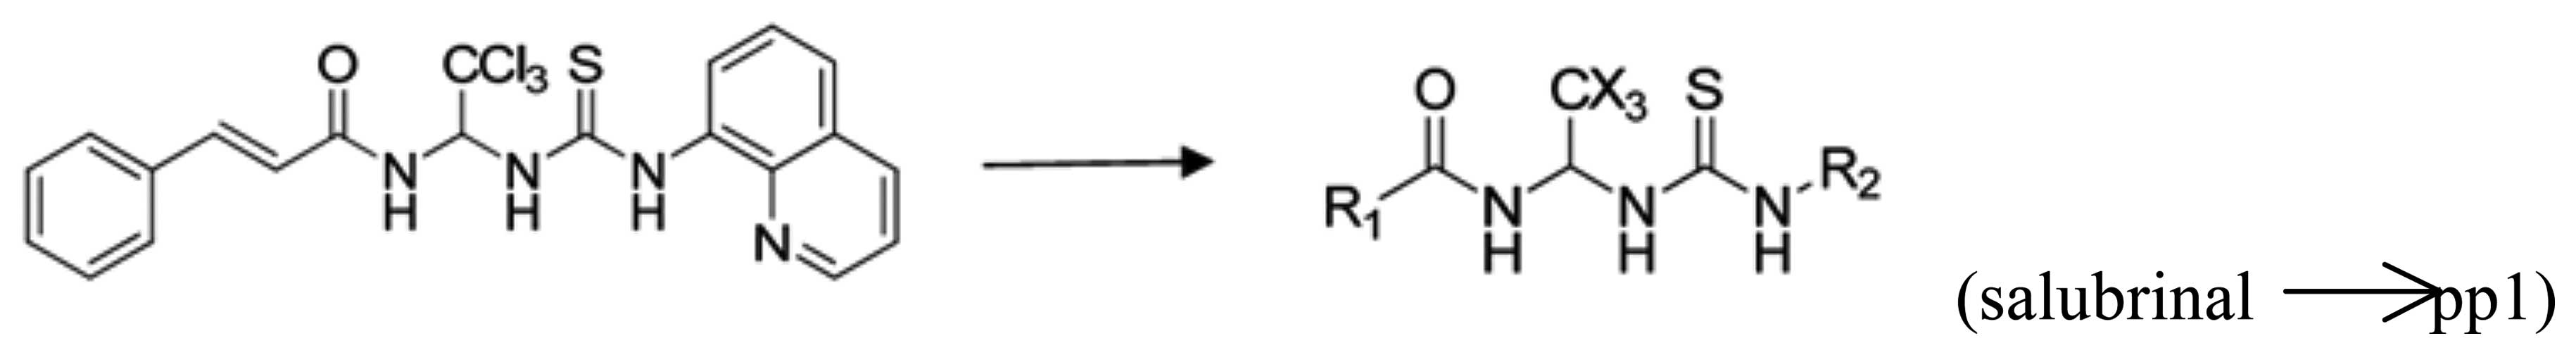
PP1-01 to PP1-80 were synthesized (Fig. 1) at the Beijing Institute of
Pharmacology and Toxicology based on salubrinal (Beijing, China).
U2OS osteosarcoma cells stably expressing ATF6-enhanced green
fluorescent protein (ATF6-EGFP) were obtained from Thermo
Scientific (Lafayette, CO, USA). The cells were grown in Dulbecco's
modified Eagle's medium (DMEM; Gibco-Life Technologies, Carlsbad,
CA, USA) containing 10% fetal bovine serum (FBS; Thermo Scientific
HyClone, Waltham, MA, USA), 2 mM L-glutamine (Sigma, St. Louis, MO,
USA) and 0.5 mg/ml G418 (Merck, Darmstadt, Germany). H9C2
myocardial cells were purchased from the cell bank of Peking Union
Medical College Hospital (Beijing, China). The cells were grown in
DMEM containing 10% FBS. All cells were incubated at 37°C in 5%
CO2 incubator.
HCS detection of nuclear
translocation
The cells were seeded in black, clear-bottomed, cell
culture-treated 96-well plates (Corning Inc., Corning, NY, USA) at
a density of 104 cells/well in 100 µl growth
medium. The plates were then briefly vortexed and centrifuged to
aid the release of trapped air bubbles and to facilitate the even
dispersal of cells within each well. The cells were then allowed to
attach and grow for 24 h in DMEM containing 10% FBS, 2 mM
L-glutamine and 0.5 mg/ml G418. The following day, the culture
medium was replaced with species medium. The species medium
contained DMEM (high glucose) with 1% FBS, 2 mM L-glutamine, and
0.5 mg/ml G418. The plates were then incubated for 5 h prior to the
addition of 50 µl/well of the 4X concentrated test compound
and 10 µl/well of 4X tunicamycin (TM; final concentration 1
µM; Merck) for 5 h. Subsequently, 100 µl 3X fixation
solution, which contained 11.1% formaldehyde and 1 µM
Hoechst 33342 (Sigma) diluted in PBS, was added to each well and
the plates were incubated at room temperature for 20 min. The final
concentrations of the fixing and staining agents in the assay plate
wells were 3.7% formaldehyde and 1 µg/ml Hoechst 33342 dye.
The plates were then washed 3 times with PBS and sealed with
easy-peel foil using a plate sealer. In the primary screening,
only2 concentrations of the compounds were tested: 3 and 30
µM. In the dose-related screening, the compounds were
assayed at 5 concentrations: 0.3, 1, 3, 10 and 30 µM. All
compounds were tested in triplicate.
Fluorescent images were acquired using an IN Cell
Analyzer 1000 platform (GE Healthcare, Cleveland, OH, USA).
Specifically, 5 fields in the center of each well were selected and
imaged through both blue and green channels. The blue channel
images were acquired using 360/40-nm excitation and 460/40-nm
emission filters with a 300-msec exposure time. The green channel
images were acquired using 475/20-nm excitation and 535/50-nm
emission filters with an 800-msec exposure time. The IN Cell
Analyzer 1000 was set up to acquire 5 fields-of-view. Image
analysis was performed using the cell analysis software of the IN
Cell Analyzer 1000 Workstation 3.5. For each cell, the GFP
fluorescence intensity in the nuclear circle and cytoplasmic ring
was measured and divided by the respective area of the cell, to
yield the average fluorescence intensity for each region. We
evaluated the ratio of nuclear-to-cytoplasmic GFP fluorescence
intensity to quantify nuclear localization (N/C). The inhibitory
ratio (activity) was calculated relative to the controls (untreated
cells) using the following formula: activity (%) = [TM signal (N/C)
− compound signal (N/C)]/[TM signal (N/C) − control (N/C)] ×100.
Based on the dose-response curve, the R2 and
IC50 values were calculated.
Luciferase reporter assay
The reporter vectors, pGL4.39 (luc2P/ATF6-RE/Hygro)
and pGL4.75 (hRluc/CMV), and the Dual-Glo® Luciferase
assay system were obtained from Promega (Madison, WI, USA). We used
X-tremeGENE HP to transfect the U2OS cells with the reporter
plasmid (6 µg) pGL4.39 (luc2P/ATF6-RE/Hygro) and the control
pGL4.75 (hRluc/CMV) vector according to the manufacturer's
instructions. Subsequently, the cells were seeded into black,
clear-bottomed, cell-culture treated 96-well plates (Corning, Inc.)
at a density of 104 cells/well in 100 µl growth
medium. Following overnight incubation, the medium was changed to
species medium containing DMEM (high glucose) with 0.5%
charcoal-stripped FBS and 2 mM L-glutamine, and the cells were
incubated for 24 h. Following incubation, the plates were allowed
to cool to room temperature for 10 min prior to the addition of 100
µl Dual-Glo® luciferase reagent to each well.
Luminescence was then measured using a Fluorescence plate reader
(BioTek Instruments, Winooski, VT, USA) and data were normalized to
in-plate controls. After at least a 10-min wait, 100 µl
Dual-Glo® Stop and Glo® reagent was added to
each well to measure Renilla luminescence. We evaluated the
firefly and Renilla fluorescence intensity for each well in
order to measure promoter activity and cytotoxicity, respectively,
and used firefly/Renilla to yield results.
The inhibitory ratio (activity) was calculated
relative to the controls (untreated cells) using the following
formula: activity (%) = [TM signal (firefly/Renilla) −
compound signal (firefly/Renilla)]/[TM signal
(firefly/Renilla) − control (firefly/Renilla)] ×100.
Based on the dose-response curve, the R2 and
IC50 values were calculated.
Western blot analysis
The H9C2 cells were inoculated in 6-well plates at
106 cells/well, and exposed to the different compounds
for 30 min prior to treatment with TM for 24 h. The cells were then
lysed in whole cell lysis buffer [62.5 mM Tris-HCl (pH 6.8 at 25°C)
and 2% w/v sodium dodecyl sulfate (SDS), 10% glycerol and 50 mM
DTT]. The homogenates were heated in a 100°C water bath for 10 min
and then centrifuged at 12,000 × g for 10 min at 4°C. We then used
the BCA method to determine the protein concentration of each
sample. Equal amounts of cellular proteins were subsequently
separated by electrophoresis on 10% SDS-polyacrylamide gels and
transferred onto PVDF membranes. After blocking (1X TBS, 0.1%
Tween-20 and 5% w/v non-fat dried milk), the membranes were
incubated with antibodies to ATF6 (1:1,000; ab11909), GRP78 (1:100;
ab21685) (all from Abcam, Cambridge, UK) and GAPDH (1:1,000; TA-08;
Zhongshan Golden Bridge Biotechnology, Beijing, China) with gentle
agitation overnight at 4°C. Subsequently, the membranes were
incubated with the appropriate horseradish peroxidase-conjugated
secondary antibodies [anti-mouse (ZDR-5117), anti-rabbit
(ZDR-5118); Zhongshan Golden Bridge Biotechnology] at a 1:5,000
dilution for 1 h at room temperature. The membranes were then
incubated with enhanced chemiluminescence (ECL) reagents, exposed
to film and developed. Finally, the film was scanned with an
imaging densitometer (Alphalmager 5500; Alpha Innotech, San
Leandro, CA, USA), and the optical density was quantified using
Multi-Analyst software.
Methylthiazol tetrazolium (MTT)
assay
The H9C2 cells were seeded in a 96-well plate at
104 cells/well and treated with various concentrations
(0.3, 1, 3, 10 and 30 µM) of the test compounds (PP1-13,
PP1-14 and PP1-19) 30 min prior to treatment with TM (1 µM).
The compounds were dissolved in dimethyl sulfoxide (DMSO; Amresco,
Solon, OH, USA). Forty-eight hours later, 10 µl of 5 mg/ml
MTT were added to each well for 4 h; the supernatants were then
removed and replaced with 100 µl DMSO. Following gentle
agitation for 10 min, the absorbance value of each well was
measured at 550 nm using a universal microplate reader (BioTek
Instruments). The relative number of viable cells was determined by
comparison with untreated cells, in which viability was assumed to
be 100%.
Ultrastructure analysis
The H9C2 cells were fixed in cold 2,5-glutaraldehyde
in 0.1 mol/l cacodylate buffer (pH 7.3), post-fixed in1%
OsO4, dehydrated and embedded in Epon. Ultrathin
sections were mounted on copper grids, stained with uranyl acetate
and lead citrate, and examined under a Jem-100C (Jeol, Tokyo,
Japan) electron microscope. Electron micrographs were taken
systematically at ×1,000 magnification.
Statistical analysis
Each experiment was repeated at least 3 times, and
values are presented as the means ± SD. Statistical analyses were
performed by a one-way analysis of variance (ANOVA). A P-value
<0.05 was considered to indicate a statistically significant
difference.
Results
Detection of inhibitors of ATF6 nuclear
translocation by HCS
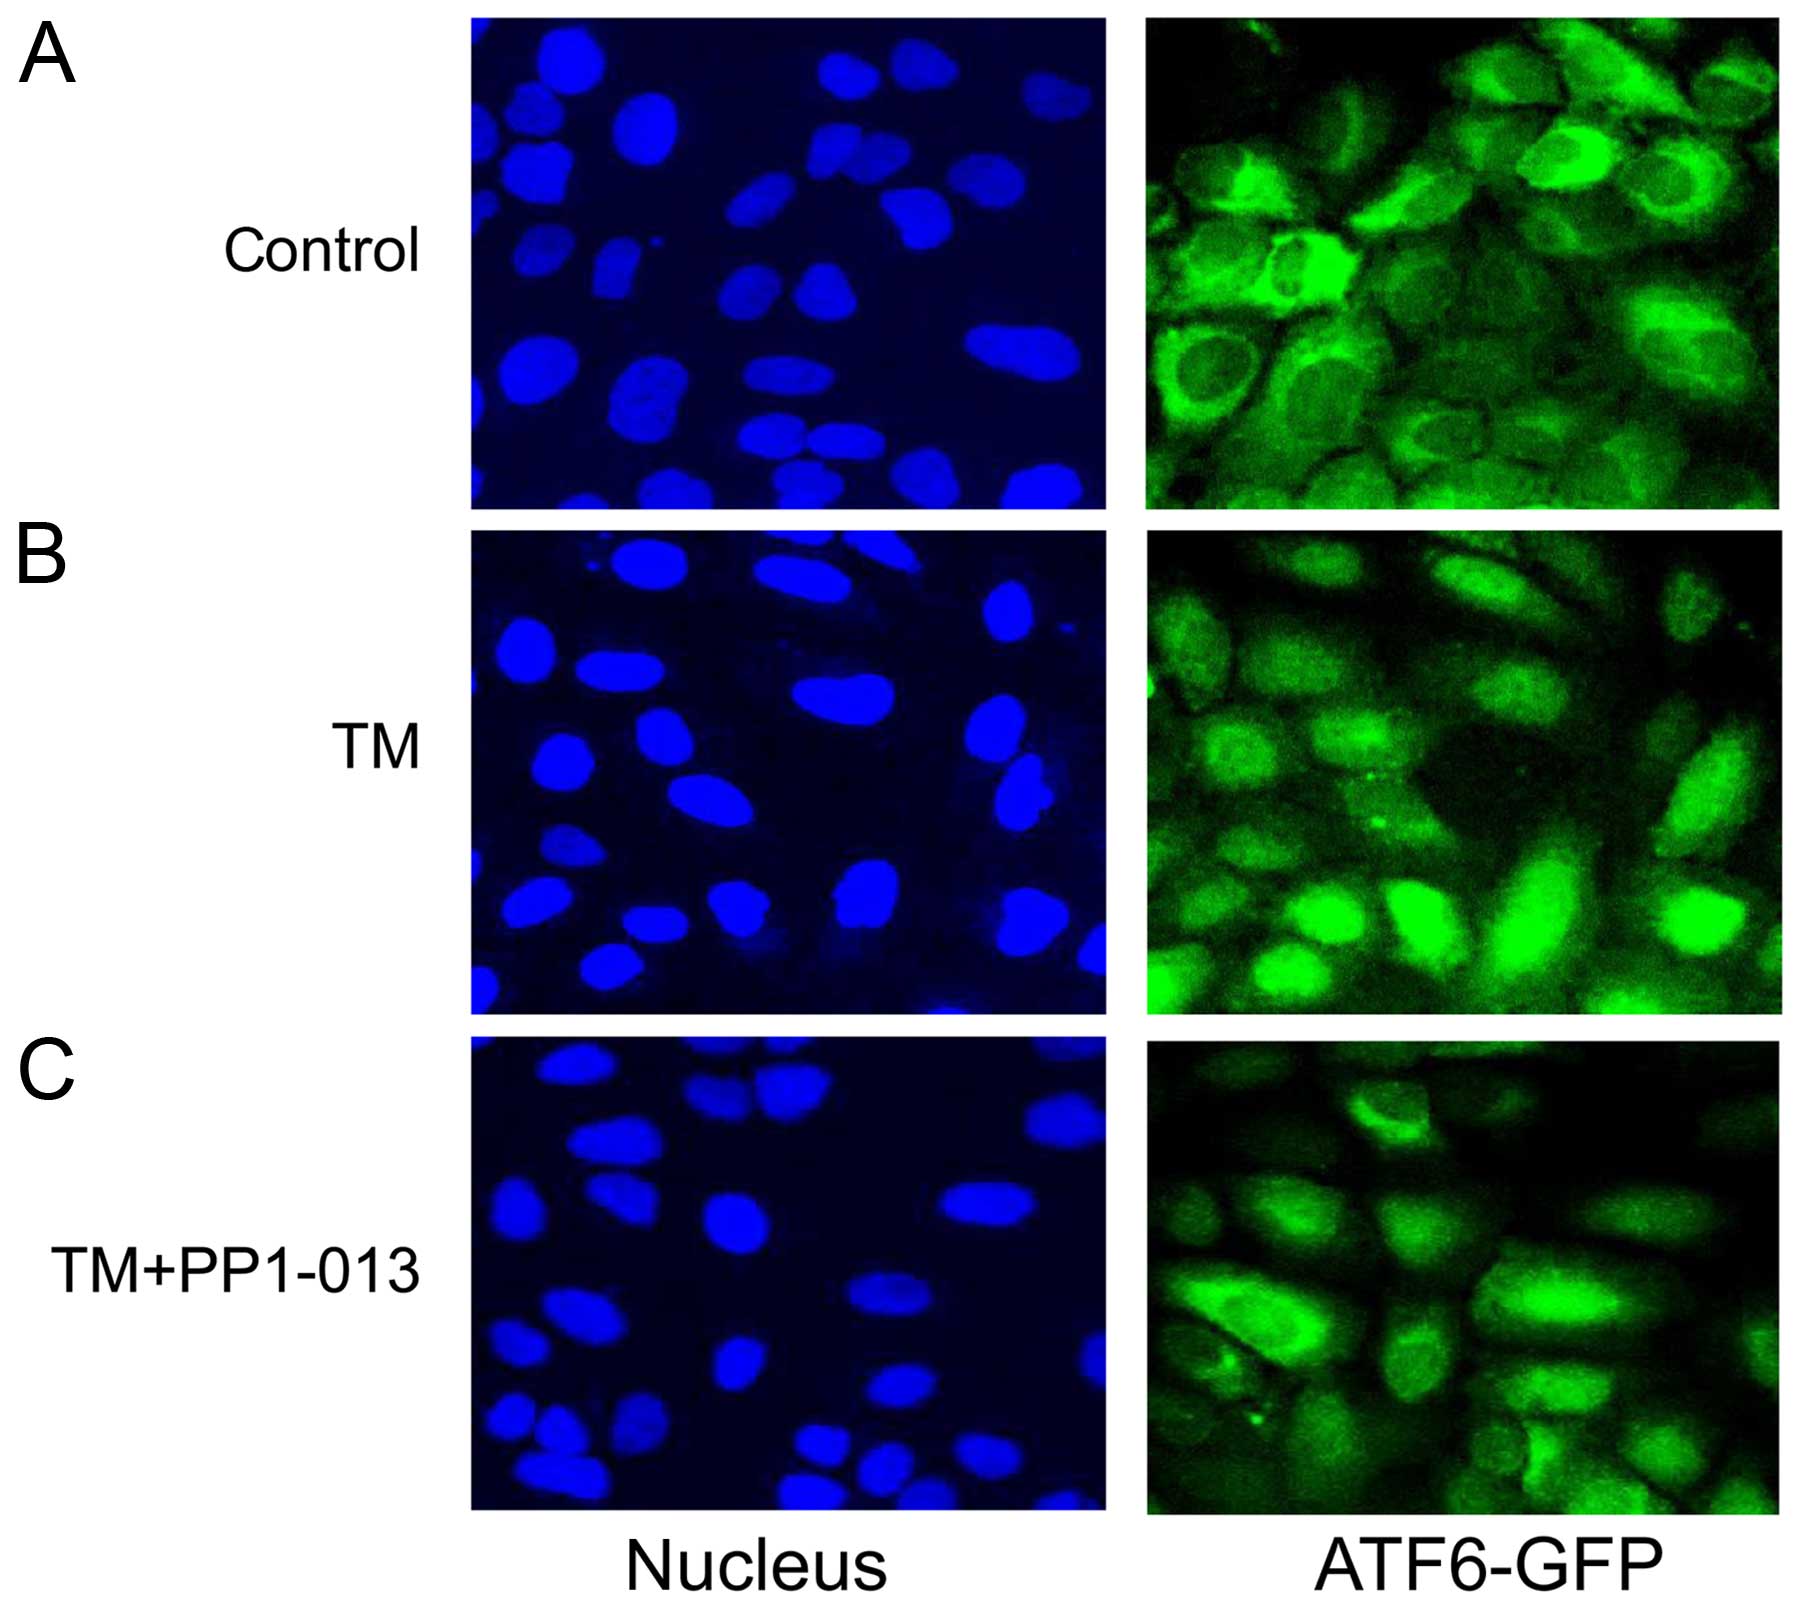
Under normal conditions, ATF6 is primarily located
in the cytoplasm. TM can activate ATF6, which results in its
accumulation in the nucleus (3).
In this study, we examined the effects of various compounds on the
TM-induced ATF6 cytoplasmic-nuclear translocation. Fig. 2 shows representative images of
cytoplasmic and nuclear and cytoplasmic fluorescence signals
recorded in the U2OS cells expressing ATF6-EGFP under control
(DMSO) or TM-treated conditions and in the presence of the test
compounds. Upon manual inspection, 15 compounds (PP1-10, 11, 12,
18, 22, 32, 37, 58, 62, 65, 69,70, 74, 75, 76) were initially
excluded from the analysis, as it was determined that
false-positive results were reported. Indeed, by contrast to the
normally very flat U2OS cell shape, the cells exposed to these
compounds exhibited a rounded phenotype and caused false-positives,
as the cytoplasm and nucleus were not as spatially distinct
(Fig. 3).
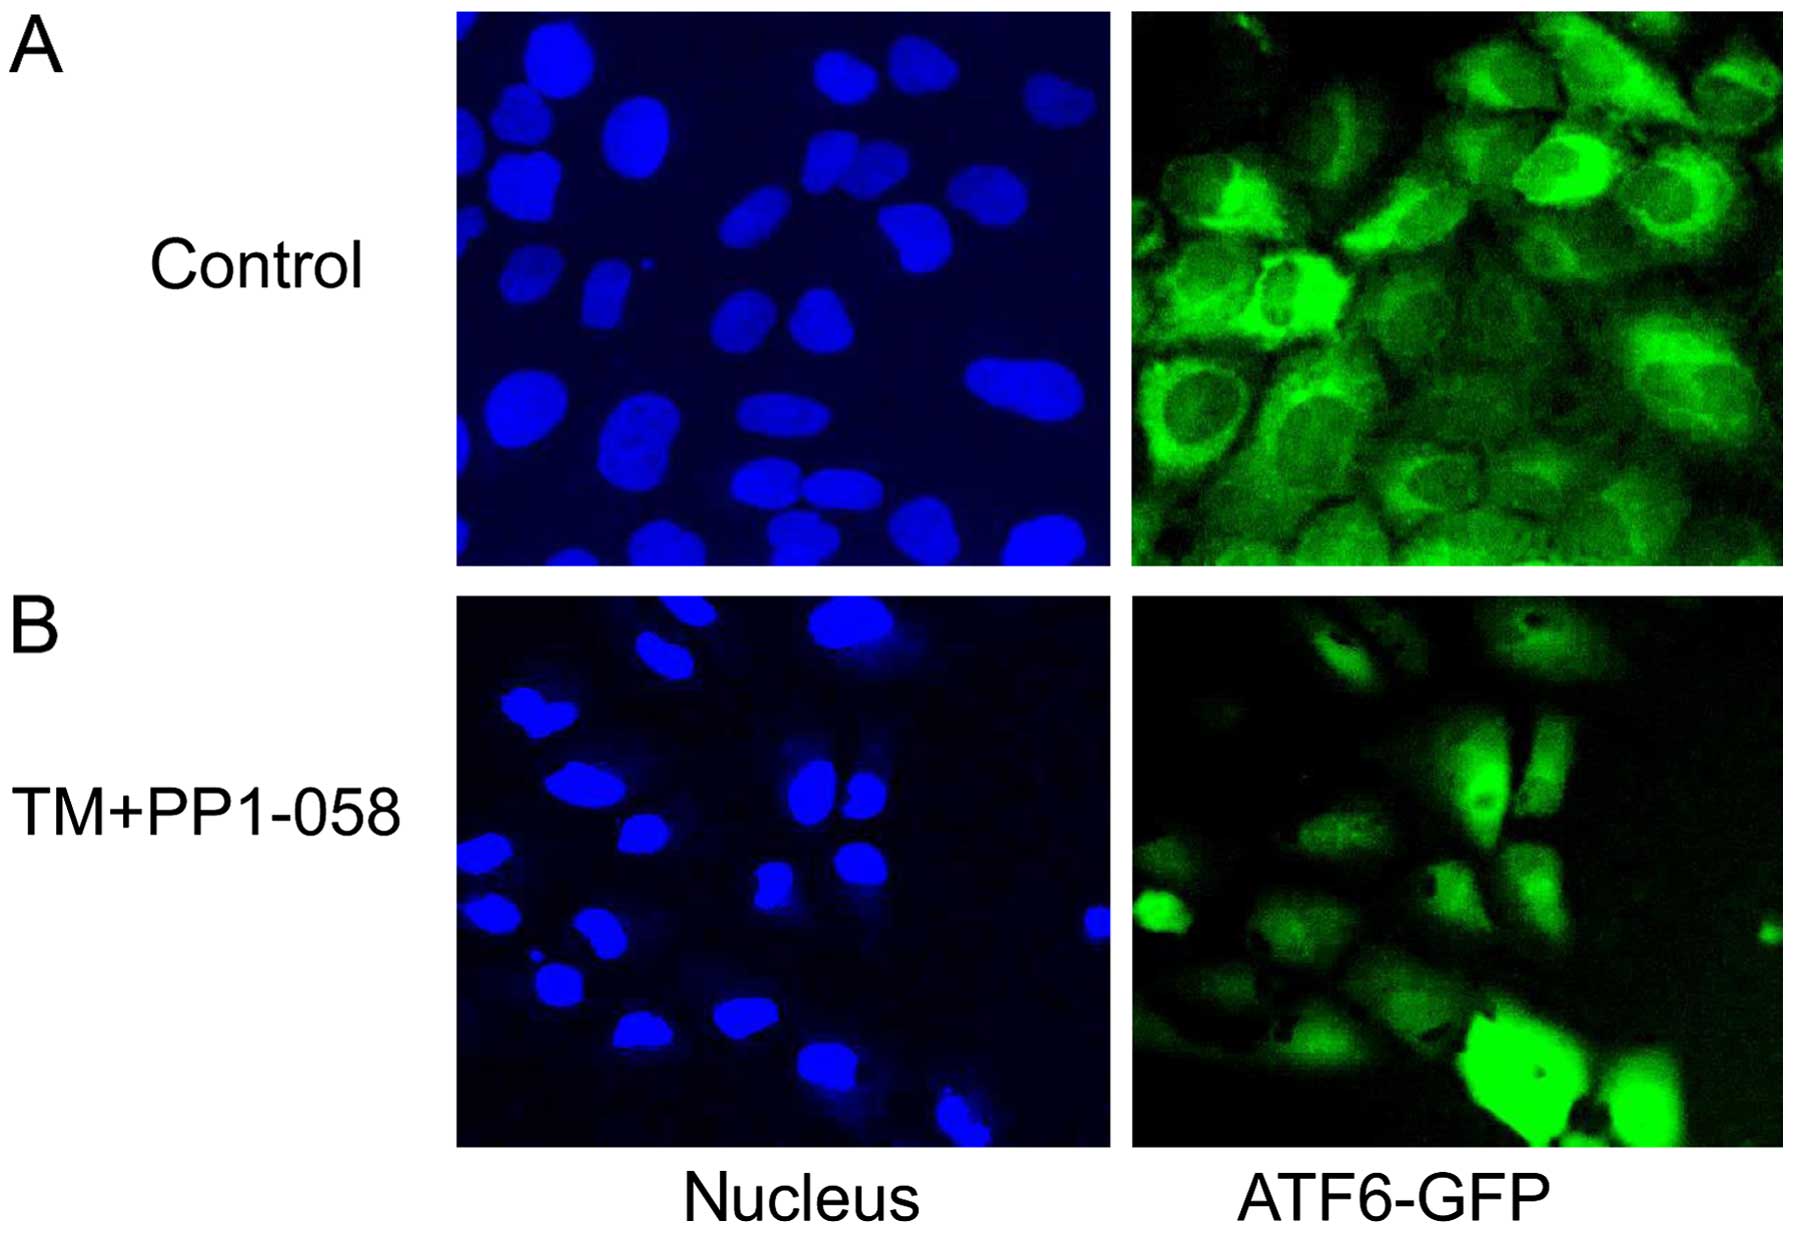
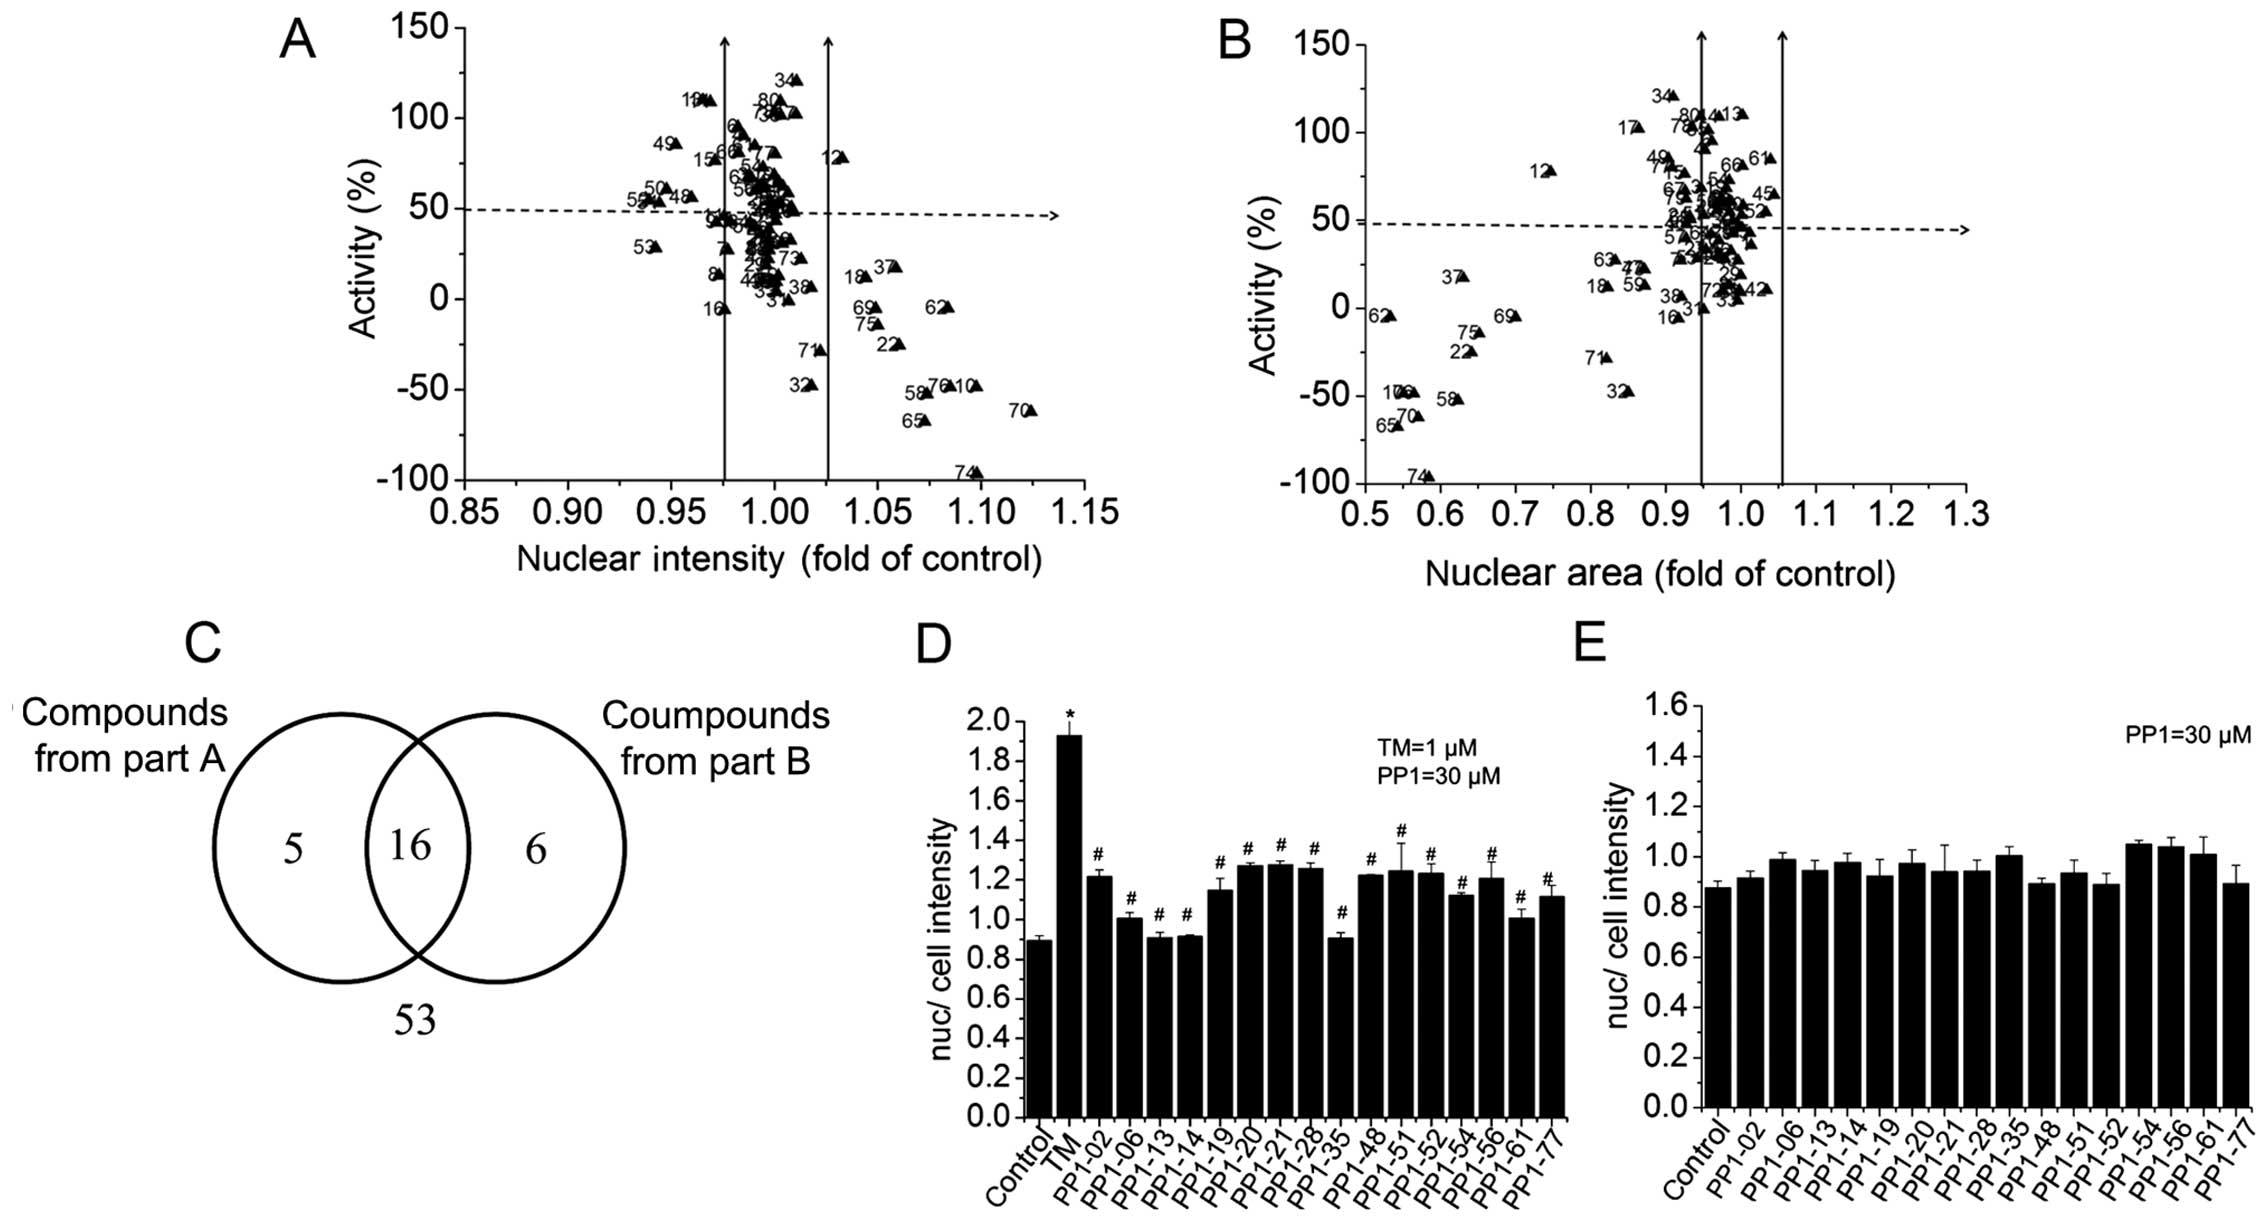
For the primary screening, each compound was tested
at 2 concentrations, 0.3 and 3 µM. During the test, Z' based
was 0.603, which was consistently >0.3 and thus suitable for
screening. 'Activity' is the ATF6-GFP nucleus (Nuc)-cytoplasm
(Cyto) difference normalized to the positive [TM signal (N/C)] and
negative [control (N/C)] controls. The compounds with activity
<50% had no effect. Compared with the control, nuclear intensity
increased and nuclear area decreased eliminates cytotoxic. Of the
80 compounds tested, 16 compounds decreased the nuclear
fluorescence of ATF6 by >50% activity with a nuclear intensity
ranging from 0.975 to 1.025-fold less than that of the TM-only
control. Moreover, 21 compounds decreased nuclear fluorescence
>50% activity, with a nuclear area ranging from 0.95 to
1.05-fold less than that of the TM-only control. Determination of
the compounds which overlapped for both reduced intensity and area
resulted in 16 candidate compounds with >50% activity that were
used for further examination (Fig.
4 and Table I).
 | Table ICompounds identified by primary
screening. |
Table I
Compounds identified by primary
screening.
| Compound | Concentration
(µM) | Activity (%) |
|---|
| PP1-02 | 3 | 38.44 |
| 30 | 62.87 |
| PP1-06 | 3 | 82.87 |
| 30 | 95.17 |
| PP1-13 | 3 | 27.45 |
| 30 | 110.05 |
| PP1-14 | 3 | 104.89 |
| 30 | 109.04 |
| PP1-19 | 3 | 58.61 |
| 30 | 68.54 |
| PP1-20 | 3 | 10.07 |
| 30 | 53.14 |
| PP1-21 | 3 | 21.79 |
| 30 | 52.46 |
| PP1-28 | 3 | 20.21 |
| 30 | 54.93 |
| PP1-35 | 3 | 26.76 |
| 30 | 101.49 |
| PP1-48 | 3 | 3.74 |
| 30 | 56.15 |
| PP1-51 | 3 | 16.50 |
| 30 | 53.15 |
| PP1-52 | 3 | 11.12 |
| 30 | 54.59 |
| PP1-54 | 3 | 46.87 |
| 30 | 72.84 |
| PP1-56 | 3 | 72.81 |
| 30 | 60.10 |
| PP1-61 | 3 | 19.87 |
| 30 | 84.80 |
| PP1-77 | 3 | 64.67 |
| 30 | 80.25 |
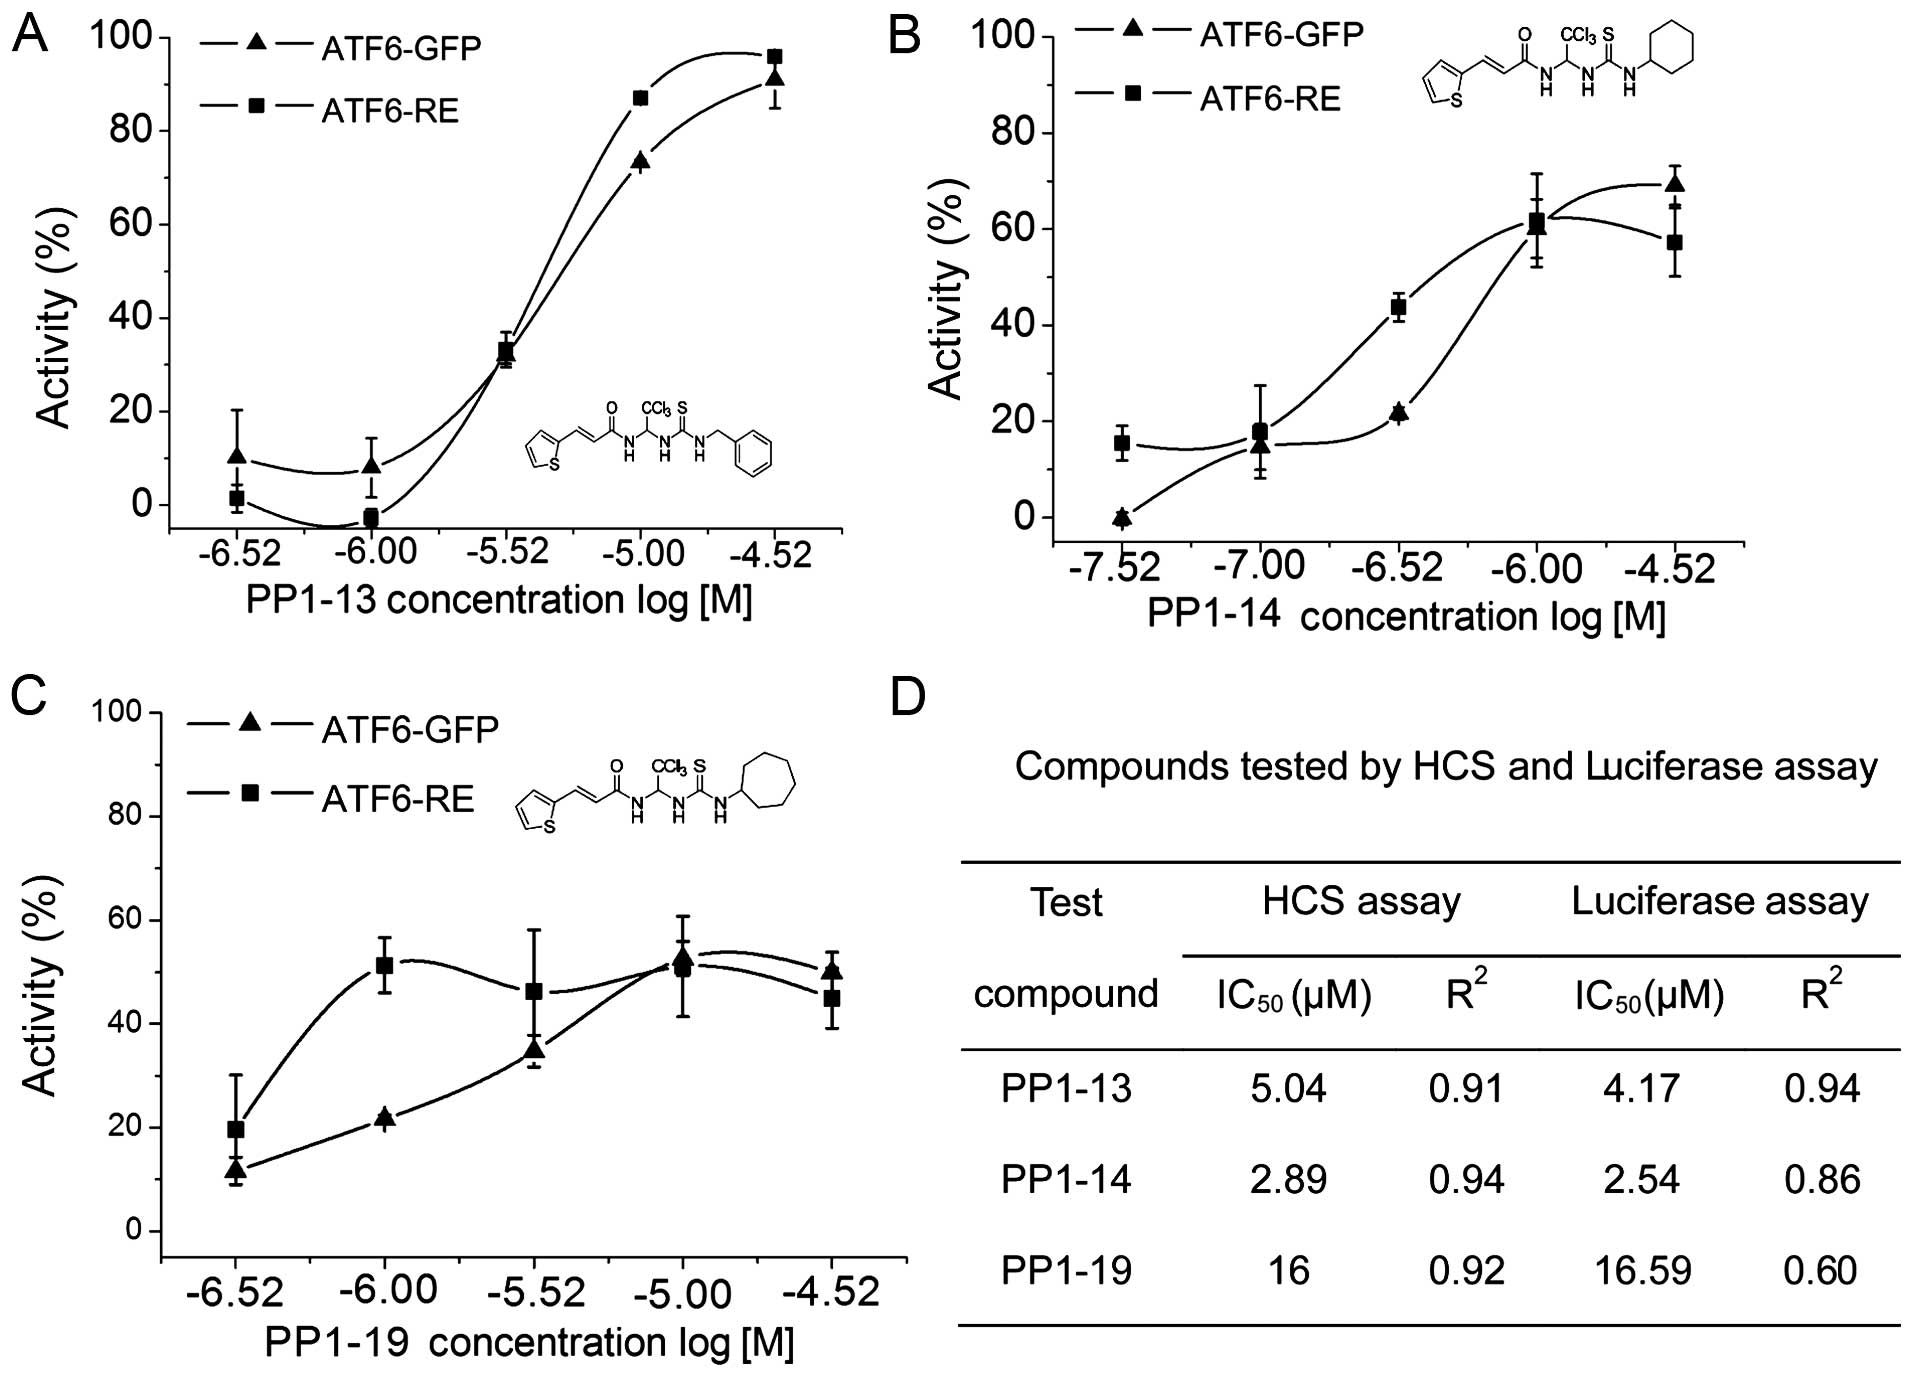
Dose-response analysis of candidate
compounds by HCS
In order to evaluate the dose response of the 16
candidate compounds that inhibited ATF6 nuclear translocation, the
nuclear and cytoplasmic fluorescence profiles were recorded after
applying the different concentrations of the compounds by HCS. We
found that 3 of the 16 candidate compounds inhibited the TM-induced
ATF6 localization to the nucleus in a dose-dependent manner.
PP1-13, PP1-14 and PP1-19 showed 50% inhibitory concentrations
(IC50) of 5.04, 2.89 and 16 µmol/l, respectively,
and R2 values of 0.91, 0.94 and 0.92, respectively. The
inhibition of ATF6 localization to the nucleus was only 2.48% with
PP1-13 at a concentration of 0.3 µM; however, this effect
increased up to 90.38% at 30 µM (Fig. 5 and Table II).
| Table IIStructure of the effective compounds
detected using the HCS technique. |
Table II
Structure of the effective compounds
detected using the HCS technique.
Dose-response analysis of candidate
compounds by luciferase assay
To validate the compounds identified by HCS, a
luciferase assay was performed. Compared with the control, TM
increased ATF6-driven activation of luciferase activity. By
contrast, the candidate compounds impaired this effect in a
dose-dependent manner. The IC50 values of PP1-13, PP1-14
and PP1-19 were 4.17, 2.54 and 16.59 µmol/l, respectively;
the R2 values were 0.94, 0.86 and 0.60, respectively.
PP1-13, for example, exhibited a mean inhibitory activity of
43.59%; however, the compound attained up to 99.95% inhibition of
TM-induced ATF6-driven luciferase activity at a concentration of 30
µM, when compared with the effects of TM alone (Fig. 5).
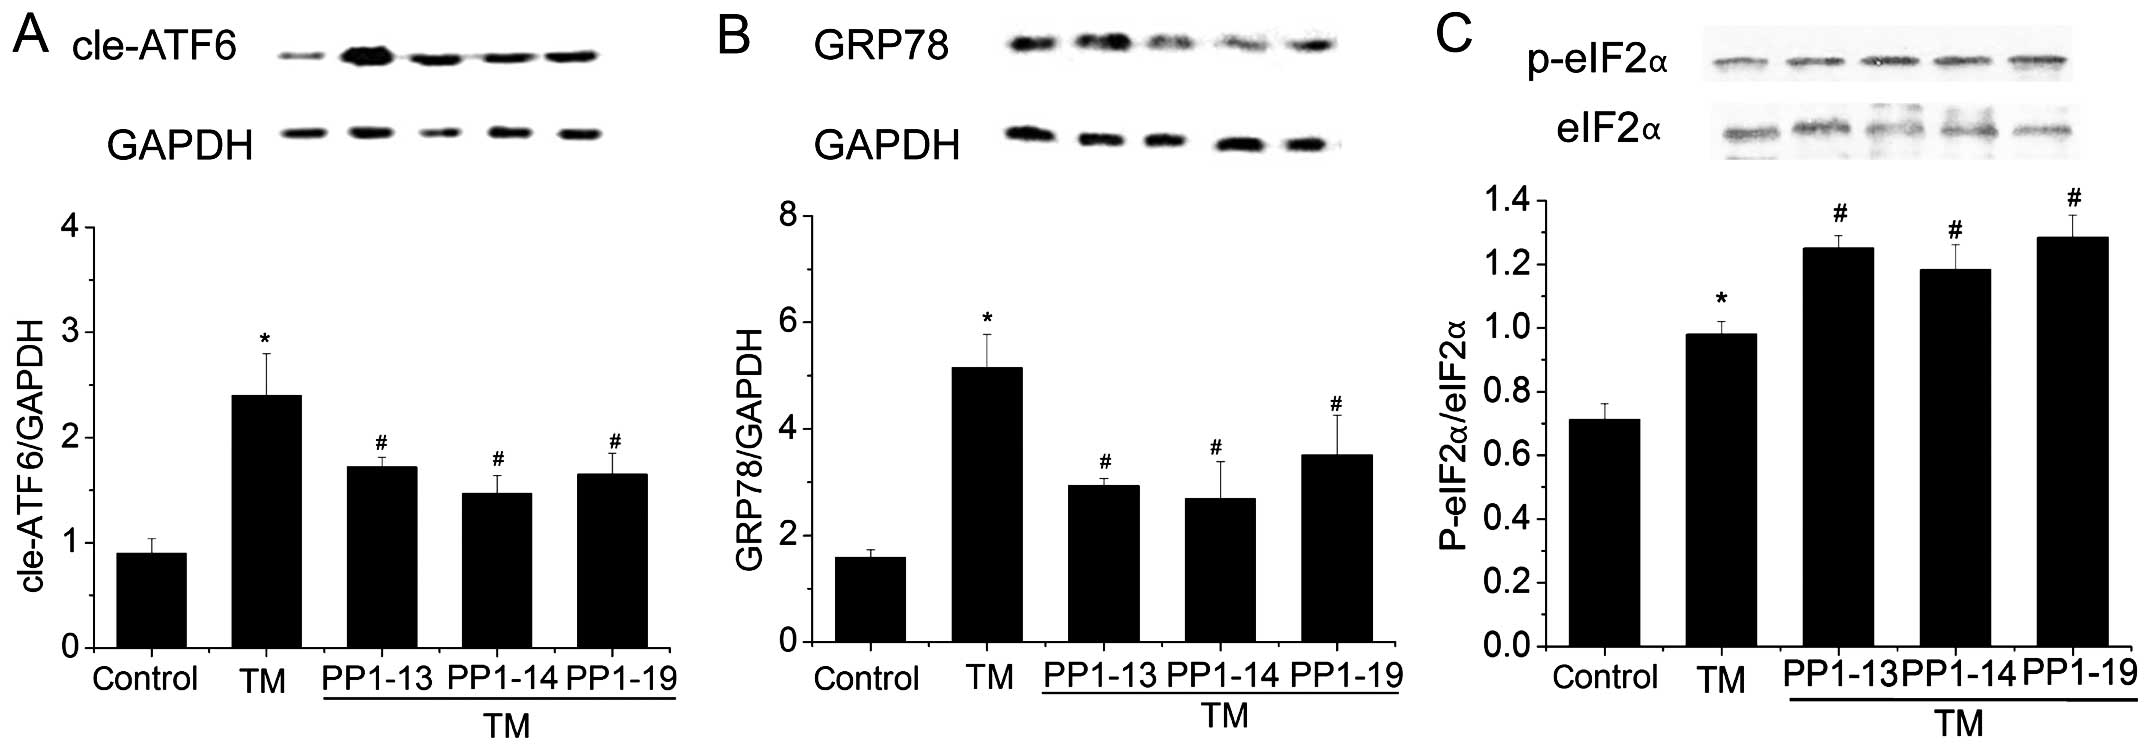
Effect of the candidate compounds on the
protein expression levels of cleaved (cle) ATF6, GRP78 and p-eIF2α
in H9C2 cells
To further confirm the results obtained by HCS and
luciferase assay, western blot analysis was performed to detect the
expression of cleaved-ATF6 protein and that of its downstream
target, GRP78, in H9C2 cells. Compared with the untreated controls,
the cleaved ATF6 and GRP78 expression levels were significantly
increased in the cells treated with TM. By contrast, exposure to
the different candidate compounds impaired the effects of TM and
instead returned the expression levels of ATF6 and GRP78 to close
to the basal levels (Fig. 6A and
B). To evaluate the possible mechanisms through which the
screened compounds inhibited ATF6 activation, the phosphorylation
of eIF2α was detected. Compared with the untreated controls,
p-eIF2α expression was increased in the cells treated with TM.
Compared with the cells treated with TM, exposure to the different
candidate compounds further increased the phosphorylation levels of
eIF2α (Fig. 6C).
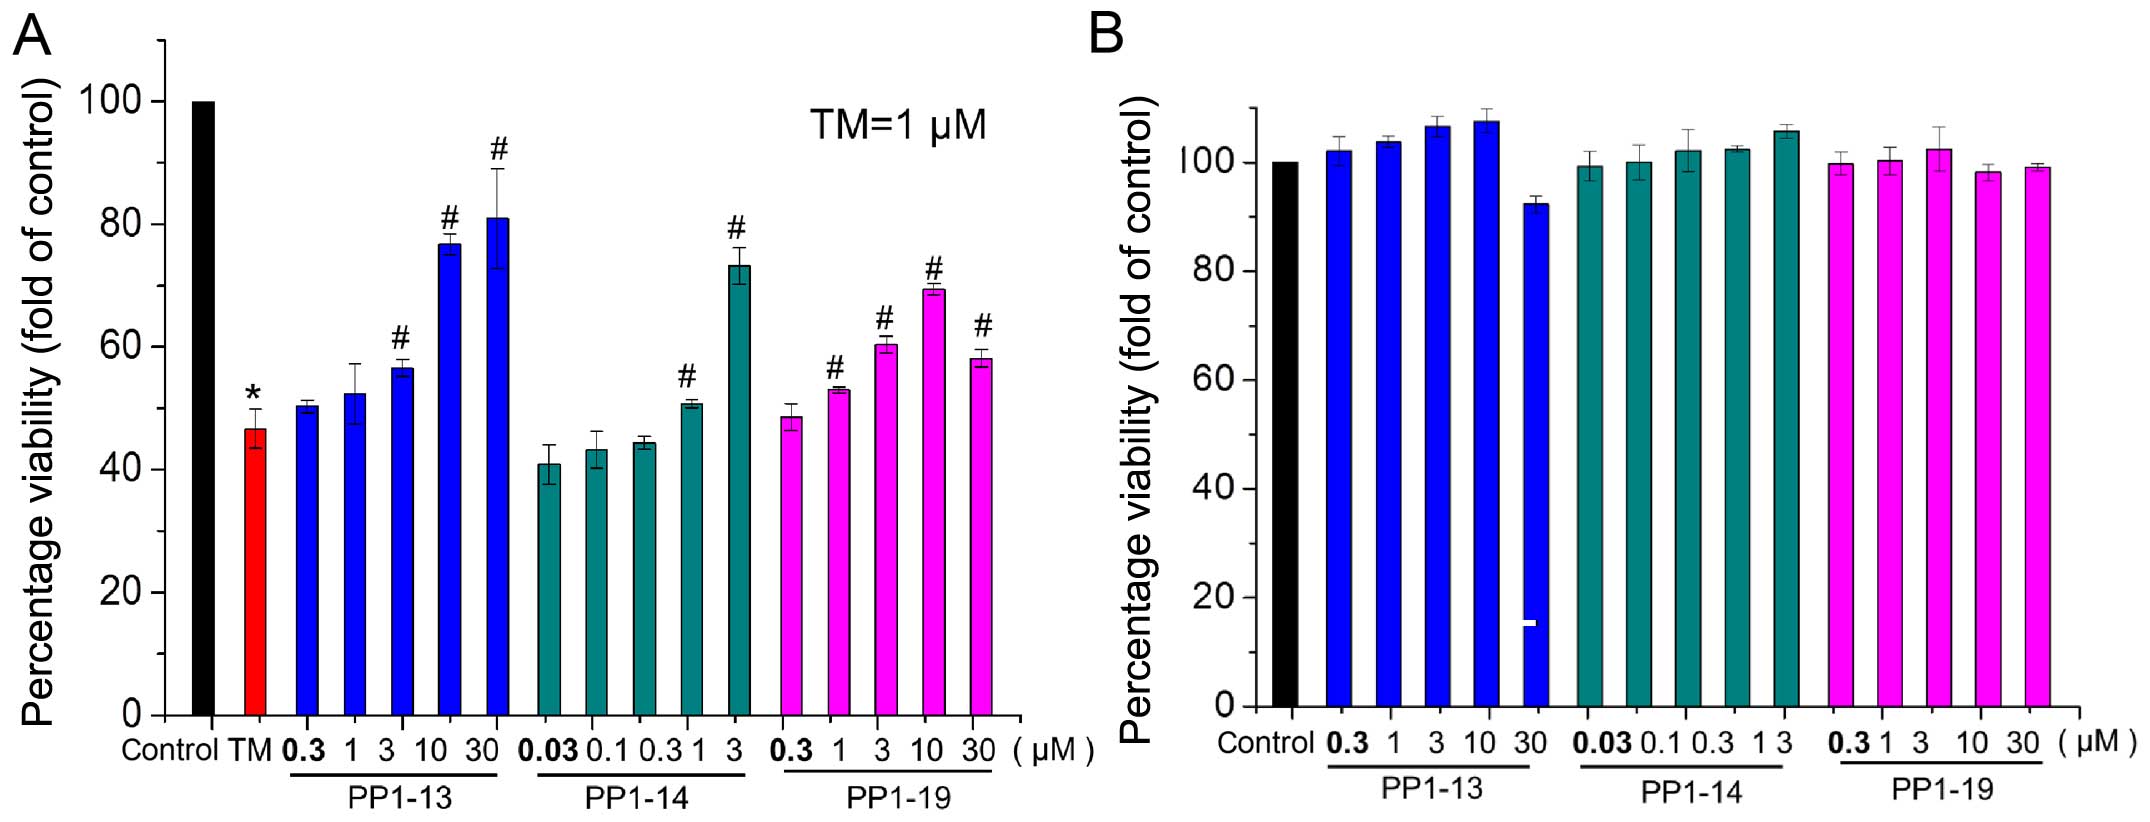
Effects of the candidate compounds on the
viability of H9C2 cells
To further examine the effects of the candidate
compounds, their effects on cell viability were measured by MTT
assay using the H9C2 cells. Compared with the untreated controls
(100%), viability was only 46.63% in the cells treated with TM.
However, co-treatment with TM and the different candidate compounds
significantly increased cell viability. For example, in the H9C2
cells exposed to 10 and 30 µM PP1-13, the viability
increased up to 76.772 and 80.93%, respectively (Fig. 7A). Cell viability assay
demonstrated no significant differences between the cells treated
with the compounds only and the controls (Fig. 7B).
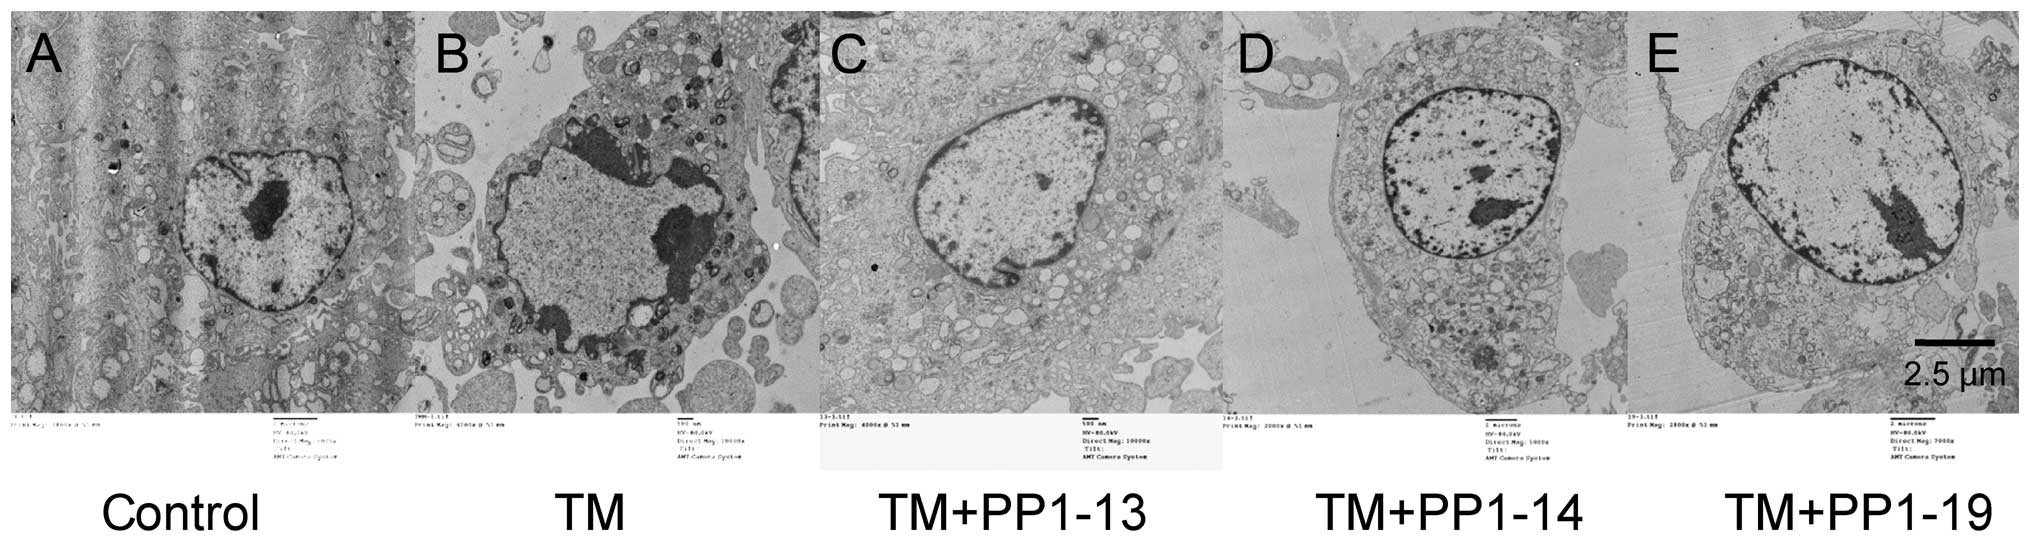
Effects of the candidate compounds on the
ultrastructure of H9C2 cells
The microstructure of the nuclear was examined by
electron microscopy. Treatment with TM resulted in very convoluted
nuclei with chromatin margination. Following exposure to PP1-13,
PP1-14 and PP1-19, margination aggregation disappeared (Fig. 8)
Discusssion
Considering the role of ATF6-associated pathways in
the development of numerous diseases, ATF6 is an attractive
candidate drug target (18,19). Thus, in this study, to identify
compounds that inhibit ATF6 translocation, we used HCS. We used the
U2OS cell line, stably expressing ATF6-EGFP, as our model for HCS,
whereas TM was used to activate its nuclear translocation. We then
screened 80 novel compounds, developed from a target-based drug
design, and found that 3 of these small molecules inhibited the
TM-induced nuclear translocation of ATF6. The reliability of the
HCS approach was further corroborated by conventional methods,
including luciferase reporter gene assay, western blot analysis and
finally the measurement of cell viability.
Using HCS, we concluded that 3 compounds inhibited
the nuclear translocation of ATF6 in a dose-dependent manner. The
R2 values of the 3 compounds were all >0.9, while the
IC50 values ranged from 2.89-16 µmol/l, which are
relatively low, suggesting that these compounds are therapeutically
applicable. To confirm the results from HCS, we used the luciferase
reporter gene assay to determine whether the 3 identified compounds
impaired ATF6-dependent luciferase gene transcription. The results
were consistent with those of HCS. Although both methods were able
to select compounds which effectively impaired the TM-induced ATF6
translocation/activation, the R2 values obtained by the
HCS method were generally higher than those obtained from the
luciferase reporter assays, thus demonstrating its greater
sensitivity. As the above two approaches used ATF6-overexpressing
U2OS cells, we further examined the inhibitory effects of the
active compounds on endogenous ATF6 in the myocardial cell line,
H9C2. The results revealed that the 3 identified compounds
inhibited both TM-induced ATF6 protein expression and that of its
downstream target. This further corroborates the theory that active
compounds identified by HCS are inhibitors of ATF6. As salubrinal
was first shown to protect PC-12 cells from ER stress through the
selective inhibition of eIF2α dephosphorylation (20), we detected whether these screened
compounds exerted the same protective effects. The results
demonstrated that the screened compounds further increased eIF2α
phosphorylation. These results suggest that these screened
compounds enhanced eIF2α phosphorylation, which attenuated
translation initiation and reduced protein synthesis to allow cells
to clear unfolded proteins and inhibit ATF6 activation. Finally, we
examined the cytoprotective effects of the active compounds on H9C2
cells. The results revealed that the HCS-identified compounds
exerted signifi-cant protective effects against ATF6-induced cell
death in the H9C2 cells treated with TM. Moreover, the
screen-identified compounds attenuated the margination aggregation
induced by TM. These results also validated our theory that HCS is
a reliable method for the selection of effective ATF6
inhibitors.
From a technical perspective, western blot analysis
is widely used to quantify protein expression. Nevertheless,
western blot analysis can be a tedious and time-consuming method.
Moreover, western blot analysis only provides output concerning
total cell responses, and cannot indicate the subcellular origins
of the responses (21). The
transcription factor activated luciferase reporter gene assay is a
method for quantifying target specific transcriptional activation
by transcription factors. However, one shortcoming is that it is
necessary to lyse cells to extract luciferase, in order to acquire
information (22). Thus, they are
not suitable for in vivo cellular analysis. Moreover, the
two methods offer only limited data; specifically, they cannot
reveal the complete picture of the biological activities of
screened molecules. HCS is a novel technique in high throughput
drug screening which allows for direct observation of the effects
of tested compounds on morphology, structure and toxicity in living
cells (23). Through the use of
an automated graphical analysis system in HCS, multiple parameters,
including cellular morphology and fluorescent label distribution
and intensity can be more objectively and quantitatively monitored.
Indeed, both biological activities and toxicities of tested agents
can be monitored at the same time, and thus HCS provides more
reliable data than those obtained via other methods (24,25). Moreover, the quantities of cells
used are small and the steps are largely automated (26). In short, compared with the
reporter gene assay or western blot analysis, the HCS protocol
reported in the current study is simpler and more efficient.
The HCS and luciferase assay both identified
compounds which impaired ATF6 nuclear translocation at a
concentration of approximately 10 µmol/l. These data are
consistent with those of another study that tested these types of
compounds (27). As the compounds
were synthesized on the basis of salubrinal, these results
indicated the consistent efficiency of these screened compounds
compared with salubrinal. Of note, the active compounds identified
by HCS were observed to share a similar structure, which is
consistent with our previous study (17). Notably, there are some
disadvantages in our current study. First, we selected U2OS cells,
a cell model engineered to highly express exogenous ATF6-EGFP for
image capturing. In future studies, cells with endogenous
expression of ATF6 should be used for HCS analysis. Second, the
association between compound structures and how they contribute to
the impairment of ATF6 nuclear translocation remains unknown. Thus,
other structure-based assays are warranted to elucidate the exact
functions of these compounds and their mechanisms of action.
In conclusion, the HCS protocol used in the current
study efficiently detected compounds that inhibited ATF6
activation. The reliability of the protocol was corroborated by
luciferase reporter gene assay and western blot analysis. We
identified 3 compounds which inhibited ATF6 nuclear translocation
and impaired ATF6-mediated induced cell death. Thus, HCS may be
valuable in future applications concerning ATF6 activation and
activities of the related pharmacological agents.
Acknowledgments
This study was funded by the Ministry Science
Foundation of the Chinese People's Liberation Army during the 12th
Five-Year Plan Period (no. BWS12J048) and the Major International
Science and Technology Cooperation Projects (no. 2013DFA31170).
References
|
1
|
Wiseman RL and Balch WE: A new
pharmacology - drugging stressed folding pathways. Trends Mol Med.
11:347–350. 2005. View Article : Google Scholar : PubMed/NCBI
|
|
2
|
Wiseman RL, Haynes CM and Ron D: SnapShot:
the unfolded protein response. Cell. 140:590–590.e2. 2010.
View Article : Google Scholar : PubMed/NCBI
|
|
3
|
Hong M, Luo S, Baumeister P, Huang JM,
Gogia RK, Li M and Lee AS: Underglycosylation of ATF6 as a novel
sensing mechanism for activation of the unfolded protein response.
J Biol Chem. 279:11354–11363. 2004. View Article : Google Scholar
|
|
4
|
Zhao L and Ackerman SL: Endoplasmic
reticulum stress in health and disease. Curr Opin Cell Biol.
18:444–452. 2006. View Article : Google Scholar : PubMed/NCBI
|
|
5
|
Boot-Handford RP and Briggs MD: The
unfolded protein response and its relevance to connective tissue
diseases. Cell Tissue Res. 339:197–211. 2010. View Article : Google Scholar
|
|
6
|
Northington FJ, Chavez-Valdez R and Martin
LJ: Neuronal cell death in neonatal hypoxia-ischemia. Ann Neurol.
69:743–758. 2011. View Article : Google Scholar : PubMed/NCBI
|
|
7
|
Mei J and Niu C: Alterations of Hrd1
expression in various encephalic regional neurons in 6-OHDA model
of Parkinson's disease. Neurosci Lett. 474:63–68. 2010. View Article : Google Scholar : PubMed/NCBI
|
|
8
|
Chu WS, Das SK, Wang H, Chan JC, Deloukas
P, Froguel P, Baier LJ, Jia W, McCarthy MI, Ng MC, et al:
Activating transcription factor 6 (ATF6) sequence polymorphisms in
type 2 diabetes and pre-diabetic traits. Diabetes. 56:856–862.
2007. View Article : Google Scholar : PubMed/NCBI
|
|
9
|
Vekich JA, Belmont PJ, Thuerauf DJ and
Glembotski CC: Protein disulfide isomerase-associated 6 is an
ATF6-inducible ER stress response protein that protects cardiac
myocytes from ischemia/reperfusion-mediated cell death. J Mol Cell
Cardiol. 53:259–267. 2012. View Article : Google Scholar : PubMed/NCBI
|
|
10
|
Hotamisligil GS: Endoplasmic reticulum
stress and the inflammatory basis of metabolic disease. Cell.
140:900–917. 2010. View Article : Google Scholar : PubMed/NCBI
|
|
11
|
Lee J, Hong SW, Park SE, Rhee EJ, Park CY,
Oh KW, Park SW and Lee WY: Exendin-4 attenuates endoplasmic
reticulum stress through a SIRT1-dependent mechanism. Cell Stress
Chaperones. 19:649–656. 2014. View Article : Google Scholar : PubMed/NCBI
|
|
12
|
Tsukumo Y, Tomida A, Kitahara O, Nakamura
Y, Asada S, Mori K and Tsuruo T: Nucleobindin 1 controls the
unfolded protein response by inhibiting ATF6 activation. J Biol
Chem. 282:29264–29272. 2007. View Article : Google Scholar : PubMed/NCBI
|
|
13
|
Citron M, Diehl TS, Capell A, Haass C,
Teplow DB and Selkoe DJ: Inhibition of amyloid beta-protein
production in neural cells by the serine protease inhibitor AEBSF.
Neuron. 17:171–179. 1996. View Article : Google Scholar : PubMed/NCBI
|
|
14
|
Damiano F, Tocci R, Gnoni GV and Siculella
L: Expression of citrate carrier gene is activated by ER stress
effectors XBP1 and ATF6α, binding to an UPRE in its promoter.
Biochim Biophys Acta. 1849:23–31. 2015. View Article : Google Scholar
|
|
15
|
Cox DJ, Strudwick N, Ali AA, Paton AW,
Paton JC and Schröder M: Measuring signaling by the unfolded
protein response. Methods Enzymol. 491:261–292. 2011. View Article : Google Scholar : PubMed/NCBI
|
|
16
|
Bouck DC, Shu P, Cui J, Shelat A and Chen
T: A high-content screen identifies inhibitors of nuclear export of
forkhead transcription factors. J Biomol Screen. 16:394–404. 2011.
View Article : Google Scholar : PubMed/NCBI
|
|
17
|
Liu J, He KL, Li X, Li RJ, Liu CL, Zhong W
and Li S: SAR, cardiac myocytes protection activity and 3D-QSAR
studies of salubrinal and its potent derivatives. Curr Med Chem.
19:6072–6079. 2012. View Article : Google Scholar : PubMed/NCBI
|
|
18
|
Toko H, Takahashi H, Kayama Y, Okada S,
Minamino T, Terasaki F, Kitaura Y and Komuro I: ATF6 is important
under both pathological and physiological states in the heart. J
Mol Cell Cardiol. 49:113–120. 2010. View Article : Google Scholar : PubMed/NCBI
|
|
19
|
Adachi Y, Yamamoto K, Okada T, Yoshida H,
Harada A and Mori K: ATF6 is a transcription factor specializing in
the regulation of quality control proteins in the endoplasmic
reticulum. Cell Struct Funct. 33:75–89. 2008. View Article : Google Scholar : PubMed/NCBI
|
|
20
|
Boyce M, Bryant KF, Jousse C, Long K,
Harding HP, Scheuner D, Kaufman RJ, Ma D, Coen DM, Ron D and Yuan
J: A selective inhibitor of eIF2alpha dephosphorylation protects
cells from ER stress. Science. 307:935–939. 2005. View Article : Google Scholar : PubMed/NCBI
|
|
21
|
Boyd JD, Lee-Armandt JP, Feiler MS, Zaarur
N, Liu M, Kraemer B, Concannon JB, Ebata A, Wolozin B and Glicksman
MA: A high-content screen identifies novel compounds that inhibit
stress-induced TDP-43 cellular aggregation and associated
cytotoxicity. J Biomol Screen. 19:44–56. 2014. View Article : Google Scholar :
|
|
22
|
Mori T, Saito F, Yoshino T, Takeyama H and
Matsunaga T: Reporter gene assay against lipophilic chemicals based
on site-specific genomic recombination of a nuclear receptor gene,
its response element, and a luciferase reporter gene within a
stable HeLa cell line. Biotechnol Bioeng. 99:1453–1461. 2008.
View Article : Google Scholar
|
|
23
|
Gasparetto M, Gentry T, Sebti S, O'Bryan
E, Nimmanapalli R, Blaskovich MA, Bhalla K, Rizzieri D, Haaland P,
Dunne J and Smith C: Identification of compounds that enhance the
anti-lymphoma activity of rituximab using flow cytometric
high-content screening. J Immunol Methods. 292:59–71. 2004.
View Article : Google Scholar : PubMed/NCBI
|
|
24
|
Starkuviene V and Pepperkok R: The
potential of high-content high-throughput microscopy in drug
discovery. Br J Pharmacol. 152:62–71. 2007. View Article : Google Scholar : PubMed/NCBI
|
|
25
|
Feng Y, Mitchison TJ, Bender A, Young DW
and Tallarico JA: Multi-parameter phenotypic profiling: using
cellular effects to characterize small-molecule compounds. Nat Rev
Drug Discov. 8:567–578. 2009. View
Article : Google Scholar : PubMed/NCBI
|
|
26
|
Giuliano KA, Haskins JR and Taylor DL:
Advances in high content screening for drug discovery. Assay Drug
Dev Technol. 1:565–577. 2003. View Article : Google Scholar
|
|
27
|
Liu CL, Li X, Hu GL, Li RJ, He YY, Zhong
W, Li S, He KL and Wang LL: Salubrinal protects against tunicamycin
and hypoxia induced cardiomyocyte apoptosis via the PERK-eIF2α
signaling pathway. J Geriatr Cardiol. 9:258–268. 2012.PubMed/NCBI
|