Introduction
Ovarian cancer, which comprises a heterogeneous
group of neoplasms, is the most lethal gynecological malignancy
(1). It is characterized by poor
prognosis, with an overall 5-year survival rate of approximately
50% that, however, rises to 90% if the cancer is diagnosed while
still confined to the ovary (an event that, unfortunately, occurs
in 20% of patients) (2).
Ovarian cancer diagnosis, indeed, is often delayed
since this pathology lacks specific symptoms (non-specific symptoms
include frequent urination, bloating, abdominal fullness and early
satiety) which, instead, appear only during advanced stages and are
related to the presence of large tumors or extensive ascites
(3). Tools for ovarian cancer
diagnosis include computer tomography-positron emission tomography
(CT-PET), fluorodeoxyglucose-PET (FDG-PET), magnetic resonance,
transvaginal and transabdominal sonography, as well as serum marker
CA-125 measurement (2). An early
diagnosis provides patients with a greater chance of being properly
cured using the available therapies (such as surgery or
chemotherapy with a combination of platinum and taxane); the more a
tumoral mass is reduced by surgery, the more often chemotherapy is
effective (4).
Many studies regarding different pathologies, as
well as cancer diseases, rely on in vitro cell line
research; specifically, ovarian cancer studies may use several
human cell lines such as OVCAR3 (5), SK-OV-3 (6), A2780 (7), IGROV1 (8) or OAW42 (9). CABA I is an ovarian cancer cell line
of epithelial origin, which was established from ascitic fluid
obtained from a patient with papillary adenocarcinoma of the ovary
prior to drug treatment. CABA I cell growth is anchorage dependent
and very rapid (the doubling time is approximately 18 h);
preliminary cytogenetic analysis indicated a modal chromosome
number of 57–58, with 44 clonal structural aberrations and only few
chromosomes appearing morphologically normal (10).
It has previously been demonstrated that growth and
phenotypic characteristics are maintained both in early and late
passages, suggesting that the CABA I cell line provides a suitable
in vitro model system in order to investigate the cellular
and molecular events involved in ovarian carcinogenesis (10). Thus, since then, many studies have
concentrated on CABA I behavior in cancer progression, with
particular interest being shown in relation to the release of
extracellular vesicles (11–18).
For some years, the short tandem repeats (STR)
profiling has been the international reference standard for the
identification of cell lines (19–22), and thus in the present study we
proceeded to subject CABA I to this analysis to prevent future
misidentification or cross-contaminations during in vitro
cultivation. Furthermore, the cell line was analyzed by classical
and molecular cytogenetic techniques: we chose two different
passages, the 18th and 38th, to identify chromosomal aberrations
and the karyotypic evolution of this cell line.
Materials and methods
CABA I cells
The 18th and 38th passages of CABA I cells were
grown as monolayers in RPMI-1640 with 5% fetal calf serum, 2 mM
glutamine and penicillin 100 U/ml (all materials are from
Euroclone, Devon, UK). Cells at passages 18 and 38 were tested for
mycoplasma infection and the result was negative. Cells passed from
18th to 38th passages in approximately 15 weeks.
Cytogenetic analyses
Standard cytogenetic techniques (23) were used on CABA I cells at the
18th and 38th passages in order to identify chromosomal aberrations
and the karyotypic evolution of this cell line.
In addition, every metaphase was analyzed by
sequential GTG-banding and fluorescence in situ hybridization
(FISH) with whole chromosome painting probes specific for each
chromosome. Briefly, metaphases stained with giemsa solution after
partial trypsin digestion (GTG-banding) were observed under a light
field microscope (Leica Aristoplan microscope; Leica, Wetzlar,
Germany), captured with PSI MacKtype software and finally destained
three times in methanol. The slides were then washed in 2X SSC
solution, heated at 70°C in SSC/formamide solution to denature
target chromosome DNA, and hybridized with FISH probes specific to
a whole chromosome. Observation under a fluorescence microscope
allowed us to capture again the same GTG-banded metaphases
previously observed and analyze the hybridization on markers
chromosomes of the CABA I cell line.
DNA extraction
The DNA contained in CABA I cells, at the 18th and
38th passages, was extracted from approximately 5×10⁶
cells using an automatic extractor MagNA Pure Compact system (Roche
Diagnostics, Basel, Switzerland). The procedure involves several
steps, consisting of preparatory cell disruption and protein
digestion caused by the addition of lysis buffer and proteinase K,
the formation of nucleic acid-bead complexes caused by nucleic acid
binding to the surface of magnetic glass particles and subsequent
magnetic separation; after washing to remove cell debris, nucleic
acid is eluted at high temperatures with simultaneous removal of
the magnetic glass particles. Thus, 44.4 and 136 ng/µl were
obtained from CABA I 18th and 38th passages, respectively.
STR analysis
An amplification PCR kit PowerPlex® 16 HS
(Promega, Fitchburg, WI, USA) is a multiplex STR test that
co-amplifies in a single polymerase chain reaction (PCR) 16 loci:
D18S51, D21S11, TH01, D3S1358, FGA, TPOX, D8S1179, vWA, CSF1PO,
D16S539, D7S820, D13S317, D5S818, Amelogenin, Penta E and Penta D.
Table I includes specific
information for each locus. The kit also contains an allelic
ladder, which is a mix of more common alleles for each analyzed
locus: the genotype is assigned by means of comparing dimensions of
unknown samples and the aforementioned allelic ladder. The kit
requires only 0.5–1 ng of DNA for a single test. The obtained DNA
fragments are automatically analyzed by a triple fluorescence
system.
 | Table ISummary information of
GenePrint® PowerPlex 16 System-loci. |
Table I
Summary information of
GenePrint® PowerPlex 16 System-loci.
| STR locus | Chromosomal
location | Repeat sequence
5′→3′ | Size range
(bases) |
|---|
| Penta E | 15q | AAAGA | 379–474 |
| D18S51 | 18q21.3 | AGAA | 290–366 |
| D21S11 | 21q11-21q21 | TCTA | 203–259 |
| TH01 | 11p15.5 | AATG | 156–195 |
| D3S1358 | 3p | TCTA | 115–147 |
| FGA | 4q28 | TTTC | 322–444 |
| TPOX | 2p23-2pter | AATG | 262–290 |
| D8S1179 | 8q | TCTA | 203–247 |
| vWA | 12p12-pter | TCTA | 123–171 |
| Amelogenin | Xp22.1-22.3 and
Y | Not applicable | 106, 112 |
| Penta D | 21q | AAAGA | 376–441 |
| CSF1PO | 5q33.3-34 | AGAT | 321–357 |
| D16S539 | 16q24-qter | GATA | 264–304 |
| D7S820 | 7q11.21-22 | GATA | 215–247 |
| D13S317 | 13q22-q31 | TATC | 169–201 |
| D5S818 | 5q23.3-32 | AGAT | 119–155 |
In order to perform PCR, according to the
manufacturer's instructions, DNA was diluted to a final
concentration of 0.5 ng/µl. PCR tubes were prepared, mixing
all components suggested in adequate volumes: DNA template (0.5–1
ng), PowerPlex HS Master Mix, PowerPlex 16 HS Primer Pair Mix and
water (amplification grade). Each amplification, aside from
samples, also contains positive and negative controls (provided in
kit). Amplification was performed, as suggested, using the thermal
cycler GeneAmp PCR system 9700 (Thermo Fisher Scientific, Waltham,
MA, USA) and the following cycles: 96°C for 2 min, then ramp 100%
to 94°C for 30 sec - ramp 29% to 60°C for 30 sec - ramp 23% to 70°C
for 45 seconds for a total of 10 cycles, then ramp 100% to 90°C for
30 sec - ramp 29% to 60°C for 30 sec - ramp 23% to 70°C for 45
seconds for a total of 22 cycles, then 60°C for 30 min and finally
a 4°C soak.
One microliter of amplified DNA was combined with 10
µl mix solution (9.5 µl formamide and 0.5 µl
IL600 Standard; Promega). Simultaneously, in the appropriate well,
1 µl allelic ladder was distributed. Samples were heat
denatured at 95°C for 3 min, quickly refrigerated on ice for at
least 3 min, transferred onto a plate and placed in the ABI 3130
sequencer (Applied Biosystems Life Technologies, Foster City, CA,
USA) with POP7 polymer (a separation matrix for performing DNA
sequencing and fragment analysis) in a 36-cm capillary tube. ABI
3130 was set for an electrophoresis run and, subsequently, STR
profiles were analyzed by Software GeneMapper 3.2.1.
Results
Cytogenetic analysis
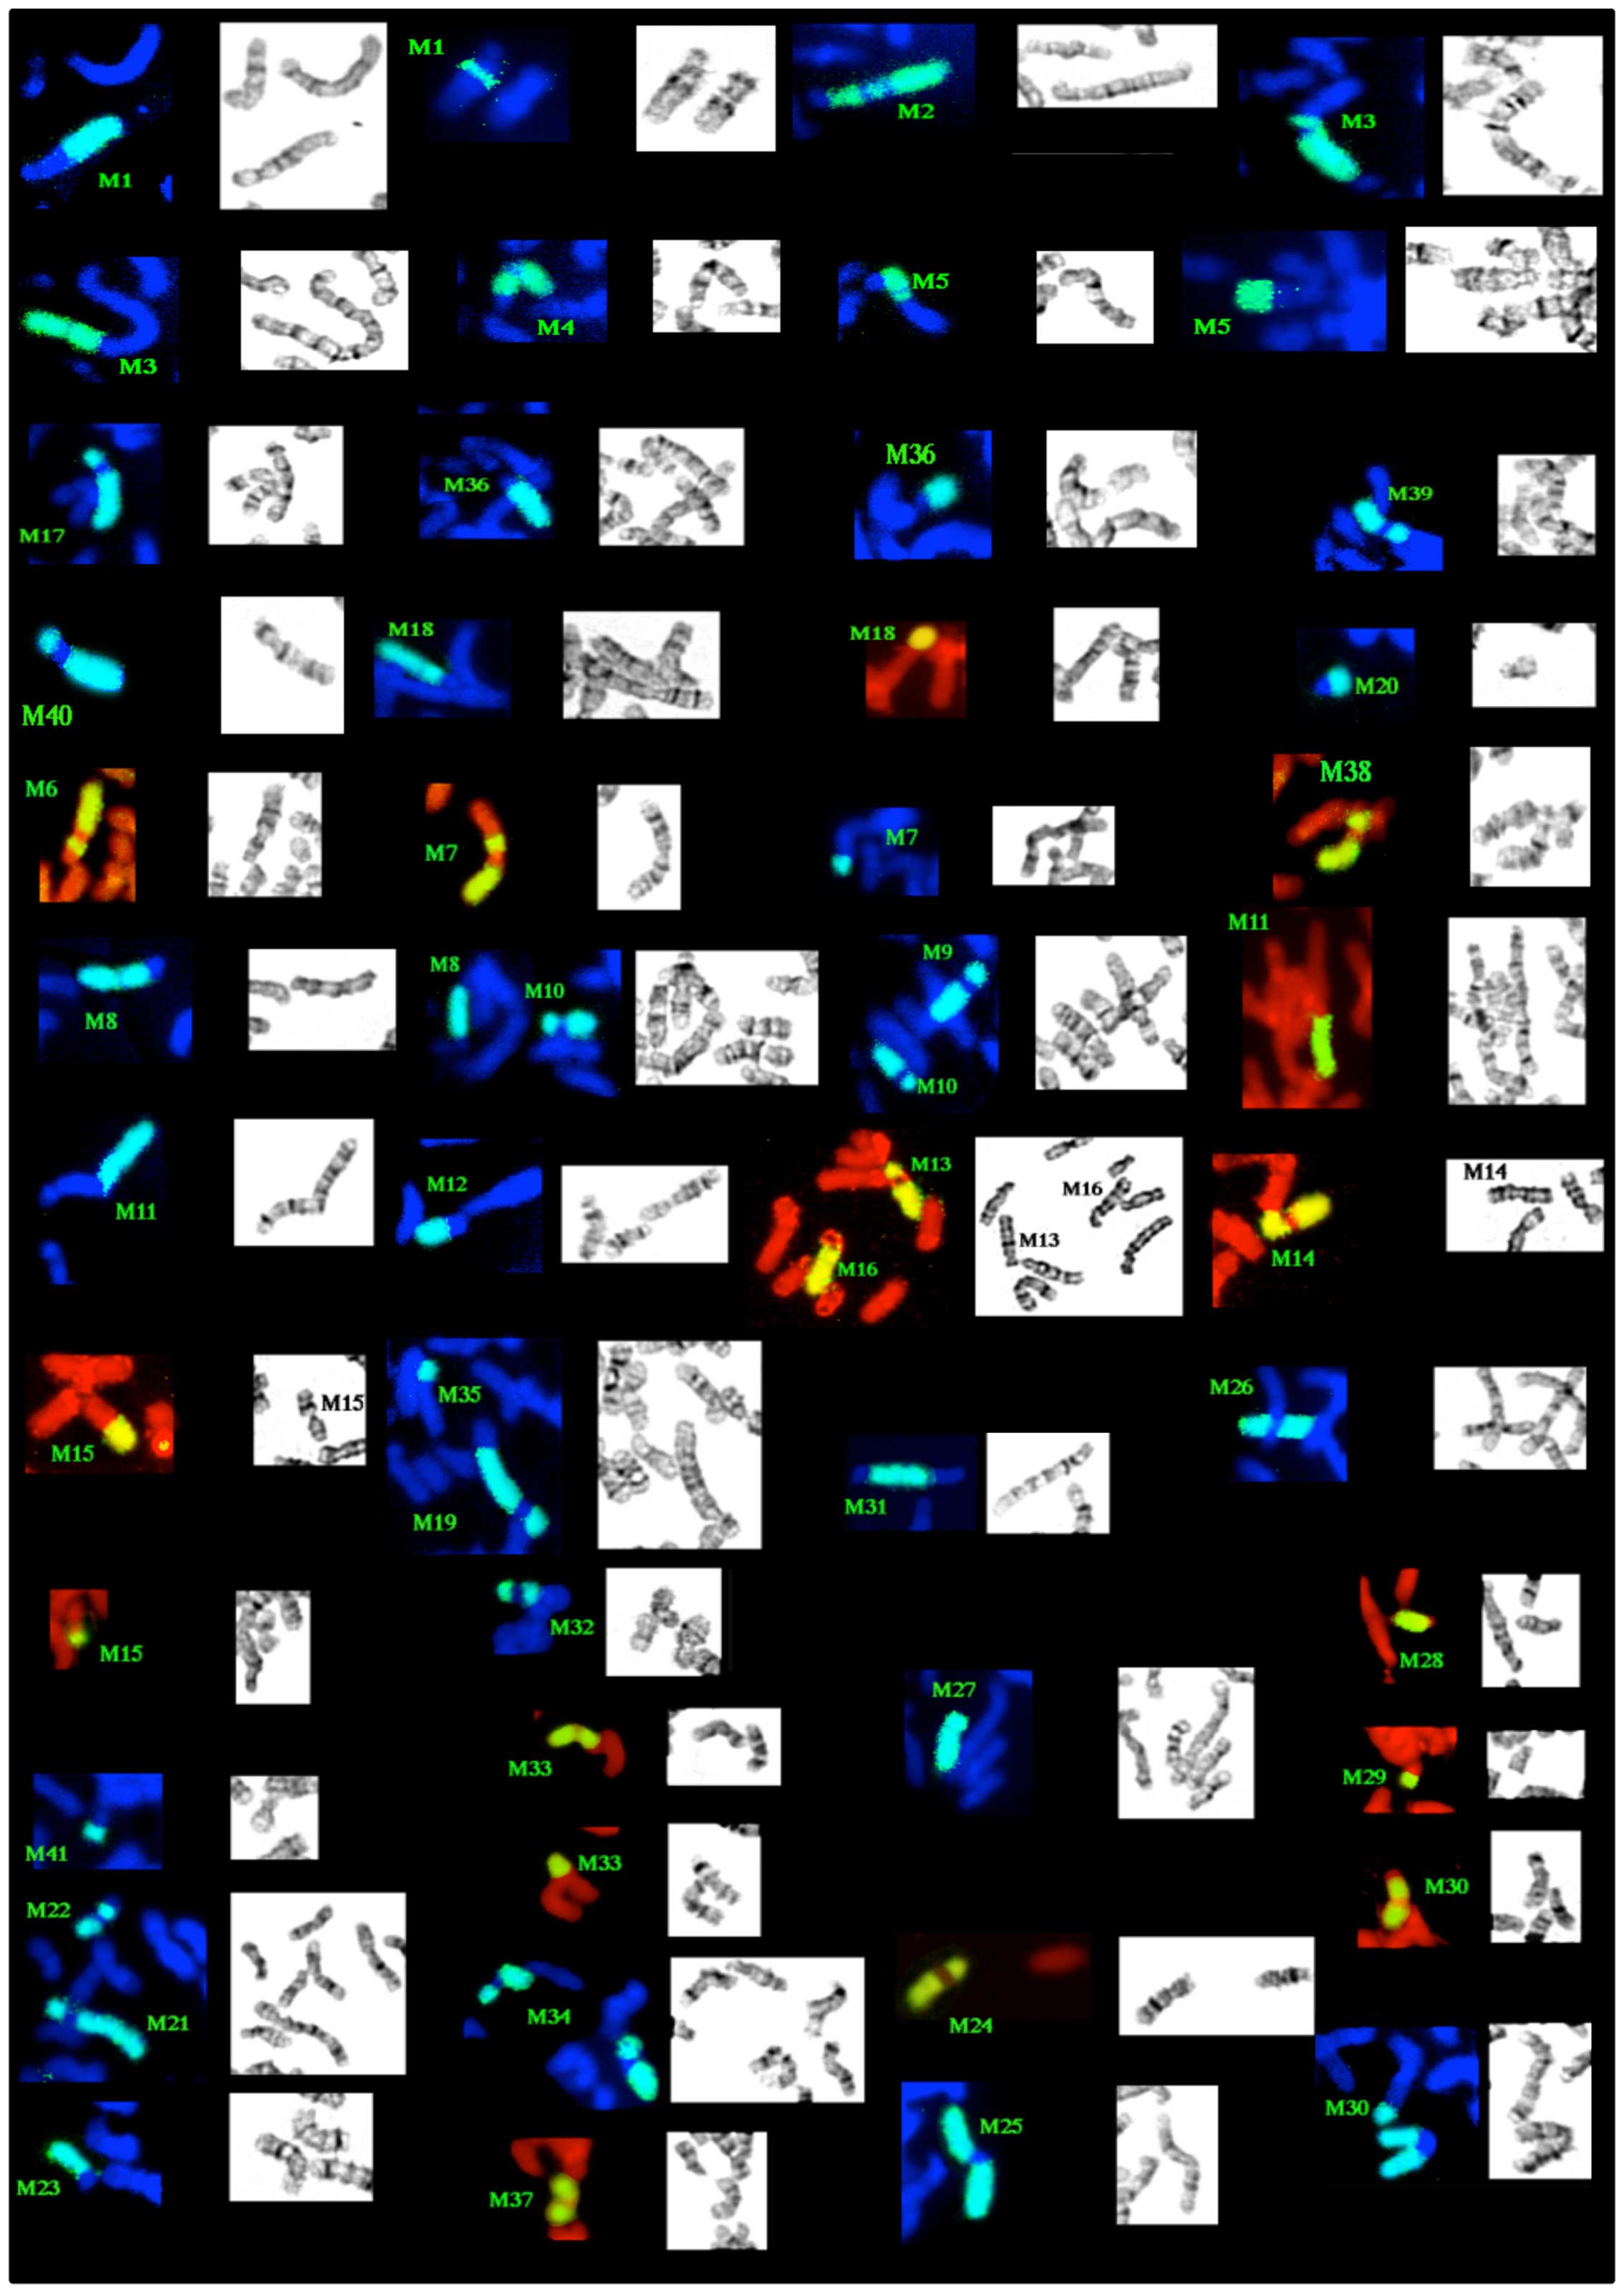
After cytogenetic analysis of the 18th passage, we
noted a highly complex karyotype with a modal number of 57–58
chromosomes, 44 clonal markers and a chromosomal instability which
was represented by frequent sporadic aberrations (Fig. 1). We also noted that eight of the
clonal markers are present in duplicate. The description of the
structural aberrations is reported in Table II. Certain chromosomal regions,
such as 7p11-13, 15q11-15 and 17p11-13 seemed to be over
represented, while others, i.e., 6q25-27, 9p and 15q24-qter were
lost.
| Table IIDescription and frequency of
chromosomal markers. |
Table II
Description and frequency of
chromosomal markers.
| Marker | Description | % |
|---|
| M1 |
der(9)t(1;9)(p13.3;p21.2)del(9)(q21.2) | 100 |
| M2 | del(1)(q11) | 100 |
| M3 |
der(4)t(1;4)(q12;p12)inv(4)(p12q21) | 100 |
| M4 |
der(?)t(1;?)(q21;?) | 100 |
| M5 |
der(1)t(1;9)(p22;q13)del(1)(q11) | 100 |
| M6 |
der(?)t(2;?;2)(q21;?;?) (x2) | 100 |
| M7 |
der(2)t(2;8)(q14.2;q13) | 100 |
| M8 |
der(3)t(3;?)(q25;?)inv(3)(p21q25) | 100 |
| M9 | del(3)(p14) | 100 |
| M10 | der(3) ?
(x2) | 100 |
| M11 |
der(14)t(4;14)(q13.2;p11) | 100 |
| M12 | del(4)(q12) | 100 |
| M13 |
inv(5)(p15q13)del(5)(q13) | 100 |
| M14 | del(5)(q15) | 100 |
| M15 |
der(15)t(5;15)(p13;p12)del(15)(q13) | 100 |
| M16 | der(?)t(5;?)(q15;?)
(x2) | 100 |
| M17 |
del(6)(q25.1)del(6)(p21.1)inv(6)(q25.1q11) | 100 |
| M18 |
der(7)t(7;16)(p22;p11) inv(7)(q11p22)
inv(7)(q11q32) | 100 |
| M19 | inv(7)(p22q21) | 100 |
| M20 |
del(7)(p15)del(7)(q11.2) | 100 |
| M21 |
dup(8)(q21qter) | 57 |
| M22 | del(8)(q11q22) | 100 |
| M23 |
der(19)t(9;?;19)(q13;?;q11 o p11) | 100 |
| M24 | inv(10)(q21.2q23.2)
(x2) | 100 |
| M25 | inv(11)(p11.2q13.3)
(x2) | 100 |
| M26 |
inv(13)(p12q21.2)inv(13)(q12q21.2) | 100 |
| M27 |
inv(13)(p12q21.2)inv(13)(q12q21.2)del(13)(q14) | 100 |
| M28 |
del(15)(q24)inv(15)(q11.2q24)
(x2) | 100 |
| M29 | del(15)(q15) | 100 |
| M30 |
der(16)t(X;16)(?;p13) | 100 |
| M31 |
der(?)t(?;17)(?;q21) | 30 |
| M32 | i(17p) | 30 |
| M33 |
der(20)t(20;21)(p13.1;q11)
inv(20)(p13.1q13.1)inv(21)(q11q22.3) (x2) | 100 |
| M34 | inv(18)(p11.3q21.3)
inv(18)(q11.2q21.3) (x2) | 100 |
| M35 |
der(7)t(7;22)(q11;q11)del(7)(p15) | 100 |
| M36 |
der(?)t(6;22;?)(q15;q11.2;?)
del(6)(q25.1) | 100 |
| M37 | del(16)(q21) | 100 |
| M38 | del(2)(q21) | 100 |
| M39 |
del(6)(p22.2)del(6)(q13) | 100 |
| M40 | del(6)(q13) | 100 |
| M41 |
del(7)(p15)del(7)(q11) | 100 |
| M42 | der(X) | 100 |
| M43 |
der(X)t(X;12)(q27;q12) | 40 |
| M44 | t(M31;?) | 70 |
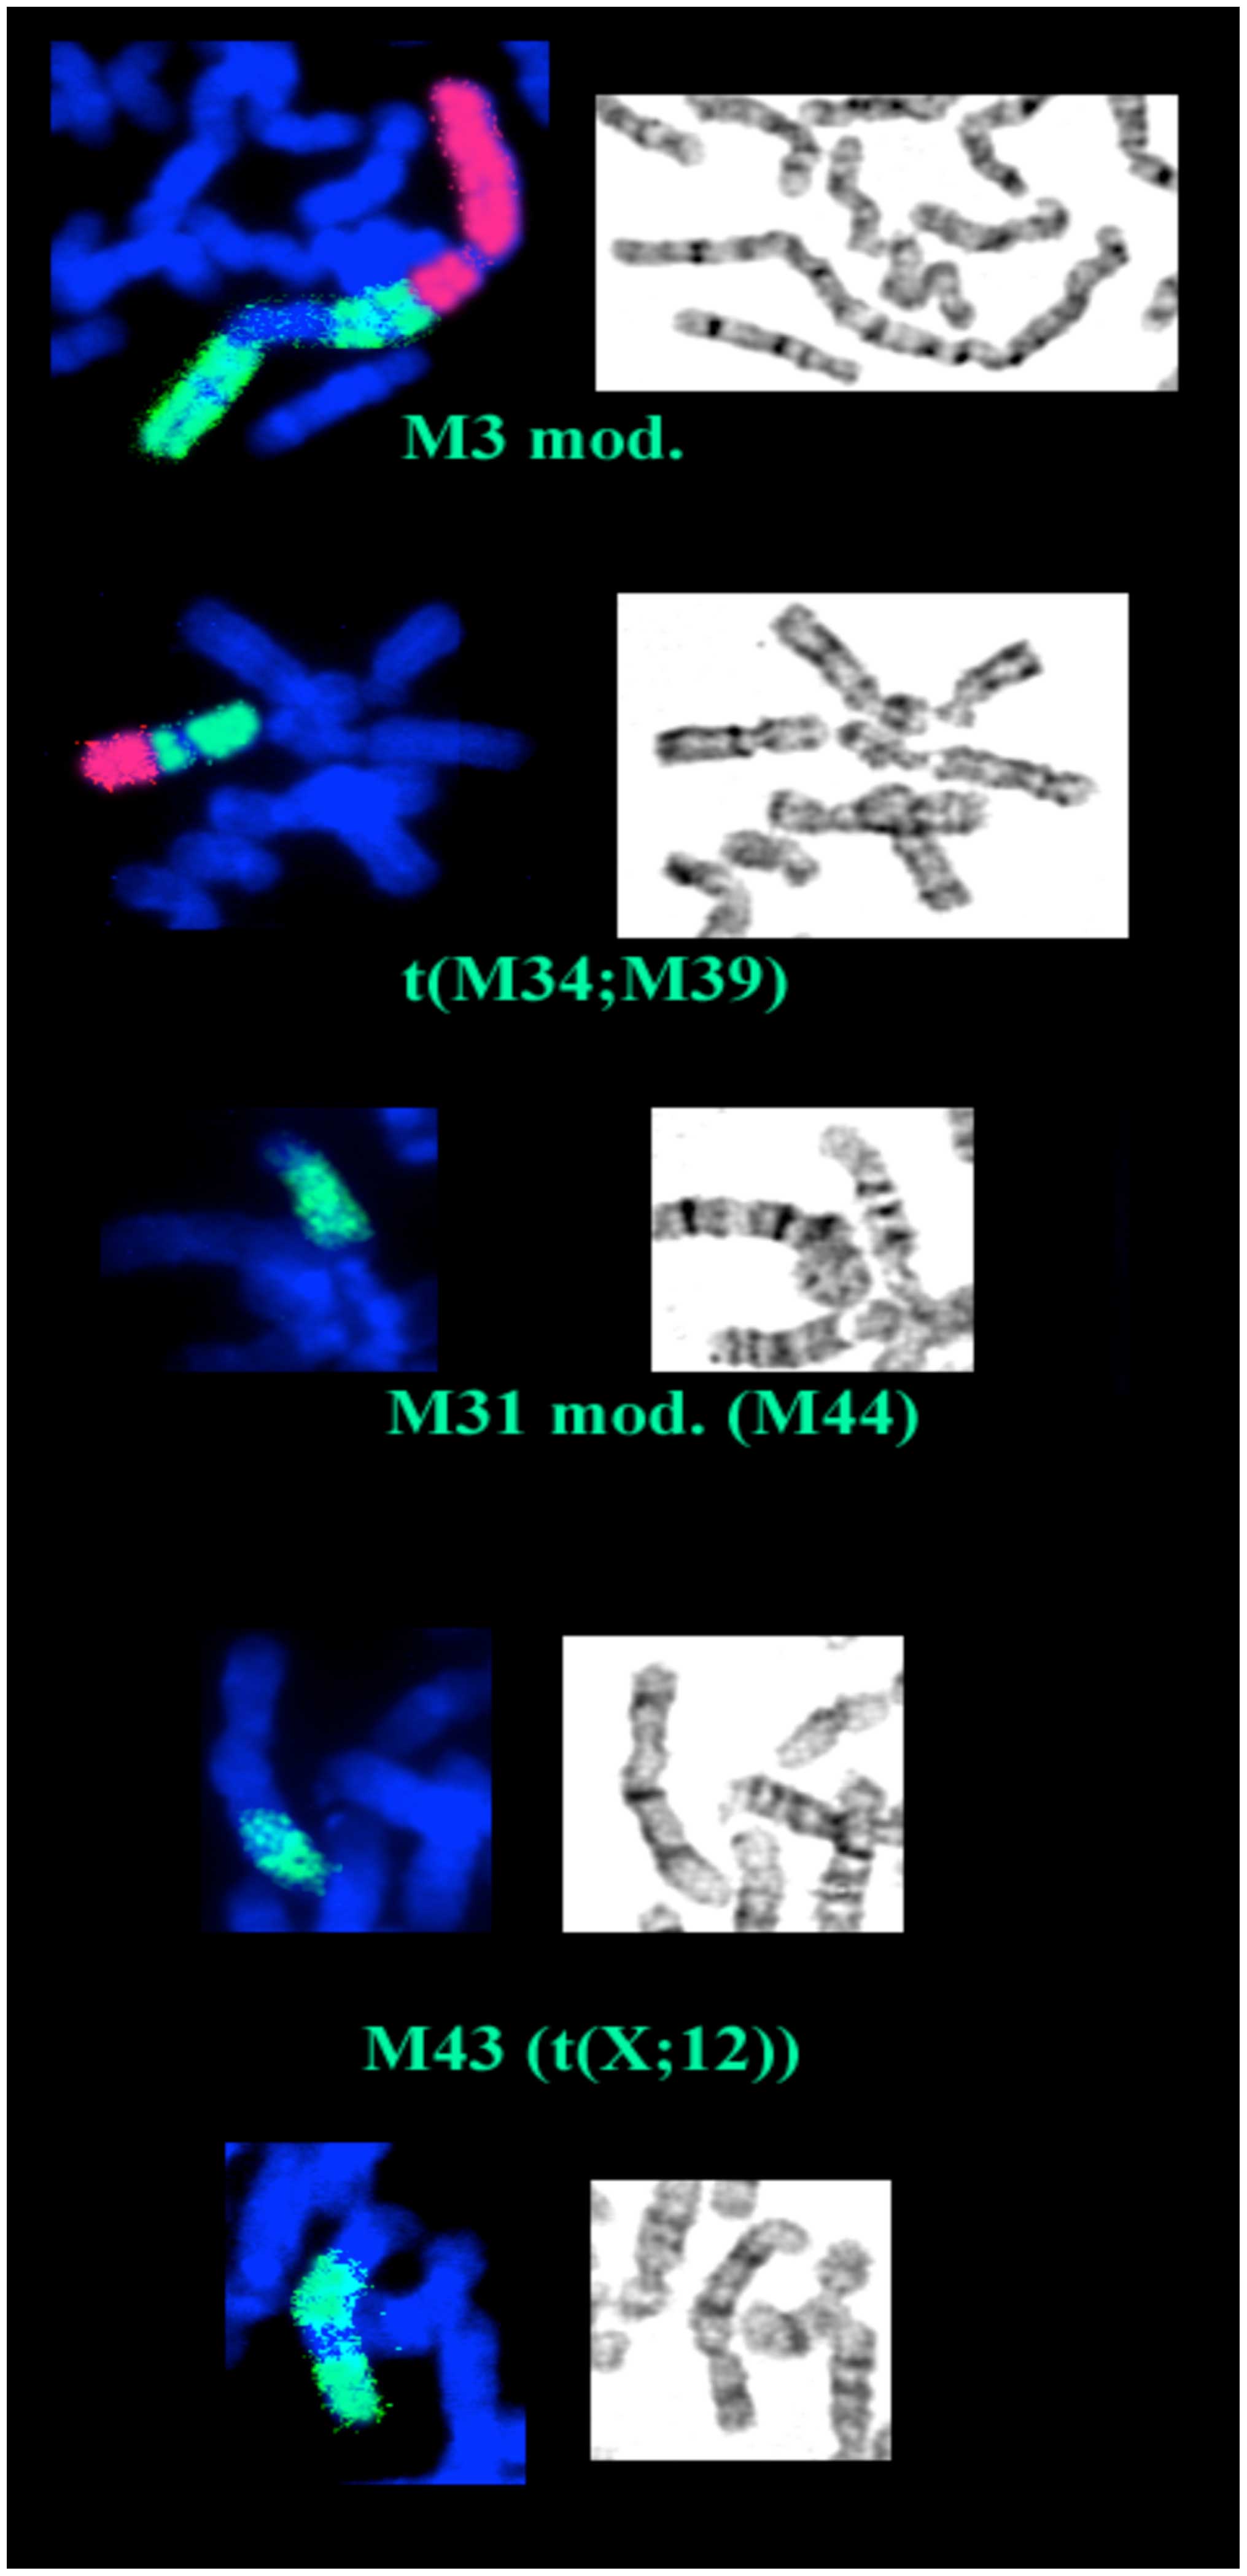
Studying the cells at the 38th passage provided some
interesting evolutionary changes in the complex karyotype regarding
both the structure and frequency of previous identified markers, as
shown in Table III: namely,
markers M3, one copy of M34 and M39 have undergone further
rearrangements, M43 and M44 (a rearrangement of M31) have modified
their frequency (increasing up to 100%), while M31, M32 and M41 are
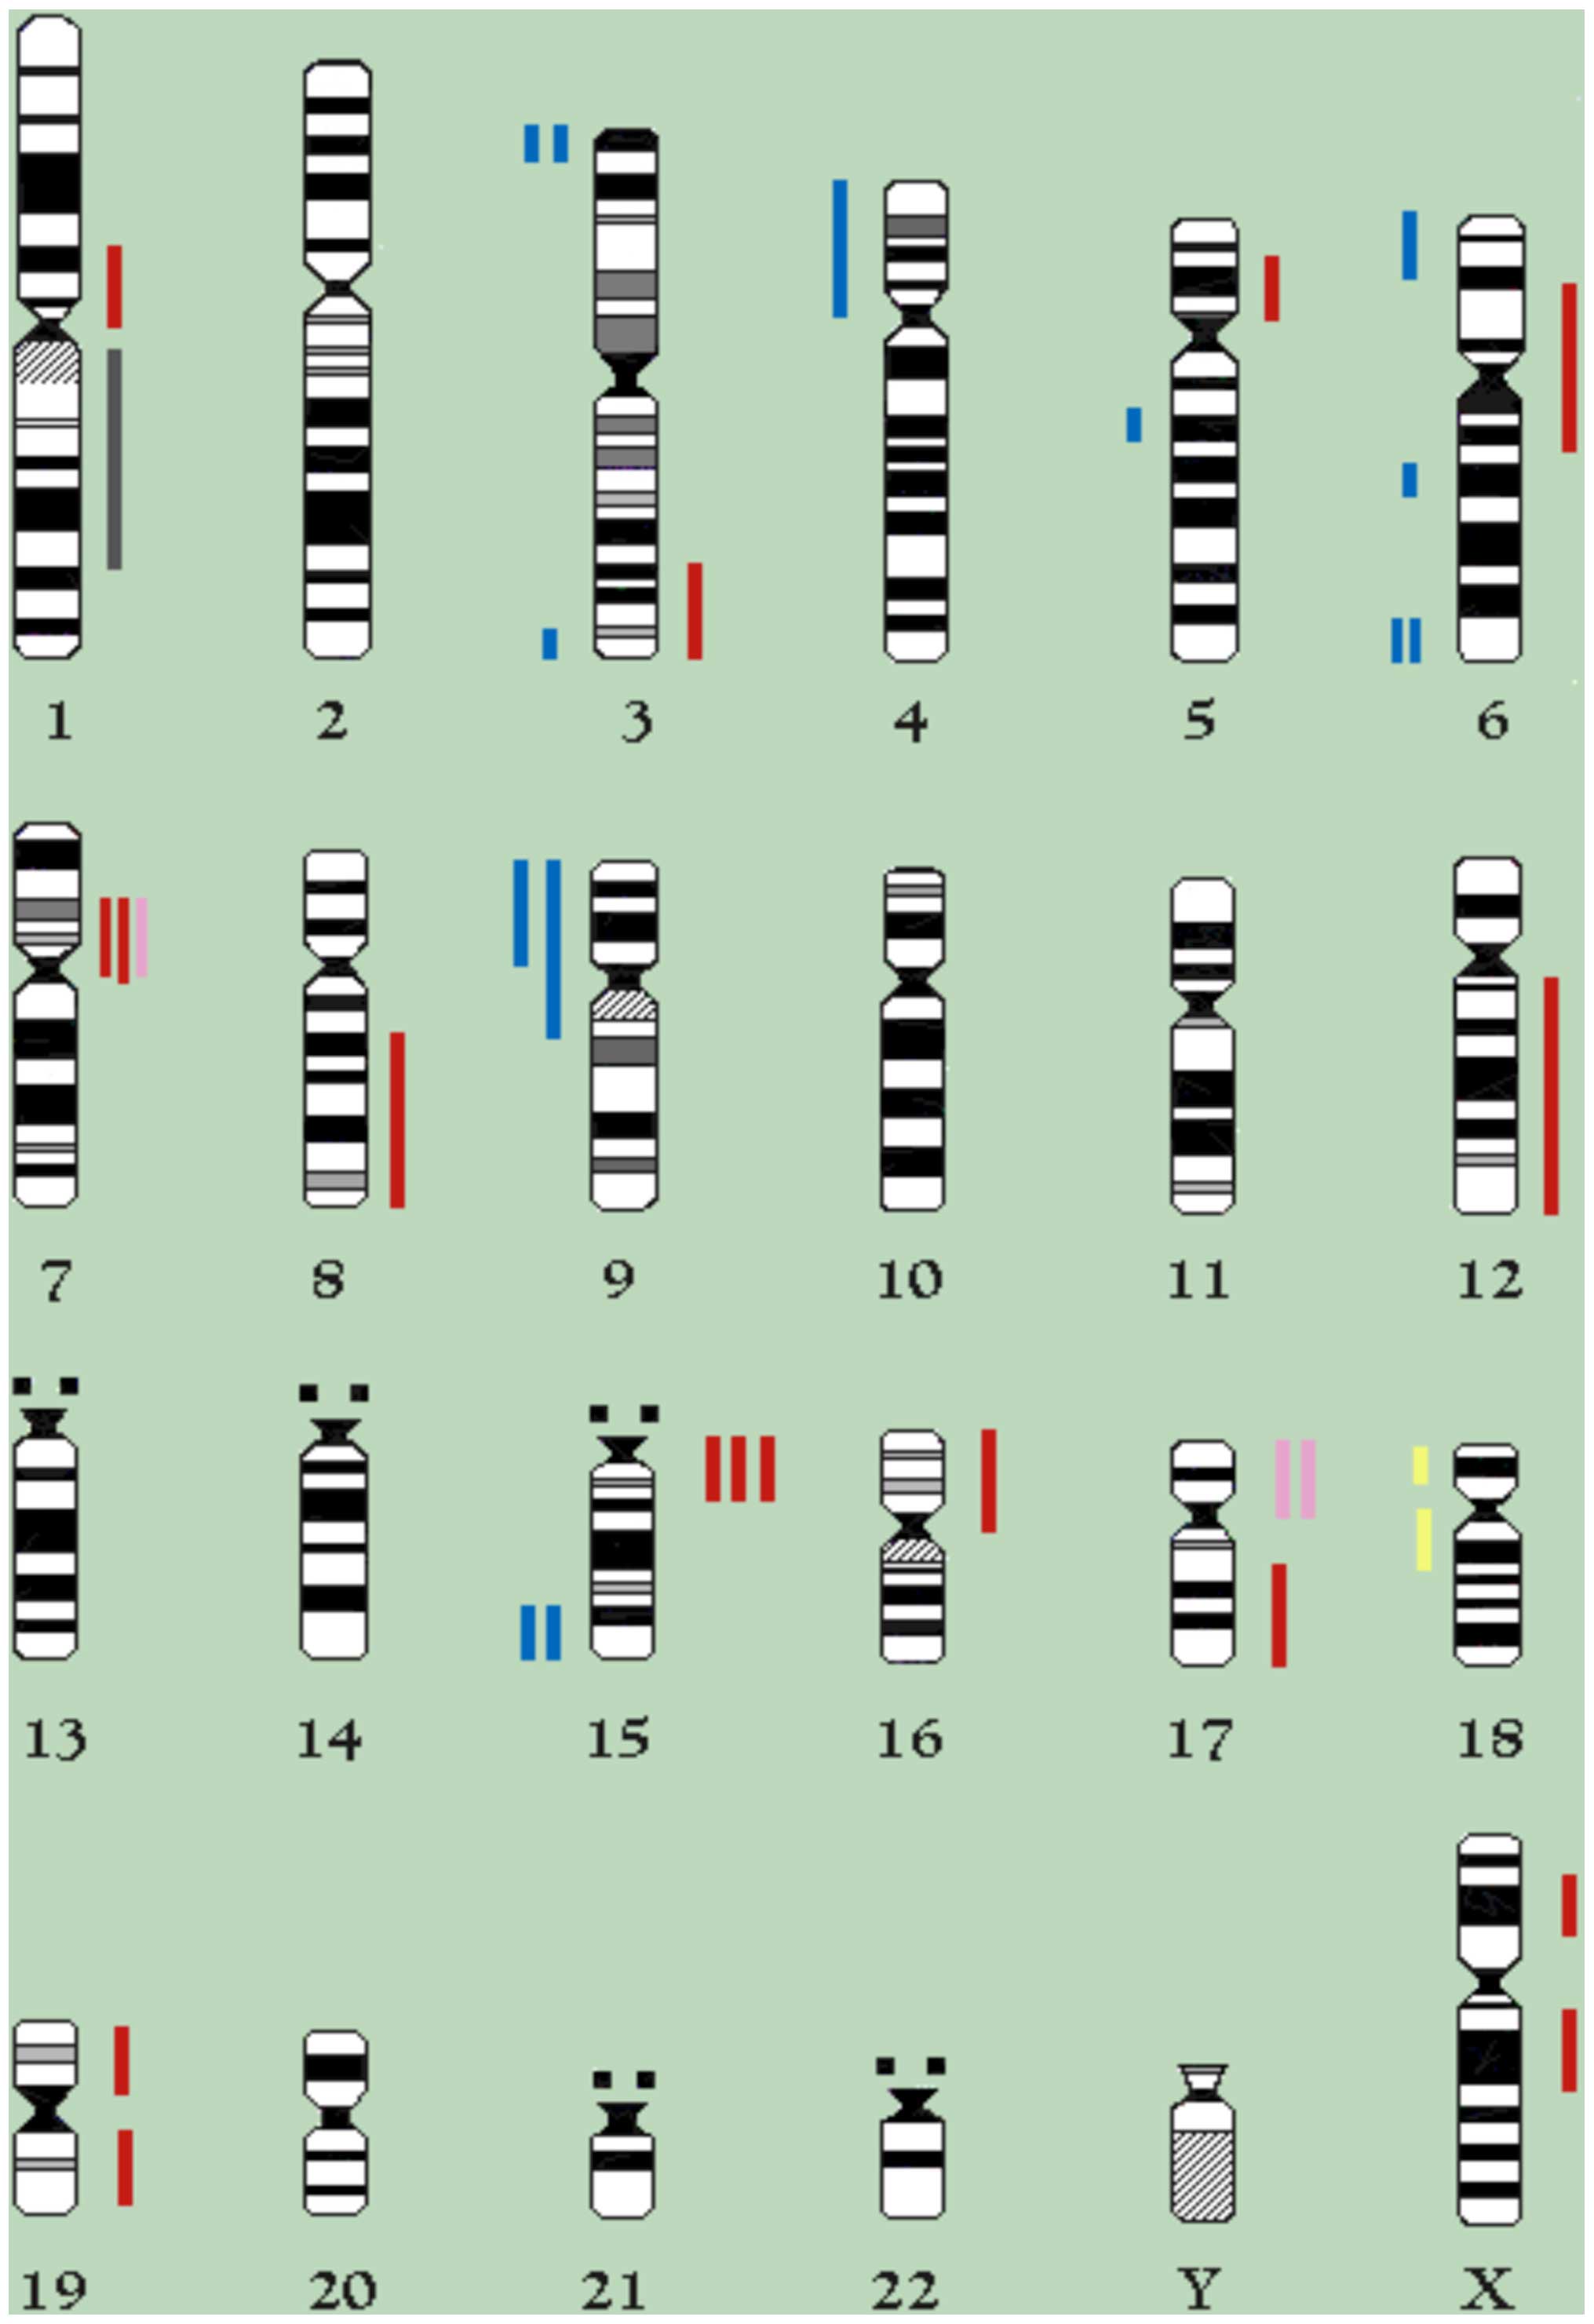
definitely lost, leading to a modal number of 55 (Fig. 2). The chromosomal regions lost or
gained in 18th and 38th passages are depicted in Fig. 3.
| Table IIICytogenetic changes between the 18th
and 38th passage in the CABA I cell line. |
Table III
Cytogenetic changes between the 18th
and 38th passage in the CABA I cell line.
| Marker | Description of
marker | Frequency at
|
|---|
| 18th passage | 38th passage |
|---|
| Modal no. | – | 57 | 55 |
| M3 |
der(4)t(1;4)(q12;p12)inv(4)(p12q21) | 100% | 5% |
| M3 mod |
invdup(1)(q12q32)der(4)t(1;4)(q12;p12)inv(4)(p12q21) | 0% | 95% |
| M21 |
dup(8)(q21qter) | 57% | 40% |
| 8 | normal | 43% | 60% |
| M31 |
der(?)t(?;17)(?;q21) | 30% | 0% |
| M31 mod. (M44) |
der(?)t(?;17;?)(?;q21;?) | 70% | 100% |
| M32 | i(17p) | 30% | 0% |
| M34 (1 copy) | inv(18)(p11.3q21.3)
inv(18)(q11.2q21.3) | 100% | 0% |
| M34 mod. |
der(M39)t(M34;M39) | 0% | 100% |
| M39 | del(6)(p22.2)del(6)
(q13) | 100% | 0% |
| M41 |
del(7)(p15)del(7)(q11) | 100% | 0% |
| M43 |
der(X)t(X;12)(q27;q12) | 40% | 100% |
STR profiles
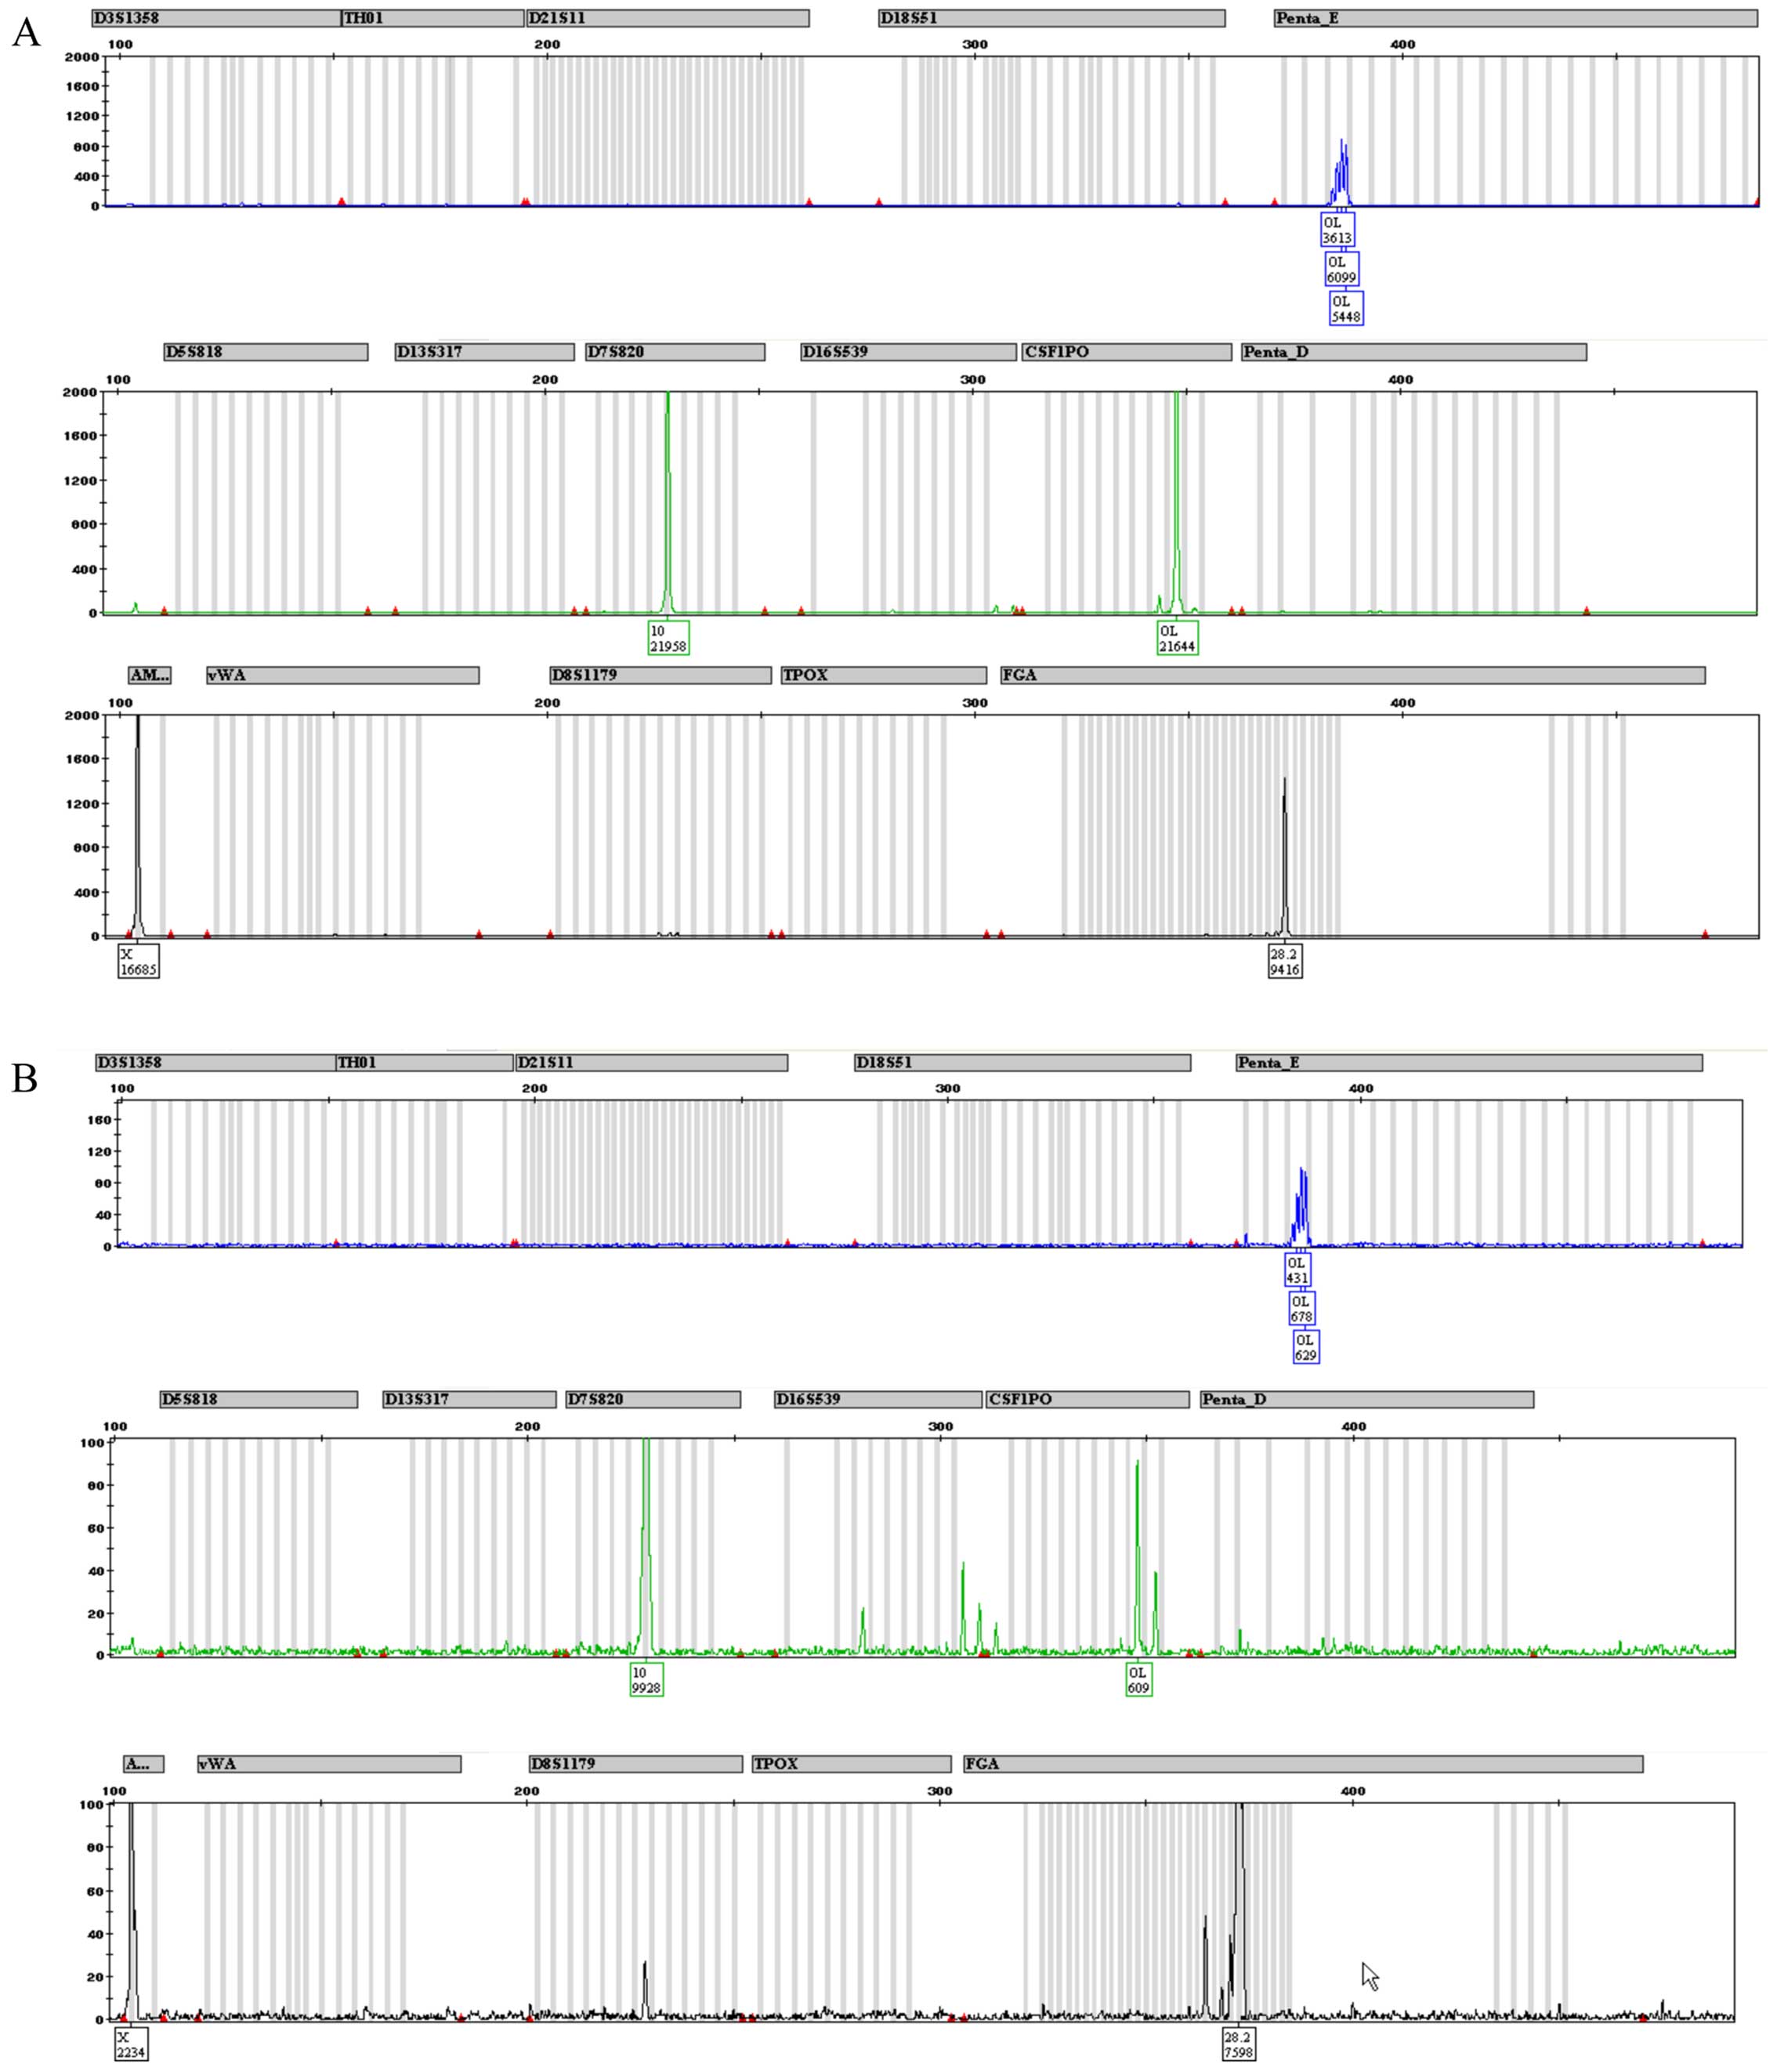
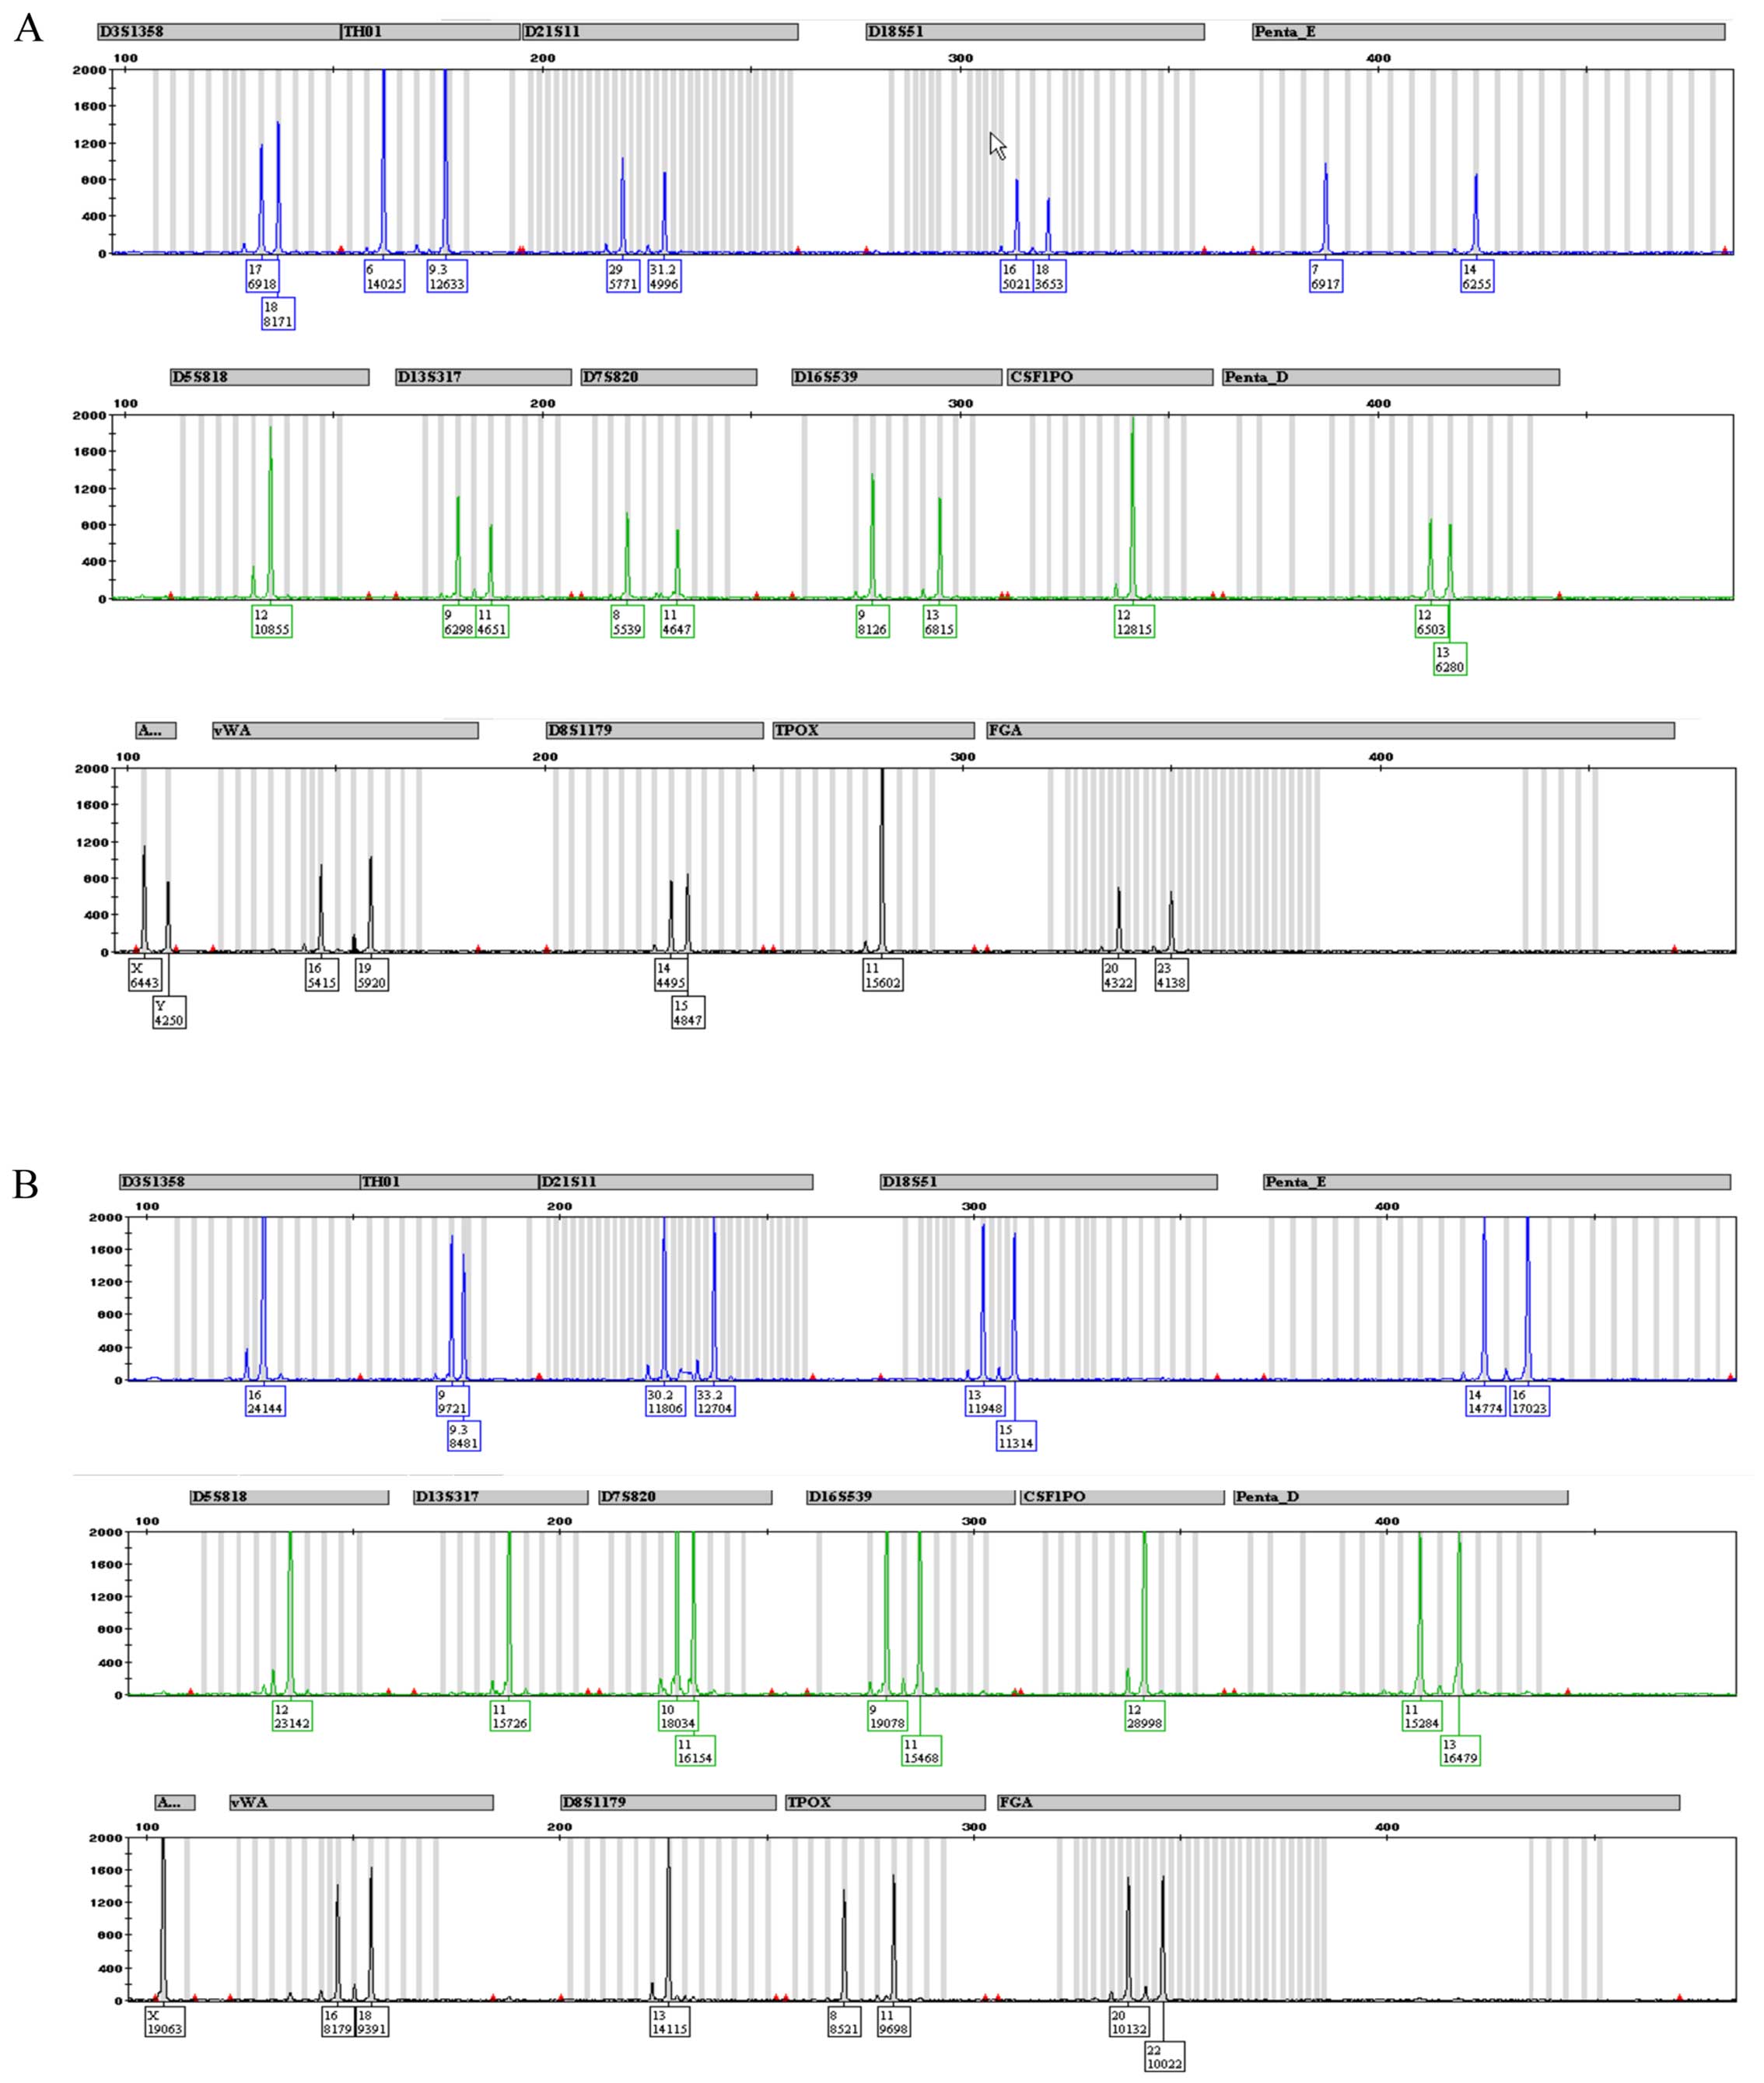
Fig. 4 depicts the
complete STR profile for CABA I cells at 18th (Fig. 4A) and 38th (Fig. 4B) passages. Fig. 5 depicts a typical human male and
female STR profile (Fig. 5A and
B, respectively), including all the peaks the kit was able to
identify. A comparison of Figs. 4
and 5 highlights the fact that
only 3 alleles are properly detected in both CABA I samples.
Amelogenin marker is present, confirming that CABA I are cells from
a female, as well as D7–10 and FGA-28.2 STR alleles. The kit also
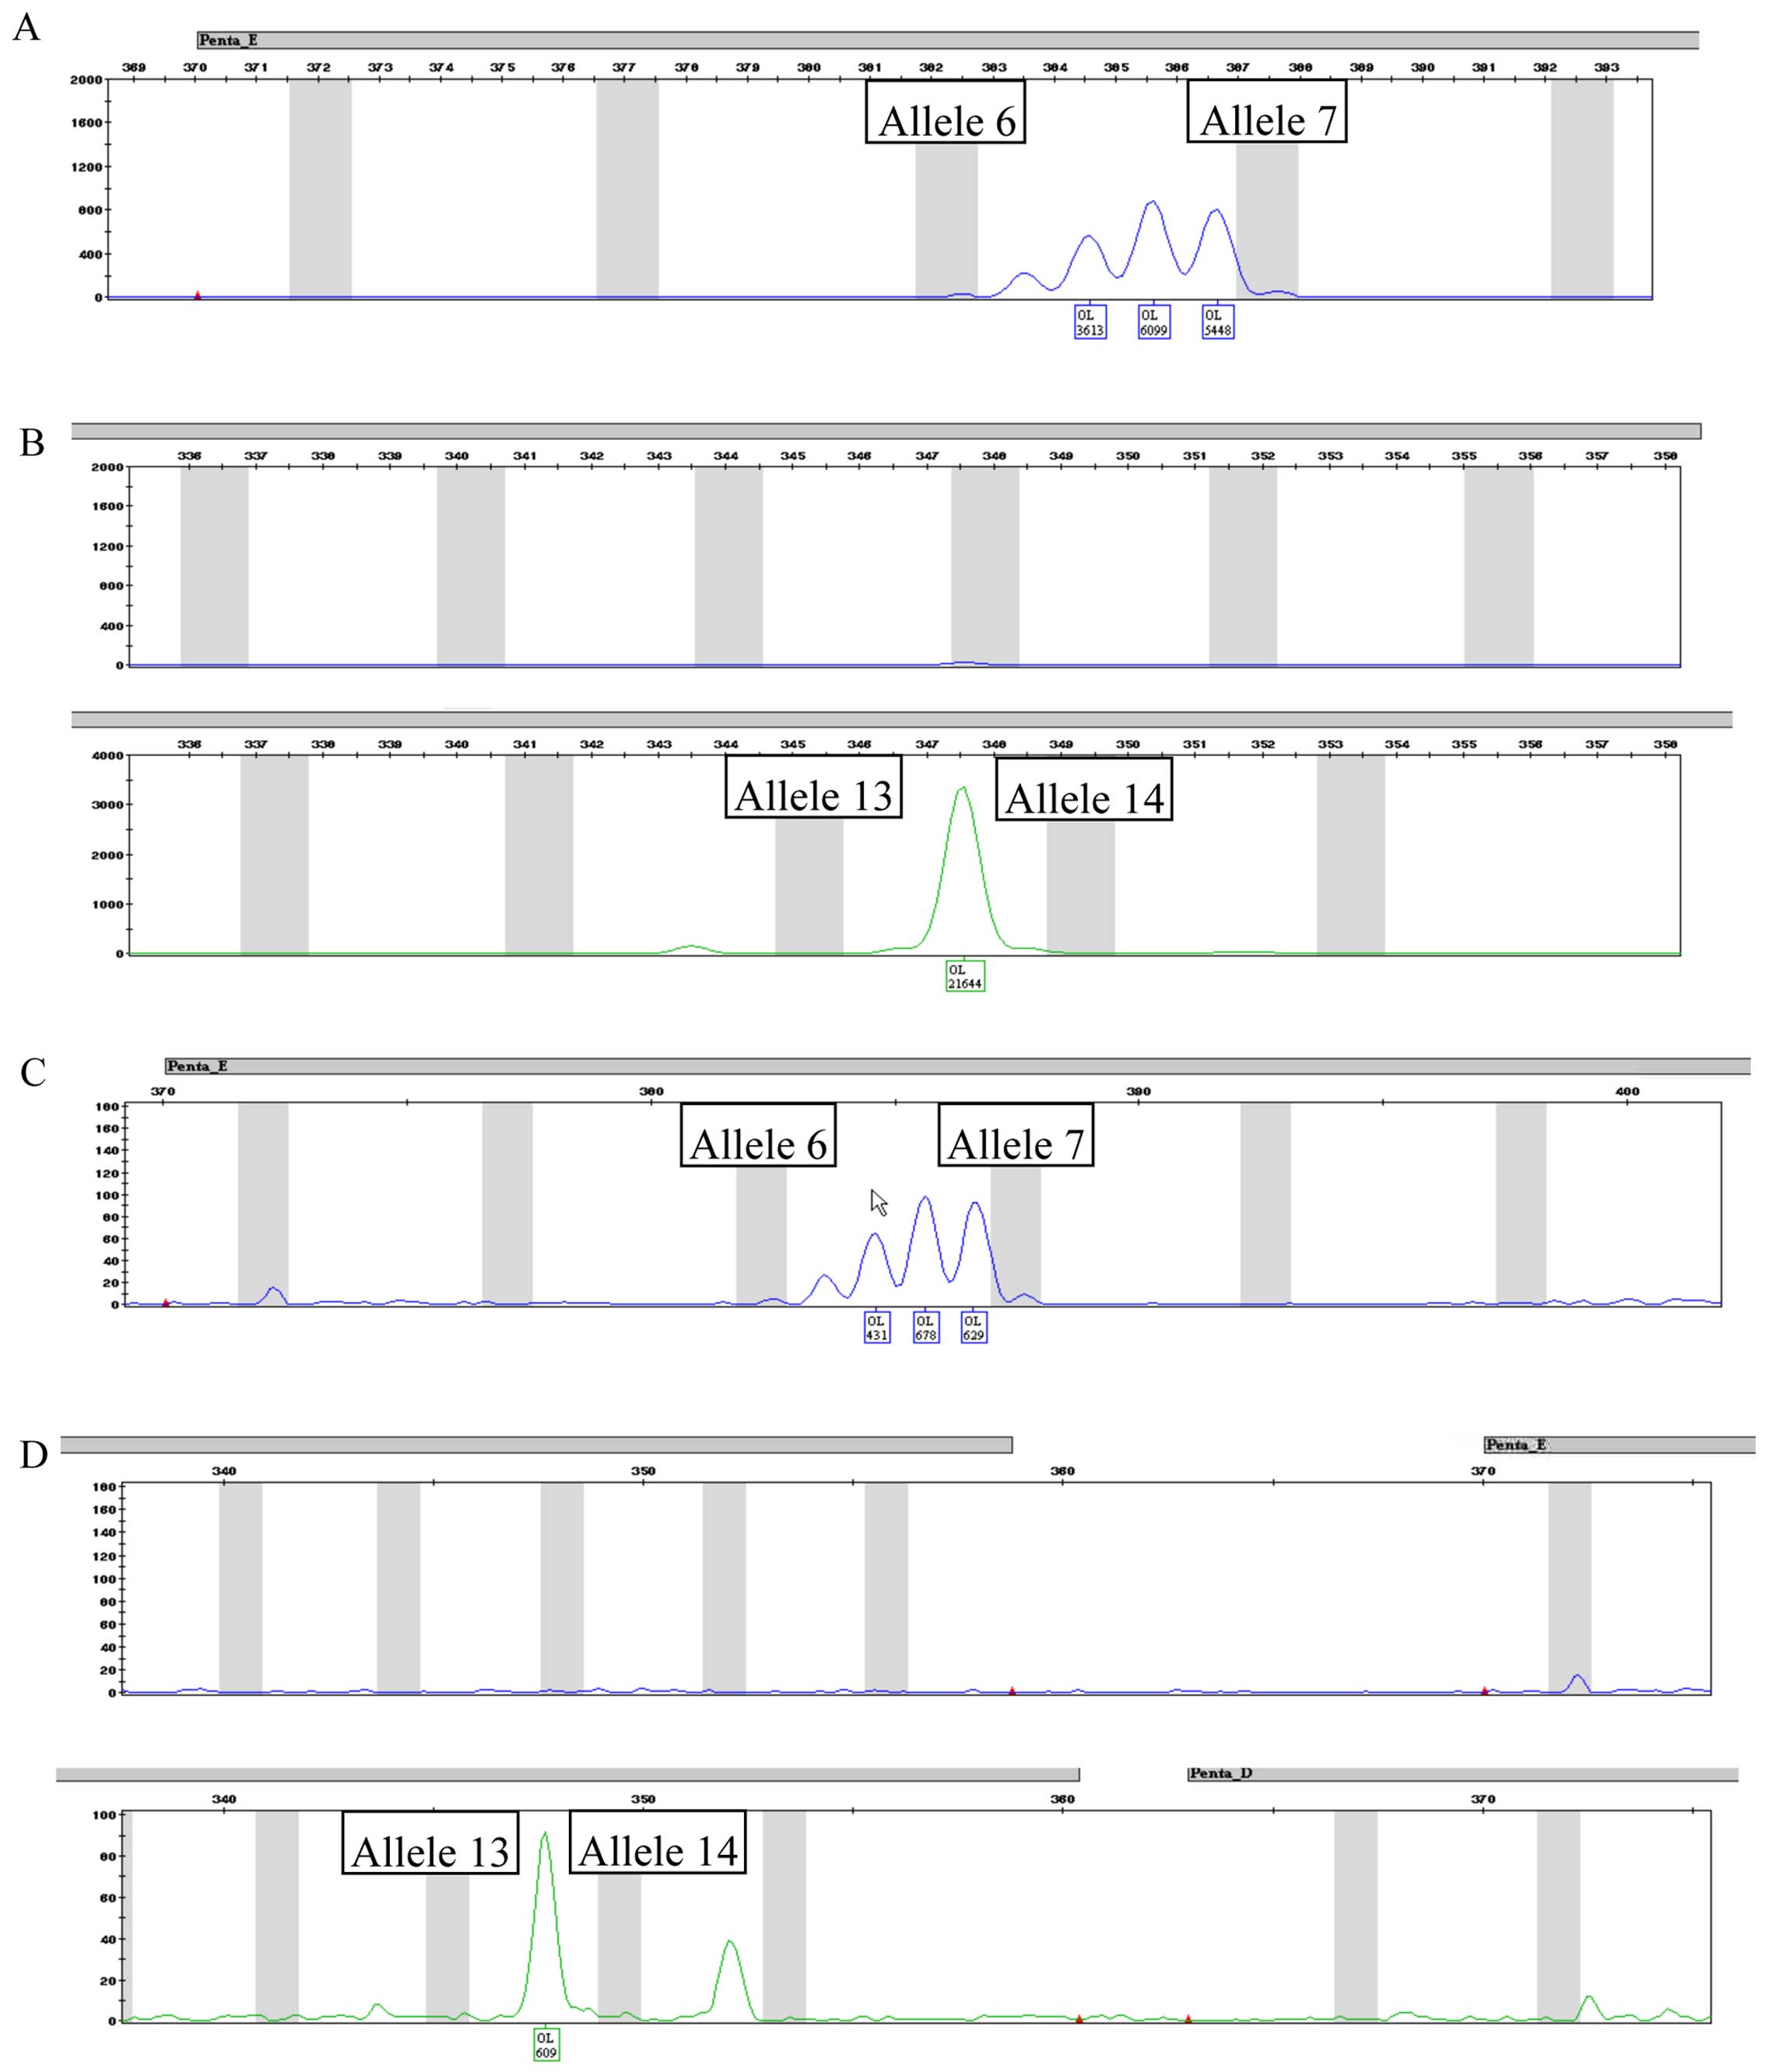
identified alleles belonging to PENTA E and CS1PO loci; even though
they were not placed exactly in the used allelic ladder (and thus
were not tagged by software as off ladder) they maintained a steady
position (detailed in Fig. 6). A
summary of the obtained results is reported in Table IV.
| Table IVSTR changes between the18th and 38th
passages in the CABA I cell line. |
Table IV
STR changes between the18th and 38th
passages in the CABA I cell line.
| PowerPlex 16
HS | 18th passage | 38th passage |
|---|
| D3 | 16 | – |
| Penta E | OL (between alleles
6 and 7) | OL (between alleles
6 and 7) |
| CS1PO | OL (between alleles
13 and 14) | OL (between alleles
13 and 14) |
| Amelogenin | X | X |
| D7 | 10 | 10 |
| FGA | 28.2 | 28.2 |
Discussion
The use of cell lines is a pivotal tool in
biological research; to prevent drawbacks such as invalidated
results and wasting years of work, it is fundamental to avoid the
use of misidentified or cross-contaminated cell lines (24,25). The identification of cell lines
has been performed, over the years, using several strategies,
ranging from isoenzyme analysis (it is possible to identify cell
lines by analyzing isoenzyme electrophoresis profiles and comparing
migration patterns with specific and known controls) (26,27), immunophenotypic and
immunocytochemical analysis (identification of certain markers
could help in the characterization of the histological origin of
cell lines) (28,29), human leukocyte antigen (HLA)
typing (27), cytogenetic
analysis (30) to DNA
fingerprinting (cells are identified by their specific DNA profile)
(31,32).
DNA profiling techniques take advantage of specific
genetic differences between individuals in DNA variable loci
(32) and are based on DNA
amplification by PCR; these techniques take into account both
directed amplification of minisatellite-region DNA (DAMD) and the
variable number of tandem repeats (VNTR), which are highly specific
to each individual (33). The
high level of progress of technology in this field led, eventually,
to the development of STR analysis (19,25).
STRs, also known as SSRs (simple sequence repeats)
or microsatellites, are short sequences of non-coding DNA of 2–7
base pairs, which are repeated as di-, tri- or tetra-nucleotide
tracts (34); they account for
approximately 3% of total DNA and are thought to play a role in the
chromosome structure. They are used as molecular markers of
specific loci of the genome; indeed, the microsatellites are
located on different chromosomes and are highly polymorphic, can be
easily amplified by PCR, and their analysis allows us to define a
DNA profile with which we can typify an individual (as it is
specific for each individual) (35). This is possible since
microsatellite loci differ in each person in terms of the number of
repetitions in sequence homologues between individuals.
If compared to other DNA techniques, such as VNTR,
they are characterized by higher sensitivity and, being highly
polymorphic, they have great powers of discrimination (32). STR analysis is easily multiplexed,
and thus several loci can be analyzed at the same time; over the
years, several combinations of STR have been analyzed and the
number of loci examined has gradually increased (32); usually, the gender
identification-marker Amelogenin is also added to other specific
STR to assess whether the sample originated in a male or female
(25). Considering such STR
features, it is not surprising that they have become essential in
several fields ranging from the characterization of disease genes,
population genetics studies, human identification and paternity
testing (35). Even in research,
the STR profiling of cells is highly recommended, most of all for
cell identification (25);
indeed, STR profiling has quickly become the international
reference standard to identify cell lines and is currently the most
widely used method (19–22,36).
However, that said, it is interesting to point out
that, in the same cell lines, continuous passage in the culture
causes a genetic drift and, particularly in cancer cells, genetic
alterations (such as loss of heterozygosis, allelic deletions or
instability) induce changes in STR profiles (21,37,38); alterations of DNA fingerprinting
profiles have been already reported for some established
hematopoietic cancer cell lines, during long-term culture;
alterations were so drastic that DNA fingerprinting profiles of
cultured cell lines and parental cells also differed considerably
(23).
In the present study, we reported on the genetic
characterization of the CABA I cell line, an ovarian cancer cell
line of epithelial origin which was established in the 1997 from
ascitic fluid obtained from a patient with papillary adenocarcinoma
of the ovaries prior to drug treatment (10). Just after isolation, CABA I cells
(at the 18th passage) were first roughly analyzed by means of
classical cytogenetic techniques (GTG-banding) alone (10). Subsequently, in the present study,
a more in-depth genetic characterization was performed, involving
studying the STR profile and molecular cytogenetic data from the
18th passage. Moreover, in order to verify the in vitro long
term culture effects on the genetic features of the CABA I cell
line, these examinations were repeated on cells at the 38th
passage. It was not possible to recover the donor's original
tissue, and initial passage stocks of CABA I cells are no longer
available for comparison, and thus we compared 38th with an 18th
passage, which is the most precocious we have. This passage is the
same as that used for original analyses, which were undertaken as
soon as the cell line was established years ago (10).
In the present study, STR profiles were analyzed by
means of the PowerPlex 16 HS kit. The amplification PCR kit
PowerPlex 16 HS is a multiplex STR test that co-amplifies in a
single PCR all the 13 loci (D18S51, D21S11, TH01, D3S1358, FGA,
TPOX, D8S1179, vWA, CSF1PO, D16S539, D7S820, D13S317 and D5S818)
required from the Combined DNA Index System (CODIS) for individual
identification in the USA (39),
the gender-specific marker Amelogenin, and two additional
low-stutter and highly discriminating pentanucleotide STR loci,
Penta E and Penta D. It is evident from the comparison with a
normal STR profile (as shown in Fig.
5) that the CABA I cell line STR profile is not complete,
showing only the loci D7, FGA and Amelogenin (this latter
confirming that it is female DNA). One possible explanation is that
the primers find only three unchanged attack sites (allowing for
amplification of only the three corresponding loci) while other
primers no longer recognize the complementary sequences due to the
DNA changes, as highlighted by our cytogenetic analysis.
Even if the CABA I cell line exhibits an anomalous
STR profile that does not fully adjust the criteria currently used
for the identification of human cells, nevertheless chromosome
analysis confirmed the human origin of this cell line since we
noted the presence of certain normal chromosome, such as 8, 12, 14,
19 and X.
The obtained data suggest that the particular
karyotypic complexity of the CABA I cell line, as shown by the
results from chromosomal analysis at the 18th passage, are due to
development following a progression scheme akin to that described
in a case of primary ovarian cancer (40): i) genomic instability with the
onset of few chromosomal structural aberrations; ii)
polyploidization; and iii) massive structural changes and loss of
individual chromosomes. According to this scheme, markers M6, M10,
M16, M24, M25, M33 and M34 (present in duplicate) as well as
nullisomy on 6q25-27 are likely to have arisen early in tumor
progression.
The comparative cytogenetic analysis of the two
different passages in CABA I cell line undertaken in the present
study has demonstrated some features of evolutive behavior in
neoplastic cells, corroborating our hypothesis on the developmental
outline in neoplastic cells, which is essentially similar in the
cell line and primary tumors. In fact, the occurrence of
non-reciprocal translocations between some markers (M3, M31, M34
and M39) increases the complexity of this karyo-type, and appears
to be a way of reducing 'step-by-step' the number of double markers
and the total number of chromosomes, and masks the initial 'phase'
of polyploidization.
In addition, the cytogenetic balance of the 18th as
well as the 38th passage outlines that certain regions, as
previously reported (41), are
preferentially lost (i.e., 6qter), whereas others, such as 12q, are
over-represented. In particular, the over-representation of 12q,
previously described as an ovarian cancer marker, in CABA I
demonstrates a progressive achievement (M43), thus representing a
secondary change in the evolution of this type of tumor.
Previous imbalance of 15q11-15 and 7p11-13 regions
also seems to be confirmed, while 17p gains are sensibly reduced to
a loss of M32.
Finally, even if CABA I exhibited a noteworthy
chromosomal instability, we have observed after 20 passages a
substantially consistent pool of cytogenetic aberrations,
demonstrating that recognized chromosomal aberrations are quite
stable and probably present in vivo, too.
All these findings suggest that cytogenetic studies
on cell lines are as reliable as those on primary tumors and, thus,
represent a useful means of identifying the chromosome regions
potentially responsible for tumor progression and evolution.
In conclusion, our data suggest that CABA I exhibits
in vitro cellular behavior which overlaps with that observed
in primary tumors where genome instability promotes the onset of
chromosomal rearrangements that, conferring a proliferative
advantage, characterize certain developmental stages and
progression of the tumor itself. Such features make the CABA I cell
line a suitable candidate to analyze, in vitro, the genetic
evolution of ovarian cancer cells in vivo.
In addition, it is possible that karyotypic
complexity resulting from many in vivo accumulated
aberrations also significantly altered the STR pattern, so that of
the 16 loci generally used in human STR profiles only 3 were
properly detectable in CABA I cells; nonetheless, this molecular
situation remains stable within 20 passages and represents another
characteristic of the CABA cell line which is useful for checking
its identity. A possible explanation for the anomalous STR profile,
if compared to normal cells, can be found in the failure of
remaining STR loci to amplify; the latter may be due to mutations
and karyotypic rearrangements accumulated during in vitro
culture, which implies that primers can no longer properly
hybridize, not allowing, consequently, the amplification of
corresponding fragments.
Moreover, it is evident that, even if it is widely
used to identify and characterize cell lines, the STR profile alone
is not sufficient as a marker for particular cell lines.
References
|
1
|
Chan JK, Cheung MK, Husain A, Teng NN,
West D, Whittemore AS, Berek JS and Osann K: Patterns and progress
in ovarian cancer over 14 years. Obstet Gynecol. 108:521–528. 2006.
View Article : Google Scholar : PubMed/NCBI
|
|
2
|
Lutz AM, Willmann JK, Drescher CW, Ray P,
Cochran FV, Urban N and Gambhir SS: Early diagnosis of ovarian
carcinoma: is a solution in sight? Radiology. 259:329–345. 2011.
View Article : Google Scholar : PubMed/NCBI
|
|
3
|
Goff BA, Mandel LS, Drescher CW, Urban N,
Gough S, Schurman KM, Patras J, Mahony BS and Andersen MR:
Development of an ovarian cancer symptom index: possibilities for
earlier detection. Cancer. 109:221–227. 2007. View Article : Google Scholar
|
|
4
|
Ozols R, Rubin S, Thomas G and Robboy S:
Epithelial ovarian cancer. Hoskins W, Perez CA, Young RC, Barakat
RR, Markman M and Randall ME: Principles and Practice of
Gynecologic Oncology. 4th edition. Lippincott Williams &
Wilkins; Philadelphia: pp. 895–987. 2005
|
|
5
|
Hamilton TC, Young RC, McKoy WM,
Grotzinger KR, Green JA, Chu EW, Whang-Peng J, Rogan AM, Green WR
and Ozols RF: Characterization of a human ovarian carcinoma cell
line (NIH:OVCAR-3) with androgen and estrogen receptors. Cancer
Res. 43:5379–5389. 1983.PubMed/NCBI
|
|
6
|
Fogh J, Wright WC and Loveless JD: Absence
of HeLa cell contamination in 169 cell lines derived from human
tumors. J Natl Cancer Inst. 58:209–214. 1977.PubMed/NCBI
|
|
7
|
Hamilton TC, Young RC and Ozols RF:
Experimental model systems of ovarian cancer: applications to the
design and evaluation of new treatment approaches. Semin Oncol.
11:285–298. 1984.PubMed/NCBI
|
|
8
|
Bénard J, Da Silva J, De Blois MC, Boyer
P, Duvillard P, Chiric E and Riou G: Characterization of a human
ovarian adenocarcinoma line, IGROV1, in tissue culture and in nude
mice. Cancer Res. 45:4970–4979. 1985.PubMed/NCBI
|
|
9
|
Wilson AP: Characterization of a cell line
derived from the ascites of a patient with papillary serous
cystadenocarcinoma of the ovary. J Natl Cancer Inst. 72:513–521.
1984.PubMed/NCBI
|
|
10
|
Dolo V, Ginestra A, Violini S, Miotti S,
Festuccia C, Miceli D, Migliavacca M, Rinaudo C, Romano FM,
Brisdelli F, et al: Ultrastructural and phenotypic characterization
of CABA I, a new human ovarian cancer cell line. Oncol Res.
9:129–138. 1997.PubMed/NCBI
|
|
11
|
Dolo V, D'Ascenzo S, Violini S, Pompucci
L, Festuccia C, Ginestra A, Vittorelli ML, Canevari S and Pavan A:
Matrix-degrading proteinases are shed in membrane vesicles by
ovarian cancer cells in vivo and in vitro. Clin Exp Metastasis.
17:131–140. 1999. View Article : Google Scholar : PubMed/NCBI
|
|
12
|
Ferretti A, D'Ascenzo S, Knijn A, Iorio E,
Dolo V, Pavan A and Podo F: Detection of polyol accumulation in a
new ovarian carcinoma cell line, CABA I: A(1)H NMR study. Br J
Cancer. 86:1180–1187. 2002. View Article : Google Scholar : PubMed/NCBI
|
|
13
|
Violini S, D'Ascenzo S, Bagnoli M,
Millimaggi D, Miotti S, Canevari S, Pavan A and Dolo V: Induction
of a multifactorial resistance phenotype by high paclitaxel
selective pressure in a human ovarian carcinoma cell line. J Exp
Clin Cancer Res. 23:83–91. 2004.PubMed/NCBI
|
|
14
|
Dolo V, D'Ascenzo S, Giusti I, Millimaggi
D, Taraboletti G and Pavan A: Shedding of membrane vesicles by
tumor and endothelial cells. Ital J Anat Embryol. 110(Suppl 1):
127–133. 2005.PubMed/NCBI
|
|
15
|
Prinetti A, Millimaggi D, D'Ascenzo S,
Clarkson M, Bettiga A, Chigorno V, Sonnino S, Pavan A and Dolo V:
Lack of ceramide generation and altered sphingolipid composition
are associated with drug resistance in human ovarian carcinoma
cells. Biochem J. 395:311–318. 2006. View Article : Google Scholar :
|
|
16
|
Taraboletti G, D'Ascenzo S, Giusti I,
Marchetti D, Borsotti P, Millimaggi D, Giavazzi R, Pavan A and Dolo
V: Bioavailability of VEGF in tumor-shed vesicles depends on
vesicle burst induced by acidic pH. Neoplasia. 8:96–103. 2006.
View Article : Google Scholar : PubMed/NCBI
|
|
17
|
Millimaggi D, Mari M, D' Ascenzo S, Giusti
I, Pavan A and Dolo V: Vasculogenic mimicry of human ovarian cancer
cells: role of CD147. Int J Oncol. 35:1423–1428. 2009.PubMed/NCBI
|
|
18
|
Giusti I, D'Ascenzo S, Millimaggi D,
Taraboletti G, Carta G, Franceschini N, Pavan A and Dolo V:
Cathepsin B mediates the pH-dependent proinvasive activity of
tumor-shed microvesicles. Neoplasia. 10:481–488. 2008. View Article : Google Scholar : PubMed/NCBI
|
|
19
|
Masters JR, Thomson JA, Daly-Burns B, Reid
YA, Dirks WG, Packer P, Toji LH, Ohno T, Tanabe H, Arlett CF, et
al: Short tandem repeat profiling provides an international
reference standard for human cell lines. Proc Natl Acad Sci USA.
98:8012–8017. 2001. View Article : Google Scholar : PubMed/NCBI
|
|
20
|
Barallon R, Bauer SR, Butler J,
Capes-Davis A, Dirks WG, Elmore E, Furtado M, Kline MC, Kohara A,
Los GV, et al: Recommendation of short tandem repeat profiling for
authenticating human cell lines, stem cells, and tissues. In Vitro
Cell Dev Biol Anim. 46:727–732. 2010. View Article : Google Scholar : PubMed/NCBI
|
|
21
|
Capes-Davis A, Reid YA, Kline MC, Storts
DR, Strauss E, Dirks WG, Drexler HG, MacLeod RA, Sykes G, Kohara A,
et al: Match criteria for human cell line authentication: where do
we draw the line? Int J Cancer. 132:2510–2519. 2013. View Article : Google Scholar
|
|
22
|
Masters JRW; American Type Culture
Collection Standards Development Organization Workgroup ASN-0002:
Cell line misidentification: the beginning of the end. Nat Rev
Cancer. 10:441–448. 2010. View
Article : Google Scholar
|
|
23
|
Verma R and Babu A: Human Chromosomes:
Principles & Techniques. 2nd edition. McGraw-Hill Inc; New
York, NY: 1995
|
|
24
|
Parson W, Kirchebner R, Mühlmann R, Renner
K, Kofler A, Schmidt S and Kofler R: Cancer cell line
identification by short tandem repeat profiling: power and
limitations. FASEB J. 19:434–436. 2005.PubMed/NCBI
|
|
25
|
Azari S, Ahmadi N, Tehrani MJ and Shokri
F: Profiling and authentication of human cell lines using short
tandem repeat (STR) loci: report from the National Cell Bank of
Iran. Biologicals. 35:195–202. 2007. View Article : Google Scholar : PubMed/NCBI
|
|
26
|
Steube KG, Grunicke D and Drexler HG:
Isoenzyme analysis as a rapid method for the examination of the
species identity of cell cultures. In Vitro Cell Dev Biol Anim.
31:115–119. 1995. View Article : Google Scholar : PubMed/NCBI
|
|
27
|
O'Toole CM, Povey S, Hepburn P and Franks
LM: Identity of some human bladder cancer cell lines. Nature.
301:429–430. 1983. View
Article : Google Scholar : PubMed/NCBI
|
|
28
|
Gown AM and Vogel AM: Monoclonal
antibodies to human intermediate filament proteins. III. Analysis
of tumors. Am J Clin Pathol. 84:413–424. 1985.PubMed/NCBI
|
|
29
|
Quentmeier H, Osborn M, Reinhardt J,
Zaborski M and Drexler HG: Immunocytochemical analysis of cell
lines derived from solid tumors. J Histochem Cytochem.
49:1369–1378. 2001. View Article : Google Scholar : PubMed/NCBI
|
|
30
|
Kaighn ME, Narayan KS, Ohnuki Y, Lechner
JF and Jones LW: Establishment and characterization of a human
prostatic carcinoma cell line (PC-3). Invest Urol. 17:16–23.
1979.PubMed/NCBI
|
|
31
|
Gilbert DA, Reid YA, Gail MH, Pee D, White
C, Hay RJ and O'Brien SJ: Application of DNA fingerprints for
cell-line individualization. Am J Hum Genet. 47:499–514.
1990.PubMed/NCBI
|
|
32
|
Thompson R, Zoppis S and McCord B: An
overview of DNA typing methods for human identification: past,
present, and future. Methods Mol Biol. 830:3–16. 2012. View Article : Google Scholar
|
|
33
|
Silva LM, Montes de Oca H, Diniz CR and
Fortes-Dias CL: Fingerprinting of cell lines by directed
amplification of minisatellite-region DNA (DAMD). Braz J Med Biol
Res. 34:1405–1410. 2001. View Article : Google Scholar : PubMed/NCBI
|
|
34
|
Chambers GK and MacAvoy ES:
Microsatellites: consensus and controversy. Comp Biochem Physiol B
Biochem Mol Biol. 126:455–476. 2000. View Article : Google Scholar : PubMed/NCBI
|
|
35
|
Yan R, Ottenbreit M, Hukku B, Mally M,
Chou S and Kaplan J: DNA fingerprinting of human cell lines using
PCR amplification of fragment length polymorphisms. In Vitro Cell
Dev Biol Anim. 32:656–662. 1996. View Article : Google Scholar
|
|
36
|
Korch C, Spillman MA, Jackson TA, Jacobsen
BM, Murphy SK, Lessey BA, Jordan VC and Bradford AP: DNA profiling
analysis of endometrial and ovarian cell lines reveals
misidentification, redundancy and contamination. Gynecol Oncol.
127:241–248. 2012. View Article : Google Scholar : PubMed/NCBI
|
|
37
|
Poetsch M, Petersmann A, Woenckhaus C,
Protzel C, Dittberner T, Lignitz E and Kleist B: Evaluation of
allelic alterations in short tandem repeats in different kinds of
solid tumors - possible pitfalls in forensic casework. Forensic Sci
Int. 145:1–6. 2004. View Article : Google Scholar : PubMed/NCBI
|
|
38
|
Vauhkonen H, Hedman M, Vauhkonen M, Kataja
M, Sipponen P and Sajantila A: Evaluation of gastrointestinal
gastrointestinal cancer tissues as a source of genetic information
for forensic investigations by using STRs. Forensic Sci Int.
139:159–167. 2004. View Article : Google Scholar : PubMed/NCBI
|
|
39
|
Ensenberger MG, Thompson J, Hill B, Homick
K, Kearney V, Mayntz-Press KA, Mazur P, McGuckian A, Myers J, Raley
K, et al: Developmental validation of the PowerPlex 16 HS System:
an improved 16-locus fluorescent STR multiplex. Forensic Sci Int
Genet. 4:257–264. 2010. View Article : Google Scholar : PubMed/NCBI
|
|
40
|
Pejovic T, Heim S, Orndal C, Jin YS,
Mandahl N, Willén H and Mitelman F: Simple numerical chromosome
aberrations in well-differentiated malignant epithelial tumors.
Cancer Genet Cytogenet. 49:95–101. 1990. View Article : Google Scholar : PubMed/NCBI
|
|
41
|
Tibiletti MG, Bernasconi B, Furlan D,
Bressan P, Cerutti R, Facco C, Franchi M, Riva C, Cinquetti R,
Capella C and Taramelli R: Chromosome 6 abnormalities in ovarian
surface epithelial tumors of borderline malignancy suggest a
genetic continuum in the progression model of ovarian neoplasms.
Clin Cancer Res. 7:3404–3409. 2001.PubMed/NCBI
|