Introduction
Stroke is the second most common cause of mortality
world-wide (1), and approximately
84% of these deaths are caused by ischemic stroke (2). In South Korea, stroke is the second
most frequent cause of death after cancer and is more prevalent
than heart disease. Stroke has well-known risk factors, including
hypertension, diabetes mellitus, advanced age, smoking,
hyperlipidemia, hyperhomocysteinemia and a thrombophilia event in
blood vessels (1,2). A number of different diseases can
cause ischemic stroke. The most common source of ischemic stroke is
arterial occlusion in the head, usually caused by atherosclerosis,
gradual cholesterol deposition or thrombosis (3,4).
Blood vessel occlusion is primarily caused by thrombosis (53% of
cases) or embolism (31% of cases) (5). Thrombus formation can be caused by
excessive platelet generation (6), and the association between platelets
and ischemic stroke has been widely studied (7–9).
Platelets are involved in both normal hemostasis and thrombosis
(10). They are formed in the
cytoplasm of megakaryocytes (MKs), their precursor cells, located
in the bone marrow (11).
MicroRNAs (miRNAs or miRs) are a class of small
(19–23 nt in length), endogenous non-coding RNA molecules that are
endogenous physiological regulators of gene expression (12). miRNAs efficiently control gene
expression by binding 3′-untranslated regions in mRNAs to
downregulate their protein expression (13). miRNAs play important roles in a
number of physiological and pathological processes, including
metabolism (14), hematopoiesis
(15) and immune function
(16). Moreover, previous studies
have indicated that temporal miRNA regulation may be related to the
progression of ischemia in the cerebral artery (17,18). Furthermore, a recent study found a
significant association between miRNA single nucleotide
polymorphisms (SNPs) and the risk of ischemic stroke (19). As has been previously reported by
Edelstein et al (20), as
regards the regulated function of megakaryocytopoiesis, various
miRNAs play a crucial role in this process, as well as in platelet
biogenesis. Therefore, it may be valuable to investigate
associations between MK formation-related miRNAs, such as
miR-34a, miR-130a, miR-150 and miR-155
(20,21), and the prevalence of ischemic
stroke.
In this study, we investigated the associations
between 4 miRNA polymorphisms (miR-34a rs6577555C>A,
miR-130a rs731384C>T, miR-150 rs73056059G>A and
miR-155 rs767649T>A) and the risk of ischemic stroke in a
Korean population.
Subjects and methods
Subjects
The study population comprised 596 patients with
ischemic stroke (mean age ± SD: 63.67±10.42 years, 254 males, 342
females). Ischemic stroke was diagnosed based on rapidly developing
neurological symptoms with a concurrent acute infarction,
documented by brain magnetic resonance imaging (MRI). In addition,
404 control subjects were included (mean age ± SD: 63.66±10.47
years, 173 males, 231 females). The patients were enrolled by
consecutive referral between July 1, 2000 and February 28, 2008 in
the Neurology Department at CHA Bundang Medical Center (Seongnam,
South Korea). The control subjects were recruited from patients who
visited the hospital for a routine health examination. The
exclusion criteria for the control sujbects were as follows: a
family history of stroke or experiencing non-specific dizziness,
non-organic headaches, or anxiety during the enrollment period. All
control subjects underwent some form of brain imaging (~75% MRI),
and no organic cerebral lesions were observed. The subjects were
interviewed to collect clinical information regarding demographic
data and vascular risk factors. Subjects with a previous history of
cerebral hemorrhage or those with incomplete medical histories were
excluded from this study. The patients with ischemic stroke were
classified into 3 subgroups as follows: 202 patients had left
anterior descending artery (LAD) disease, 143 had small-vessel
disease (SVD) and 57 had cardioembolism (CE); 194 patients had an
undetermined etiology.
Ischemic stroke was defined as a stroke
(characterized by rapidly developing clinical symptoms and signs of
focal and/or global brain function loss) with evidence of a
cerebral infarction in clinically relevant areas of the brain based
on a brain MRI. Based on clinical manifestations and neuroimaging
data, two neurologists classified ischemic stroke into 3
etiological subtypes using the criteria from the Trial of Org 10172
in Acute Stroke Treatment (TOAST) clinical trial as follows
(22): i) subtype 1: LAD, an
infarct lesion of ≥15 mm in diameter, as determined by an MRI, and
significant (>50%) stenosis of a major brain artery or a branch
cortical artery, as determined by cerebral angiography, with
symptoms associated with that arterial territory; ii) subtype 2:
SVD, an infarct lesion of <15 mm, but >5 mm in diameter, as
determined by an MRI, and classic lacunar syndrome without evidence
of cerebral cortical dysfunction or a potentially detectable
cardiac source for the embolism; and iii) subtype 3: CE, arterial
occlusions presumably due to a heart-originated embolus, as
detected by cardiac evaluation. We measured clinical parameters,
including hypertension, diabetes, hyperlipidemia, homocysteine
levels, folate levels, vitamin B12 levels, cholesterol, platelet
(PLT) count, PT, prothrombin time (PT), activated partial
thromboplastin time (aPTT), fibrinogen levels, antithrombin levels,
BUN levels and uric acid levels based on previously described
methods (23,24).
Genetic analysis
Genomic DNA was extracted from blood leukocytes
using the G-DEX blood extraction kit (Intron Inc., Seongnam,
Korea). The 4 most well-studied SNPs in the miRNAs were determined
by a documentary search which included promoter region SNPs
(miR-34a rs6577555C>A, miR-130a rs731384C>T, miR-150
rs73056059G>A and miR-155 rs767649T>A). All SNP sequences
were obtained from the HapMap database (www.hapmap.org) and dbSNP≈(www.ncbi.nlm.nih.gov/projects/SNP/). Nucleotide
alterations were determined by polymerase chain reaction
(PCR)-restriction fragment length polymorphism (RFLP) analyses
using the isolated genomic DNA as a template. PCR for the
miR-34a rs6577555C>A polymorphism was performed using the
following primers: 5′-CCT GGT TAA CAT AGC CAG AGC-3′ (forward) and
5′-GCA GAC ATG CTG ACT TTT CAA-3′ (reverse). DNA was amplified over
35 cycles (denaturation at 95°C for 30 sec, annealing at 56°C for
30 sec, and extension at 72°C for 35 sec). The PCR products were
digested with the BanII restriction endonuclease (New
England Biolabs, Beverly, MA, USA) at 37°C for 16 h and detected
using 3.5% agarose gel electrophoresis. The primer sequences used
to detect the miR-130a rs731384C>T polymorphism were
5′-GAT GCT CAG TCC TCA AAG AAC A-3′ (forward) and 5′-TGA GGC CTA
GAG CTC TGC TTT AT-3′ (reverse). DNA was amplified over 35 cycles
(denaturation at 95°C for 30 sec, annealing at 58°C for 30 sec, and
extension at 72°C for 35 sec). The PCR products were digested with
NlaIII (New England Biolabs) at 37°C for 16 h and were
visualized using 3% agarose gel electrophoresis. The primer
sequences used to detect the miR-150 rs73056059G>A were
5′-GTT CCT GCC AGA GGA AGT G-3′ (forward) and 5′-CCT CTG GAG TCC
ACA CTC CAT-3′ (reverse). DNA was amplified over 35 cycles
(denaturation at 95°C for 30 sec, annealing at 60°C for 35 sec, and
extension at 72°C for 40 sec). The products were digested with
BccI (New England Biolabs) at 37°C for 16 h and detected
using 4% gel electrophoresis. The primer sequences used to detect
the miR-155 rs767649T>A polymorphism were 5′-CCT GTA TGA
CAA GGT TGT GTT TG-3′ (forward) and 5′-GCT GGC ATA CTA TTC TAC CCA
TAA-3′ (reverse). DNA was amplified over 35 cycles (denaturation at
95°C for 35 sec, annealing at 56°C for 30 sec, and extension at
72°C for 35 sec). The PCR products were digested with Tsp45I
(New England Biolabs) at 37°C for 16 h and visualized using 3%
agarose gel electrophoresis.
Statistical analysis
Clinical characteristics were compared using the
Student's unpaired t-test. Associations among ischemic stroke and
the 4 miRNA genotypes were estimated by calculating the odd ratios
(ORs) and 95% confidence intervals (CIs) using the Fisher's exact
test. Adjusted ORs (AORs) for the miRNA polymorphisms were
determined using multiple logistic regression analysis based on
gender, age, diabetes mellitus, hypertension, hyperlipidemia and
smoking. The genotype distribution for each polymorphism was
assessed for Hardy-Weinberg equilibrium deviations and genotype and
allele frequency differences between groups were assessed using
χ2 tests. A value of P<0.05 was considered to
indicate a statistically significant difference. Stratification
analysis was used to distinguish stroke subgroups based on the size
of the occluded vessel. One-way analysis of variance (ANOVA) was
performed to compare the mean homocysteine concentration levels
among different genotypes. Stats Direct Statistical Software
(version 2.4.4; StatsDirect Ltd., Altrincham, UK) was used to
calculate the adjusted OR and 95% CI. Survival curves were created
using Cox proportional hazards regression, and the significance of
differences between groups was assessed using the log-rank test.
Cox regression models were used to analyze the independent
prognostic importance of various markers, and results were adjusted
for age, gender, diabetes mellitus, hypertension, hyperlipidemia
and smoking. Hazard ratios (HRs) are presented with the 95% CI. We
also performed in silico analysis to identify potential
transcription factor binding sites in miRNA promoter regions using
Alibaba 2.1 (Grabe 2002), an online bio-informatics tool.
Results
The demographic characteristics and clinical
variables of the ischemic stroke and control groups are shown in
Table I. When comparing the
ischemic stroke group with the control group, the stroke patients
had a significantly higher incidence of hypertension and diabetes,
significantly higher homocysteine and fibrinogen levels, and
significantly lower folate levels and aPTT (all P<0.05)
(Table I).
 | Table IBaseline characteristics between
patients with ischemic stroke and the control subjects. |
Table I
Baseline characteristics between
patients with ischemic stroke and the control subjects.
| Characteristic | Controls
(n=404) | Stroke patients
(n=596) | P-valuea |
|---|
| Male (%) | 173 (42.8) | 254 (42.6) | 0.953 |
| Age (years, mean ±
SD) | 63.66±10.47 | 63.67±10.42 | 0.987 |
| Smoking (%) | 138 (34.2) | 211 (35.4) | 0.704 |
| Hypertension
(%) | 169 (41.8) | 376 (63.1) | 0.0002 |
| Diabetes mellitus
(%) | 54 (13.4) | 161 (27.0) | <0.0001 |
| Hyperlipidemia
(%) | 95 (23.5) | 179 (30.0) | 0.070 |
| Homocysteine
(µmol/l, mean ± SD) | 10.12±4.21 | 11.26±6.78 | 0.003 |
| Folate (nmol/l,
mean ± SD) | 8.88±7.99 | 7.06±5.29 | <0.0001 |
| Vitamin
B12 (pg/ml, mean ± SD) | 746.18±670.06 | 747.46±624.35 | 0.976 |
| Total cholesterol
(mg/dl, mean ± SD) | 193.70±37.59 | 189.88±40.79 | 0.137 |
| Triglyceride
(mg/dl, mean ± SD) | 147.74±90.39 | 152.58±114.39 | 0.480 |
| PLT
(103/ml, mean ± SD) | 243.06±67.51 | 248.19±87.73 | 0.324 |
| PT (sec, mean ±
SD) | 11.77±0.79 | 11.91±3.08 | 0.440 |
| aPTT (sec, mean ±
SD) | 33.34±18.61 | 30.46±4.36 | 0.001 |
| Fibrinogen (mg/dl,
mean ± SD) | 397.83±119.62 | 426.93±132.40 | 0.018 |
| Antithrombin (%,
mean ± SD) | 94.36±43.88 | 93.36±18.67 | 0.685 |
| BUN (mg/dl, mean ±
SD) | 15.93±5.02 | 16.29±7.80 | 0.419 |
| Uric acid (mg/dl,
mean ± SD) | 4.68±1.47 | 4.69±1.67 | 0.923 |
We investigated 4 miRNA polymorphisms,
miR-34a rs6577555C>A, miR-130a rs731384C>T,
miR-150 rs73056059G>A and miR-155 rs767649T>A,
and their associations with ischemic stroke. All the observed
polymorphism frequencies were consistent with the Hardy-Weinberg
equilibrium. However, we could not find any polymorphism frequency
differences between the ischemic stroke and control groups
(Table II). Once the ischemic
stroke group was stratified into subgroups and analyzed, we
observed associations between miRNA polymorphisms and individual
stroke subtypes. LAD was significantly associated with the
miR-150GA genotype (GG vs. AA: AOR, 1.922; 95% CI,
1.003–3.681). CE was also significantly associated with
miR-150 (GG vs. AA: AOR, 2.996; 95% CI, 1.293–6.939) (these
values are shown in bold in Table
II). However, these differences dissipated once the P-value was
adjusted for false discovery rate (FDR) (Table II). The miR-34aC>A,
miR-130aC>T, and miR-155T>A polymorphisms did
not differ significantly between the stroke patients and the
control subjects.
| Table IIComparison of genotype frequencies of
microRNA polymorphisms between ischemic stroke subtype and the
controls. |
Table II
Comparison of genotype frequencies of
microRNA polymorphisms between ischemic stroke subtype and the
controls.
|
Characteristics | Controls
(n=404) | Stroke patients
(n=596) | AOR (95%
CI)a | P-value | P-valueb | LAD (n=202) | AOR (95%
CI)a | P-value | P-valueb | SVD (n=143) | AOR (95%
CI)a | P-value | P-valueb | CE (n=57) | AOR (95%
CI)a | P-value | P-valueb |
|---|
| miR-34a
rs6577555C>A |
| CC | 239 (59.2) | 323 (54.2) | 1.000
(reference) | | | 107 (53.0) | 1.000
(reference) | | | 75 (52.4) | 1.000
(reference) | | | 34 (59.6) | 1.000
(reference) | | |
| CA | 143 (35.4) | 229 (38.4) | 1.211
(0.915–1.603) | 0.181 | 0.362 | 82 (40.6) | 1.326
(0.911–1.930) | 0.140 | 0.280 | 58 (40.6) | 1.294
(0.852–1.967) | 0.227 | 0.772 | 19 (33.3) | 0.987
(0.537–1.813) | 0.965 | 0.965 |
| AA | 22 (5.4) | 44 (7.4) | 1.384
(0.787–2.431) | 0.259 | 0.389 | 13 (6.4) | 1.347
(0.622–2.919) | 0.450 | 0.675 | 10 (7.0) | 1.244
(0.525–2.949) | 0.621 | 0.621 | 4 (7.0) | 1.432
(0.444–4617) | 0.548 | 0.822 |
| Dominant | | | 1.226
(0.938–1.602) | 0.136 | 0.276 | | 1.329
(0.927–1.905) | 0.122 | 0.244 | | 1.292
(0.864–1.932) | 0.212 | 0.552 | | 1.032
(0.581–1.834) | 0.915 | 0.915 |
| Recessive | | | 1.252
(0.718–2.183) | 0.429 | 0.562 | | 1.192
(0.563–2.522) | 0.646 | 0.969 | | 1.123
(0.494–2.552) | 0.782 | 0.782 | | 1.277
(0.412–3.952) | 0.672 | 0.672 |
| miR-130a
rs731384C>T |
| CC | 328 (81.2) | 479 (80.4) | 1.000
(reference) | | | 162 (80.2) | 1.000
(reference) | | | 116 (81.1) | 1.000
(reference) | | | 45 (78.9) | 1.000
(reference) | | |
| CT | 74 (18.3) | 110 (18.5) | 1.008
(0.715–1.420) | 0.966 | 0.966 | 39 (19.3) | 1.095
(0.696–1.723) | 0.696 | 0.696 | 24 (16.8) | 0.925
(0.545–1.570) | 0.772 | 0.772 | 10 (17.5) | 0.975
(0.465–2.044) | 0.947 | 0.965 |
| TT | 2 (0.5) | 7 (1.2) | 1.611
(0.309–8.412) | 0.572 | 0.572 | 1 (0.5) | 1.079
(0.095–12.24) | 0.951 | 0.951 | 3 (2.1) | 4.006
(0.616–26.050) | 0.146 | 0.219 | 2 (3.5) | 6.229
(0.835–46.48) | 0.074 | 0.222 |
| Dominant | | | 1.027
(0.733–1.439) | 0.879 | 0.879 | | 1.091
(0.696–1.709) | 0.704 | 0.939 | | 1.012
(0.608–1.686) | 0.962 | 0.962 | | 1.124
(0.562–2.248) | 0.742 | 0.915 |
| Recessive | | | 1.630
(0.312–8.519) | 0.562 | 0.562 | | 0.961
(0.085–10.84) | 0.974 | 0.974 | | 3.907
(0.604–25.28) | 0.153 | 0.230 | | 5.919
(0.797–43.97) | 0.082 | 0.246 |
| miR-150
rs73056059G>A |
| GG | 380 (94.1) | 544 (91.3) | 1.000
(reference) | | | 181 (89.6) | 1.000
(reference) | | | 132 (92.3) | 1.000
(reference) | | | 48 (84.2) | 1.000
(reference) | | |
| GA | 24 (5.9) | 52 (8.7) | 1.485
(0.881–2.504) | 0.138 | 0.362 | 21 (10.4) | 1.922
(1.003–3.681) | 0.049 | 0.196 | 11 (7.7) | 1.223
(0.558–2.683) | 0.615 | 0.772 | 9 (15.8) | 2.996
(1.293–6.939) | 0.011 | 0.044 |
| AA | 0 (0.0) | 0 (0.0) | N/A | N/A | N/A | 0 (0.0) | N/A | N/A | N/A | 0 (0.0) | N/A | N/A | N/A | 0 (0.0) | N/A | N/A | N/A |
| Dominant | | | 1.485
(0.881–2.504) | 0.138 | 0.276 | | 1.922
(1.003–3.681) | 0.049 | 0.196 | | 1.223
(0.558–2.683) | 0.615 | 0.820 | | 2.996
(1.293–6.939) | 0.011 | 0.044 |
| Recessive | | | N/A | N/A | N/A | | N/A | N/A | N/A | | N/A | N/A | N/A | | N/A | N/A | N/A |
| miR-155
rs767649T>A |
| TT | 117 (29.0) | 167 (28.0) | 1.000
(reference) | | | 58 (28.7) | 1.000
(reference) | | | 46 (32.2) | 1.000
(reference) | | | 13 (22.8) | 1.000
(reference) | | |
| TA | 191 (47.3) | 311 (52.2) | 1.141
(0.835–1.558) | 0.409 | 0.545 | 105 (52.0) | 1.168
(0.766–1.781) | 0.472 | 0.629 | 69 (48.3) | 0.873
(0.548–1.388) | 0.565 | 0.772 | 34 (59.6) | 1.508
(0.753–3.019) | 0.246 | 0.492 |
| AA | 96 (23.8) | 118 (19.8) | 0.794
(0.546–1.155) | 0.228 | 0.389 | 39 (19.3) | 0.710
(0.420–1.200) | 0.201 | 0.603 | 28 (19.6) | 0.638
(0.360–1.131) | 0.124 | 0.219 | 10 (17.5) | 0.932
(0.385–2.258) | 0.876 | 0.876 |
| Dominant | | | 1.024
(0.765–1.370) | 0.876 | 0.879 | | 1.006
(0.676–1.496) | 0.977 | 0.977 | | 0.786
(0.509–1.213) | 0.276 | 0.552 | | 1.280
(0.657–2.492) | 0.468 | 0.915 |
| Recessive | | | 0.728
(0.529–1.002) | 0.052 | 0.156 | | 0.676
(0.435–1.050) | 0.082 | 0.246 | | 0.651
(0.395–1.074) | 0.093 | 0.230 | | 0.659
(0.317–1.368) | 0.263 | 0.395 |
We performed stratified analyses according to age,
gender, hypertension, diabetes mellitus, hyperlipidemia, smoking,
folate levels and homocysteine levels. The miR-34aCA+AA
genotype exhibited elevated prevalence in subjects who were ≥63
years of age (AOR, 1.443; 95% CI, 1.010–2.062), of the female
gender (AOR, 1.459; 95% CI, 1.026–2.076) and who were non-diabetic
(AOR, 1.360; 95% CI, 1.013–1.827). The miR-150GA+AA genotype
also exhibited elevated prevalence in patients with hyperlipidemia
(AOR, 6.060; 95% CI, 1.358–27.04) (Table III).
| Table IIIEffects of microRNA genotypes and
characteristics of ischemic stroke among individual risk
factors. |
Table III
Effects of microRNA genotypes and
characteristics of ischemic stroke among individual risk
factors.
| Variables | miR-34a
rs6577555CA+AA
| miR-130a
rs731384CT+TT
| miR-150
rs73056059GA+AA
| miR-155
rs767649TA
|
|---|
| AOR (95%
CI)a | P-value | P-valueb | AOR (95%
CI)a | P-value | P-valueb | AOR (95%
CI)a | P-value | P-valueb | AOR (95%
CI)a | P-value | P-valueb |
|---|
| Age |
| <63 | 1.079
(0.720–1.617) | 0.713 | 0.911 | 1.030
(0.608–1.746) | 0.911 | 0.911 | 1.914
(0.848–4.318) | 0.118 | 0.472 | 1.680
(1.037–2.722) | 0.035 | 0.140 |
| ≥63 | 1.443
(1.010–2.062) | 0.044 | 0.176 | 1.038
(0.673–1.601) | 0.867 | 0.867 | 1.245
(0.628–2.469) | 0.530 | 0.706 | 0.872
(0.576–1.319) | 0.516 | 0.706 |
| Gender |
| Male | 1.016
(0.672–1.535) | 0.941 | 0.941 | 0.978
(0.577–1.657) | 0.934 | 0.941 | 1.628
(0.733–3.616) | 0.232 | 0.464 | 1.026
(0.621–1.695) | 0.921 | 0.921 |
| Female | 1.459
(1.026–2.076) | 0.036 | 0.144 | 1.098
(0.708–1.703) | 0.677 | 0.677 | 1.360
(0.679–2.725) | 0.386 | 0.514 | 1.221
(0.814–1.830) | 0.334 | 0.514 |
| Hypertension |
| No | 1.163
(0.793–1.705) | 0.439 | 0.735 | 1.009
(0.618–1.649) | 0.970 | 0.970 | 2.009
(0.939–4.297) | 0.072 | 0.288 | 1.238
(0.798–1.922) | 0.341 | 0.682 |
| Yes | 1.416
(0.972–2.063) | 0.070 | 0.14 | 1.067
(0.672–1.695) | 0.784 | 0.784 | 1.188
(0.591–2.387) | 0.628 | 0.784 | 1.067
(0.680–1.674) | 0.778 | 0.778 |
| Diabetes
mellitus |
| No | 1.360
(1.013–1.827) | 0.041 | 0.164 | 1.028
(0.710–1.487) | 0.885 | 0.885 | 1.514
(0.856–2.677) | 0.154 | 0.229 | 1.044
(0.740–1.473) | 0.806 | 0.920 |
| Yes | 0.962
(0.508–1.823) | 0.906 | 0.906 | 1.103
(0.491–2.480) | 0.812 | 0.906 | 1.556
(0.424–5.704) | 0.505 | 0.906 | 1.761
(0.835–3.716) | 0.137 | 0.548 |
| Hyperlipidemia |
| No | 1.328
(0.974–1.810) | 0.073 | 0.264 | 1.017
(0.691–1.497) | 0.933 | 0.933 | 1.057
(0.586–1.907) | 0.853 | 0.933 | 1.096
(0.759–1.582) | 0.625 | 0.998 |
| Yes | 1.100
(0.645–1.877) | 0.726 | 0.828 | 1.078
(0.547–2.124) | 0.828 | 0.828 | 6.060
(1.358–27.04) | 0.018 | 0.072 | 1.379
(0.754–2.523) | 0.297 | 0.594 |
| Smoking |
| No | 1.160
(0.834–1.612) | 0.378 | 0.645 | 1.163
(0.763–1.773) | 0.484 | 0.645 | 1.143
(0.612–2.137) | 0.675 | 0.675 | 1.300
(0.886–1.906) | 0.180 | 0.720 |
| Yes | 1.460
(0.923–2.308) | 0.105 | 0.144 | 0.890
(0.508–1.557) | 0.682 | 0.682 | 2.604
(0.936–7.241) | 0.067 | 0.144 | 0.846
(0.485–1.473) | 0.554 | 0.554 |
| Folatec |
| >3.56
nmol/l | 1.228
(0.919–1.641) | 0.165 | 0.330 | 1.071
(0.749–1.531) | 0.707 | 0.707 | 1.319
(0.757–2.299) | 0.328 | 0.437 | 1.190
(0.847–1.672) | 0.317 | 0.437 |
| ≤3.56 nmol/l | 0.960
(0.411–2.244) | 0.925 | 0.925 | 1.795
(0.466–6.917) | 0.395 | 0.592 | N/A | N/A | N/A | 0.984
(0.360–2.689) | 0.974 | 0.974 |
|
Homocysteined |
| <13.92
µmol/l | 1.184
(0.889–1.579) | 0.249 | 0.332 | 0.994
(0.698–1.415) | 0.973 | 0.973 | 1.422
(0.808–2.502) | 0.223 | 0.332 | 1.180
(0.846–1.647) | 0.331 | 0.621 |
| ≥13.92
µmol/l | 1.858
(0.868–3.975) | 0.110 | 0.44 | 2.068
(0.614–6.969) | 0.241 | 0.482 | 1.929
(0.467–7.966) | 0.364 | 0.485 | 0.959
(0.362–2.545) | 0.933 | 0.933 |
Combined gene-environment analyses revealed several
genotypes that were associated with clinical factors related to the
risk of ischemic stroke. The miR-34aCA+AA genotype exhibited
elevated stroke prevalence in subjects with hypertension (AOR,
3.088; 95% CI, 2.089–4.566), hyperlipidemia (AOR, 1.570; 95% CI,
1.010–2.443), smokers (AOR, 1.651; 95% CI, 1.023–2.665) and those
with high homocysteine levels (AOR, 2.230; 95% CI, 1.236–4.024).
The miR-130aCT+TT genotype also exhibited elevated stroke
prevalence in subjects with hypertension (AOR, 2.390; 95% CI,
1.483–3.850), diabetes mellitus (AOR, 2.205; 95% CI, 1.043–4.661)
and low folate levels (AOR, 4.702; 95% CI, 1.341–16.49). The
miR-150GA+AA genotype exhibited elevated stroke prevalence
in subjects with hypertension (AOR, 2.871; 95% CI, 1.416–5.824),
hyperlipidemia (AOR, 7.215; 95% CI, 1.655–31.45) and who were
smokers (AOR, 3.594; 95% CI, 1.267–10.20). The miR-155TA
genotype exhibited elevated stroke prevalence in subjects with
diabetes mellitus (AOR, 2.945; 95% CI, 1.659–5.228) and
hyperlipidemia (AOR, 1.734; 95% CI, 1.049–2.865) (Table IV).
| Table IVIschemic stroke incidence by
interactions with environmental factors such as gender, advanced
age, hypertension, diabetes mellitus, hyperlipidemia, smoking,
folate levels and homocysteine levels. |
Table IV
Ischemic stroke incidence by
interactions with environmental factors such as gender, advanced
age, hypertension, diabetes mellitus, hyperlipidemia, smoking,
folate levels and homocysteine levels.
|
Characteristics | miR-34a
rs6577555CC | miR-34a
rs6577555CA+AA | miR-130a
rs731384CC | miR-130a
rs731384CT+TT | miR-150
rs73056059GG | miR-150
rs73056059GA+AA | miR-155
rs767649TT | miR-155
rs767649TA |
|---|
| Male | 1.000
(reference) | 1.010
(0.668–1.527) | 1.000
(reference) | 0.978
(0.578–1.656) | 1.000
(reference) | 1.614
(0.725–3.589) | 1.000
(reference) | 1.026
(0.621–1.695) |
| Female | 0.800
(0.523–1.225) | 1.437
(0.897–2.301) | 1.067
(0.745–1.530) | 1.169
(0.699–1.953) | 1.034
(0.744–1.437) | 1.737
(0.804–3.753) | 0.895
(0.494–1.622) | 1.083
(0.619–1.893) |
| Age <63 | 1.000
(reference) | 1.079
(0.720–1.617) | 1.000
(reference) | 1.030
(0.608–1.746) | 1.000
(reference) | 1.914
(0.848–4.318) | 1.000
(reference) | 1.680
(1.037–2.722) |
| Age ≥63 | 0.790
(0.546–1.145) | 1.158
(0.779–1.723) | 0.864
(0.635–1.176) | 0.882
(0.555–1.404) | 0.876
(0.658–1.167) | 1.184
(0.584–2.398) | 1.404
(0.828–2.379) | 1.098
(0.672–1.795) |
| Without
hypertension | 1.000
(reference) | 1.154
(0.787–1.694) | 1.000
(reference) | 1.005
(0.616–1.639) | 1.000
(reference) | 2.013
(0.939–4.317) | 1.000
(reference) | 1.238
(0.798–1.922) |
| With
hypertension | 2.157
(1.517–3.069) | 3.088
(2.089–4.566) | 2.300
(1.711–3.093) | 2.390
(1.483–3.850) | 2.385
(1.808–3.146) | 2.871
(1.416–5.824) | 2.697
(1.612–4.511) | 2.756
(1.773–4.285) |
| Without diabetes
mellitus | 1.000
(reference) | 1.357
(1.011–1.823) | 1.000
(reference) | 1.023
(0.707–1.479) | 1.000
(reference) | 1.513
(0.856–2.675) | 1.000
(reference) | 1.044
(0.740–1.473) |
| With diabetes
mellitus | 2.452
(1.550–3.879) | 2.352
(1.398–3.957) | 2.096
(1.423–3.088) | 2.205
(1.043–4.661) | 2.115
(1.476–3.032) | 3.161
(0.883–11.31) | 1.612
(0.852–3.050) | 2.945
(1.659–5.228) |
| Without
hyperlipidemia | 1.000
(reference) | 1.323
(0.970–1.804) | 1.000
(reference) | 1.017
(0.691–1.497) | 1.000
(reference) | 1.057
(0.586–1.908) | 1.000
(reference) | 1.096
(0.759–1.582) |
| With
hyperlipidemia | 1.463
(0.974–2.196) | 1.570
(1.010–2.443) | 1.324
(0.945–1.857) | 1.409
(0.754–2.634) | 1.214
(0.887–1.662) | 7.215
(1.655–31.45) | 1.377
(0.795–2.387) | 1.734
(1.049–2.865) |
| Non-smoker | 1.000
(reference) | 1.158
(0.833–1.610) | 1.000
(reference) | 1.159
(0.761–1.767) | 1.000
(reference) | 1.140
(0.610–2.130) | 1.000
(reference) | 1.300
(0.886–1.906) |
| Smoker | 0.868
(0.566–1.330) | 1.651
(1.023–2.665) | 1.215
(0.843–1.750) | 1.132
(0.650–1.971) | 1.066
(0.765–1.486) | 3.594
(1.267–10.20) | 1.570
(0.848–2.907) | 1.303
(0.770–2.205) |
| Folate >3.56
nmol/la | 1.000
(reference) | 1.227
(0.918–1.640) | 1.000
(reference) | 1.071
(0.750–1.531) | 1.000
(reference) | 1.322
(0.758–2.304) | 1.000
(reference) | 1.190
(0.847–1.672) |
| Folate ≤3.56
nmol/l | 3.780
(2.022–7.066) | 3.489
(1.866–6.525) | 3.138
(1.946–5.061) | 4.702
(1.341–16.49) | 3.078
(1.954–4.848) | N/A | 3.731
(1.563–8.906) | 3.652
(1.857–7.182) |
| Homocysteine
<13.92 µmol/lb | 1.000
(reference) | 1.182
(0.887–1.575) | 1.000
(reference) | 0.996
(0.699–1.418) | 1.000
(reference) | 1.415
(0.803–2.493) | 1.000
(reference) | 1.180
(0.846–1.647) |
| Homocysteine ≥13.92
µmol/l | 1.308
(0.763–2.243) | 2.230
(1.236–4.024) | 1.437
(0.936–2.207) | 2.788
(0.891–8.718) | 1.504
(0.994–2.274) | 3.004
(0.804–11.23) | 1.627
(0.697–3.797) | 1.327
(0.742–2.372) |
We then performed allelic combination analyses using
the multifactor dimensionality reduction method comparing the
ischemic stroke patients and the control subjects (Table V). The following allele
combinations exhibited a significant association with the
prevalence of stroke (P>0.05): the A-T-G-A allele combination of
miR-34aC>A/miR-130aC>T/miR-150G>A/miR-155T>A
(OR, 0.052; 95% CI, 0.003–0.921), the A-C-A allele combination of
miR-34aC>A/miR-130aC>T/miR-150G>A
(OR, 4.285; 95% CI, 1.255–14.62), the A-A allele combination of
miR-34aC>A/miR-150G>A (OR, 3.814; 95% CI,
1.106–13.15), and the A-A allele combination of
miR-150G>A/miR-155T>A (OR, 1.970; 95% CI,
1.013–3.831). We also performed genotype combination analyses. The
miR-34aCA/miR-150GA genotype (AOR, 5.470; 95% CI,
1.580–18.932) and the miR-150GA/miR-155TA genotype
(AOR, 3.265; 95% CI, 1.426–7.474) were both associated with an
increased prevalence of ischemic stroke (Table VI).
| Table VAllele combination analysis for the
microRNA polymorphisms in patients with ischemic stroke and
controls by MDR. |
Table V
Allele combination analysis for the
microRNA polymorphisms in patients with ischemic stroke and
controls by MDR.
|
Characteristics | Overall
(2n=2000) | Controls
(2n=808) | Stroke
patients
(2n=1192) | OR (95% CI) | P-valuea |
|---|
|
miR-34aC>A/miR-130aC>T/miR-150G>A/miR-155T>A |
| C-C-G-T | 0.341 | 0.341 | 0.344 | 1.000
(reference) | |
| C-C-G-A | 0.308 | 0.330 | 0.292 | 0.878
(0.704–1.095) | 0.260 |
| C-C-A-T | 0.013 | 0.014 | 0.008 | 0.610
(0.255–1.456) | 0.268 |
| C-C-A-A | 0.012 | 0.011 | 0.015 | 1.341
(0.594–3.030) | 0.552 |
| C-T-G-T | 0.037 | 0.042 | 0.033 | 0.789
(0.487–1.278) | 0.384 |
| C-T-G-A | 0.033 | 0.030 | 0.036 | 1.202
(0.713–2.026) | 0.516 |
| C-T-A-T | 0.003 | 0.001 | 0.004 | 3.354
(0.390–28.88) | 0.410 |
| C-T-A-A | 0.001 | 0.000 | 0.002 | 3.356
(0.160–70.22) | 0.519 |
| A-C-G-T | 0.119 | 0.113 | 0.119 | 1.047
(0.772–1.419) | 0.816 |
| A-C-G-A | 0.098 | 0.092 | 0.104 | 1.124
(0.811–1.557) | 0.510 |
| A-C-A-T | 0.000 | 0.000 | 0.005 | 8.725
(0.489–155.6) | 0.086 |
| A-C-A-A | 0.008 | 0.004 | 0.009 | 2.236
(0.610–8.200) | 0.263 |
| A-T-G-T | 0.022 | 0.016 | 0.028 | 1.703
(0.880–3.294) | 0.121 |
| A-T-G-A | 0.005 | 0.008 | 0.000 | 0.052
(0.003–0.921) | 0.004 |
| A-T-A-A | 0.000 | 0.000 | 0.002 | 3.356
(0.160–70.22) | 0.519 |
|
miR-34aC>A/miR-130aC>T/miR-150G>A |
| C-C-G | 0.650 | 0.670 | 0.637 | 1.000
(reference) | |
| C-C-A | 0.024 | 0.025 | 0.023 | 0.964
(0.535–1.737) | 1.000 |
| C-T-G | 0.070 | 0.072 | 0.069 | 1.010
(0.709–1.438) | 1.000 |
| C-T-A | 0.004 | 0.001 | 0.006 | 4.999
(0.613–40.77) | 0.150 |
| A-C-G | 0.216 | 0.205 | 0.222 | 1.143
(0.914–1.429) | 0.258 |
| A-C-A | 0.010 | 0.004 | 0.015 | 4.285
(1.255–14.62) | 0.013 |
| A-T-G | 0.027 | 0.023 | 0.029 | 1.315
(0.744–2.325) | 0.399 |
|
miR-34aC>A/miR-150G>A |
| C-G | 0.719 | 0.743 | 0.704 | 1.000
(reference) | |
| C-A | 0.029 | 0.026 | 0.030 | 1.226
(0.708–2.122) | 0.496 |
| A-G | 0.243 | 0.228 | 0.252 | 1.170
(0.947–1.445) | 0.149 |
| A-A | 0.009 | 0.004 | 0.014 | 3.814
(1.106–13.15) | 0.032 |
|
miR-150G>A/miR-155T>A |
| G-T | 0.520 | 0.512 | 0.528 | 1.000
(reference) | |
| G-A | 0.443 | 0.459 | 0.429 | 0.904
(0.754–1.085) | 0.285 |
| A-T | 0.016 | 0.014 | 0.014 | 0.876
(0.410–1.870) | 0.845 |
| A-A | 0.023 | 0.015 | 0.030 | 1.970
(1.013–3.831) | 0.049 |
| Table VICombined genotype analysis for the
microRNA polymorphisms in patients with ischemic stroke and
controls. |
Table VI
Combined genotype analysis for the
microRNA polymorphisms in patients with ischemic stroke and
controls.
| Genotype | Controls
(n=404) | Stroke
patients
(n=596) | AOR (95%
CI)a | P-valueb |
|---|
|
miR-34aC>A/miR-130aC>T |
| CC-CC | 193 (47.8) | 260 (43.6) | 1.000
(reference) | |
| CC-CT | 45 (11.1) | 57 (9.6) | 0.946
(0.601–1.488) | 0.809 |
| CC-TT | 1 (0.2) | 6 (1.0) | 4.979
(0.566–43.81) | 0.148 |
| CA-CC | 119 (29.5) | 187 (31.4) | 1.231
(0.904–1.675) | 0.187 |
| CA-CT | 23 (5.7) | 41 (6.9) | 1.245
(0.700–2.214) | 0.456 |
| CA-TT | 1 (0.2) | 1 (0.2) | 0.816
(0.050–13.29) | 0.887 |
| AA-CC | 16 (4.0) | 32 (5.4) | 1.405
(0.721–2.740) | 0.318 |
| AA-CT | 6 (1.5) | 12 (2.0) | 2.201
(0.752–6.445) | 0.150 |
|
miR-34aC>A/miR-150G>A |
| CC-GG | 220 (54.5) | 297 (49.8) | 1.000
(reference) | |
| CC-GA | 19 (4.7) | 26 (4.4) | 1.036
(0.543–1.977) | 0.915 |
| CA-GG | 140 (34.7) | 207 (34.7) | 1.134
(0.851–1.513) | 0.391 |
| CA-GA | 3 (0.7) | 22 (3.7) | 5.470
(1.580–18.93) | 0.007 |
| AA-GG | 20 (5.0) | 40 (6.7) | 1.570
(0.869–2.836) | 0.135 |
| AA-GA | 2 (0.5) | 4 (0.7) | 1.329
(0.220–8.028) | 0.757 |
|
miR-34aC>A/miR-155T>A |
| CC-TT | 64 (15.8) | 90 (15.1) | 1.000
(reference) | |
| CC-TA | 115 (28.5) | 166 (27.9) | 1.081
(0.706–1.653) | 0.721 |
| CC-AA | 60 (14.9) | 67 (11.2) | 0.834
(0.508–1.367) | 0.471 |
| CA-TT | 49 (12.1) | 63 (10.6) | 1.055
(0.624–1.784) | 0.841 |
| CA-TA | 65 (16.1) | 120 (20.1) | 1.428
(0.891–2.287) | 0.139 |
| CA-AA | 29 (7.2) | 46 (7.7) | 1.020
(0.561–1.855) | 0.949 |
| AA-TT | 4 (1.0) | 14 (2.3) | 3.351
(0.965–11.64) | 0.057 |
| AA-TA | 11 (2.7) | 25 (4.2) | 1.892
(0.820–4.366) | 0.135 |
| AA-AA | 7 (1.7) | 5 (0.8) | 0.347
(0.091–1.317) | 0.120 |
|
miR-130aC>T/miR-150G>A |
| CC-GG | 307 (76.0) | 438 (73.5) | 1.000
(reference) | |
| CC-GA | 21 (5.2) | 41 (6.9) | 1.308
(0.742–2.306) | 0.354 |
| CT-GG | 71 (17.6) | 101 (16.9) | 0.965
(0.679–1.371) | 0.841 |
| CT-GA | 3 (0.7) | 9 (1.5) | 2.292
(0.590–8.897) | 0.231 |
| TT-GG | 2 (0.5) | 5 (0.8) | 1.660
(0.311–8.879) | 0.553 |
|
miR-130aC>T/miR-155T>A |
| CC-TT | 91 (22.5) | 135 (22.7) | 1.000
(reference) | |
| CC-TA | 156 (38.6) | 243 (40.8) | 1.057
(0.745–1.499) | 0.757 |
| CC-AA | 81 (20.0) | 101 (16.9) | 0.747
(0.493–1.131) | 0.168 |
| CT-TT | 26 (6.4) | 29 (4.9) | 0.718
(0.384–1.344) | 0.301 |
| CT-TA | 33 (8.2) | 64 (10.7) | 1.217
(0.718–2.062) | 0.465 |
| CT-AA | 15 (3.7) | 17 (2.9) | 0.747
(0.345–1.618) | 0.459 |
| TT-TA | 2 (0.5) | 4 (0.7) | 1.395
(0.245–7.949) | 0.708 |
|
miR-150G>A/miR-155T>A |
| GG-TT | 109 (27.0) | 161 (27.0) | 1.000
(reference) | |
| GG-TA | 183 (45.3) | 273 (45.8) | 1.008
(0.730–1.392) | 0.962 |
| GG-AA | 88 (21.8) | 110 (18.5) | 0.796
(0.540–1.173) | 0.248 |
| GA-TT | 8 (2.0) | 6 (1.0) | 0.570
(0.181–1.799) | 0.338 |
| GA-TA | 8 (2.0) | 38 (6.4) | 3.265
(1.426–7.474) | 0.005 |
| GA-AA | 8 (2.0) | 8 (1.3) | 0.519
(0.176–1.534) | 0.236 |
The miR-130a genotype was associated with
fibrinogen levels (CC vs. CT vs. TT: CC, 411.65±124.83; CT,
462.34±147.50; TT, 429.80±94.44; P<0.001). The miR-150
dominant model (GG vs. GA+AA) was significantly associated with
increased platelet counts (GG vs. GA+AA: GG, 244.44±66.30; GA+AA,
266.53±58.58; P=0.002). The miR-155 recessive model (TT+TA
vs. AA) was associated with vitamin B12 (TT+TA vs. AA: TT+TA,
748.94±631.87; AA, 716.23±580.51; P= 0.030) and fibrinogen levels
(TT+TA vs. AA: TT+TA, 423.93±177.56; AA, 400.34±117.63; P=0.036),
and the miR-155 genotype was associated with antithrombin
levels (TT vs. TA vs. AA: TT, 97.42±39.69; TA, 91.92±17.99; AA,
92.29±16.25; P=0.049) (Table
VII).
| Table VIIClinical variables in patients with
ischemic stroke, stratified by the microRNA polymorphisms
status. |
Table VII
Clinical variables in patients with
ischemic stroke, stratified by the microRNA polymorphisms
status.
|
Characteristics | Vitamin B12 (pg/ml)
| Fibrinogen (mg/dl)
| Antithrombin(%)
| aPTT (sec)
| PT (sec)
|
PLT(103/ml)
|
|---|
| Mean ± SD | P-valuea | Mean ± SD | P-valuea | Mean ± SD | P-valuea | Mean ± SD | P-valuea | Mean ± SD | P-valuea | Mean ± SD | P-valuea |
|---|
| miR-34a
rs6577555C>A |
| CC | 768.51±716.83 | 0.990 | 424.43±132.54 | 0.850 | 92.85±18.53 | 0.836b | 31.54±13.80 | 0.714 | 11.93±3.32 | 0.595 | 245.87±81.18 | 0.929 |
| CA | 713.18±498.85 | | 416.72±129.65 | | 92.44±17.86 | | 31.46±7.57 | | 11.75±0.84 | | 245.88±73.65 | |
| AA | 752.24±692.82 | | 415.26±117.21 | | 105.02±70.81 | | 30.25±3.80 | | 11.92±0.97 | | 249.82±105.45 | |
| Dominant (CC vs.
CA+AA) | 719.16±532.37 | 0.226c | 416.49±127.54 | 0.430 | 94.46±32.87 | 0.770c | 31.27±7.12 | 0.508c | 11.77±0.86 | 0.647c | 246.47±79.10 | 0.908 |
| Recessive (CC+CA
vs. AA) | 752.24±692.82 | 0.945 | 415.26±117.21 | 0.754 | 105.02±70.81 | 0.557c | 30.25±3.80 | 0.614c | 11.92±0.97 | 0.304c | 249.82±105.45 | 0.771c |
| miR-130a
rs731384C>T |
| CC | 749.11±674.55 | 0.738 | 411.65±124.83 |
<0.001 | 93.69±27.86 | 0.860 | 31.54±12.24 | 0.789 | 11.87±2.81 | 0.957 | 244.89±71.00 | 0.943b |
| CT | 746.52±502.57 | | 462.34±147.50 | | 93.30±15.50 | | 30.98±6.55 | | 11.84±0.91 | | 246.99±87.54 | |
| TT | 563.89±167.02 | | 429.80±94.44 | | 88.00±10.56 | | 29.87±4.18 | | 11.64±0.61 | | 339.78±331.57 | |
| Dominant (CC vs.
CT+TT) | 738.01±493.35 | 0.848c | 461.05±145.66 | 0.0009c | 93.06±15.31 | 0.952c | 30.91±6.44 | 0.837c | 11.83±0.89 | 0.564c | 251.38±111.10 | 0.874c |
| Recessive (CC+CT
vs. TT) | 563.89±167.02 | 0.207c | 429.80±94.44 | 0.878 | 88.00±10.56 | 0.389c | 29.87±4.18 | 0.602c | 11.64±0.61 | 0.648c | 339.78±331.57 | 0.790c |
| miR-150
rs73056059G>A |
| GG | 748.05±660.94 | 0.738 | 418.79±129.21 | 0.116 | 93.59±26.44 | 0.948 | 31.49±11.75 | 0.563 | 11.86±2.65 | 0.698 | 244.44±66.30 | 0.002 |
| GA | 733.68±365.56 | | 444.18±141.02 | | 93.36±19.96 | | 30.65±5.18 | | 11.98±1.06 | | 266.53±58.58 | |
| AA | N/A | | N/A | | N/A | | N/A | | N/A | | N/A | |
| Dominant (GG vs.
GA+AA) | 733.68±365.56 | 0.298c | 444.18±141.02 | 0.163 | 93.36±19.96 | 0.808c | 30.65±5.18 | 0.751c | 11.98±1.06 | 0.219c | 266.53±58.58 | 0.002 |
| Recessive (GG+GA
vs. AA) | N/A | N/A | N/A | N/A | N/A | N/A | N/A | N/A | N/A | N/A | N/A | N/A |
| miR-155
rs767649T>A |
| TT | 725.86±550.21 | 0.287 | 415.63±129.13 | 0.055 | 97.42±39.69 | 0.049 | 31.20±6.75 | 0.757 | 11.74±0.75 | 0.356b | 242.93±65.56 | 0.632 |
| TA | 772.02±713.53 | | 432.23±134.92 | | 91.92±17.99 | | 31.70±14.51 | | 11.78±1.02 | | 248.47±91.67 | |
| AA | 716.23±580.51 | | 400.34±117.63 | | 92.29±16.25 | | 31.04±6.74 | | 12.23±5.27 | | 244.90±68.49 | |
| Dominant (TT vs.
TA+AA) | 755.38±676.66 | 0.620c | 423.01±130.84 | 0.505 | 92.03±17.47 | 0.157c | 31.50±12.73 | 0.936c | 11.91±2.98 | 0.700c | 247.40±85.37 | 0.319c |
| Recessive (TT+TA
vs. AA) | 716.23±580.51 |
0.030c | 400.34±117.63 | 0.036 | 92.29±16.25 | 0.644c | 31.04±6.74 | 0.445c | 12.23±5.27 | 0.151c | 244.90±68.49 | 0.570c |
The association between the miRNA polymorphisms and
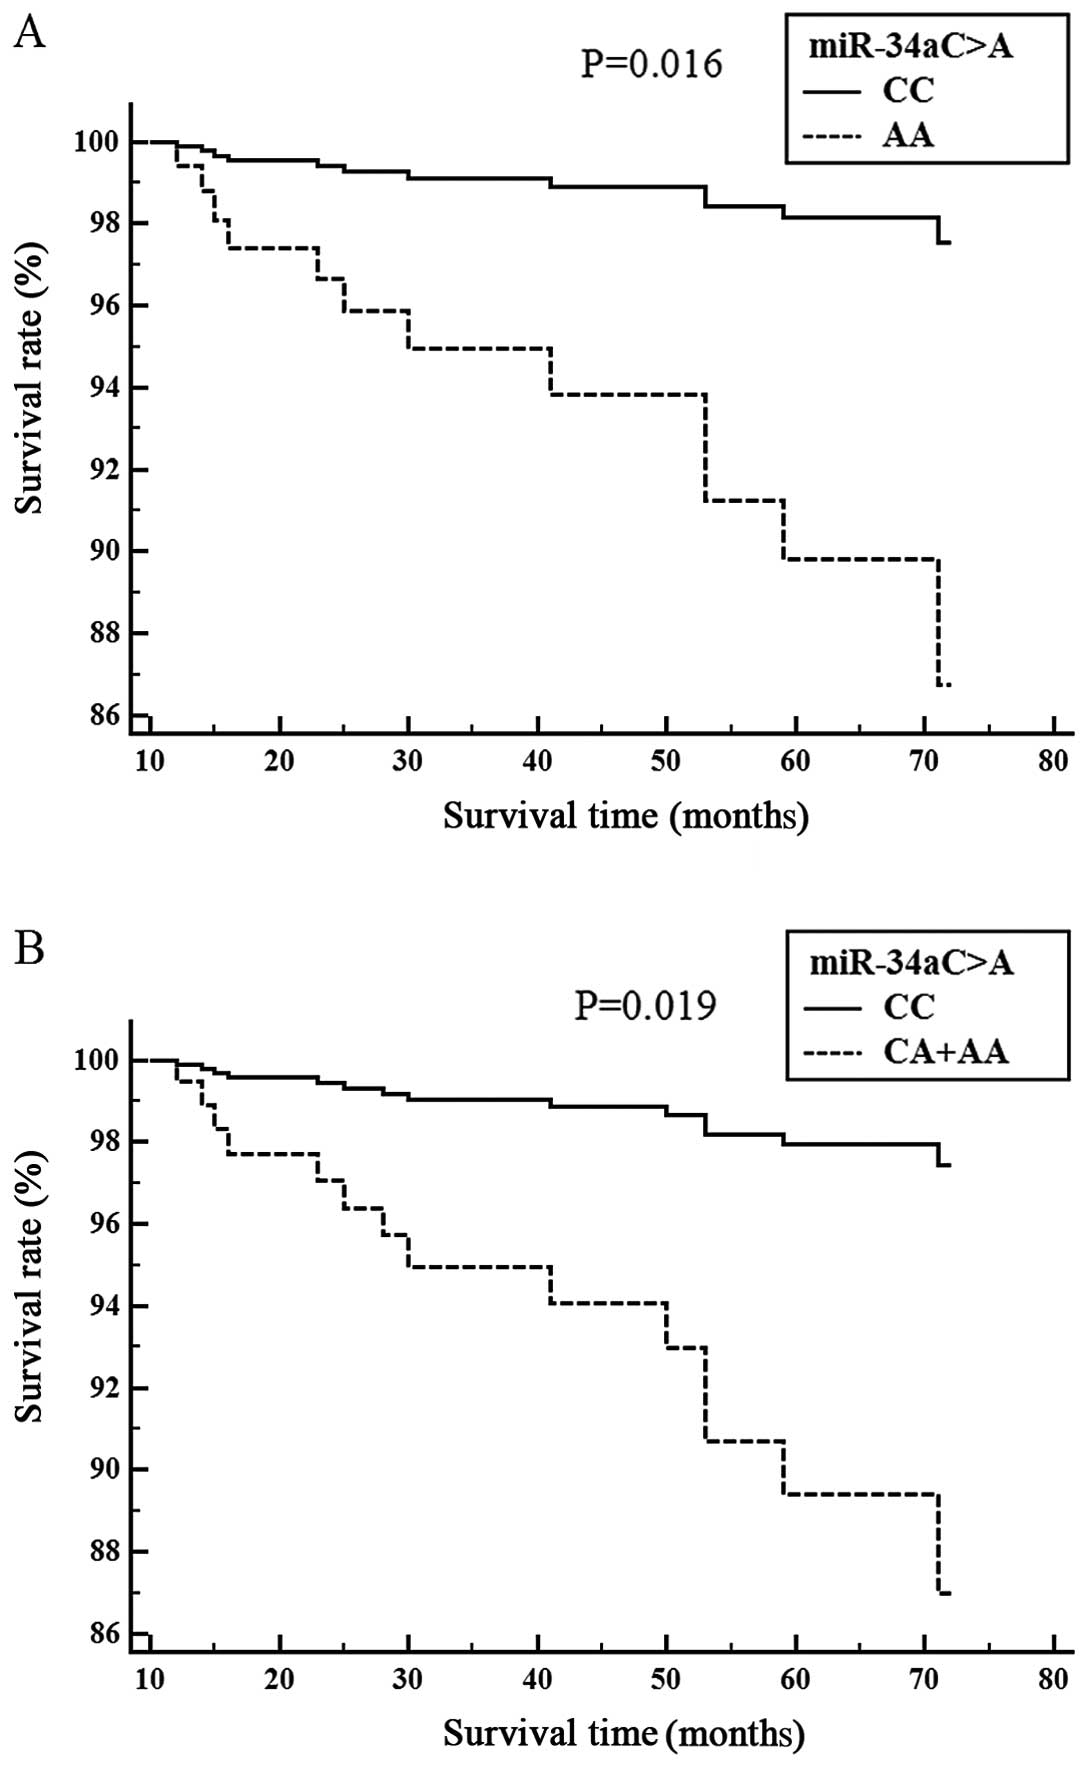
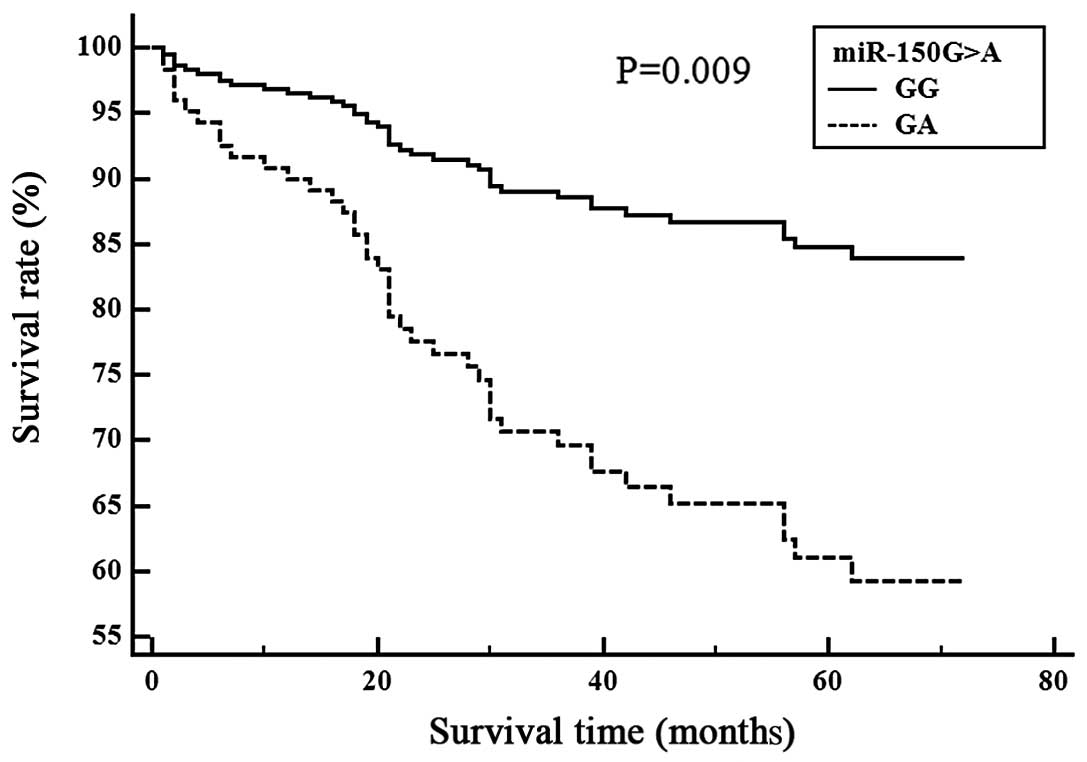
ischemic stroke patient survival is shown (Figs. 1 and 2). Cox proportional analysis indicated
that the miR-34aCA genotype was significantly associated
with survival in the SVD subgroup (CC vs. CA, P=0.016) (Fig. 1A), (CC vs. CA+AA, P=0.019)
(Fig. 1B). The miR-150GA
genotype was associated with survival in the LAD subgroup (GG vs.
GA, P=0.009) (Fig. 2). We then
investigated the promoter binding site for the miR-150
polymorphism.
Discussion
In this study, we selected a few potentially
relevant miRNA SNPs, miR-34a rs6577555C>A,
miR-130a rs731384C>T, miR-150 rs73056059G>A and
miR-155 rs767649T>A, and investigated their association
with ischemic stroke in a Korean population. We found that the
miR-150G>A polymorphism may be associated with a
susceptibility for LAD and CE ischemic stroke. In the
gene-environment interaction analysis, the miR-150GA+AA
genotype combined with hyperlipidemia or smoking exhibited a
significantly higher prevalence of ischemic stroke. In the allelic
combination analysis, the A-A allele (miR-34aC>A and
miR-150G>A) significantly increased ischemic stroke
prevalence overall. In particular, subjects with the
miR-150A allele exhibited a marked increase in ischemic
stroke incidence, whereas subjects with the miR-150G allele
had a decreased prevalence of ischemic stroke. These data were
confirmed in combination analysis, where the miR-150GA
genotype also exhibited an increased prevalence of ischemic stroke.
The miR-150GA genotype was also associated with a high
adjusted HR in the survival analysis in both the overall ischemic
stroke patients and the LAD and CE subtypes. Additionally, subjects
with the miR-150GA genotype had significantly higher
platelet counts.
miRNAs play crucial roles in a number of
physiological and pathological processes, including
neurodegenerative diseases (25),
epigenetics (26,27), coronary artery disease (28), metabolism (14), tumorigenesis (29,30), angiogenesis and colonization
(31). miRNAs play roles in
oncogenesis, heart disease and nervous system function. It has been
suggested that miRNAs may be used as biomarkers for cardiovascular
diseases, including coronary artery disease, stroke, acute
myocardial infarction and heart failure (17,32–34).
miR-34a regulates the myeloblastosis
transcription factor MYB (35);
miR-130a regulates V-maf avian musculoaponeurotic
fibrosarcoma oncogene homolog B (MAFB) (36); miR-150 regulates c-MYB
(37); and miR-155
regulates V-Ets avian erythroblastosis virus E26 oncogene homolog-1
(ETS-1) and Meis homeobox-1 (MEIS-1) (38). Previous studies have reported that
these genes contribute to suppressing megakaryocytopoiesis and
megakaryocyte differentiation (36,39,40). MKs are platelet precursors, and
excessive MK differentiation results in abnormal platelet
production. Studies have been carried out investigating the causal
association between increased platelets and ischemic stroke risk
(41–43).
We then searched for transcription factors that
could potentially bind the miR-150 promoter near the
rs73056059G>A nucleotide. For the A allele, we found an
additional transcription binding site for LyF-1 and YY-1, which
could alter miR-150 levels (44). Transcription factor YY1 is
associated with increased promoter activity (45–47); therefore, we hypothesize that
miR-150 expression is increased by YY1 in subjects with an A
allele. Supporting this hypothesis, we performed an ANOVA, which
indicated that the miR-150GA genotype had higher platelet
counts than the GG type. However, we were unable to directly
measure promoter activity for each miRNA polymorphisms in the
present study.
This study has several limitations. First, it is not
yet clear which genetic polymorphisms predict the ischemic stroke
phenotypes. This study population included only Korean individuals,
and our findings need to be validated in other ethnic groups.
Second, the patient population included in the subgroup analyses
was relatively small. Future studies would need to include
>1,000 individuals from an ethnically homogeneous population. As
Koreans have a low degree of interracial marriage, this should be
sufficient to provide reliable data. Third, the controls included
in our study were not subjected to stringent inclusion criteria, as
the enrollment rate was relatively low compared to that of stroke
patients. Therefore, we could not clearly identify the casual
effects of vascular risk factors in these subjects. Lastly, our
results cannot be extrapolated to other ethnic groups, as racial
variations in the allelic frequency could produce different
results.
In conclusion, in this study, we identified a
significant association between the miR-150G>A
polymorphism and ischemic stroke in Korean individuals. This study
demonstrates that the miR-150GA genotype occurs at a higher
frequency in stroke patients, which suggests that miR-150
may play a role in the prevalence of ischemic stroke. Therefore,
our findings suggest that miR-150 polymorphisms may
contribute to ischemic stroke and may potentially act as biomarkers
for the diagnosis and the risk of ischemic stroke. To the best of
our knowledge, this is the first study to evaluate the association
between miRNA polymorphisms (miR-34aC>A,
miR-130aC>T, miR-150G>A and
miR-155T>A) and ischemic stroke in a Korean population.
Therefore, further studies on miRNA polymorphisms in other racial
or ethnic populations are required in order to fully elucidate
their role in the risk of ischemic stroke.
Acknowledgments
This study was supported by the National Research
Foundation of Korea Grant funded by the Korean Government
(NRF-2013R1A1A2008177 and NRF-2014R1A1A2059118).
References
|
1
|
Donnan GA, Fisher M, Macleod M and Davis
SM: Stroke. Lancet. 371:1612–1623. 2008. View Article : Google Scholar : PubMed/NCBI
|
|
2
|
Goldstein LB, Adams R, Becker K, Furberg
CD, Gorelick PB, Hademenos G, Hill M, Howard G, Howard VJ, Jacobs
B, et al: Primary prevention of ischemic stroke: A statement for
healthcare professionals from the Stroke Council of the American
Heart Association. Circulation. 103:163–182. 2001. View Article : Google Scholar : PubMed/NCBI
|
|
3
|
Mustacchi P: Risk factors in stroke. West
J Med. 143:186–192. 1985.PubMed/NCBI
|
|
4
|
Arboix A: Cardiovascular risk factors for
acute stroke: Risk profiles in the different subtypes of ischemic
stroke. World J Clin Cases. 3:418–429. 2015. View Article : Google Scholar : PubMed/NCBI
|
|
5
|
Mohr JP, Caplan LR, Melski JW, Goldstein
RJ, Duncan GW, Kistler JP, Pessin MS and Bleich HL: The Harvard
Cooperative Stroke Registry: A prospective registry. Neurology.
28:754–762. 1978. View Article : Google Scholar : PubMed/NCBI
|
|
6
|
Cosemans JM, Angelillo-Scherrer A,
Mattheij NJ and Heemskerk JW: The effects of arterial flow on
platelet activation, thrombus growth, and stabilization. Cardiovasc
Res. 99:342–352. 2013. View Article : Google Scholar : PubMed/NCBI
|
|
7
|
Shah AB, Beamer N and Coull BM: Enhanced
in vivo platelet activation in subtypes of ischemic stroke. Stroke.
16:643–647. 1985. View Article : Google Scholar : PubMed/NCBI
|
|
8
|
Sharma SC, Vijayan GP, Suri ML and Seth
HN: Platelet adhesiveness in young patients with ischaemic stroke.
J Clin Pathol. 30:649–652. 1977. View Article : Google Scholar : PubMed/NCBI
|
|
9
|
O'Malley T, Langhorne P, Elton RA and
Stewart C: Platelet size in stroke patients. Stroke. 26:995–999.
1995. View Article : Google Scholar : PubMed/NCBI
|
|
10
|
George JN: Platelets. Lancet.
355:1531–1539. 2000. View Article : Google Scholar : PubMed/NCBI
|
|
11
|
Pease DC: An electron microscopic study of
red bone marrow. Blood. 11:501–526. 1956.PubMed/NCBI
|
|
12
|
Ambros V: The functions of animal
microRNAs. Nature. 431:350–355. 2004. View Article : Google Scholar : PubMed/NCBI
|
|
13
|
Bartel DP: MicroRNAs: Target recognition
and regulatory functions. Cell. 136:215–233. 2009. View Article : Google Scholar : PubMed/NCBI
|
|
14
|
Aumiller V and Forstemann K: Roles of
microRNAs beyond development - metabolism and neural plasticity.
Biochim Biophys Acta. 692–696:2008.1779
|
|
15
|
Merkerova M, Belickova M and Bruchova H:
Differential expression of microRNAs in hematopoietic cell
lineages. Eur J Haematol. 81:304–310. 2008. View Article : Google Scholar : PubMed/NCBI
|
|
16
|
Carissimi C, Fulci V and Macino G:
MicroRNAs: Novel regulators of immunity. Autoimmun Rev. 8:520–524.
2009. View Article : Google Scholar : PubMed/NCBI
|
|
17
|
Tan KS, Armugam A, Sepramaniam S, Lim KY,
Setyowati KD, Wang CW and Jeyaseelan K: Expression profile of
MicroRNAs in young stroke patients. PLoS One. 4:e76892009.
View Article : Google Scholar : PubMed/NCBI
|
|
18
|
Liu DZ, Tian Y, Ander BP, Xu H, Stamova
BS, Zhan X, Turner RJ, Jickling G and Sharp FR: Brain and blood
microRNA expression profiling of ischemic stroke, intracerebral
hemorrhage, and kainate seizures. J Cereb Blood Flow Metab.
30:92–101. 2010. View Article : Google Scholar
|
|
19
|
Jeon YJ, Kim OJ, Kim SY, Oh SH, Oh D, Kim
OJ, Shin BS and Kim NK: Association of the miR-146a, miR-149,
miR-196a2, and miR-499 polymorphisms with ischemic stroke and
silent brain infarction risk. Arterioscler Thromb Vasc Biol.
33:420–430. 2013. View Article : Google Scholar
|
|
20
|
Edelstein LC and Bray PF: MicroRNAs in
platelet production and activation. Blood. 117:5289–5296. 2011.
View Article : Google Scholar : PubMed/NCBI
|
|
21
|
Dangwal S and Thum T: MicroRNAs in
platelet biogenesis and function. Thromb Haemost. 108:599–604.
2012. View Article : Google Scholar : PubMed/NCBI
|
|
22
|
Goldstein LB, Jones MR, Matchar DB,
Edwards LJ, Hoff J, Chilukuri V, Armstrong SB and Horner RD:
Improving the reliability of stroke subgroup classification using
the Trial of ORG 10172 in Acute Stroke Treatment (TOAST) criteria.
Stroke. 32:1091–1098. 2001. View Article : Google Scholar : PubMed/NCBI
|
|
23
|
Kim OJ, Hong SH, Oh SH, Kim TG, Min KT, Oh
D and Kim NK: Association between VEGF polymorphisms and
homocysteine levels in patients with ischemic stroke and silent
brain infarction. Stroke. 42:2393–2402. 2011. View Article : Google Scholar : PubMed/NCBI
|
|
24
|
Jeon YJ, Kim YR, Lee BE, Choi YS, Kim JH,
Shin JE, Rah H, Cha SH, Lee WS and Kim NK: Genetic association of
five plasminogen activator inhibitor-1 (PAI-1) polymorphisms and
idiopathic recurrent pregnancy loss in Korean women. Thromb
Haemost. 110:742–750. 2013. View Article : Google Scholar : PubMed/NCBI
|
|
25
|
Bushati N and Cohen SM: MicroRNAs in
neurodegeneration. Curr Opin Neurobiol. 18:292–296. 2008.
View Article : Google Scholar : PubMed/NCBI
|
|
26
|
Chuang JC and Jones PA: Epigenetics and
microRNAs. Pediatr Res. 61:24R–29R. 2007. View Article : Google Scholar : PubMed/NCBI
|
|
27
|
Saetrom P, Snøve O Jr and Rossi JJ:
Epigenetics and microRNAs. Pediatr Res. 61:17R–23R. 2007.
View Article : Google Scholar : PubMed/NCBI
|
|
28
|
Gao H, Guddeti RR, Matsuzawa Y, Liu LP, Su
LX, Guo D, Nie SP, Du J and Zhang M: Plasma levels of microRNA-145
are associated with severity of coronary artery disease. PLoS One.
10:e01234772015. View Article : Google Scholar : PubMed/NCBI
|
|
29
|
Lujambio A and Esteller M: CpG island
hypermethylation of tumor suppressor microRNAs in human cancer.
Cell Cycle. 6:1455–1459. 2007. View Article : Google Scholar : PubMed/NCBI
|
|
30
|
Lu J, Getz G, Miska EA, Alvarez-Saavedra
E, Lamb J, Peck D, Sweet-Cordero A, Ebert BL, Mak RH, Ferrando AA,
et al: MicroRNA expression profiles classify human cancers. Nature.
435:834–838. 2005. View Article : Google Scholar : PubMed/NCBI
|
|
31
|
Zhang H, Li Y and Lai M: The microRNA
network and tumor metastasis. Oncogene. 29:937–948. 2010.
View Article : Google Scholar
|
|
32
|
Jeyaseelan K, Lim KY and Armugam A:
MicroRNA expression in the blood and brain of rats subjected to
transient focal ischemia by middle cerebral artery occlusion.
Stroke. 39:959–966. 2008. View Article : Google Scholar : PubMed/NCBI
|
|
33
|
Fichtlscherer S, De Rosa S, Fox H,
Schwietz T, Fischer A, Liebetrau C, Weber M, Hamm CW, Röxe T,
Müller-Ardogan M, et al: Circulating microRNAs in patients with
coronary artery disease. Circ Res. 107:677–684. 2010. View Article : Google Scholar : PubMed/NCBI
|
|
34
|
Laterza OF, Lim L, Garrett-Engele PW,
Vlasakova K, Muniappa N, Tanaka WK, Johnson JM, Sina JF, Fare TL,
Sistare FD and Glaab WE: Plasma microRNAs as sensitive and specific
biomarkers of tissue injury. Clin Chem. 55:1977–1983. 2009.
View Article : Google Scholar : PubMed/NCBI
|
|
35
|
Navarro F, Gutman D, Meire E, Cáceres M,
Rigoutsos I, Bentwich Z and Lieberman J: miR-34a contributes to
megakaryocytic differentiation of K562 cells independently of p53.
Blood. 114:2181–2192. 2009. View Article : Google Scholar : PubMed/NCBI
|
|
36
|
Garzon R, Pichiorri F, Palumbo T, Iuliano
R, Cimmino A, Aqeilan R, Volinia S, Bhatt D, Alder H, Marcucci G,
et al: MicroRNA fingerprints during human megakaryocytopoiesis.
Proc Natl Acad Sci USA. 103:5078–5083. 2006. View Article : Google Scholar : PubMed/NCBI
|
|
37
|
Barroga CF, Pham H and Kaushansky K:
Thrombopoietin regulates c-Myb expression by modulating micro RNA
150 expression. Exp Hematol. 36:1585–1592. 2008. View Article : Google Scholar : PubMed/NCBI
|
|
38
|
Georgantas RW III, Hildreth R, Morisot S,
Alder J, Liu CG, Heimfeld S, Calin GA, Croce CM and Civin CI:
CD34+ hematopoietic stem-progenitor cell microRNA
expression and function: A circuit diagram of differentiation
control. Proc Natl Acad Sci USA. 104:2750–2755. 2007. View Article : Google Scholar
|
|
39
|
Ramsay RG: c-Myb a stem-progenitor cell
regulator in multiple tissue compartments. Growth Factors.
23:253–261. 2005. View Article : Google Scholar : PubMed/NCBI
|
|
40
|
Lu J, Guo S, Ebert BL, Zhang H, Peng X,
Bosco J, Pretz J, Schlanger R, Wang JY, Mak RH, et al:
MicroRNA-mediated control of cell fate in megakaryocyte-erythrocyte
progenitors. Dev Cell. 14:843–853. 2008. View Article : Google Scholar : PubMed/NCBI
|
|
41
|
Barnett HJ: Platelet and coagulation
function in relation to thromboembolic stroke. Adv Neurol.
16:45–70. 1977.PubMed/NCBI
|
|
42
|
Kalendovsky Z, Austin J and Steele P:
Increased platelet aggregability in young patients with stroke.
Diagnosis and therapy. Arch Neurol. 32:13–20. 1975. View Article : Google Scholar : PubMed/NCBI
|
|
43
|
van Rooy MJ and Pretorius E: Metabolic
syndrome, platelet activation and the development of transient
ischemic attack or thromboembolic stroke. Thromb Res. 135:434–442.
2015. View Article : Google Scholar : PubMed/NCBI
|
|
44
|
Grabe N: AliBaba2: Context specific
identification of transcription factor binding sites. In Silico
Biol. 2:S1–S15. 2002.PubMed/NCBI
|
|
45
|
Momoeda M, Kawase M, Jane SM, Miyamura K,
Young NS and Kajigaya S: The transcriptional regulator YY1 binds to
the 5′-terminal region of B19 parvovirus and regulates P6 promoter
activity. J Virol. 68:7159–7168. 1994.
|
|
46
|
Lee GR: Role of YY1 in long-range
chromosomal interactions regulating Th2 cytokine expression.
Transcription. 5:e279762014. View Article : Google Scholar
|
|
47
|
Funahashi N, Hirota Y, Nakagawa K, Sawada
N, Watanabe M, Suhara Y and Okano T: YY1 positively regulates human
UBIAD1 expression. Biochem Biophys Res Commun. 460:238–244. 2015.
View Article : Google Scholar : PubMed/NCBI
|