Introduction
Nitrogen-containing bisphosphonates (N-BPs) are the
most commonly used anti-resorptive agents in the treatment of
bone-related diseases, such as osteoporosis and metastatic bone
diseases (1). Due to their
ability to bind and chelate calcium, N-BPs are preferentially
localized to the bone matrix comprised of calcium-enriched
inorganic hydroxyapatite (2).
N-BPs exert their anti-resorptive effects by nullifying the
functions of osteoclasts, the only bone-resorbing cells in the
body; N-BPs are taken up by osteoclasts, as these cells resorb
bone. Clinical studies suggest that N-BPs have side-effects on
tissues other than bone, such as epithelial tissues (3). Indeed, gastrointestinal (GI)
toxicity is one of the major side-effects of BP and a leading cause
of therapy termination during N-BP clinical trials (4). Esophageal/oral inflammation and
ulceration are frequently noted in N-BP-users (5,6).
These studies suggest that N-BP may have direct effects on
epithelial cells.
The epithelium is also known to be highly enriched
in calcium contents, such that the concentration of calcium
gradually increases from the basal to the outer layers (7). We previously found that N-BPs
localize not only to bone, but also to the epithelium, as
demonstrated by fluorescently-labeled N-BPs in osteomucosal tissue
constructs (8). We also reported
that N-BPs inhibit proliferation by inducing cell cycle arrest at
the S phase without inducing the apoptosis of normal human oral
keratinocytes (NHOKs) (9).
Nonetheless, the molecular mechanisms underlying the suppressive
effects of N-BPs on the proliferation of keratinocytes remain
unclear.
In our continual efforts to elucidate the molecular
mechanisms of N-BP on NHOKs, in this study, we performed gene
expression profiling with DNA microarray on NHOKs treated with
either pamidronate (PAM) or zoledronate (ZOL), two of which are the
most frequently used N-BPs in clinical practice. Using this
high-throughput approach, we identified and validated cyclin A2 as
one of the bisphosphonate target genes associated with S phase cell
cycle arrest and the inhibition of cell proliferation.
Materials and methods
Cells and cell culture
Primary NHOKs and normal human oral fibroblasts
(NHOFs) were obtained according to previously described methods
(9) following the approval of the
Institutional Review Board (IRB# 04-060-04). Briefly, discarded
oral mucosal tissues were collected without identifiers from the
normal patients who are undergoing routine dental procedures (e.g.,
gingivectomy for the crown-lengthening procedures). The obtained
oral mucosal tissues were cut into 25 mm2 × 0.5 mm
sections and incubated in 2.5 mg/ml dispase solution (Cat. no.
17105; Gibco, Grand Island, NY, USA) in 37°C for 1 h, after which
the epithelial layers and connective layers were separated. The
separated epithelial layers were minced and subjected to trypsin
digestion (Cat. no. 25200056; Gibco) in 37°C for 5 min to harvest
the NHOKs. The separated connective tissue layers were minced and
subjected to collagenase digestion (Cat. no. 17100017; Gibco) in
37°C for1 h to harvest the NHOFs. The NHOKs were cultured in
EpiLife supplemented with human keratinocyte growth supplement
(HKGS) (Cascade Biologics, Portland, OR, USA), and the NHOFs were
cultured in DMEM supplemented with 10% FBS (Invitrogen, Carlsbad,
CA, USA). ZOL and PAM were purchased from LKT Laboratories, Inc.
(St. Paul, MN, USA). Throughout the study, 1, 2, and 4 µM of
ZOL and 10, 20 and 50 µM of PAM were used to treat the cells
for the indicated periods of time.
DNA microarray
Gene expression profiling was performed using the
Affymetrix GeneChip Human Genome U133 Plus 2.0 Array (Affymetrix,
Santa Clara, CA, USA). Total RNA was extracted from the cells using
the RNeasy mini kit (Qiagen, Hilden, Germany) according to the
manufacture's instructions. RNA integrity was evaluated using an
Agilent 2100 Bioanalyzer (Agilent Technologies, Palo Alto, CA, USA)
and the purity/concentration was determined using a NanoDrop 8000
spectrophotometer (NanoDrop Products, Wilmington, DE, USA).
Microarray experiments were performed at UCLA Clinical MIcroarray
Core (CMC). Microarray targets were prepared using NuGEN WT-Ovation
Formalin-Fixed Paraffin-Embedded RNA Amplification System and
FL-Ovation cDNA Biotin Module V2 (NuGEN Technologies, San Carlos,
CA, USA) and then hybridized to the array, all according to the
manufacturers' instructions. The arrays were washed and stained
with streptavidin phycoerythrin in Affymetrix Fluidics Station 450
using the Affymetrix GeneChip protocol, and then scanned using an
Affymetrix GeneChip Scanner 3000. The acquisition and initial
quantification of array images were conducted using the AGCC
software (Affymetrix). The subsequent data analyses were performed
using Partek Genomics Suite Version 6.4 (Partek, St. Louis, MO,
USA). Differentially expressed genes were selected at ≥2-fold and
P<0.005. Ingenuity Pathway Analysis was also performed by the
UCLA CMC laboratory.
Conventional and reverse
transcription-quantitative PCR (RT-qPCR)
Total RNA was isolated from the cultured cells using
TRIzol™ reagent (Invitrogen) and was then subjected to RNases-free
DNase I digestion at 37°C for 2 h to eliminate any genomic DNA
contamination. DNA-free total RNA (5 µg) was dissolved in 15
µl diethylpyro-carbonate-treated water, and the reverse
transcription reaction was performed in First-Strand buffer
containing 300 U SuperScript II (both from Invitrogen) with 10 mM
DTT and 0.5 µg random hexamer (Promega, Madison, WI, USA)
and 125 µM deoxynucleoside triphosphates. The annealing
reaction was carried out for 5 min at 65°C, and complementary DNA
synthesis was performed for 2 h at 37°C, followed by incubation for
15 min at 70°C to terminate the enzyme reaction. The reverse
transcription product was diluted with 70 µl H2O.
Conventional PCR was performed in triplicate for each 2 µl
cDNA and the resultant PCR amplicants were visualized by running
the agarose gel. Quantitative (real-time) (qPCR) was performed in
triplicate for each 1 µl cDNA sample with LC480 SYBR-Green I
master using universal cycling conditions on LightCycler 480 from
Roche (Indianapolis, IN, USA). A total of 45 cycles were executed,
and the second derivative Cq value determination method was used to
compare fold differences. The primer sequences were obtained from
the Universal Probe Library (Roche). The following primers were
used for PCR amplification: glyceraldehyde 3-phosphate
dehydrogenase (GAPDH) primers, 5′-GAC CCC ATT GAC CTC AAC-3′
(forward) and 5′-CTT CTC CAT GGT GGT GAA GA-3′ (reverse); and
cyclin A2 primers, 5′-GAG GAC CAG GAG AAT ATC AAC CCG G-3′
(forward) and 5′-AGC CAG GGC ATC TTC ACG CTC TAT T-3′ (reverse).
RT-qPCR was also performed to confirm the data obtained from
microarray analyses as described above and using the primer
sequences listed in Table I.
 | Table IPrimer sequences used for PCR. |
Table I
Primer sequences used for PCR.
| Gene | Forward primer | Reverse primer |
|---|
| CDC2 |
5′-tggatctgaagaaatacttggattcta-3′ |
5′-caatcccctgtaggatttgg-3′ |
| CDC6 |
5′-cctgttctcctcgtgtaaaagc-3′ |
5′-gtgttgcataggttgtcatcg-3′ |
| CDC20 |
5′-cattcgcatctggaatgtgt-3′ |
5′-gagaccagaggatggagcac-3′ |
| E2F8 |
5′-aatgacatctgccttgacga-3′ |
5′-gtaaatgcgtcgacgttcaa-3′ |
| CCNA2 |
5′-ggtactgaagtccgggaacc-3′ |
5′-gaagatccttaaggggtgcaa-3′ |
| CCNB1 |
5′-catggtgcactttcctcctt-3′ |
5′-aggtaatgttgtagagttggtgtcc-3′ |
| MMP10 |
5′-caaaagaggaggactccaaca-3′ |
5′-ttcacatccttttcgaggttg-3′ |
| LCE3D |
5′-ctcctctgcacctggacaa-3′ |
5′-cacttgggtgagggacactt-3′ |
| LCE3E |
5′-acgcatgccttcccatatac-3′ |
5′-gagctcagatcccccacag-3′ |
| MAFB |
5′-gcaggtataaacgcgtccag-3′ |
5′-tgaatgagctgcgtcttctc-3′ |
| IFIT1 |
5′-tggcagaagcccagacttac-3′ |
5′-agggatttgaaagcttcttgc-3′ |
| SLITRK6 |
5′-agctccagcctgatatggag-3′ |
5′-ttccattaacttcagctcttcgt-3′ |
Western blot analysis
The cells were lysed and subjected to western blot
analysis as previously described (9). Briefly, the cells were washed twice
with PBS prior to treatment with ice-cold lysis buffer (20 mM
Tris-HCl, pH 7.4, 150 mM NaCl, 5 mM EDTA and 1% Triton X-100). The
cells were then scraped and incubated on ice for 10 min. Cell
debris was separated by centrifugation at 20,000 × g at 4°C for 20
min and the supernatant was collected for western blot analysis
after being subjected to 8 or 10% SDS-PAGE. Following
electrophoresis, the proteins were transferred onto immobilized
membranes (Millipore, Billerica, MA, USA), which were subsequently
blocked with 5% non-fat milk for 1 h at room temperature. The
membranes were then incubated with primary antibodies, and probed
with the respective secondary antibodies conjugated with HRP. The
signals were obtained using ChemiDoc XRS system (Bio-Rad, Hercules,
CA, USA). The following primary antibodies were used: cyclin A2
(C-19), cyclin D1 (C-20; sc-717), Cdk6 (C-21; sc-117), Cdk2 (M2;
sc-163) and β-actin (I-19; sc-1616) (all from Santa Cruz
Biotechnology, Inc., Santa Cruz, CA, USA); and proliferating cell
nuclear antigen (PCNA) (Ab-1; NA03-200UG) from Oncogene Research
Product (Boston, MA, USA).
Analysis of BP-responsive reporter
activity
The cyclin A2-promoter luciferase reporter vector
(pGL3-cyclinA2p) was constructed by inserting a region of the
cyclin A2 promoter (-516 to +92) into the pGL3-basic plasmid
(Promega). Briefly, the cyclin A2 promoter was PCR-amplified from
the pALUC-cyclin A2 reporter plasmid, kindly provided by Dr
Berthold Henglein (Institut National de la Santé et de la Recherche
Médicale, Paris, France). The 608 bp cyclin A2 promoter region was
cloned into the cloning vector, cut out by double-digesting with
SacI (New England Biolabs, Beverly, MA, USA) and XhoI
(Invitrogen), and ligated into the pGL3-basic plasmid. The correct
sequence was confirmed using sequencing analysis. The cells were
transfected with 1 µg of either pGL3-basic or pGL3-cyclinA2p
using Lipofectamine 2000 (Invitrogen). The pRL-SV40 plasmid (0.005
µg/well) containing the Renilla luciferase gene
driven by the SV40 promoter was co-transfected as a control. After
48 h, the cells were harvested, and luciferase activity was
measured using the Dual Luciferase Reporter assay system using a
luminometer (both from Promega). The experiment was performed in
triplicate.
Organotypic 3-dimensional (3D) raft
cultures
The cells were grown as organotypic raft cultures
using previously established techniques (9). Briefly, 1×10⁶ cells were
seeded on the submucosal equivalents consisting of type I collagen
and NHOFs. The cells were grown to confluence, submerged in culture
medium, and then exposed to the liquid-air interface by lowering
the medium level. The cultures were maintained in this 'rafting'
fashion for 14 days and were harvested by fixing in 10% buffered
formalin. Subsequently, hematoxylin and eosin (H&E) staining
was performed on 6-µm-thick sagittal sections of each
reconstructs to reveal the histological features. Sample
processing, paraffin embedding, sectioning and H&E staining
were performed at the Translational Pathology Core Laboratory at
UCLA.
Immunohistochemical (IHC) staining
IHC staining was performed on the organotypic raft
culture samples as previously described (9). Cyclin A2 expression was determined
in bisphosphonate-treated or -untreated oral mucosal tissue samples
from raft cultures, which were formalin-fixed, paraffin-embedded
and sectioned. The specimens were subjected to IHC analysis for the
expression of cyclin A2 (C-19; Santa Cruz Biotechnology, Inc.) at
1:200 concentrations. Stained tissues were developed using the
3,3′-diaminobenzidine (DAB) chromogen substrate (Vector
Laboratories, Inc., Burlingame, CA, USA). The samples were
counterstained with hematoxylin.
Statistical analysis
The results are expressed as the means ± standard
deviation. For the comparison, the outcome measurements were
compared to the control group using the Student's t-test. Values of
p<0.05 are considered significant.
Results
Gene expression profiling in ZOL or
PAM-treated NHOKs
Previously, we demonstrated that N-BPs inhibit
proliferation without causing the apoptosis of NHOKs (9). In this study, to elucidate the
mechanisms through which N-BPs inhibit cell proliferation, we
performed gene expression profiling using NHOKs treated with PAM or
ZOL at concentrations that cause a significant loss of
proliferation (data not shown). We used various concentrations of
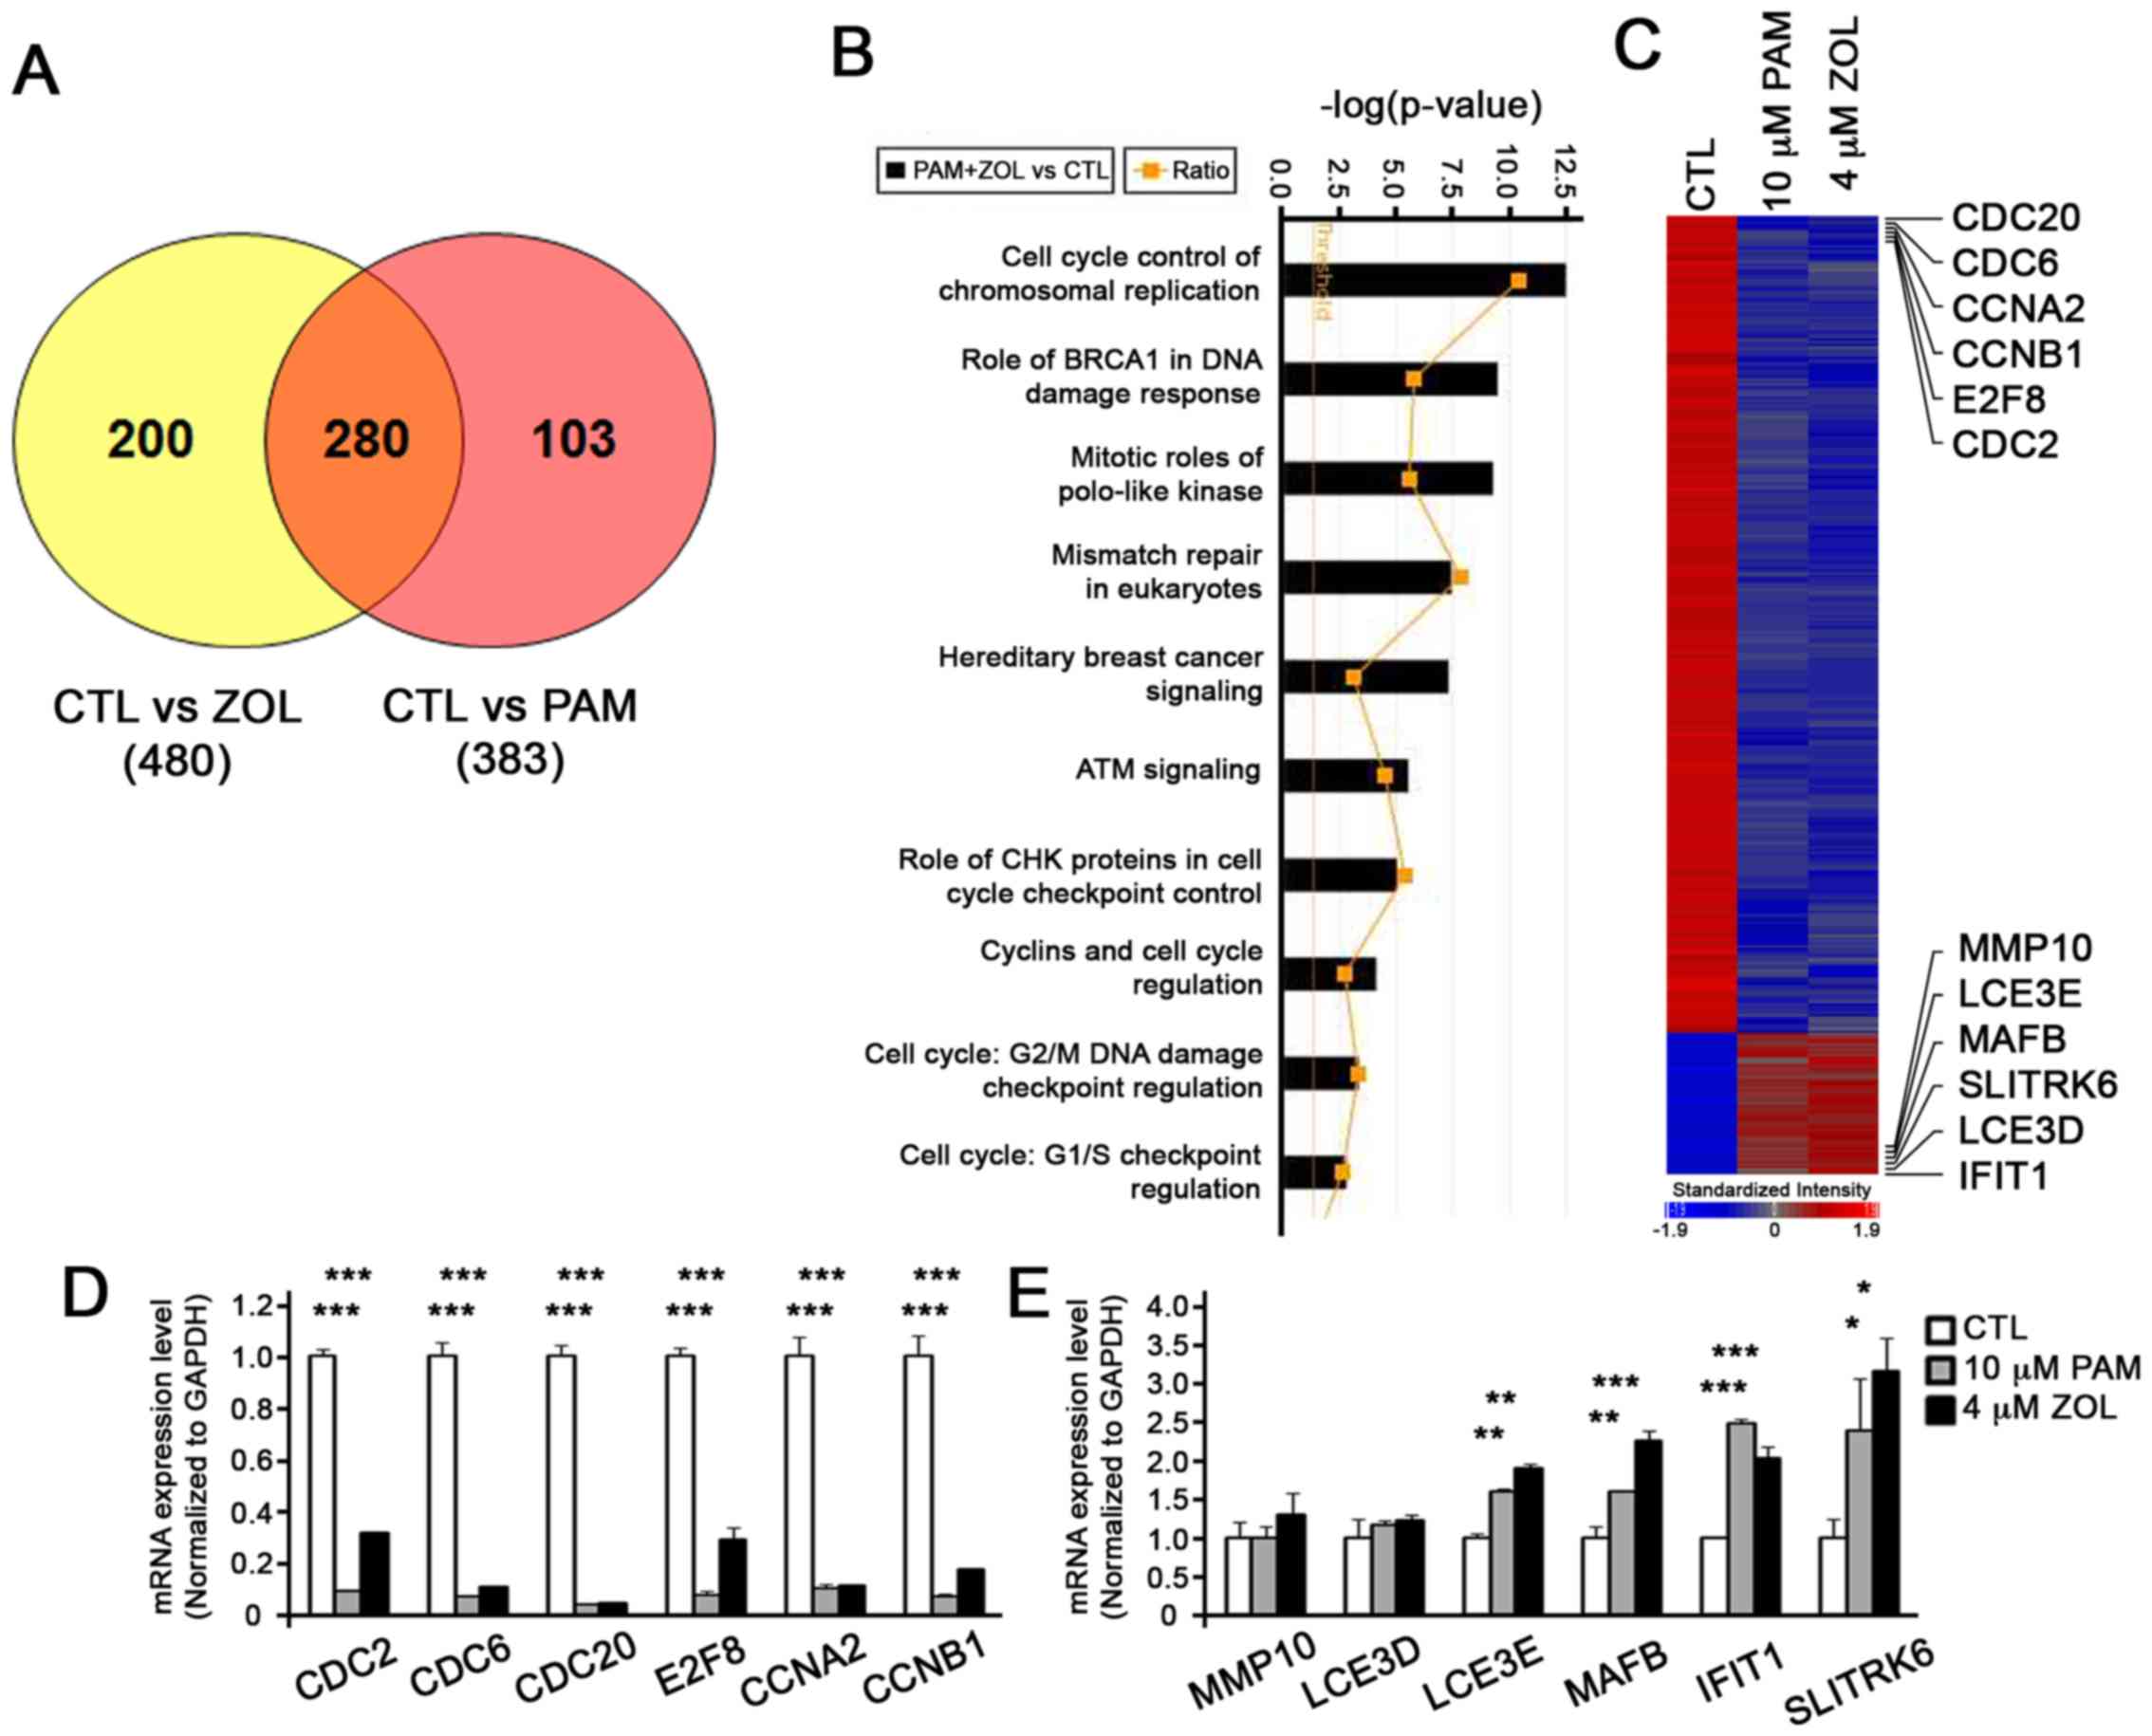
PAM and ZOL as ZOL is 2–4-fold more potent than PAM (10). In the ZOL-treated NHOKs, 480 genes
were differentially expressed, whereas 383 genes were
differentially expressed in the PAM-treated NHOKs when compared to
the untreated NHOKs (Fig. 1A).
From these data, we identified 280 genes that were commonly present
in both the ZOL- and PAM-treated NHOKs (Fig. 1A). Ingenuity Pathway Analysis
(IPA) revealed that, of these 280 genes, many of them were
associated with cell cycle control of chromosomal replication
(Fig. 1B). Indeed, genes related
to cell cycle regulation, such as cell division cycle(CDC)20, CDC6,
cyclin (CCN) A2, CCNB1, E2F transcription factor 8 (E2F8) and CDC2,
were downregulated by the bisphosphonates, whereas genes that are
more involved in structural formation, such as matrix
metallopeptidase 10 (MMP10), late cornified envelope 3E (LCE3E),
MAF BZIP transcription factor B (MAFB), SLIT and NTRK like family
member 6 (SLITRK6), late cornifiedenvelope 3D (LCE3D) and
interferon induced protein with tetratricopeptide repeats 1
(IFIT1), exhibited an increased expression (Table II and Fig. 1C). To confirm the data from the
microarray analysis, we performed RT-qPCR and found consistent
results (Fig. 1D and E),
supporting the validity of the microarray data.
| Table IIDifferentially expressed genes by
N-BPs (fold induction). |
Table II
Differentially expressed genes by
N-BPs (fold induction).
| Gene symbol | Gene title | CTL vs PAM/ZOL | CTL vs PAM | CTL vs ZOL |
|---|
| CLDN11 | Claudin 11 | −7.48 | −7.34 | −7.62 |
| CDC20 | Cell division cycle
20 homolog | −4.59 | −3.77 | −5.58 |
| CDC6 | Cell division cycle
6 homolog | −4.08 | −3.83 | −4.36 |
| CDKN3 | Cyclin-dep kinase
inhibitor 3 | −3.89 | −3.37 | −4.49 |
| LMNB1 | Lamin B1 | −3.82 | −3.41 | −4.27 |
| CCNA2 | Cyclin A2 | −3.78 | −3.53 | −4.05 |
| CCNB1 | Cyclin B1 | −3.44 | −3.14 | −3.77 |
| EPCAM | Epithelial cell
adhesion molecule | −3.44 | −3.64 | −3.24 |
| E2F8 | E2F transcription
factor 8 | −3.37 | −3.24 | −3.51 |
| HMGB2 | High-mobility group
box 2 | −3.1 | −2.95 | −3.26 |
| CDC2 | Cell division cycle
2 | −2.87 | −3.03 | −2.71 |
| FOXM1 | Forkhead box
M1 | −2.72 | −2.6 | −2.85 |
| HNRNPD | Hn
ribonuclearprotein D | −2.57 | −2.3 | −2.88 |
| CDKN2C | Cyclin-dep kinase
inhibitor 2C | −2.5 | −2.32 | −2.68 |
| RBL1 | Retinoblastoma-like
1 (p107) | −2.28 | −2.31 | −2.25 |
| FOXA2 | Forkhead box
A2 | −2.26 | −2.37 | −2.15 |
| BRCA2 | Breast cancer 2,
early onset | −2.25 | −2.31 | −2.2 |
| RAD51 | RAD51 homolog | −2.21 | −2.12 | −2.3 |
| MSH2 | musS homolog 2 | −2.18 | −2.17 | −2.18 |
| EZH2 | Enhancer of zeste
homolog 2 | −2.18 | −2.17 | −2.18 |
| RAD54B | RAD54 homolog
B | −2.16 | −2.15 | −2.17 |
| LCE3E | Late cornified
envelope 3E | 1.79 | 1.57 | 2.05 |
| SLITRK6 | SLIT and NTRK-like
family, member 6 | 2.08 | 1.88 | 2.29 |
| TP53INP2 | p53 inducible
nuclear protein 2 | 2.13 | 2.01 | 2.24 |
| CD24 | CD24 molecule | 2.19 | 2.22 | 2.16 |
| TNFSF10 | TNF superfamily
member 10 | 2.43 | 2.45 | 2.4 |
| MMP10 | Matrix
metallopeptidase 10 | 2.24 | 2.25 | 2.22 |
| MAFB | V-maf
musculoaponeurotic fibrosarcoma oncogene homolog B | 2.31 | 2.38 | 2.24 |
| TP53INP1 | p53 inducible
nuclear protein 1 | 2.37 | 2.35 | 2.39 |
| SOX4 | SRY-box 4 | 2.59 | 2.63 | 2.54 |
| LCE3D | Late cornified
envelope 3D | 2.65 | 2.68 | 2.63 |
| FN1 | Fibronectin 1 | 2.9 | 2.7 | 3.11 |
| IFIT1 | Interferon-induced
protein with tetratricopeptide repeats 1 | 2.93 | 3.53 | 2.43 |
| IL6 | Interleukin 6 | 3.34 | 2.95 | 3.79 |
N-BPs inhibit the expression of cyclin
A2
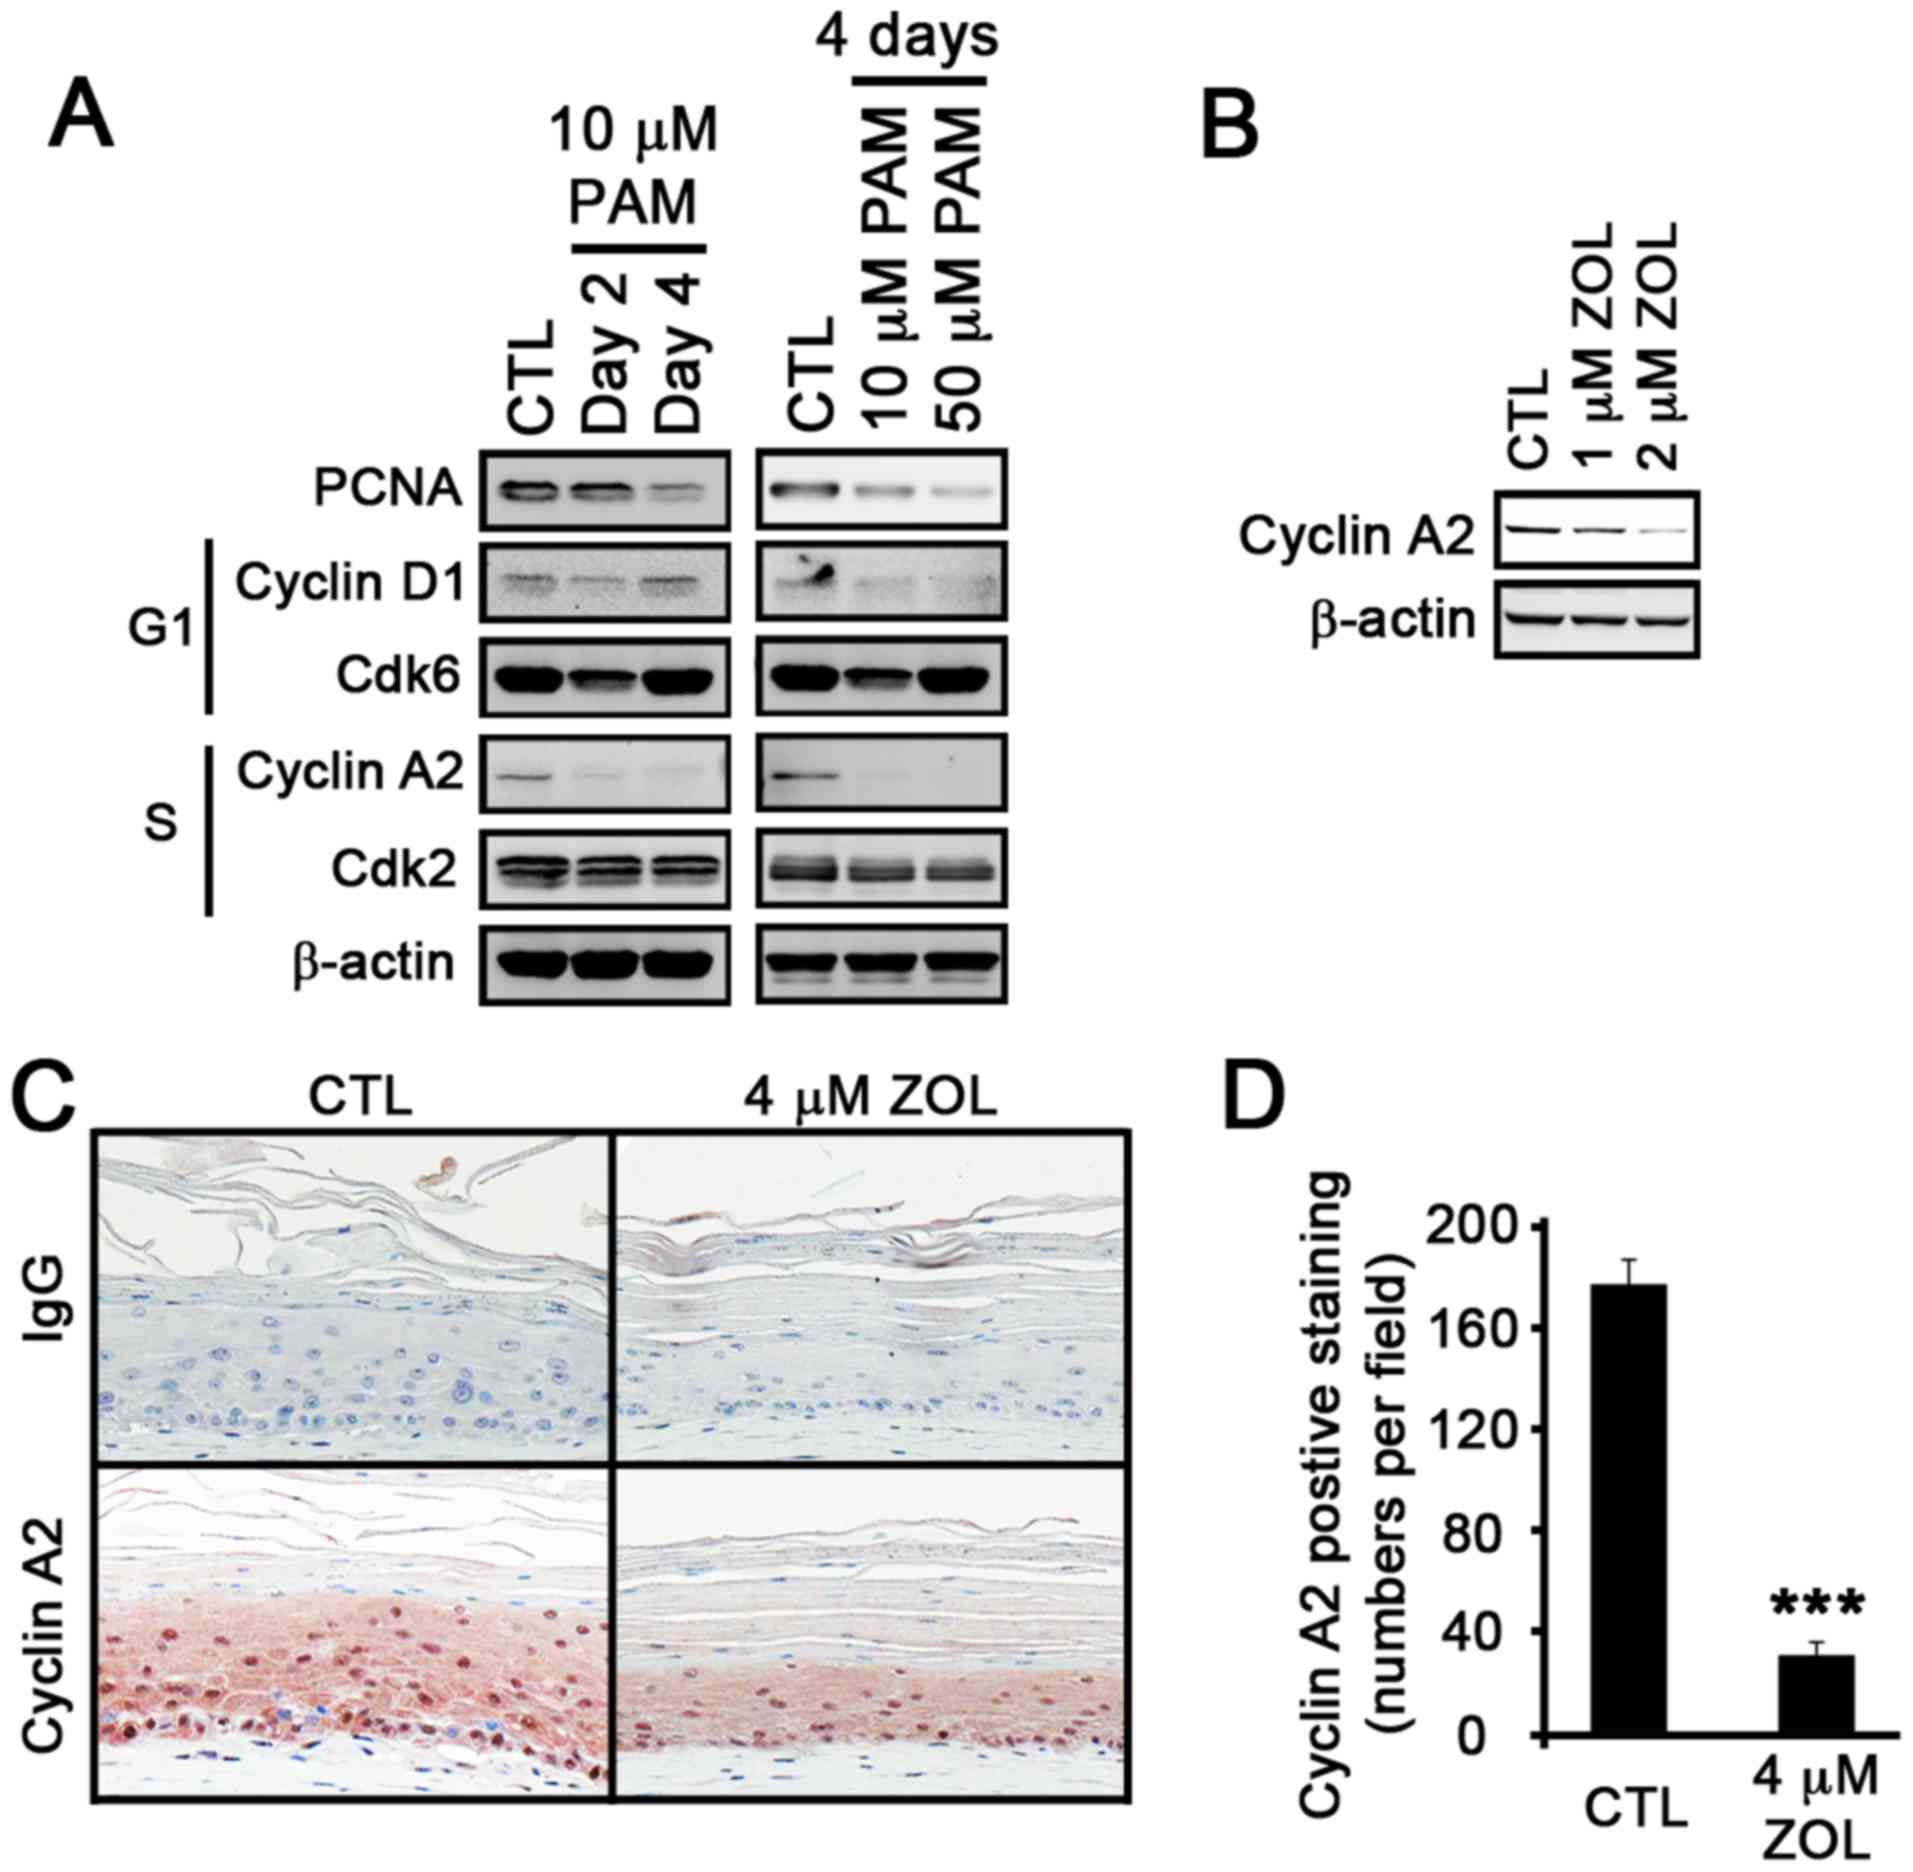
As previously demonstrated, when NHOKs were treated
with the BPs, they underwent cell cycle arrest at the S phase
(9,11). As our microarray data revealed the
effects of N-BPs on genes associated with the cell cycle, we
screened for cell cycle-related proteins. When the NHOKs were
treated with PAM, the expression of PCNA, a proliferation marker,
decreased in time- and dose-dependent manner (Fig. 2A). Consistent with the microarray
data, the expression of cyclin A2, a protein that is associated
with the S phase in the cell cycle, was markedly diminished to an
undetectable level by PAM. The dose-dependent decrease in cyclin A2
expression was also observed in the ZOL-treated NHOKs (Fig. 2B). Previously, we also
demonstrated that BPs induce inhibitory effects on epithelial
tissues using oral mucosal tissue constructs (9). To examine whether the
anti-proliferative effects of BPs on epithelial tissues are
associated with cyclin A2 expression, we treated the oral mucosal
tissue constructs with ZOL. As expected, tissue atrophy with
thinning of the epithelial layers was observed (Fig. 2C). We then performed IHC staining
for cyclin A2 in the ZOL-treated oral mucosal tissue constructs.
The results revealed a marked reduction in cyclin A2 staining
patterns in the epithelial layer of the ZOL-treated tissues
(Fig. 2D). Collectively, these
data indicate that the suppression of cell proliferation at the S
phase is associated with the suppression of cyclin A2
expression.
N-BPs inhibit cyclin A2 expression at the
transcriptional level
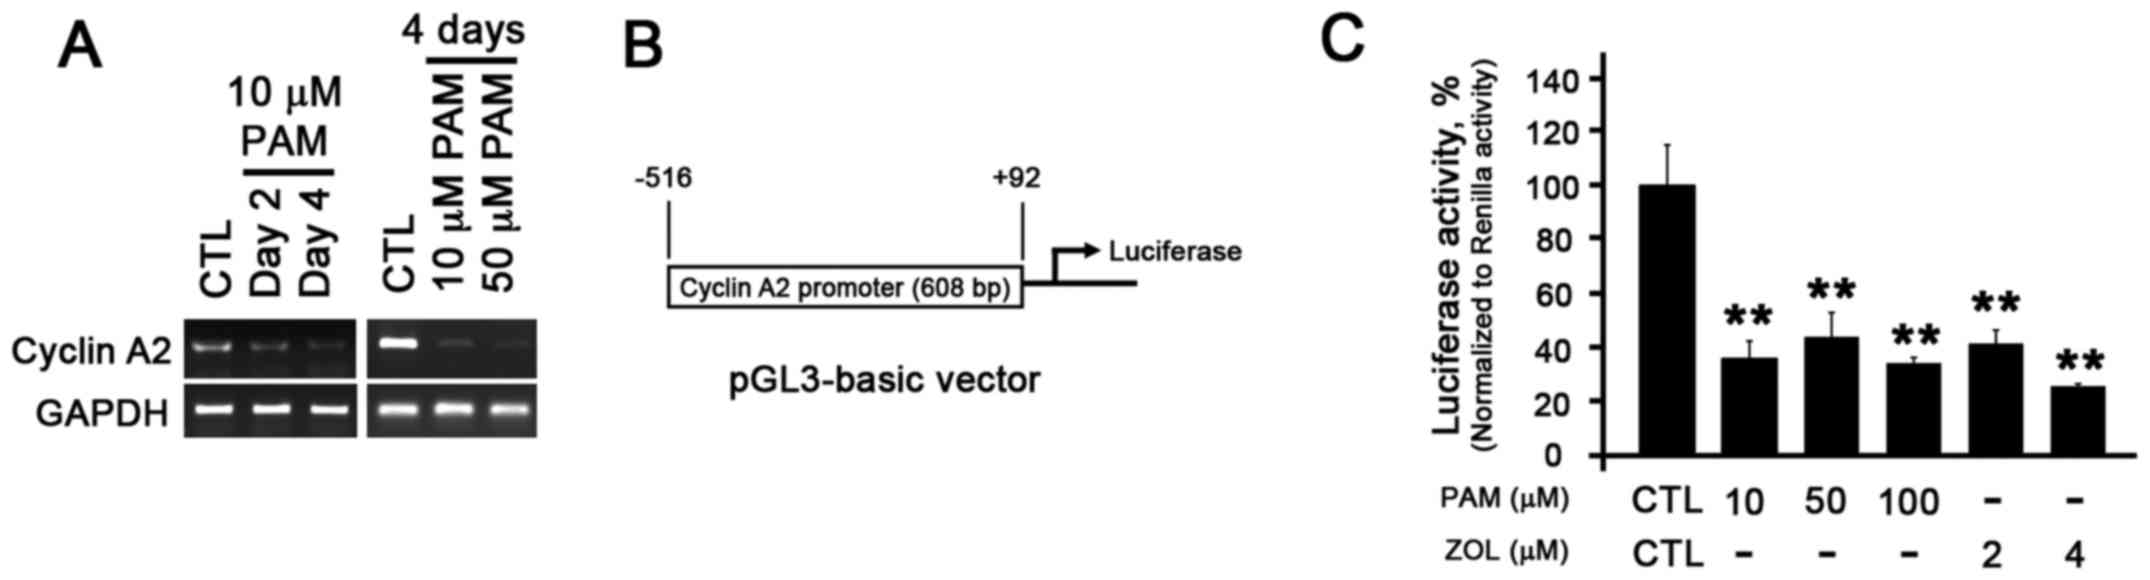
To further examine the molecular mechanisms through
which bisphosphonates regulate the expression of cyclin A2, we
examined expression of cyclin A2 at the transcriptional level.
Similar to the results of western blot analysis, the mRNA level of
cyclin A2 decreased in a time- and dose-dependent manner (Fig. 3A). To further confirm this
finding, we constructed a cyclin A2-promoter luciferase reporter
vector by cloning the 608 bp (−516 to +92) known to be essential
for cyclin A2 promoter activity (Fig.
3B) (12,13). The luciferase assay revealed a
relatively 4–5-fold reduction in luciferase activity in the PAM-and
ZOL-treated NHOKs (Fig. 3C),
indicating that cyclin A2 expression is indeed transcriptionally
regulated by N-BPs.
N-BPs do not inhibit the expression of
cyclin A2 in normal human oral fibroblasts (NHOFs)
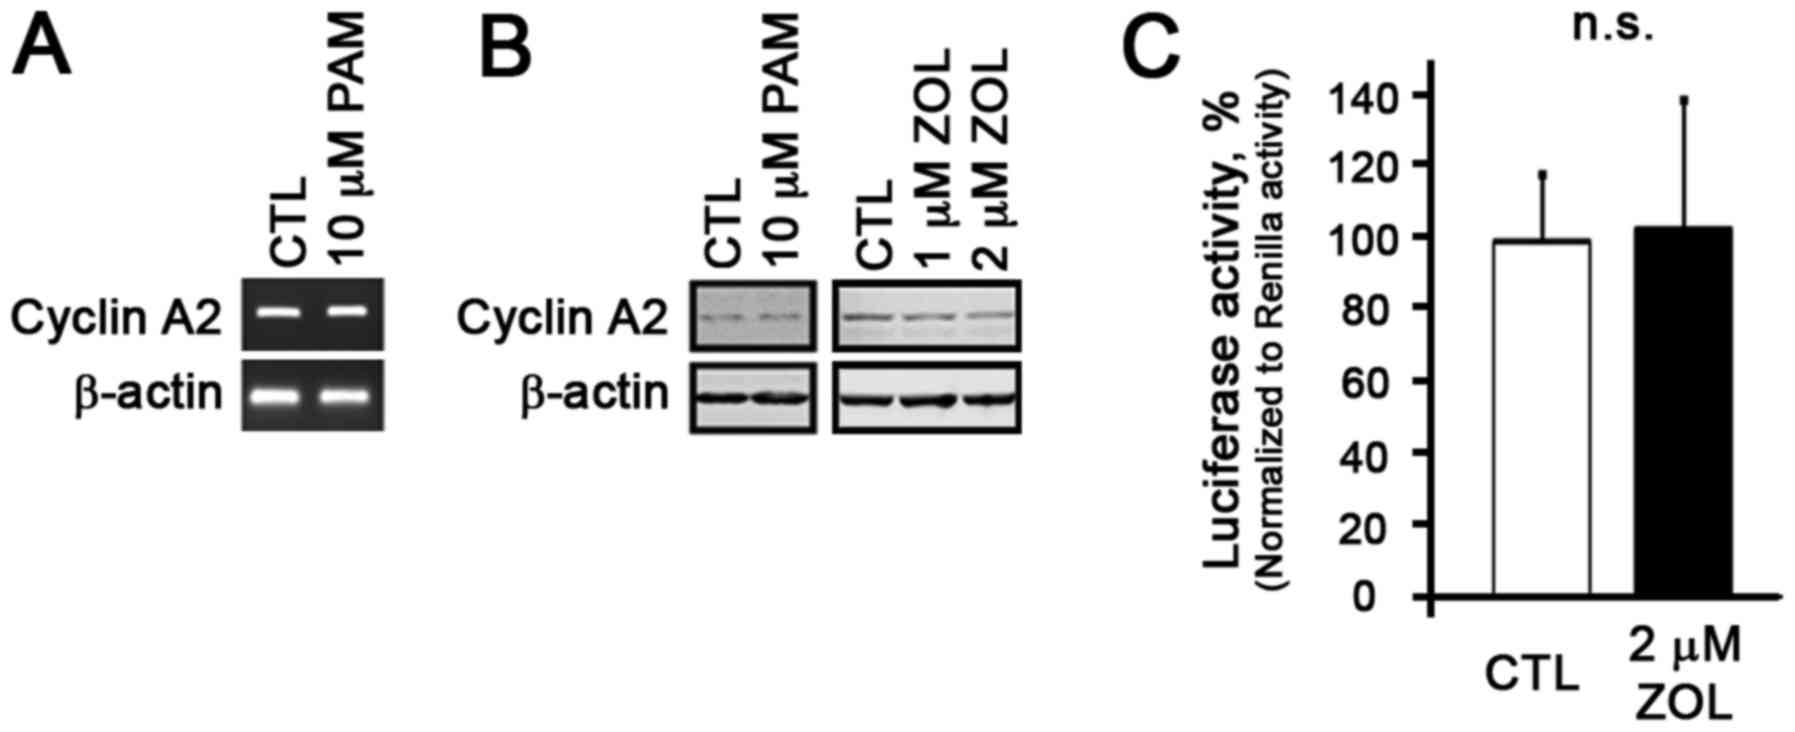
Our previous study demonstrated that N-BPs at the
lower concentration had no notable effects on the proliferation of
NHOFs (9). Thus, in this study,
in order to examine whether cyclin A2 expression is altered by
N-BPs in NHOFs, we treated the NHOFs with N-BPs and observed no
changes in cyclin A2 expression at both the mRNA and protein level
(Fig. 4A and B). Cyclin A2
promoter luciferase reporter assay revealed that there was also no
change in luciferase activity in the NHOFs treated with the N-BPs
(Fig. 4C), indicating that N-BPs
at the concentrations which inhibited cyclin A2 in the NHOKs had no
effects on cyclin A2 in the NHOFs.
Discussion
A significant body of evidence supports the notion
that N-BPs cause epithelial toxicity. However, the underlying
mechanisms are not yet fully understood. We previously demonstrated
that bisphosphonates suppress proliferation without inducing the
apoptosis of NHOKs (9). In this
study, using microarray and IPA analyses, we found that N-BPs
preferentially regulate genes associated with the cell cycle. Among
the cell cycle-associated genes, the expression of cyclin A2 was
specifically inhibited by the N-BPs in the NHOKs at the
transcriptional level, and such an inhibition was not evident in
the NHOFs, suggesting that the effects of BPs are cell
type-specific. Furthermore, using oral epithelial tissue
constructs, we demonstrated that BPs also cause the suppression of
cyclin A2 in epithelial layers, indicating that epithelial toxicity
by BPs is, at least in part, due to targeting cyclin A2 expression
and suppressing cell proliferation.
N-BPs, derivatives of inorganic pyrophosphatase with
a backbone of P-O-P, are stable and clinically applicable due to
the replacement of oxygen molecule to the carbon molecule (P-C-P).
This substitution enhances two independent, but synergistic
biological properties of the bisphosphonates through the hydroxyl
group (R1) and the nitrogen-containing group (R2) (14). The R1 group enhances the affinity
to calcium-enriched tissues, such as bone. On the other hand, the
R2 group in BPs is the nitrogen-containing group, which is known to
be responsible for an increase in biological potency by physically
binding to and inhibiting the functions of farnesyl pyrophosphate
synthase (FPPS) (15,16). FPPS is the key branch-point enzyme
in the mevalonate pathway required for generating a metabolite,
farnesyl pyrophosphate (FPP), for the synthesis of cholesterol and
protein prenylation. Prenylation involves the transfer of farnesyl
and/or geranylgeranyl lipid groups onto the C-terminus of small
GTPase proteins at the post-translational level (17,18). As small GTPases, such as Ras,
Rap1, Rab3A or RhoA are known to play pivotal roles in cellular
functions, including proliferation, migration, morphology, polarity
and secretion (19), BP-mediated
changes in cellular functions may occur via the inhibition of the
mevalonate pathway and protein prenylation.
A previous study found that the cyclin A2 gene was
upregulated by H-Ras and RhoA in their attempt to identify
responsive genes by a group of different small GTPases (20). Of note, our recent study
demonstrated that bisphosphonates inhibited cell cycle arrest at
the S phase (9), suggesting that
some small GTPases such as H-Ras or RhoA may be targeted by
bisphosphonates to regulate transcriptional machineries to suppress
expression of the downstream genes, such as cyclin A2.
The precise role of transcriptional regulation by
bisphosphonates on cyclin A2 has yet to be determined. Although
small GTPases are known to mainly regulate cytoskeletal structures
and functions, studies showed modulation of transcriptional
expression by these small GTPases. For instance, Rac and Cdc42
induce the transcriptional activity of c-Jun by activating c-Jun
amino-terminal kinawse (JNK), and Rho activates transcriptional
activity of serum response factor (SRF) (21,22). RalA has also been shown to
activate urokinase plasminogen activator receptor (uPAR) via c-Src
and AP1 (23). Thus, it is likely
that bisphosphonates inhibit cyclin A2 expression by disrupting
prenylation and transcription-activating functions of small
GTPases.
It has been demonstrated that bisphosphonates have a
potential role as putative cancer therapeutic agents.
Bisphosphonate treatment induces the production of cytotoxic ATP
analogs in tumor cells, leading to growth arrest (24). Bwisphosphonates also suppress
angiogenesis via hypoxia-induction factor (HIF)-1α/vascular
endothelial growth factor (VEGF) signaling pathways in human breast
cancer cells (25). Furthermore,
bisphosphonates induce cell-cycle prolongation in murine lung
cancer cells by alteration of cyclin and Ras expression (26). It has also been suggested that
cyclin A2 may be the molecular target of the
bisphosphonate-mediated suppression of cancer cells. Cyclin A2 is
frequently found to be elevated in a variety of tumors (27). Ory et al showed that
bisphosphonates inhibited the proliferation of osteosarcoma cells
by inducing cell cycle arrest at the S and G2/M phase (28,29). In myeloma cells, bisphosphonates
have also been shown to induce S phase cell cycle arrest by
activating the MAPK pathway (11). The direct association between
bisphosphonates and cyclin A2 warrants further investigation.
In conclusion, in this study, we demonstrate that
cyclin A2, which regulates the cell cycle at the S phase by forming
a cyclin A2-Cdk2 complex, is inhibited by both bisphosphonates, PAM
and ZOL, at the transcriptional level. BPs targeting cyclin A2
expression may serve as the dominant mode of the cell cycle arrest
and the inhibition of cell proliferation. Our 3-dimensional (3D)
oral mucosal tissue constructs also demonstrated that ZOL inhibited
the expression of cyclin A2, suggesting that cyclin A2 may be
involved in bisphosphonate-induced epithelial toxicity by causing
structural and architectural damages. The modulation of cyclin A2
may hold therapeutic potential to ameliorate epithelial toxicity
mediated by bisphosphonates.
Acknowledgments
This study was supported by the grants from
NIDCR/NIH R03DE021114, R01DE023348 and Dean's Faculty Research Seed
grant to R.H.K.
References
|
1
|
Russell RG: Bisphosphonates: The first 40
years. Bone. 49:2–19. 2011. View Article : Google Scholar : PubMed/NCBI
|
|
2
|
Coxon FP, Thompson K and Rogers MJ: Recent
advances in understanding the mechanism of action of
bisphosphonates. Curr Opin Pharmacol. 6:307–312. 2006. View Article : Google Scholar : PubMed/NCBI
|
|
3
|
Reyes C, Hitz M, Prieto-Alhambra D and
Abrahamsen B: Risks and benefits of bisphosphonate therapies. J
Cell Biochem. 117:20–28. 2016. View Article : Google Scholar
|
|
4
|
Watts N, Freedholm D and Daifotis A: The
clinical tolerability profile of alendronate. Int J Clin Pract
Suppl. 101:51–61. 1999.
|
|
5
|
Rubegni P and Fimiani M: Images in
clinical medicine. Bisphosphonate-associated contact stomatitis. N
Engl J Med. 355:e252006. View Article : Google Scholar : PubMed/NCBI
|
|
6
|
de Groen PC, Lubbe DF, Hirsch LJ, Daifotis
A, Stephenson W, Freedholm D, Pryor-Tillotson S, Seleznick MJ,
Pinkas H and Wang KK: Esophagitis associated with the use of
alendronate. N Engl J Med. 335:1016–1021. 1996. View Article : Google Scholar : PubMed/NCBI
|
|
7
|
Proksch E, Brandner JM and Jensen JM: The
skin: An indispensable barrier. Exp Dermatol. 17:1063–1072. 2008.
View Article : Google Scholar : PubMed/NCBI
|
|
8
|
Bae S, Sun S, Aghaloo T, Oh JE, McKenna
CE, Kang MK, Shin KH, Tetradis S, Park NH and Kim RH: Development
of oral osteomucosal tissue constructs in vitro and localization of
fluorescently-labeled bisphosphonates to hard and soft tissue. Int
J Mol Med. 34:559–563. 2014.PubMed/NCBI
|
|
9
|
Kim RH, Lee RS, Williams D, Bae S, Woo J,
Lieberman M, Oh JE, Dong Q, Shin KH, Kang MK, et al:
Bisphosphonates induce senescence in normal human oral
keratinocytes. J Dent Res. 90:810–816. 2011. View Article : Google Scholar : PubMed/NCBI
|
|
10
|
Green JR: Chemical and biological
prerequisites for novel bisphosphonate molecules: Results of
comparative preclinical studies. Semin Oncol. 28(Suppl 6): 4–10.
2001. View Article : Google Scholar : PubMed/NCBI
|
|
11
|
Iguchi T, Miyakawa Y, Yamamoto K, Kizaki M
and Ikeda Y: Nitrogen-containing bisphosphonates induce S-phase
cell cycle arrest and apoptosis of myeloma cells by activating MAPK
pathway and inhibiting mevalonate pathway. Cell Signal. 15:719–727.
2003. View Article : Google Scholar : PubMed/NCBI
|
|
12
|
Horiuchi K, Umetani M, Minami T, Okayama
H, Takada S, Yamamoto M, Aburatani H, Reid PC, Housman DE, Hamakubo
T, et al: Wilms' tumor 1-associating protein regulates G2/M
transition through stabilization of cyclin A2 mRNA. Proc Natl Acad
Sci USA. 103:17278–17283. 2006. View Article : Google Scholar : PubMed/NCBI
|
|
13
|
Henglein B, Chenivesse X, Wang J, Eick D
and Bréchot C: Structure and cell cycle-regulated transcription of
the human cyclin A gene. Proc Natl Acad Sci USA. 91:5490–5494.
1994. View Article : Google Scholar : PubMed/NCBI
|
|
14
|
Reszka AA and Rodan GA:
Nitrogen-containing bisphosphonate mechanism of action. Mini Rev
Med Chem. 4:711–719. 2004.PubMed/NCBI
|
|
15
|
Bergstrom JD, Bostedor RG, Masarachia PJ,
Reszka AA and Rodan G: Alendronate is a specific, nanomolar
inhibitor of farnesyl diphosphate synthase. Arch Biochem Biophys.
373:231–241. 2000. View Article : Google Scholar : PubMed/NCBI
|
|
16
|
van Beek E, Pieterman E, Cohen L, Löwik C
and Papapoulos S: Nitrogen-containing bisphosphonates inhibit
isopentenyl pyrophosphate isomerase/farnesyl pyrophosphate synthase
activity with relative potencies corresponding to their
antiresorptive potencies in vitro and in vivo. Biochem Biophys Res
Commun. 255:491–494. 1999. View Article : Google Scholar : PubMed/NCBI
|
|
17
|
Sinensky M: Recent advances in the study
of prenylated proteins. Biochim Biophys Acta. 1484:93–106. 2000.
View Article : Google Scholar : PubMed/NCBI
|
|
18
|
Williams CL: The polybasic region of Ras
and Rho family small GTPases: A regulator of protein interactions
and membrane association and a site of nuclear localization signal
sequences. Cell Signal. 15:1071–1080. 2003. View Article : Google Scholar : PubMed/NCBI
|
|
19
|
Csépányi-Kömi R, Lévay M and Ligeti E:
Small G proteins and their regulators in cellular signalling. Mol
Cell Endocrinol. 353:10–20. 2012. View Article : Google Scholar
|
|
20
|
Teramoto H, Malek RL, Behbahani B,
Castellone MD, Lee NH and Gutkind JS: Identification of H-Ras,
RhoA, Rac1 and Cdc42 responsive genes. Oncogene. 22:2689–2697.
2003. View Article : Google Scholar : PubMed/NCBI
|
|
21
|
Coso OA, Chiariello M, Yu JC, Teramoto H,
Crespo P, Xu N, Miki T and Gutkind JS: The small GTP-binding
proteins Rac1 and Cdc42 regulate the activity of the JNK/SAPK
signaling pathway. Cell. 81:1137–1146. 1995. View Article : Google Scholar : PubMed/NCBI
|
|
22
|
Hill CS, Wynne J and Treisman R: The Rho
family GTPases RhoA, Rac1, and CDC42Hs regulate transcriptional
activation by SRF. Cell. 81:1159–1170. 1995. View Article : Google Scholar : PubMed/NCBI
|
|
23
|
Okan E, Drewett V, Shaw PE and Jones P:
The small-GTPase RalA activates transcription of the urokinase
plasminogen activator receptor (uPAR) gene via an AP1-dependent
mechanism. Oncogene. 20:1816–1824. 2001. View Article : Google Scholar : PubMed/NCBI
|
|
24
|
Mönkkönen H, Kuokkanen J, Holen I, Evans
A, Lefley DV, Jauhiainen M, Auriola S and Mönkkönen J:
Bisphosphonate-induced ATP analog formation and its effect on
inhibition of cancer cell growth. Anticancer Drugs. 19:391–399.
2008. View Article : Google Scholar : PubMed/NCBI
|
|
25
|
Sonnemann J, Eckervogt V, Truckenbrod B,
Boos J, Winkelmann W and van Valen F: The bisphosphonate
pamidronate is a potent inhibitor of Ewing's sarcoma cell growth in
vitro. Anticancer Drugs. 14:767–771. 2003. View Article : Google Scholar : PubMed/NCBI
|
|
26
|
Li YY, Chang JW, Liu YC, Wang CH, Chang
HJ, Tsai MC, Su SP and Yeh KY: Zoledronic acid induces cell-cycle
prolongation in murine lung cancer cells by perturbing cyclin and
Ras expression. Anticancer Drugs. 22:89–98. 2011. View Article : Google Scholar
|
|
27
|
Yam CH, Fung TK and Poon RY: Cyclin A in
cell cycle control and cancer. Cell Mol Life Sci. 59:1317–1326.
2002. View Article : Google Scholar : PubMed/NCBI
|
|
28
|
Iguchi T, Miyakawa Y, Saito K, Nakabayashi
C, Nakanishi M, Saya H, Ikeda Y and Kizaki M: Zoledronate-induced S
phase arrest and apoptosis accompanied by DNA damage and activation
of the ATM/Chk1/cdc25 pathway in human osteosarcoma cells. Int J
Oncol. 31:285–291. 2007.PubMed/NCBI
|
|
29
|
Ory B, Blanchard F, Battaglia S, Gouin F,
Rédini F and Heymann D: Zoledronic acid activates the DNA S-phase
checkpoint and induces osteosarcoma cell death characterized by
apoptosis-inducing factor and endonuclease-G translocation
independently of p53 and retinoblastoma status. Mol Pharmacol.
71:333–343. 2007. View Article : Google Scholar
|