Introduction
Acute myeloid leukemia (AML) is an aggressive,
genetically heterogeneous malignancy characterized by the
accumulation of abnormal blasts in the bone marrow (BM) (1). These hematopoietic progenitor cells
interfere with normal hematopoiesis, can escape into the peripheral
blood, and infiltrate the lungs and central nervous system
(2). AML can occur in individuals
of all ages, but evidence has shown that AML is most common in
older patients (>65 years) (3)
and that it accounts for 70% of acute leukemia cases in adults
(4). Current treatments include
intensive chemotherapy and BM transplantation (5). Although there have been large
improvements in outcome in recent decades, AML remains a
life-threatening malignancy, with an 5-year overall survival rate
of only 40–45% in young patients and >10% in the elderly, due to
either resistance to therapy or relapsed AML (1). Thus, gaining a better understanding
of the underlying molecular mechanism of AML is imperative for the
development of more valuable diagnostic and therapeutic
targets.
Molecular analyses have expanded our understanding
of the heterogeneity of AML, which leads to distinct clinical
presentations in different cytogenetic and morphological subtypes
(6). It is clear that genetic
events [such as point mutations, and insertions and deletions
(indels)] and recurrent chromosomal abnormalities (such as numeric
abnormalities and translocations) are necessary for the development
of AML (7). For instance, genomic
and functional studies have demonstrated two broad classes of
mutations that collaborate to cause AML when neither is sufficient
to do so in isolation (1,8). Class I mutations, such as
neuroblastoma RAS viral oncogene homolog mutations, confer a
proliferative advantage of hematopoietic stem and progenitor cells
(HSPCs), but have no effect on differentiation. However, class II
mutations, such as translocations involving the mixed lineage
leukemia 1 gene, block the differentiation of HSPCs and subsequent
apoptosis (1). On the other hand,
deregulated epigenetic changes have been shown as major components
of the pathogenesis of AML (7).
DNA methylation signatures have been used to identify distinct
epigenetically defined subtypes in AML (9). Akalin et al demonstrated that
aberrant DNA methylation patterns in AML were highly specific and
associated with specific driving genetic lesions (10). In addition, the findings of Tao
et al showed that epigenetic inactivation of microRNA
(miRNA/miR)-663 by promoter hypermethylation could be found in AML
cell lines and pediatric AML samples (11). However, the gene methylation
signatures in AML are not completely understood. Identifying more
differentially methylated genes may provide a better understanding
of the pathogenesis of the disease.
BM mesenchymal stem cells (BM-MSCs) are key
components of the hematopoietic microenvironment and are
particularly important hematopoietic regulators due to their
capacity to self-renewal and to differentiate into different
stromal cell lines and produce soluble factors facilitating
hematopoietic cell maintenance (12). Previously, Blau et al
demonstrated that BM-MSCs from patients with myelodysplastic
syndrome (MDS) and AML showed chromosomal abnormalities, suggesting
potential involvement of BMSCs in the pathophysiology of MDS/AML
(13). Furthermore, a distinctive
gene expression profile of MSCs was identified from pediatric cases
of AML compared with healthy donors (14). However, the gene methylation
patterns in BM-MSC from patients with AML have not been fully
addressed.
In the present study, recently deposited microarray
data (deposited on March 29, 2016) from a public database were
downloaded and reanalyzed to study the methylation status in
BM-MSCs from patients with AML. Differentially methylated sites and
differentially methylated CpG islands were identified in BM-MSC
samples from patients with AML compared with controls.
miRNA-encoding genes covering differentially methylated sites were
found and the regulation network was constructed. Pathway
enrichment analysis of hypermethylated genes and hypomethylated
genes was performed, followed by protein-protein interaction (PPI)
network construction. Moreover, the identified differentially
methylated genes were compared with the leukemia-related
marker/therapeutic genes from the literature. The study aimed to
characterize the epigenetic architecture by studying the DNA
methylation signature in BM-MSCs from AML patients. Unraveling the
complexities of the methylation changes of AML has important
implications for diagnosis and the development of novel targets for
therapy.
Materials and methods
Microarray data and data
preprocessing
The Gene Expression Omnibus (GEO) database
(http://www.ncbi.nlm.nih.gov/geo/) serves
as the major public repository for microarray, next-generation
sequencing functional genomic data sets and other data types, such
as genome methylation status analyses (15). In the present study, the
methylation profiling dataset GSE79695 was downloaded from the GEO
database (16). This downloaded
dataset included 32 BM-MSC samples derived from patients with AML
(these samples were defined as AML) and 12 BM-MSC samples from
healthy donor controls (these samples were defined as the control).
The GPL13534 Illumina HumanMethylation450 BeadChip
(HumanMethylation450_15017482) platform (Illumina, Inc., San Diego,
CA, USA) was used.
The signal intensity files of the GSE79695 dataset
were downloaded. Prior to proceeding with methylation data
analysis. The methylation status of the measured CpG sites was
determined by calculation of the β-value (a value between 0 and 1)
(17), with 1 indicating totally
methylated and 0 representing unmethylated. The β-values are
proportional to the ratio of intensities between the methylated and
unmethylated alleles according to the following formula: β =
methylated signal / (methylated signal + unmethylated signal +
100); a constant bias of 100 was added to regularize the β-value
when the methylated signal value and the unmethylated signal values
were small (18).
Detection of differentially methylated
sites and differentially methylated CpG islands
The City of Hope CpG Island Analysis Pipeline
(COHCAP) package in Bioconductor (https://sourceforge.net/projects/cohcap/) is an
algorithm to analyze either Illumina methylation array or bisulfite
sequencing data, providing tools for data integration with
methylated CpG sites and providing statistics to define
differentially methylated regions (DMRs) (CpG islands) (19). COHCAP uses β-values or methylation
proportions as the input (20).
In the present study, following data pre-processing, differential
analyses were performed to compare the differences in methylation
between the AML group and the control group. δ-β was calculated as
the difference in the mean β-values for each CpG site using the
COHCAP package to estimate the differential methylation at each CpG
site between the AML group and the control group. The threshold for
DMRs was set as absolute value of δ-β >0.1 and P<0.05; δ-β
>0.1 was defined as hypermethylated sites and δ-β <−0.1 was
considered to show hypomethylated sites. The differentially
methylated CpG sites were mapped to gene symbols.
Furthermore, CpG island statistics could be
calculated by averaging β-values among samples per site and
comparing the average β-values across groups using the COHCAP
package. A minimum number of sites can be specified to define a CpG
island according to the COHCAP CpG island analysis (19). The parameter 'num.sites' indicates
the minimum number of sites within a CpG island. In the present
study, the parameter 'num.sites' was set as 4 and the identified
CpG islands were considered as differentially methylated CpG
islands. The other thresholds were set the same as for
differentially methylated CpG site screening.
Detection of differentially methylated
miRNA encoding genes and construction of regulation network
From the identified differentially methylated CpG
sites in the aforementioned method, the miRNA encoding genes
containing differentially methylated CpG sites were screened. miRNA
target predictions for the differentially methylated miRNA-encoding
genes were conducted using the miRWalk2 online tool (http://zmf.umm.uni-heidelberg.de/apps/zmf/mirwalk2), a
comprehensive atlas of validated and predicted miRNA-target
interactions (21). The
'predicted target module' was used and genes with SUM = 4 [miRWalk,
miRanda (http://www.microrna.org), RNA22
(http://cm.jefferson.edu/rna22/) and
TargetScan (http://www.targetscan.org/)] were denoted as target
genes for miRNA. Next, these genes were compared with the
identified DMR-related genes, and only the overlapping genes were
used for regulation network construction using Cytoscape version
3.2.0 (22).
Pathway enrichment analysis
The Database for Annotation, Visualization and
Integrated Discovery (DAVID) bioinformatics resource is a
web-accessible gene database, consisting of an integrated
biological knowledge base and novel algorithms to systematically
extract biological meaning from large gene/protein lists (23).
In the present study, to further investigate the
functional effects of DNA methylation in BM-MSCs of AML, Kyoto
Encyclopedia of Genes and Genomes (KEGG) pathway enrichment
analysis (http://www.genome.jp/kegg/) of
hypermethylated and hypomethylated genes was conducted using DAVID
(version 6.8). Analyses were grounded on a hypergeometric test with
a P-value of <0.05. Pathways enriched by at least 2 DMR-related
genes were enriched.
Construction of PPI network for
DMR-related genes
The Search Tool for the Retrieval of Interacting
Genes (STRING) online database resource provides a critical
integration of protein-protein interactions, including experimental
and predicted interaction information with a confidence score
(24). Direct (physical) as well
as indirect (functional) associations are scored and integrated,
resulting in comprehensive protein networks, in which proteins are
represented with nodes and interactions between any two proteins
are shown with an edge (24). In
the present study, the PPI network was constructed using STRING
(version 10.0) (24) and
visualized using Cytoscape (25),
a network visualization and analysis software. The gene inputs were
all the identified aberrantly methylated genes in the AML group
versus the control group, and the species was chosen as Homo
sapiens. Finally, the degree of nodes (proteins) in the PPI
network was calculated and the nodes with a higher degree were
deemed to be hubs in the network.
Analysis of leukemia-associated
differentially methylated genes
The Comparative Toxicogenomics Database (CTD;
http://ctdbase.org/) is a unique scientific resource
that can provide detailed information on gene-disease
relationships, chemical-gene interactions and chemical-disease
relationships, which may predict numerous novel associations
between different data types (26). In the present study, gene-leukemia
associations of 'marker' or 'therapeutic' type (http://ctd.mdibl.org/help/glossary.jsp
for description of the original labels) were parsed (27). The term 'marker' referred to a
gene that may be a biomarker of a disease (e.g., increased
expression of gene X correlates with leukemia) or play a role in
the etiology of a disease (e.g., mutations in gene X cause
leukemia). The term 'therapeutic' referred to a gene that is or may
be a therapeutic target in the treatment a disease (e.g., targeted
reduction of gene X expression reduces susceptibility to leukemia).
In the present study, the marker/therapeutic genes associated with
leukemia were all downloaded and were combined with the identified
methylated genes to identify the leukemia-associated differentially
methylated genes.
Results
Identification of differentially
methylated CpG sites and differentially methylated CpG islands
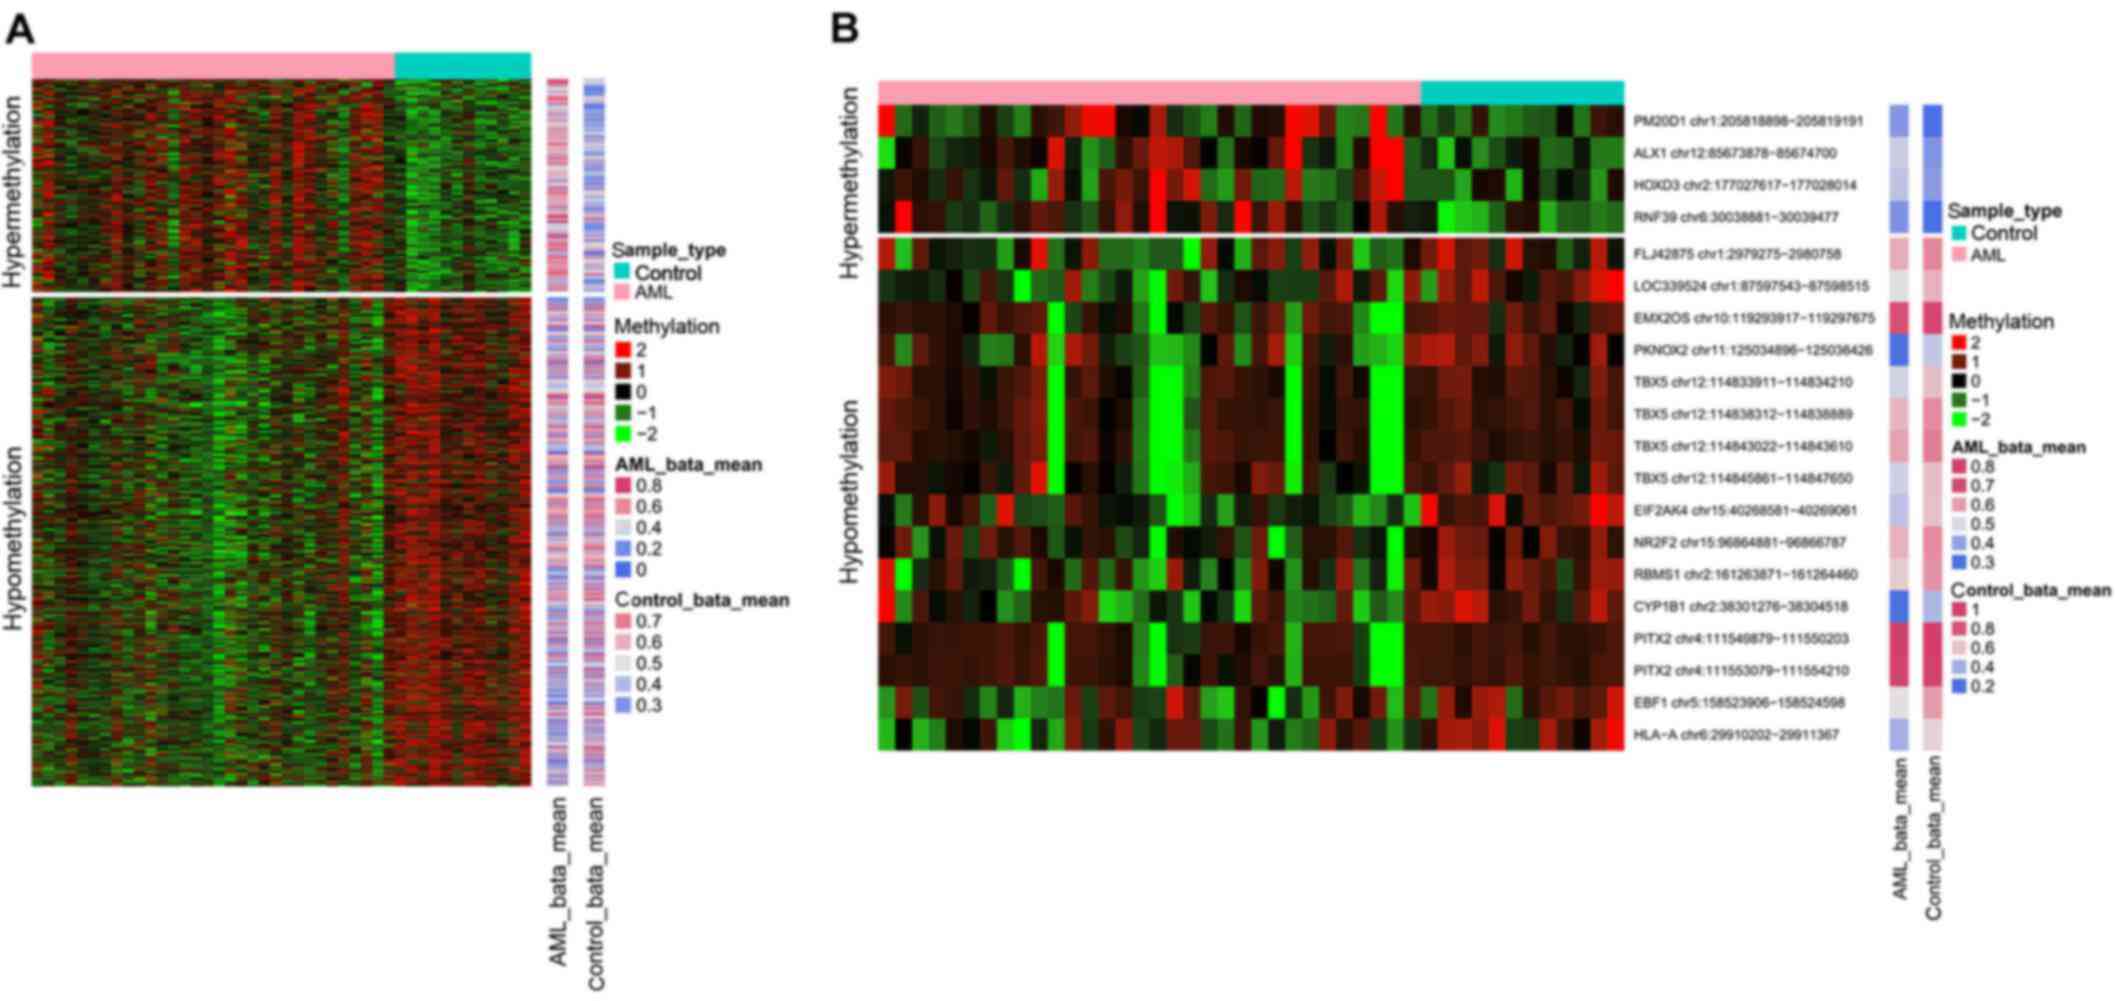
Out of the total CpG islands analyzed, only 751
probes containing differentially methylated CpG sites were found.
Overall, 228 hypermethylated CpG site probes corresponded to 183
gene symbols and 523 hypomethylated CpG site probes were
proportional to 362 gene symbols. The heat map of differentially
methylated CpG sites is presented in Fig. 1A.
On the other hand, a total of 20 differentially
methylated CpG islands covering 16 genes were screened out,
including 4 hypermethylated CpG islands and 16 hypomethylated CpG
islands. The 4 genes with hypermethylated CpG islands were ring
finger protein 39, ALX homeobox 1, peptidase M20 domain containing
1 (PM20D1) and homeobox D3. The detailed information on
these differentially methylated CpG islands is summarized in
Table I. These 16 genes
containing differentially methylated CpG islands were DMR-related
genes. The heat map of differentially methylated CpG islands is
presented in Fig. 1B.
 | Table IStatistical information of
differentially methylated CpG islands. |
Table I
Statistical information of
differentially methylated CpG islands.
| Island | Gene | AML.avg.β | Control.avg.β | AML.vs.
control.δ.β | Island.P-value |
|---|
|
chr6:30038881-30039477 | RNF39 | 0.375033 | 0.231256 | 0.143776 |
1.01×10⁻⁴ |
|
chr12:85673878-85674700 | ALX1 | 0.475953 | 0.337848 | 0.138105 |
6.76×10⁻⁴ |
|
chr1:205818898-205819191 | PM20D1 | 0.384421 | 0.24664 | 0.137781 |
1.63×10⁻² |
|
chr2:177027617-177028014 | HOXD3 | 0.462079 | 0.356489 | 0.10559 |
1.36×10⁻² |
|
chr4:111549879-111550203 | PITX2 | 0.765334 | 0.88268 | −0.11735 |
5.27×10⁻³ |
|
chr12:114833911-114834210 | TBX5 | 0.487159 | 0.604552 | −0.11739 |
5.94×10⁻³ |
|
chr4:111553079-111554210 | PITX2 | 0.704864 | 0.823422 | −0.11856 |
2.95×10⁻³ |
|
chr12:114845861-114847650 | TBX5 | 0.48455 | 0.603446 | −0.1189 |
6.23×10⁻³ |
|
chr1:87597543-87598515 |
LOC339524 | 0.50858 | 0.629317 | −0.12074 |
3.65×10⁻³ |
|
chr15:96864881-96866787 | NR2F2 | 0.576133 | 0.697931 | −0.1218 |
6.74×10⁻⁴ |
|
chr10:119293917-119297675 | EMX2OS | 0.692846 | 0.816344 | −0.1235 |
4.85×10⁻³ |
|
chr1:2979275-2980758 |
FLJ42875 | 0.58233 | 0.708994 | −0.12666 |
2.30×10⁻² |
|
chr12:114838312-114838889 | TBX5 | 0.569495 | 0.696655 | −0.12716 |
2.91×10⁻³ |
|
chr12:114843022-114843610 | TBX5 | 0.594515 | 0.724575 | −0.13006 |
2.38×10⁻³ |
|
chr6:29910202-29911367 |
HLA-A | 0.427433 | 0.566239 | −0.13881 |
5.48×10⁻⁴ |
|
chr2:161263871-161264460 | RBMS1 | 0.543212 | 0.683953 | −0.14074 |
4.80×10⁻⁴ |
|
chr15:40268581-40269061 | EIF2AK4 | 0.458752 | 0.600674 | −0.14192 |
1.06×10⁻⁵ |
|
chr2:38301276-38304518 | CYP1B1 | 0.283591 | 0.425883 | −0.14229 |
3.96×10⁻⁵ |
|
chr11:125034896-125036426 | PKNOX2 | 0.320788 | 0.464314 | −0.14353 |
1.59×10⁻³ |
|
chr5:158523906-158524598 | EBF1 | 0.517857 | 0.66552 | −0.14766 |
1.19×10⁻² |
Identification and analysis of
differentially methylated miRNA-encoding genes
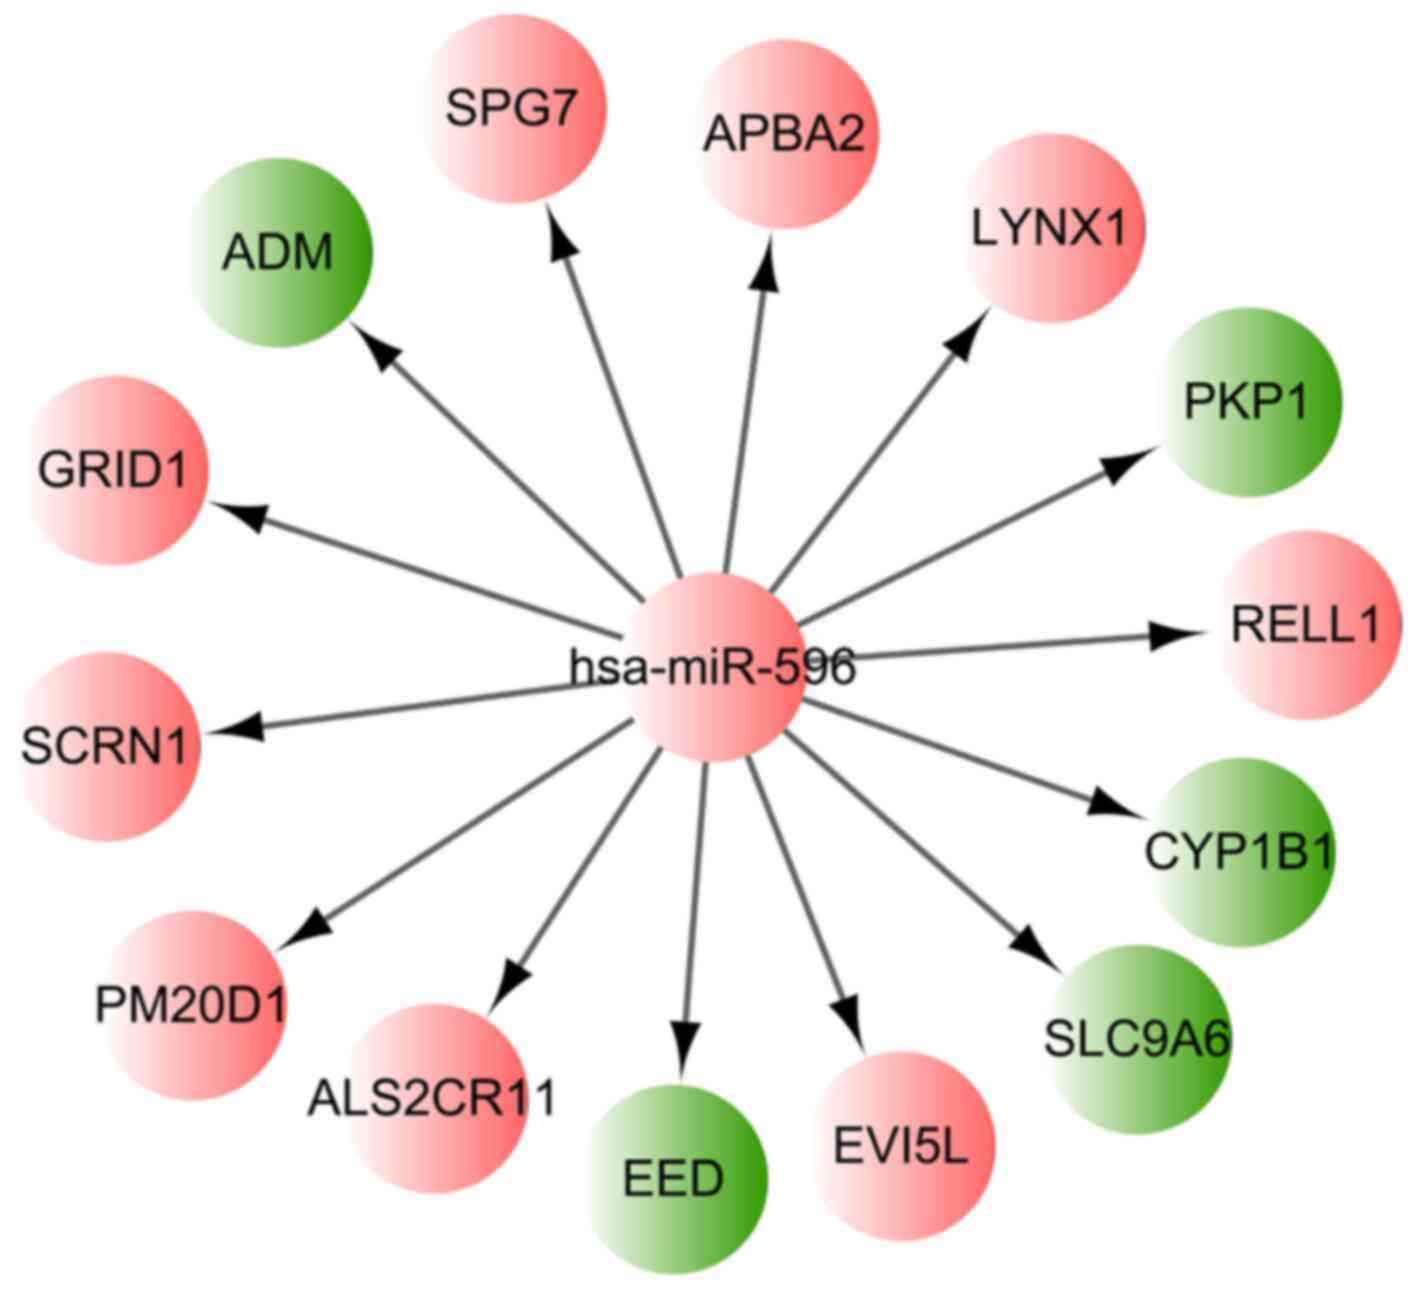
Among the identified 751 differentially methylated
CpG sites, the hsa-miR-596 encoding gene MIR596 was found to
be hypermethylated. The corresponding CpG site of MIR596 was
cg09899173, located in chr8:1764328-1765171. Using the miRWalk2
tool and the identified DMR-related genes, it was found that 14
target genes of hsa-miR-596 were differentially methylated in the
MSC samples of the AML patients, including PM20D1 and
cytochrome P450 family 1 subfamily B member 1 (CYP1B1). The
regulation network based on hsa-miR-596 and those 14 differentially
methylated target genes is presented in Fig. 2.
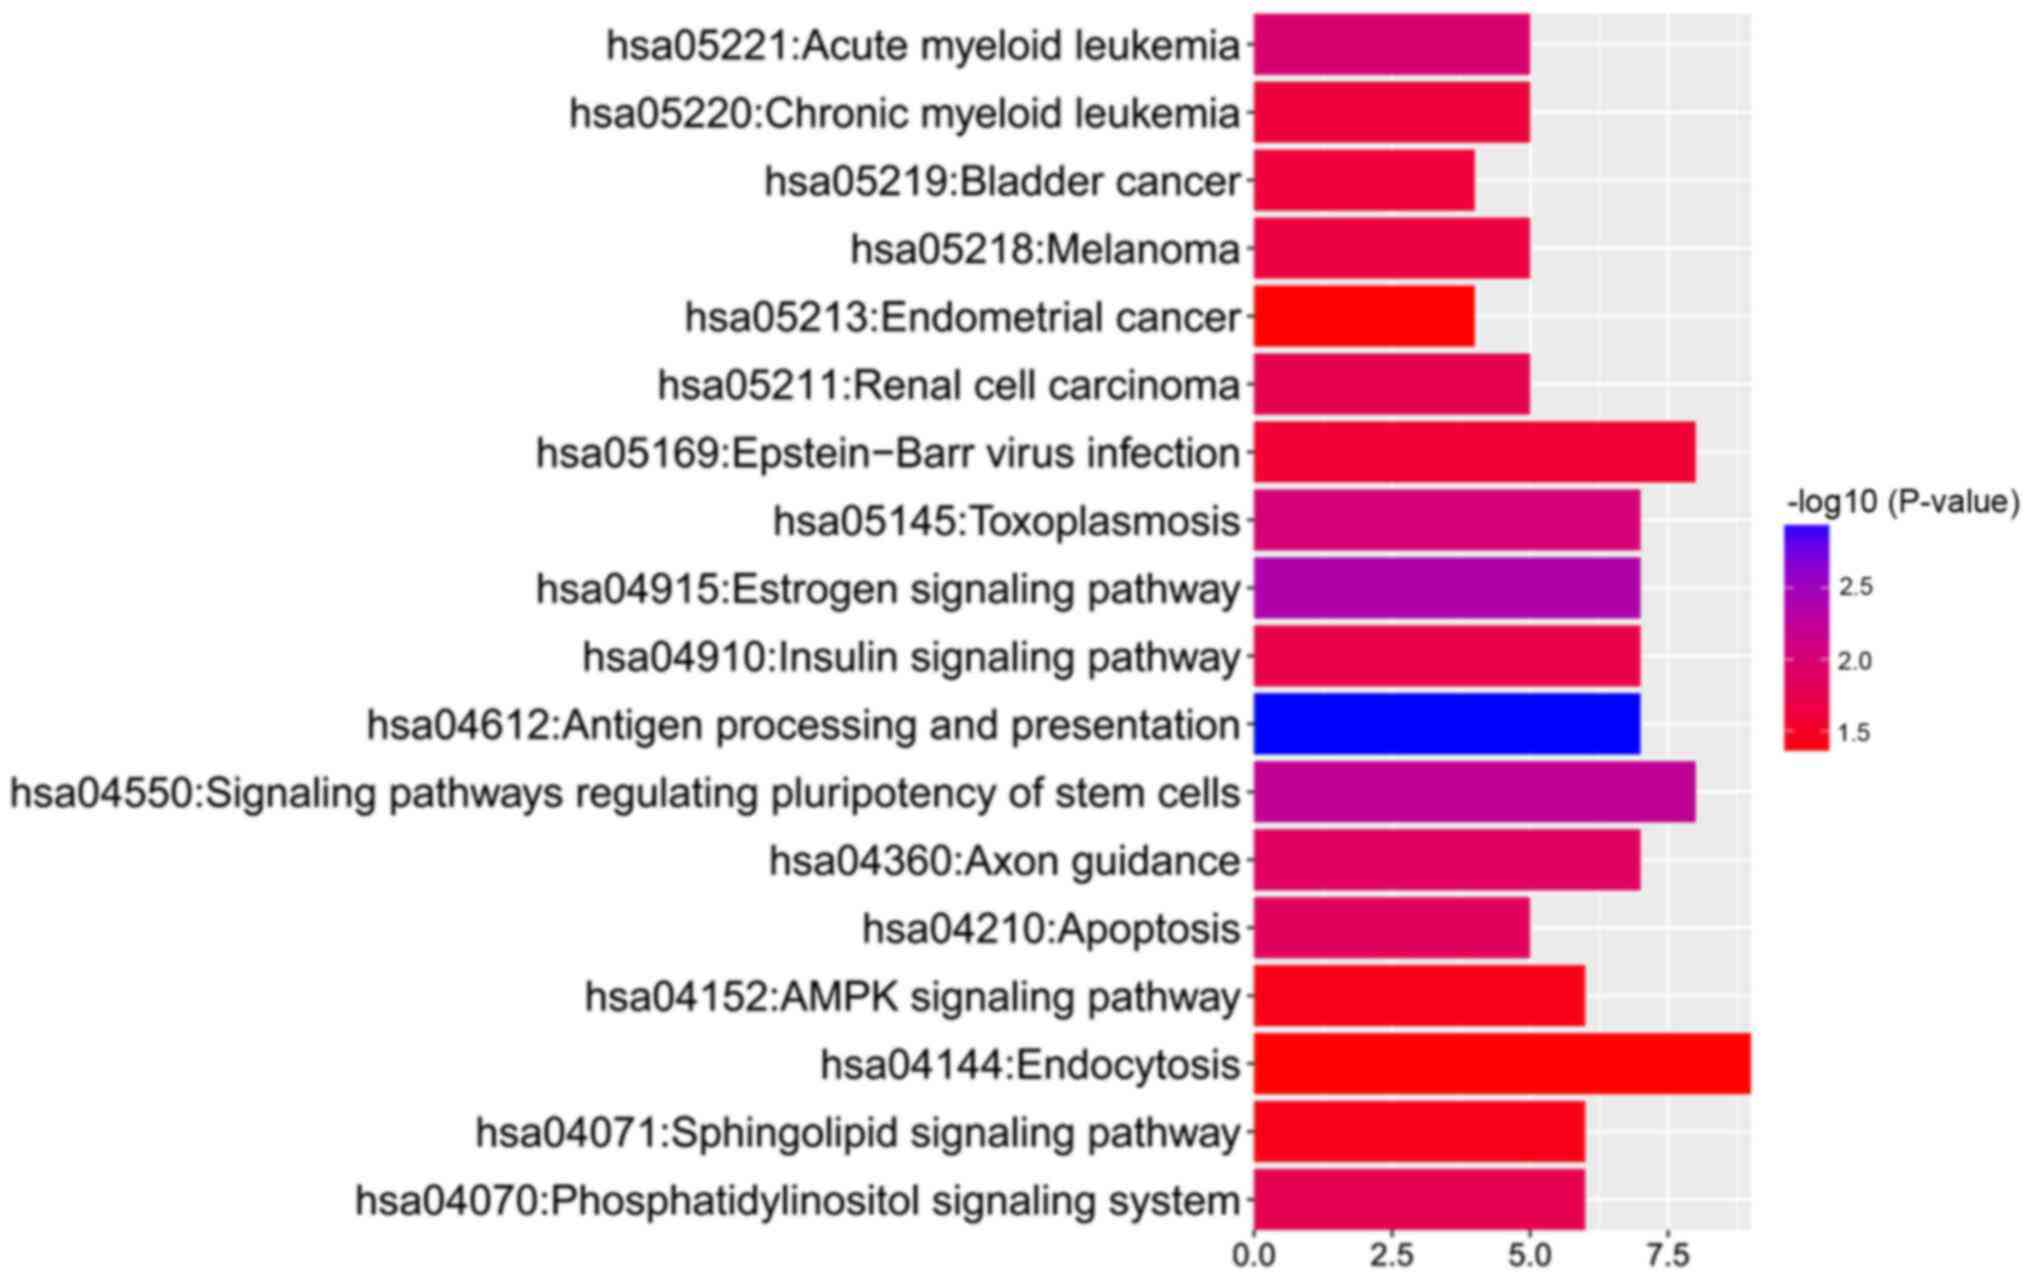
Pathway enrichment analysis of genes
covering differentially methylated loci
To further address the associated functional changes
of gene methylation, KEGG enrichment analysis was performed. The
results showed that the hypermethylated genes, adenylate cyclase 1
(Brain), ribosomal protein S6 kinase A2 (RPS6KA2), glutamate
ionotropic receptor NMDA type subunit 2A and RAP1A, member of RAS
oncogene family (RAP1A), were enriched in only one KEGG
pathway, 'hsa04720: Long-term potentiation'. By contrast, the
hypomethylated genes were enriched in 18 KEGG pathways (Fig. 3). Moreover, pathway analysis
revealed that the hypomethylated genes could be enriched in
'hsa05221: Acute myeloid leukemia' [related hypomethylated genes:
Mitogen-activated protein kinase kinase 2 (MAP2K2),
mitogen-activated protein kinase 3 (MAPK3), A-Raf
proto-oncogene, serine/threonine kinase (ARAF), retinoic
acid receptor α (RARA) and phosphoinositide-3-kinase
regulatory subunit 5 (PIK3R5)] and 'hsa05220: Chronic
myeloid leukemia' [related hypomethylated genes: MAP2K2,
MAPK3, ARAF, PIK3R5 and BCL2 like 1
(BCL2L1)]. The detailed methylation information of the
hypomethylated genes enriched in 'acute myeloid leukemia' and
'chronic myeloid leukemia' pathways is presented in Table II.
| Table IIMethylation information of the genes
enriched in 'acute myeloid leukemia' and 'chronic myeloid leukemia'
pathways. |
Table II
Methylation information of the genes
enriched in 'acute myeloid leukemia' and 'chronic myeloid leukemia'
pathways.
| CpG site | Chr | Loc | Gene | AML.avg.β | Control.avg.β |
AML.vs.control.δ.β | AML.vs.control.
P-value |
|---|
| cg00300298 | 20 | 30308956 | BCL2L1 | 0.30464 | 0.406081 | −0.10144 |
6.61×10⁻⁴ |
| cg02286008 | 16 | 30133247 | MAPK3 | 0.441586 | 0.547321 | −0.10574 |
2.26×10⁻² |
| cg02823329 | 17 | 8792092 | PIK3R5 | 0.453838 | 0.560743 | −0.1069 |
1.18×10⁻² |
| cg13274938 | 17 | 38493822 | RARA | 0.604901 | 0.715056 | −0.11016 |
8.96×10⁻⁵ |
| cg05902503 | 16 | 30133175 | MAPK3 | 0.465769 | 0.578058 | −0.11229 |
6.49×10⁻³ |
| cg21893559 | 19 | 4121075 | MAP2K2 | 0.345042 | 0.460143 | −0.1151 |
2.38×10⁻³ |
| cg13368805 | X | 47420179 | ARAF | 0.165181 | 0.2926 | −0.12742 |
3.24×10⁻² |
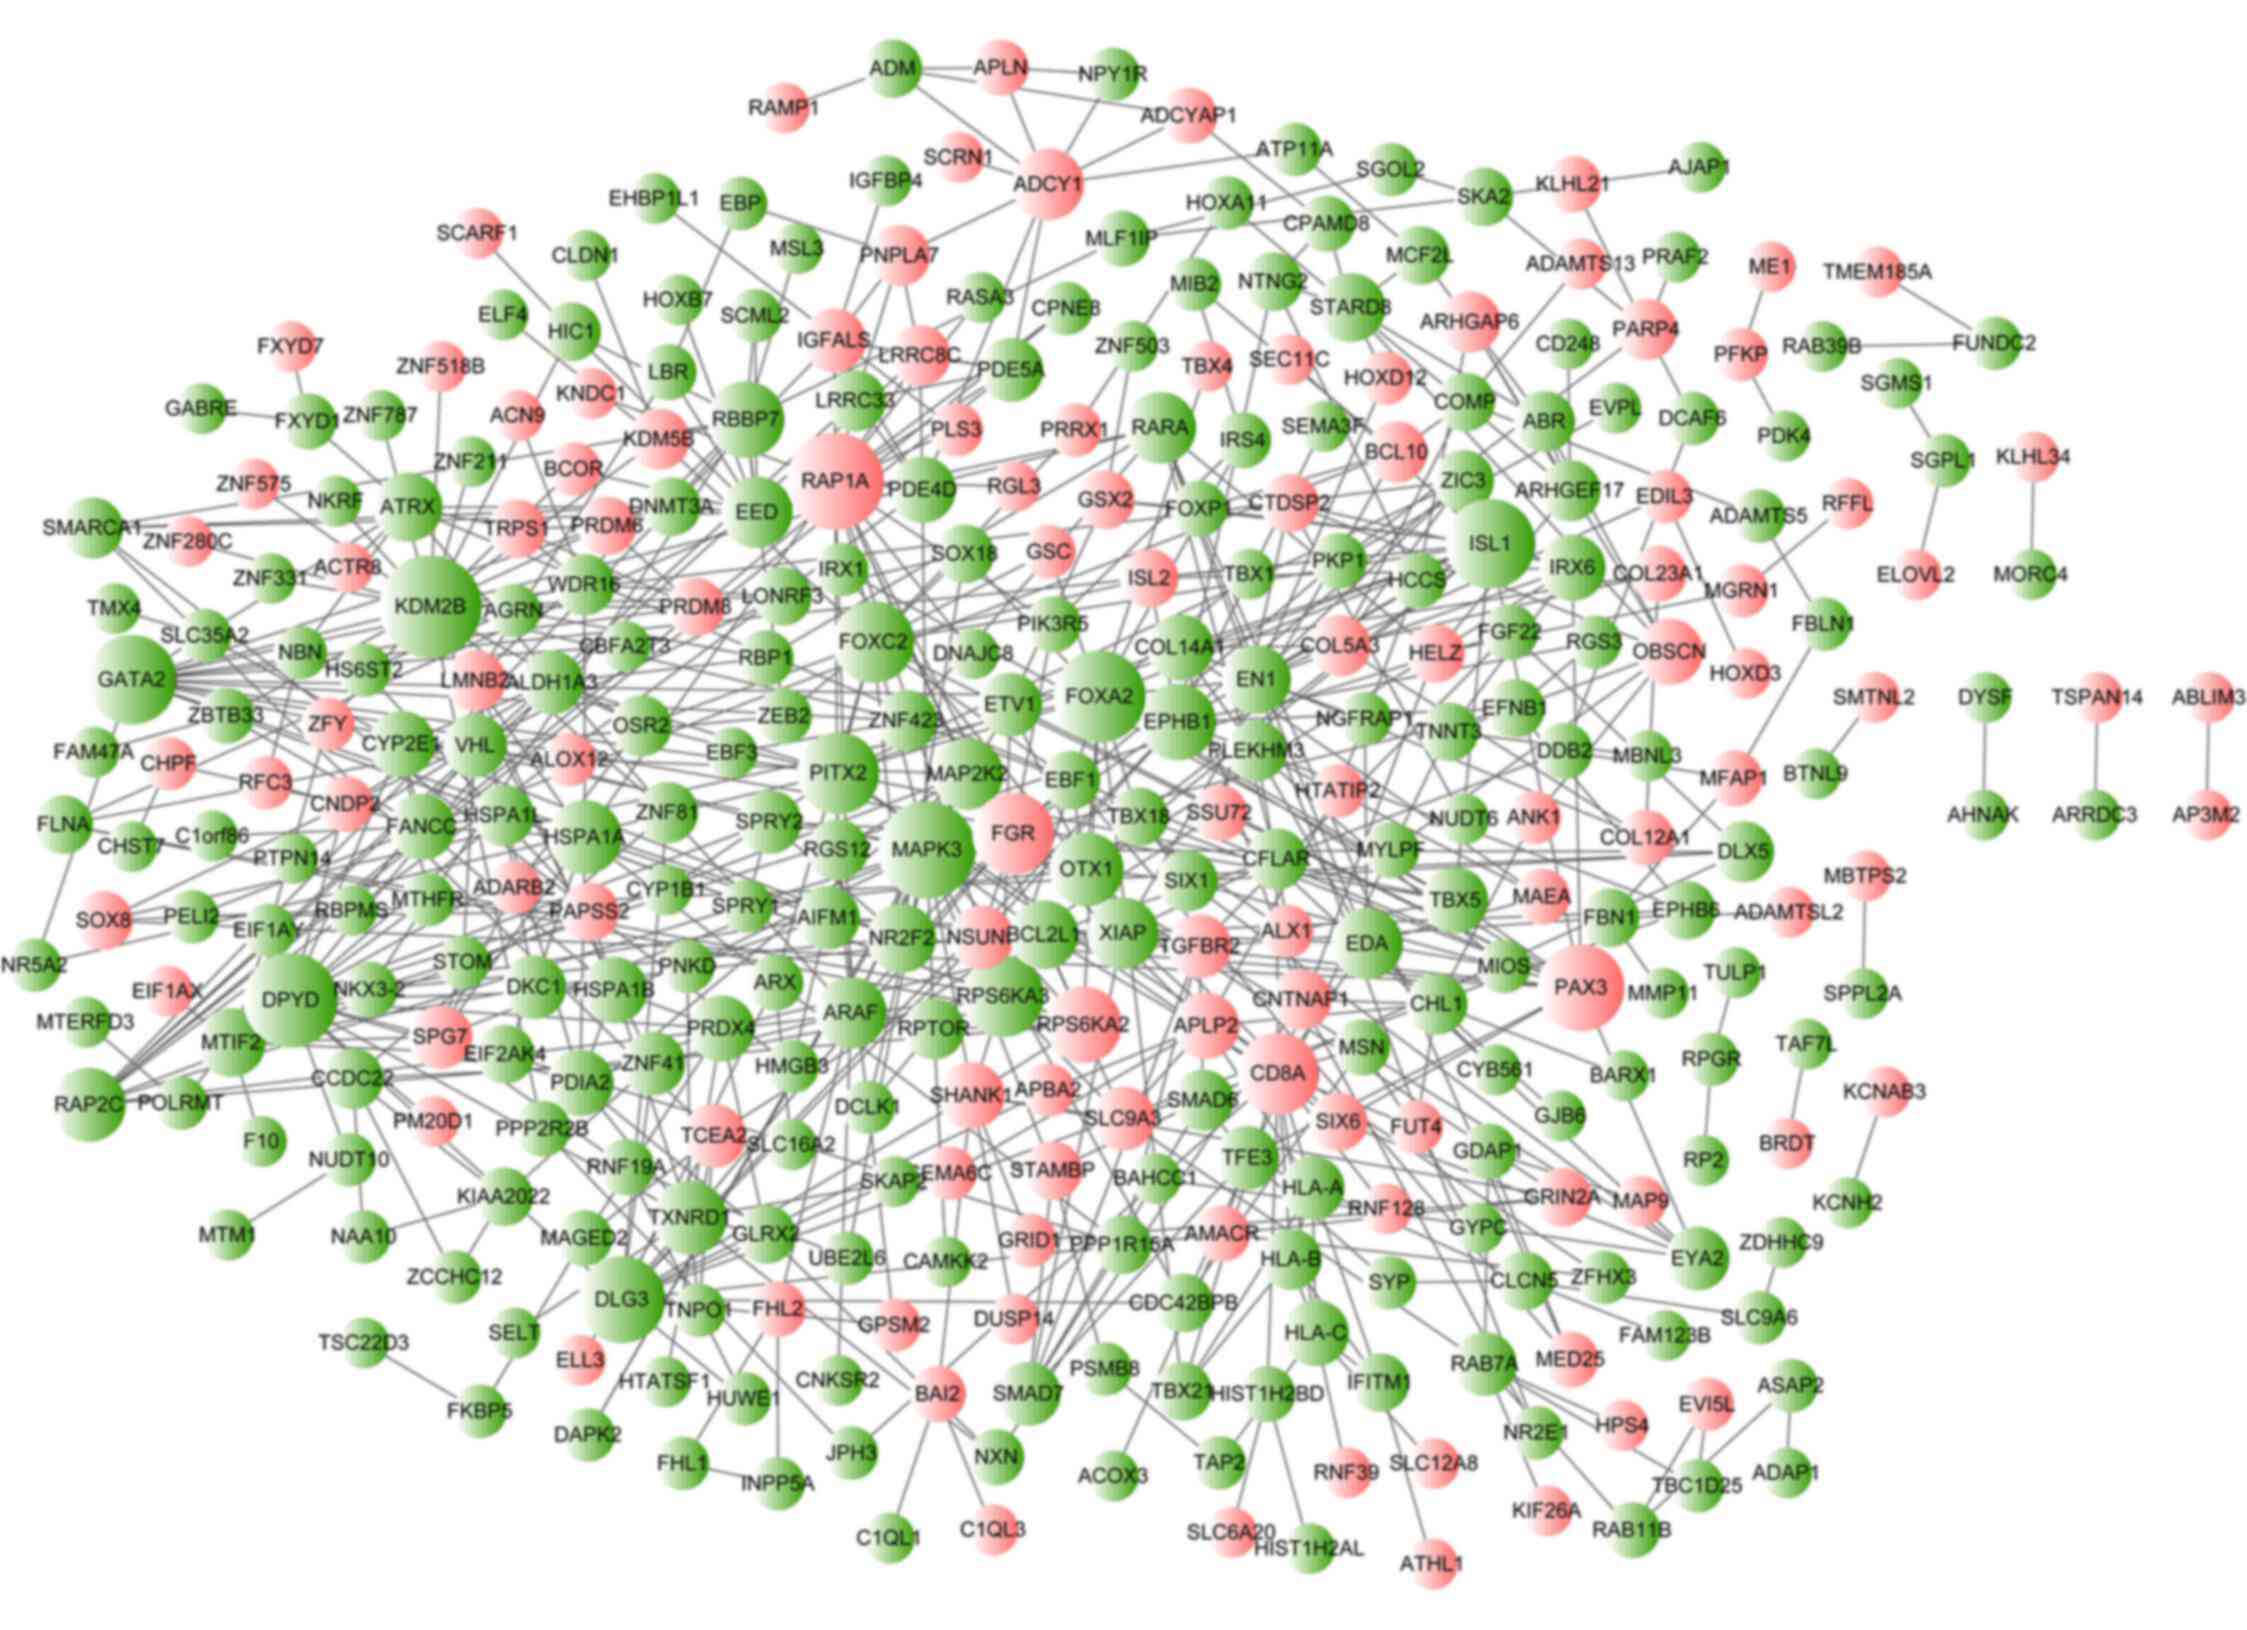
PPI network construction and
analysis
According to the PPI data from the STRING database,
the resulting PPI network of aberrantly methylated genes consisted
of 349 nodes (proteins) and 633 interactions (edges) (Fig. 4). The top 10 nodes with the
highest degree of connectivity in the PPI network were lysine
demethylase 2B (KDM2B; degree=21), MAPK3 (degree=19),
RAP1A (degree=19), dihydropyrimidine dehydrogenase
(DPYD; degree=18), Forkhead box A2 (degree=17), ISL LIM
homeobox 1 (degree=16), GATA binding protein 2 (degree=16), paired
box 3 (degree=15), discs large homolog 3 (degree=15) and
RPS6KA3 (degree=13). Based on the results of pathway
enrichment analysis, the hub gene MAPK3 (degree=19) was also
found to be a gene that was enriched in the 'hsa05221: Acute
myeloid leukemia' and 'hsa05220: Chronic myeloid leukemia'
pathways. Other genes with a degree of connectivity in these 2
pathways were MAP2K2 (degree=9), ARAF (degree=9),
RARA (degree=9), PIK3R5 (degree=3) and BCL2L1
(degree=8).
Analysis of leukemia-associated
differentially methylated genes
A total of 337 leukemia-related marker/therapeutic
genes were derived from the CTD database. Only 11 genes, including
CYP1B1, were shown to be differentially methylated in the
BM-MSCs from patients with AML in this study. The detailed
information on these 11 leukemia-associated differentially
methylated genes is summarized in Table III.
| Table IIIDetailed information of 11
leukemia-associated differentially methylated genes. |
Table III
Detailed information of 11
leukemia-associated differentially methylated genes.
| CpG site | Chr | Loc | Gene | AML.avg.β | Control.avg.β | AML.vs.
control.δ.β | AML.vs.control.
P-value |
|---|
| cg22454769 | 2 | 106000000 | FHL2 | 0.511226 | 0.381313 | 0.129913 |
4.21×10⁻² |
| cg24348495 | 20 | 62693971 | TCEA2 | 0.403689 | 0.283169 | 0.12052 |
9.24×10⁻⁵ |
| cg24598973 | 1 | 969825 | AGRN | 0.444034 | 0.54644 | −0.10241 |
8.47×10⁻³ |
| cg12944530 | 2 | 202000000 | CFLAR | 0.209894 | 0.312596 | −0.1027 |
1.18×10⁻² |
| cg11354105 | 2 | 25475805 | DNMT3A | 0.42197 | 0.526434 | −0.10446 |
3.91×10⁻⁴ |
| cg07841173 | 3 | 128000000 | GATA2 | 0.509397 | 0.616012 | −0.10661 |
2.02×10⁻² |
| cg13274938 | 17 | 38493822 | RARA | 0.604901 | 0.715056 | −0.11016 |
8.96×10⁻⁵ |
| cg00514241 | 22 | 28193910 | MN1 | 0.496668 | 0.608136 | −0.11147 |
1.81×10⁻³ |
| cg20408276 | 2 | 38300586 | CYP1B1 | 0.179514 | 0.291561 | −0.11205 |
3.76×10⁻³ |
| cg11656478 | 2 | 38297759 | CYP1B1 | 0.289594 | 0.415179 | −0.12559 |
7.53×10⁻³ |
| cg18929894 | 12 | 14522829 | ATF7IP | 0.661424 | 0.792015 | −0.13059 |
1.20×10⁻⁴ |
| cg20254225 | 2 | 38301438 | CYP1B1 | 0.280009 | 0.412563 | −0.13255 |
7.24×10⁻⁴ |
| cg17514528 | 1 | 11862907 | MTHFR | 0.352532 | 0.491889 | −0.13936 |
1.18×10⁻⁴ |
| cg02162897 | 2 | 38300537 | CYP1B1 | 0.207392 | 0.348464 | −0.14107 |
3.18×10⁻⁴ |
| cg06264984 | 2 | 38300885 | CYP1B1 | 0.348033 | 0.512794 | −0.16476 |
4.73×10⁻⁵ |
| cg09799983 | 2 | 38301756 | CYP1B1 | 0.397007 | 0.574734 | −0.17773 |
9.42×10⁻⁵ |
Discussion
In the present study, the methylation status of
multiple CpG sites and CpG islands was examined in BM-MSCs from a
series of AML patients compared with normal BM-MSC from control
donors. The results showed that 228 hypermethylated CpG site probes
covering 183 gene symbols and 523 hypomethylated CpG site probes
covering 362 gene symbols were identified in the BM-MSCs from the
AML patients. Overall, 4 genes with CpG island hypermethylation
were identified, including PM20D1. The hsa-miR-596-encoding
gene MIR596 was found to be hypermethylated and the
regulation network based on hsa-miR-596 and its targets (such as
CYP1B1) was constructed. Hypermethylated and hypomethylated
genes were enriched in different KEGG pathways, including
'hsa05221: Acute myeloid leukemia' and 'hsa05220: Chronic myeloid
leukemia', which the hypomethylated gene MAPK3 showed
involvement in. In addition, MAPK3, KDM2B and
RAP1A were hubs in the PPI network of methylated genes.
Cytosine methylation is a DNA modification generally
associated with transcriptional silencing (28). It is clear that the
hypermethylation of CpG islands concomitant with global
hypomethylation is a feature of nearly all human cancer types
(29). When identifying DMRs
between cancer genomes of cells or tissues from patients and normal
cells or tissues from control donors, a number of the most relevant
DNA methylation differences occur at CpG island regions (30). Detecting hypermethylation of CpG
islands of genes has emerged as a promising method for the
diagnosis and monitoring of cancer (29). In the present study, PM20D1
was identified with hypermethylated CpG islands, indicating that
the expression of PM20D1 was downregulated or silenced.
PM20D1, a secreted enzyme, exhibits hydrolytic and catalytic
activity to reversibly form N-acyl amino acids (31). Recently, Long et al
(32) reported that the PM20D1
enzyme could tack lipids on to amino acids and that these generated
N-acyl amino acids directly activated mitochondria for
thermogenesis. Non-shivering thermogenesis is a major component of
energy expenditure and has been implicated in the regulation of
body weight (33). Moreover,
evidence shows that children with acute lymphoblastic leukemia
typically gain weight and do so at excessive rates, and are
significantly fatter than children with other malignancies and
healthy sibling controls (34).
In accordance with previous studies, we hypothesized that
PM20D1 with hypermethylation of CpG islands may be
associated with the energy expenditure of patients with AML.
However, these issues must now be addressed in further studies that
include larger numbers of patients.
Studies have shown that deregulated expression of
miRNAs may occur in disease, and methylation has been considered as
one of the mechanisms that may be associated with miRNA silencing
(35). For instance, the study by
Heller et al (35)
identified that miR-9-3 and miR-193a were tumor specifically
methylated in patients with non-small cell lung cancer, and the
methylation of miRNAs could be used as the prognostic parameter.
Additionally, another study suggested that miR-596 may be
tumor-suppressive miRNA in oral cancer, and DNA hypermethylation of
the CpG island of the miR-596 gene was frequently observed in oral
cancer cell lines (36). In the
present study, it was found that the hsa-miR-596-encoding gene
MIR596 was hypermethylated in the BM-MSCs from a series of
AML patients. Furthermore, miR-596 could regulate several
hypermethylated and hypomethylated genes in the regulation network.
Thus, it was suggested that the hypermethylation of miR-596 may be
associated with its transcriptional regulation. It was also
inferred that miR-596 methylation in BM-MSCs may be a biomarker or
prognostic factor for patients with AML. However, the significance
of the methylation of miR-596 demands further investigation.
In conclusion, the present results provide evidence
for epigenetic changes and widespread methylation of genes in
BM-MSCs from patients with AML. PM20D1 with hypermethylation
of CpG islands may be associated with the energy expenditure of
patients with AML. Furthermore, the aberrant hypermethylated
miR-596-encoding gene MIR596 may be a potential biomarker of
AML. Methylation profiling of larger sample groups may aid in
clarifying whether aberrant methylation of these genes in AML is
random or specific. However, these findings may provide potential
biomarkers and reveal information regarding the pathological
mechanism of AML.
Acknowledgments
The founders supporting this study are listed as
follows: The National Natural Science Foundation of China (grant
no. 81400168), the Guangzhou Health Care and Cooperative Innovation
Major Project (grant no. 201400000003-1), the Science and
Technology Planning Project of Guangdong, China (grant nos.
2014A020209047 and 2015A020210068), the Foundation of Guangdong
Traditional Chinese Medicine (grant no. 20131104), the Foundation
of Guangdong Medicine (grant nos. A2013128 and A2017266), the
Foundation of Technological Support of Xinjiang Uygur Autonomous
region (grant no. 201491185) and the Foundation of Guangdong Second
Provincial General Hospital (grant nos. YY2014-002,
YQ2015-004/005/012/016, YQ2016-011/013, 2017-001).
Note added in proof ((added 17th
March, 2025)
Note that it has come to light that, as originally
published, in the final sentence of the Abstract and in the final
two paragraphs of the Discussion, this paper erroneously contained
references to ‘MIR159’ and ‘miR-159’, which were intended to
have been written as ‘MIR596’ and ‘miR-596’, respectively.
These corrections have been incorporated into this paper.
References
|
1
|
Grove CS and Vassiliou GS: Acute myeloid
leukaemia: A paradigm for the clonal evolution of cancer. Dis Model
Mech. 7:941–951. 2014. View Article : Google Scholar : PubMed/NCBI
|
|
2
|
Estey EH and Ayalew T: Acute myeloid
leukemia: 2012 update on diagnosis, risk stratification, and
management. Am J Hematol. 87:89–99. 2012. View Article : Google Scholar
|
|
3
|
Ferrara F and Schiffer CA: Acute myeloid
leukaemia in adults. Lancet. 381:484–495. 2013. View Article : Google Scholar : PubMed/NCBI
|
|
4
|
Zhou M and Tong X: Downregulated Poly-C
binding protein-1 is a novel predictor associated with poor
prognosis in Acute Myeloid Leukemia. Diagn Pathol. 10:1472015.
View Article : Google Scholar : PubMed/NCBI
|
|
5
|
Kwon HY, Bajaj J, Ito T, Blevins A, Konuma
T, Weeks J, Lytle NK, Koechlein CS, Rizzieri D, Chuah C, et al:
Tetraspanin 3 is required for the development and propagation of
acute myelogenous leukemia. Cell Stem Cell. 17:152–164. 2015.
View Article : Google Scholar : PubMed/NCBI
|
|
6
|
Creutzig U, van den Heuvel-Eibrink MM,
Gibson B, Dworzak MN, Adachi S, de Bont E, Harbott J, Hasle H,
Johnston D, Kinoshita A, et al: AML Committee of the International
BFM Study Group: Diagnosis and management of acute myeloid leukemia
in children and adolescents: Recommendations from an international
expert panel. Blood. 120:3187–3205. 2012. View Article : Google Scholar : PubMed/NCBI
|
|
7
|
Li S, Garrett-Bakelman FE, Chung SS,
Sanders MA, Hricik T, Rapaport F, Patel J, Dillon R, Vijay P, Brown
AL, et al: Distinct evolution and dynamics of epigenetic and
genetic heterogeneity in acute myeloid leukemia. Nat Med.
22:792–799. 2016. View
Article : Google Scholar : PubMed/NCBI
|
|
8
|
Chen C, Liu Y, Lu C, Cross JR, Morris JP
IV, Shroff AS, Ward PS, Bradner JE, Thompson C and Lowe SW:
Cancer-associated IDH2 mutants drive an acute myeloid leukemia that
is susceptible to Brd4 inhibition. Genes Dev. 27:1974–1985. 2013.
View Article : Google Scholar : PubMed/NCBI
|
|
9
|
Figueroa ME, Lugthart S, Li Y,
Erpelinck-Verschueren C, Deng X, Christos PJ, Schifano E, Booth J,
van Putten W, Skrabanek L, et al: DNA methylation signatures
identify biologically distinct subtypes in acute myeloid leukemia.
Cancer Cell. 17:13–27. 2010. View Article : Google Scholar : PubMed/NCBI
|
|
10
|
Akalin A, Garrett-Bakelman FE, Kormaksson
M, Busuttil J, Zhang L, Khrebtukova I, Milne TA, Huang Y, Biswas D,
Hess JL, et al: Base-pair resolution DNA methylation sequencing
reveals profoundly divergent epigenetic landscapes in acute myeloid
leukemia. PLoS Gene. 8:e10027812012. View Article : Google Scholar
|
|
11
|
Tao YF, Ni J, Lu J, Wang N, Xiao PF, Zhao
WL, Wu D, Pang L, Wang J, Feng X and Pan J: The promoter of miR-663
is hypermethylated in Chinese pediatric acute myeloid leukemia
(AML). BMC Med Genet. 14:742013. View Article : Google Scholar
|
|
12
|
Rodríguez-Pardo VM, Aristizabal JA, Jaimes
D, Quijano SM, de los Reyes I, Herrera MV, Solano J and Vernot JP:
Mesenchymal stem cells promote leukaemic cells aberrant phenotype
from B-cell acute lymphoblastic leukaemia. Hematol Oncol Stem Cell
Ther. 6:89–100. 2013. View Article : Google Scholar : PubMed/NCBI
|
|
13
|
Blau O, Hofmann WK, Baldus CD, Thiel G,
Serbent V, Schümann E, Thiel E and Blau IW: Chromosomal aberrations
in bone marrow mesenchymal stroma cells from patients with
myelodysplastic syndrome and acute myeloblastic leukemia. Exp
Hematol. 35:221–229. 2007. View Article : Google Scholar : PubMed/NCBI
|
|
14
|
Roela RA, Carraro DM, Brentani HP, Kaiano
JHL, Simão DF, Guarnieiro R, Lopes LF, Borojevic R and Brentani MM:
Gene stage-specific expression in the microenvironment of pediatric
myelodysplastic syndromes. Leuk Res. 31:579–589. 2007. View Article : Google Scholar
|
|
15
|
Barrett T, Troup DB, Wilhite SE, Ledoux P,
Evangelista C, Kim IF, Tomashevsky M, Marshall KA, Phillippy KH,
Sherman PM, et al: NCBI GEO: Archive for functional genomics data
sets - 10 years on. Nucleic Acids Res. 39:D1005–D1010. 2011.
View Article : Google Scholar
|
|
16
|
von der Heide EK, Neumann M, Vosberg S,
James AR, Schroeder MP, Ortiz-Tanchez J, Isaakidis K, Schlee C,
Luther M, Jöhrens K, et al: Molecular alterations in bone marrow
mesenchymal stromal cells derived from acute myeloid leukemia
patients. Leukemia. 31:1069–1078. 2017. View Article : Google Scholar
|
|
17
|
Pérez C, Martínez-Calle N, Martín-Subero
JI, Segura V, Delabesse E, Fernandez-Mercado M, Garate L, Alvarez
S, Rifon J, Varea S, et al: TET2 mutations are associated with
specific 5-meth-ylcytosine and 5-hydroxymethylcytosine profiles in
patients with chronic myelomonocytic leukemia. PLoS One.
7:e316052012. View Article : Google Scholar
|
|
18
|
Bibikova M, Lin Z, Zhou L, Chudin E,
Garcia EW, Wu B, Doucet D, Thomas NJ, Wang Y, Vollmer E, et al:
High-throughput DNA methylation profiling using universal bead
arrays. Genome Res. 16:383–393. 2006. View Article : Google Scholar : PubMed/NCBI
|
|
19
|
Warden CD, Lee H, Tompkins JD, Li X, Wang
C, Riggs AD, Yu H, Jove R and Yuan YC: COHCAP: An integrative
genomic pipeline for single-nucleotide resolution DNA methylation
analysis. Nucleic Acids Re. 41:e117. 2013. View Article : Google Scholar
|
|
20
|
Robinson MD, Kahraman A, Law CW, Lindsay
H, Nowicka M, Weber LM and Zhou X: Statistical methods for
detecting differentially methylated loci and regions. Front Genet.
5:3242014. View Article : Google Scholar : PubMed/NCBI
|
|
21
|
Dweep H and Gretz N: miRWalk2.0: A
comprehensive atlas of microRNA-target interactions. Nat Methods.
12:6972015. View Article : Google Scholar : PubMed/NCBI
|
|
22
|
Smoot ME, Ono K, Ruscheinski J, Wang PL
and Ideker T: Cytoscape 28: New features for data integration and
network visualization. Bioinformatics. 27:431–432. 2011. View Article : Google Scholar
|
|
23
|
Huang W, Sherman BT and Lempicki RA:
Systematic and integrative analysis of large gene lists using DAVID
bioinformatics resources. Nat Protoc. 4:44–57. 2009. View Article : Google Scholar
|
|
24
|
Szklarczyk D, Franceschini A, Wyder S,
Forslund K, Heller D, Huerta-Cepas J, Simonovic M, Roth A, Santos
A, Tsafou KP, et al: STRING v10: Protein-protein interaction
networks, integrated over the tree of life. Nucleic Acids Res.
43:D447–D452. 2015. View Article : Google Scholar
|
|
25
|
Lopes CT, Franz M, Kazi F, Donaldson SL,
Morris Q and Bader GD: Cytoscape Web: An interactive web-based
network browser. Bioinformatics. 26:2347–2348. 2010. View Article : Google Scholar : PubMed/NCBI
|
|
26
|
Davis AP, Murphy CG, Johnson R, Lay JM,
Lennon-Hopkins K, Saraceni-Richards C, Sciaky D, King BL,
Rosenstein MC, et al: The comparative toxicogenomics database:
Update 2013. Nucleic Acids Res. 39:1067–1072. 2011. View Article : Google Scholar
|
|
27
|
Bauer-Mehren A, Bundschus M, Rautschka M,
Mayer MA, Sanz F and Furlong LI: Gene-disease network analysis
reveals functional modules in mendelian, complex and environmental
diseases. PLoS One. 6:e202842011. View Article : Google Scholar : PubMed/NCBI
|
|
28
|
Schübeler D: Function and information
content of DNA methylation. Nature. 517:321–326. 2015. View Article : Google Scholar
|
|
29
|
Wen L, Li J, Guo H, Liu X, Zheng S, Zhang
D, Zhu W, Qu J, Guo L, Du D, et al: Genome-scale detection of
hypermethylated CpG islands in circulating cell-free DNA of
hepatocellular carcinoma patients. Cell Res. 1376:252015.
|
|
30
|
Jung M, Kadam S, Xiong W, Rauch TA, Jin SG
and Pfeifer GP: MIRA-seq for DNA methylation analysis of CpG
islands. Epigenomics. 7:695–706. 2015. View Article : Google Scholar : PubMed/NCBI
|
|
31
|
Larrick JW, Larrick JW and Mendelsohn AR:
Uncoupling Mitochondrial Respiration for Diabesity. Rejuvenation
Res. 19:337–340. 2016. View Article : Google Scholar : PubMed/NCBI
|
|
32
|
Long JZ, Svensson KJ, Bateman LA, Lin H,
Kamenecka T, Lokurkar IA, Lou J, Rao RR, Chang MR, Jedrychowski MP,
et al: The Secreted Enzyme M20D1 Regulates Lipidated Amino Acid
Uncouplers of Mitochondria. Cell. 166:424–435. 2016. View Article : Google Scholar : PubMed/NCBI
|
|
33
|
Matsuda J, Hosoda K, Itoh H, Son C, Doi K,
Tanaka T, Fukunaga Y, Inoue G, Nishimura H, Yoshimasa Y, et al:
Cloning of rat uncoupling protein-3 and uncoupling protein-2 cDNAs:
Their gene expression in rats fed high-fat diet. FEBS Lett.
418:200–204. 1997. View Article : Google Scholar : PubMed/NCBI
|
|
34
|
Warner JT, Evans WD, Webb DKH and Gregory
JW: Body composition of long-term survivors of acute lymphoblastic
leukaemia. Med Pediatr Oncol. 38:165–172. 2002. View Article : Google Scholar : PubMed/NCBI
|
|
35
|
Heller G, Weinzierl M, Noll C, Babinsky V,
Ziegler B, Altenberger C, Minichsdorfer C, Lang G, Döme B,
End-Pfützenreuter A, et al: Genome-wide miRNA expression profiling
identifies miR-9-3 and miR-193a as targets for DNA methylation in
non-small cell lung cancers. Clin Cancer Res. 18:1619–1629. 2012.
View Article : Google Scholar : PubMed/NCBI
|
|
36
|
Endo H, Muramatsu T, Furuta M, Uzawa N,
Pimkhaokham A, Amagasa T, Inazawa J and Kozaki K: Potential of
tumor-suppressive miR-596 targeting LGALS3BP as a therapeutic agent
in oral cancer. Carcinogenesis. 34:560–569. 2013. View Article : Google Scholar
|