Open Access

Logistic regression analysis for the identification of the metastasis-associated signaling pathways of osteosarcoma

  • Authors:
    • Yang Liu
    • Wei Sun
    • Xiaojun Ma
    • Yuedong Hao
    • Gang Liu
    • Xiaohui Hu
    • Houlai Shang
    • Pengfei Wu
    • Zexue Zhao
    • Weidong Liu
  • View Affiliations

  • Published online on: January 2, 2018     https://doi.org/10.3892/ijmm.2018.3360
  • Pages: 1233-1244
  • Copyright: © Liu et al. This is an open access article distributed under the terms of Creative Commons Attribution License.

Metrics: Total Views: 0 (Spandidos Publications: | PMC Statistics: )
Total PDF Downloads: 0 (Spandidos Publications: | PMC Statistics: )


Abstract

Osteosarcoma (OS) is the most common histological type of primary bone cancer. The present study was designed to identify the key genes and signaling pathways involved in the metastasis of OS. Microarray data of GSE39055 were downloaded from the Gene Expression Omnibus database, which included 19 OS biopsy specimens before metastasis (control group) and 18 OS biopsy specimens after metastasis (case group). After the differentially expressed genes (DEGs) were identified using the Linear Models for Microarray Analysis package, hierarchical clustering analysis and unsupervised clustering analysis were performed separately, using orange software and the self-organization map method. Based upon the Database for Annotation, Visualization and Integrated Discovery tool and Cytoscape software, enrichment analysis and protein-protein interaction (PPI) network analysis were conducted, respectively. After function deviation scores were calculated for the significantly enriched terms, hierarchical clustering analysis was performed using Cluster 3.0 software. Furthermore, logistic regression analysis was used to identify the terms that were significantly different. Those terms that were significantly different were validated using other independent datasets. There were 840 DEGs in the case group. There were various interactions in the PPI network [including intercellular adhesion molecule-1 (ICAM1), transforming growth factor β1 (TGFB1), TGFB1-platelet-derived growth factor subunit B (PDGFB) and PDGFB-platelet‑derived growth factor receptor-β (PDGFRB)]. Regulation of cell migration, nucleotide excision repair, the Wnt signaling pathway and cell migration were identified as the terms that were significantly different. ICAM1, PDGFB, PDGFRB and TGFB1 were identified to be enriched in cell migration and regulation of cell migration. Nucleotide excision repair and the Wnt signaling pathway were the metastasis-associated pathways of OS. In addition, ICAM1, PDGFB, PDGFRB and TGFB1, which were involved in cell migration and regulation of cell migration may affect the metastasis of OS.

Introduction

As a cancerous tumor that originates from bone, osteosarcoma (OS) is the most frequent histological type of primary bone cancer (1). It is usually derived from tubular long bones, with 10% occurring in the humerus, 19% in the tibia and 42% in the femur (2). OS is the eighth most common type of cancer in pediatric patients, accounting for ~20% of all primary bone cancers and 2.4% of all malignancies in children (3). OS usually occurs in young adults and teenagers, and may be treated by surgical resection of the cancer (4). Although ~90% of OS patients undergo limb-salvage surgery, the subsequent complications (such as infection, local tumor recurrence, prosthetic non-union and loosening) may result in further surgery or amputation (5). Thus, revealing the underlying mechanisms of OS is considered to be important for improving therapeutic strategies.

Through activating the phosphatidylinositol 3-kinase (PI3K)/Akt signaling pathway, metastasis-associated lung adenocarcinoma transcript 1 contributes to proliferation and metastasis of OS and serves as a therapeutic target for OS patients (6,7). Transforming growth factor-α (TGF-α)/epidermal growth factor receptor (EGFR) interaction induces the activation of PI3K/Akt and nuclear factor-κB (NF-κB) signaling pathways, leading to intracellular cell adhesion molecule 1 (ICAM1) expression and promoting the metastasis of human OS cells (8). The low expression level of monocarboxylate transporter isoform 1 (MCT1) performs an antitumor role via the NF-κB signaling pathway, and the high expression level of MCT1 predicts poor overall survival in OS patients (9). As a negative regulator of Wnt signaling, naked cuticle homolog 2 functions in inhibiting tumor growth and invasion of human OS (10,11). Via activation of the cyclooxygenase-2 (COX-2) gene, p50-associated COX-2 extragenic RNA promotes the proliferation and invasion of OS cells (12). Although these studies have investigated the underlying mechanisms of OS metastasis, the key genes and signaling pathways involved in the metastasis of OS have not been fully reported.

In 2013, Kelly et al (13) performed formalin-fixed, paraffin-embedded assays to identify the miRNA biomarkers associated with OS prognosis, finding that the 14q32 locus was potential involved in the progression and outcome of OS. Using the data deposited by Kelly et al (13), the differentially expressed genes (DEGs) were identified between the OS biopsy specimens following metastasis and the OS biopsy specimens prior to metastasis. Subsequently, comprehensive bioinformatics analyses [including clustering analysis, enrichment analysis, protein-protein network (PPI) analysis, calculation of function deviation score and logistic regression analysis] were performed to identify the metastasis-associated terms. Finally, the metastasis-associated terms were further confirmed by other independent datasets.

Materials and methods

Microarray data

Gene expression profiling and clinical outcomes under GSE39055 were downloaded from the Gene Expression Omnibus database (GEO; http://www.ncbi.nlm.nih.gov/geo/) database, which was based on the GEO platform, GPL14951, Illumina HumanHT-12 WG-DASL v4.0 R2 expression BeadChip. GSE39055 included 19 OS biopsy specimens before metastasis and 18 OS biopsy specimens after metastasis. The samples were acquired from the pathology archives of Boston Children’s Hospital (Boston, USA) and Beth Israel Deaconess Medical Center (Boston, USA). Kelly et al (13) deposited GSE39055, and the study obtained the approval of the Institutional Review Boards at Boston Children’s Hospital and Beth Israel Deaconess Medical Center with a waiver of consent.

DEG screening and clustering analysis

Based on the platform annotation information, all probe IDs were transformed into gene symbols. When one gene symbol corresponded to multiple probes, the gene expression value was obtained by calculating the average value of the probes. Subsequently, Z-score normalization was performed for all gene expression values. Using the Linear Models for Microarray Analysis package (http://www.bioconductor.org/packages/release/bioc/html/limma.html) (14) in R, the DEGs between the OS biopsy specimens after metastasis (case group) and the OS biopsy specimens before metastasis (control group) were analyzed. P<0.05 and |logFC (fold change)| >0.6 were set as the thresholds.

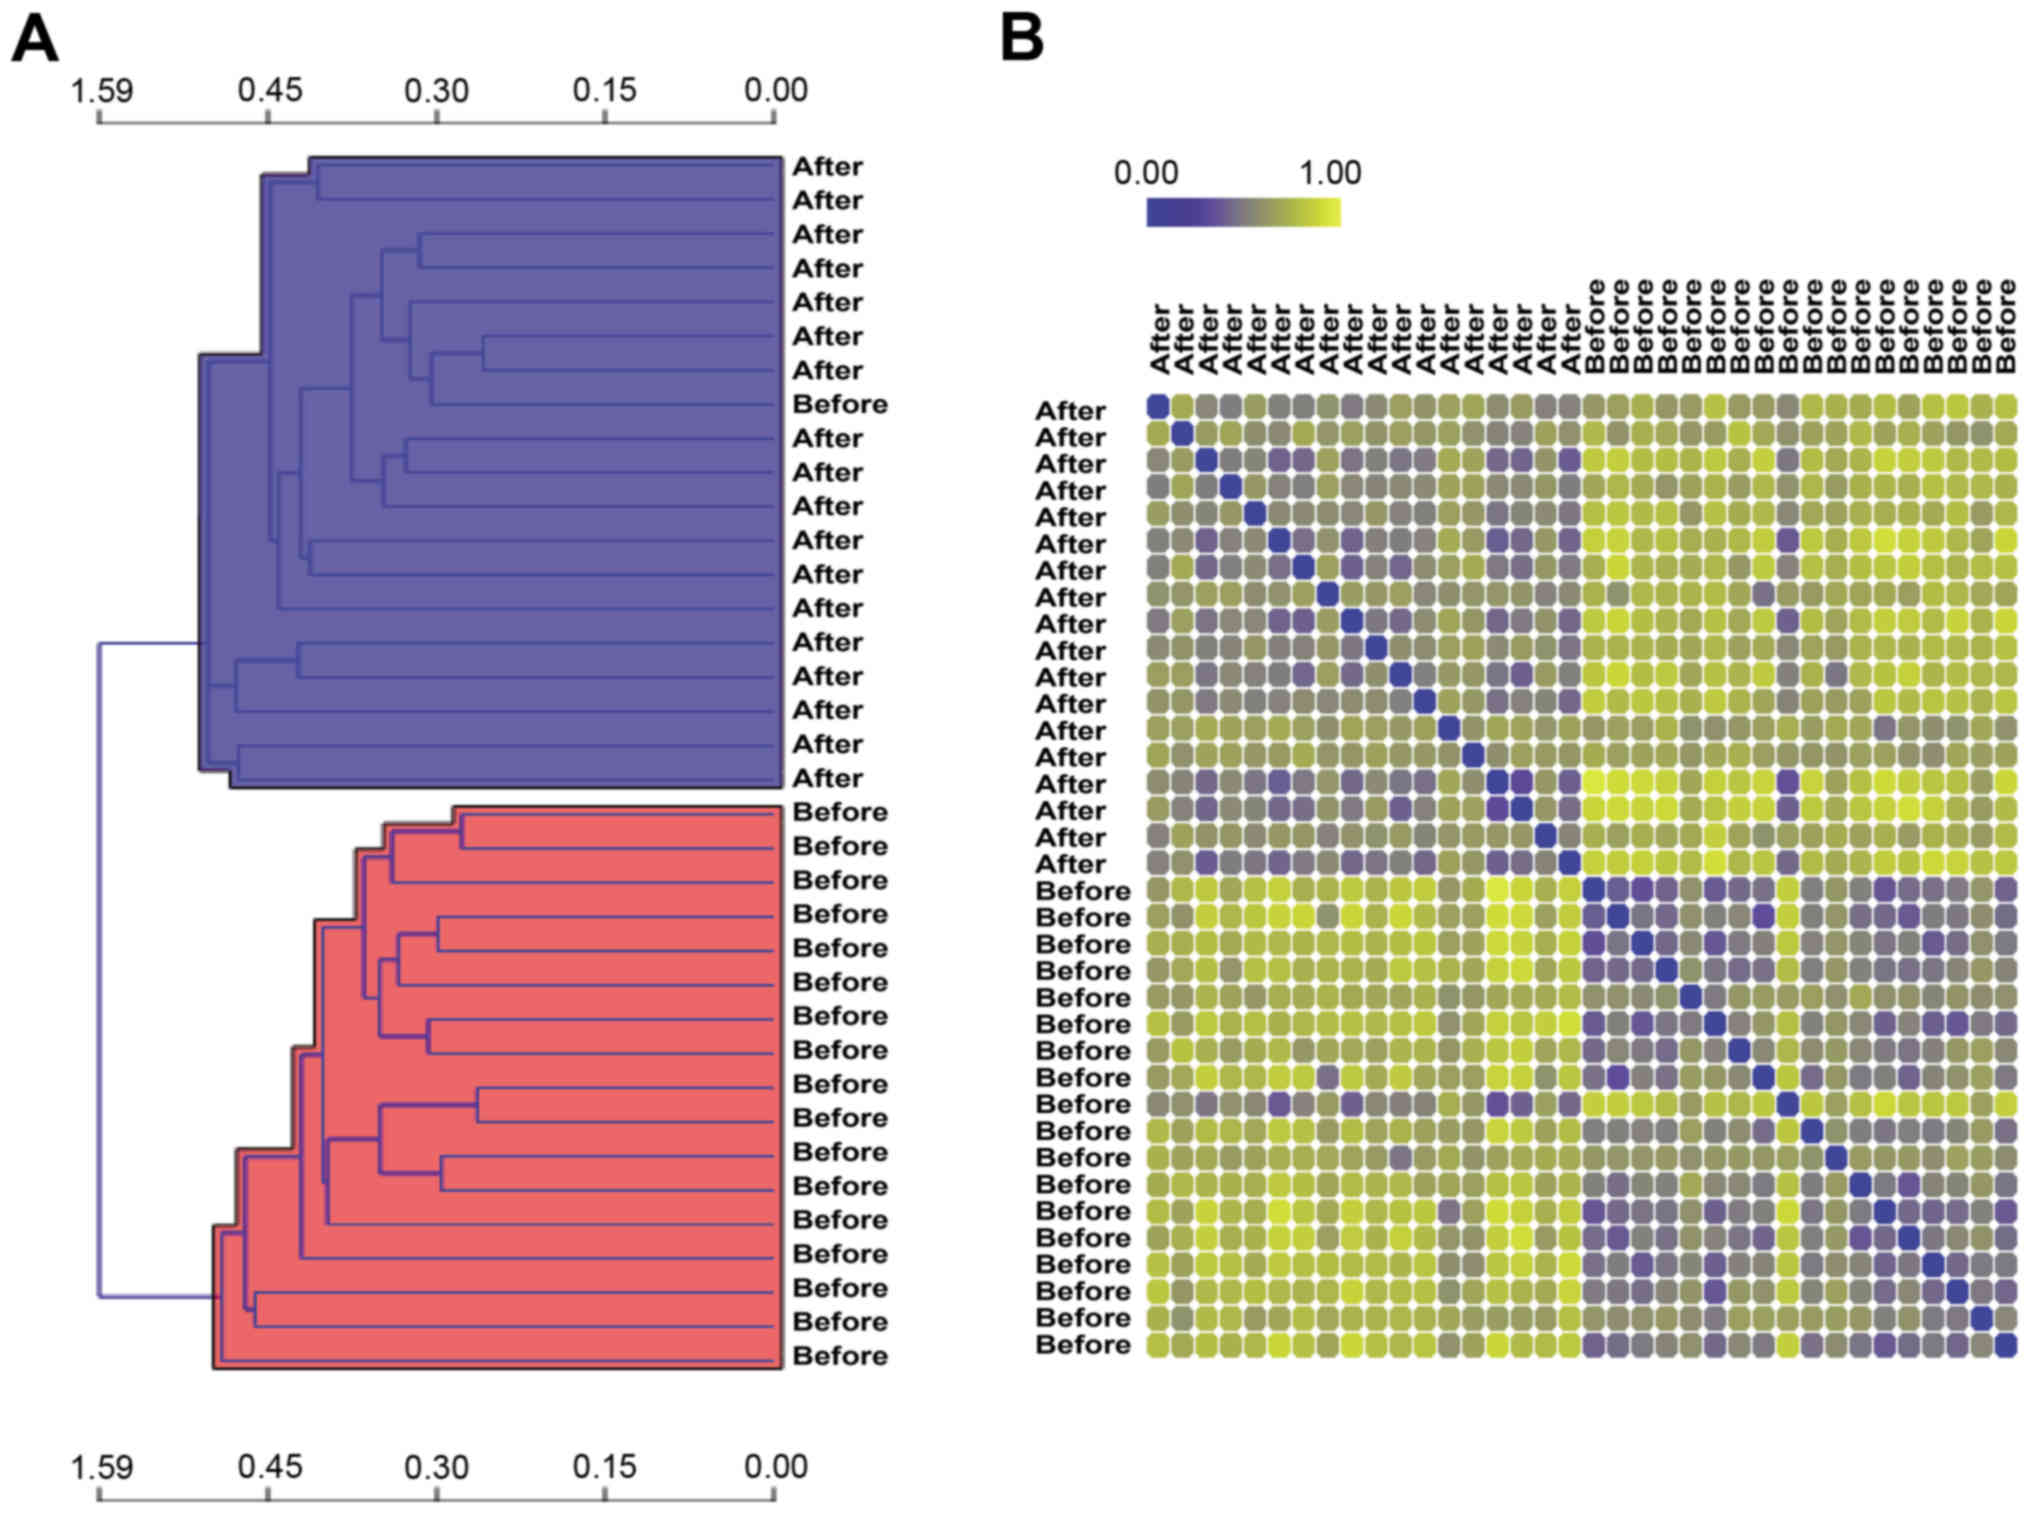
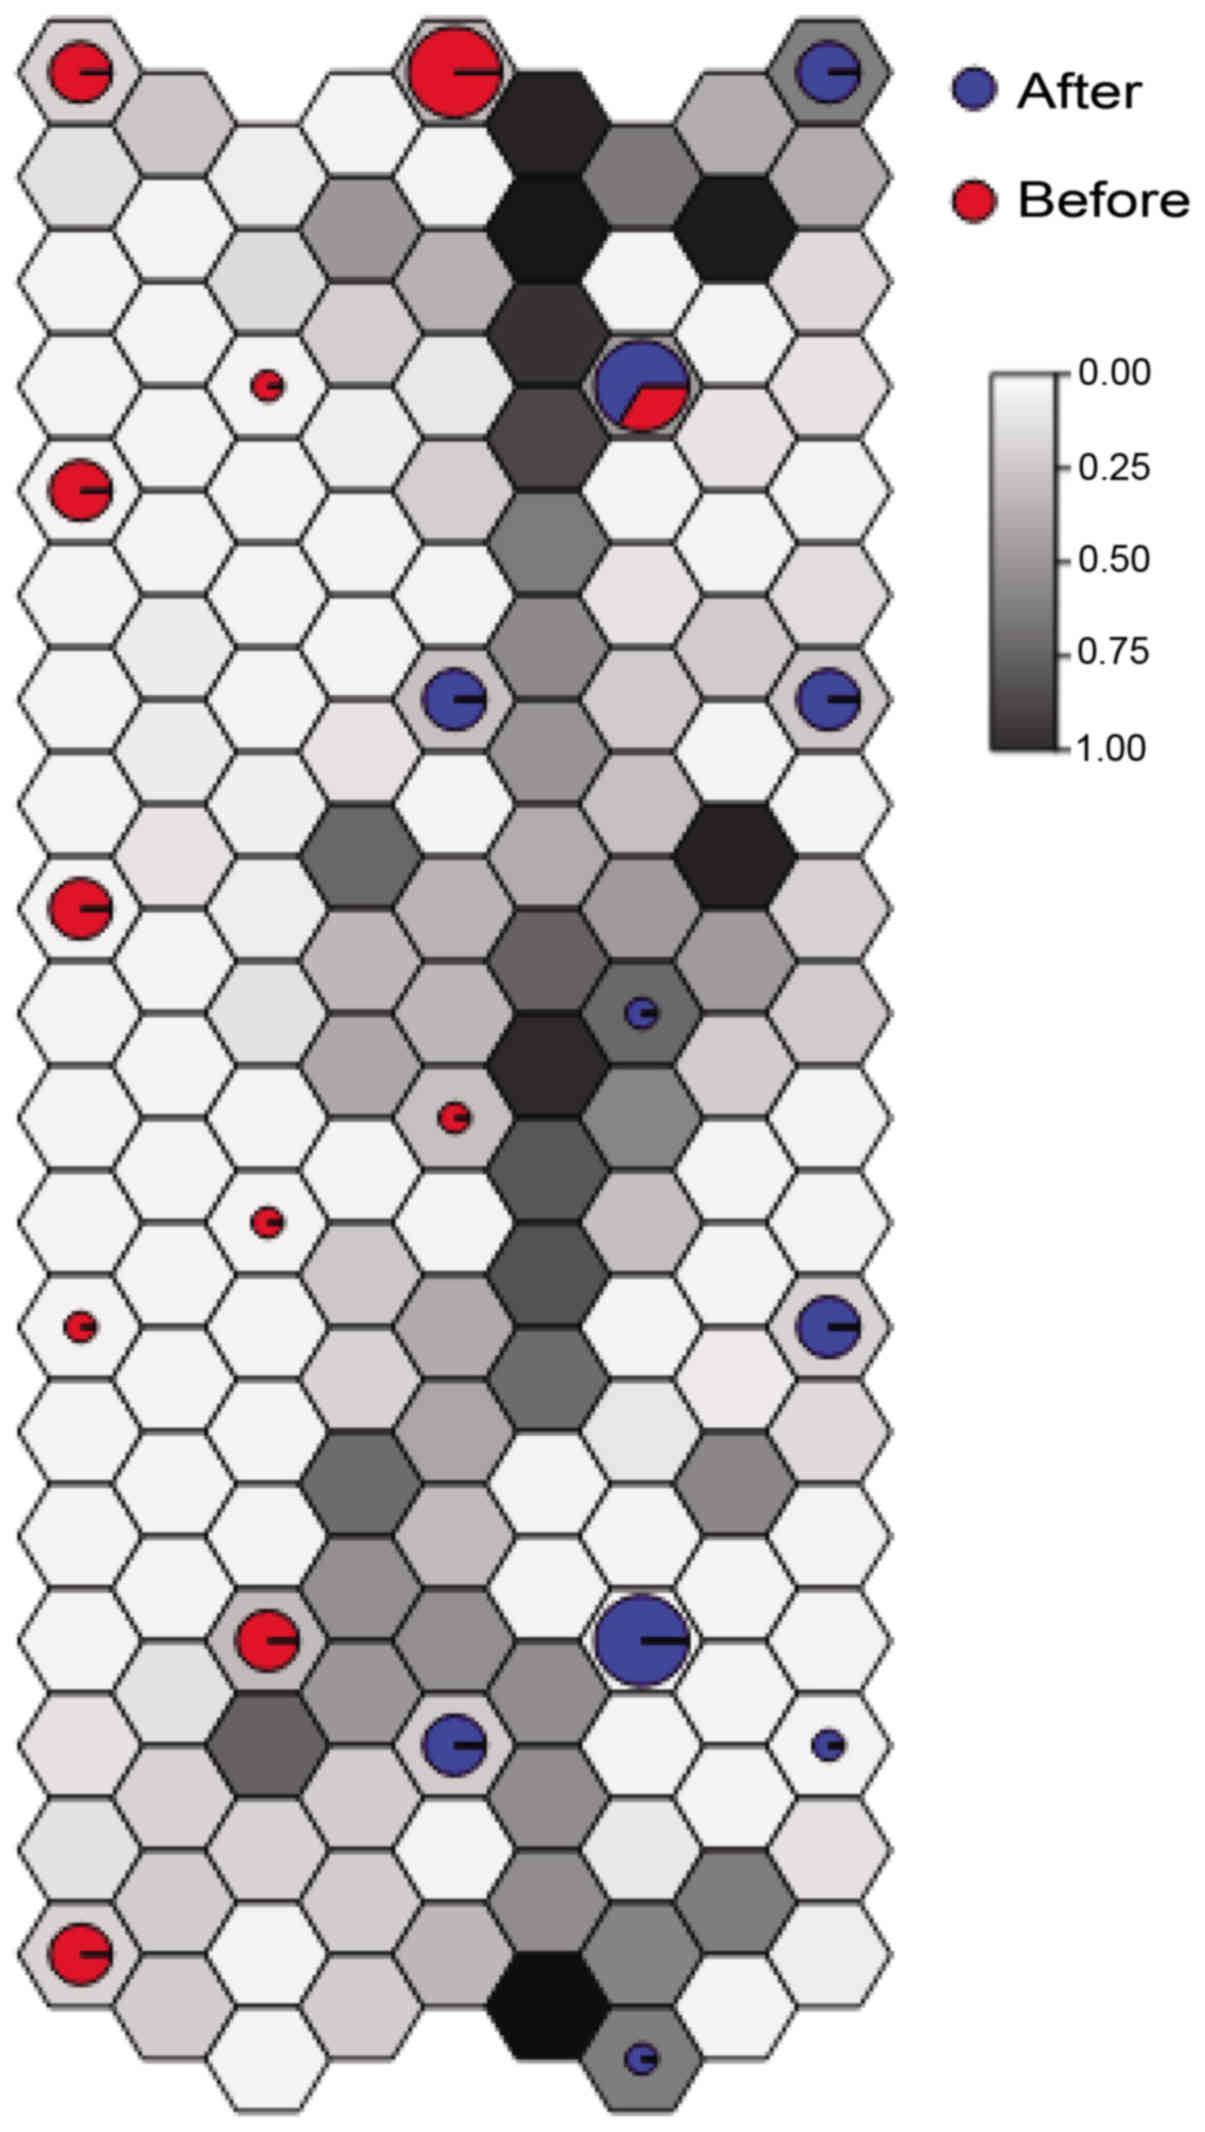
To confirm whether the DEGs were able to effectively distinguish between the two groups of samples, hierarchical clustering analysis was conducted using Orange software (version 3.4, http://orange.biolab.si/citation/) (15) and the result was visualized using a distance map (16). Pearson correlation coefficient (17) and average linkage (18) were performed separately for similarity algorithms and similarity matrices. Additionally, unsupervised clustering analysis was conducted for the samples using the self-organization map (SOM) method (19).

Functional and pathway enrichment analysis

The Gene Ontology (GO; http://www.geneontology.org) database provides information regarding cellular components (CCs), molecular function (MF), and biological processes (BPs) for gene produces (20). The Kyoto Encyclopedia of Genes and Genomes (KEGG; http://www.genome.ad.jp/kegg) is a database applied for conducting pathway analysis for genes or other molecules (21). Based on the Database for Annotation, Visualization and Integrated Discovery (DAVID; https://david.ncifcrf.gov/) tool (22), GO functional and KEGG pathway enrichment analyses were performed for the DEGs, with the threshold set at P<0.05.

PPI network analysis

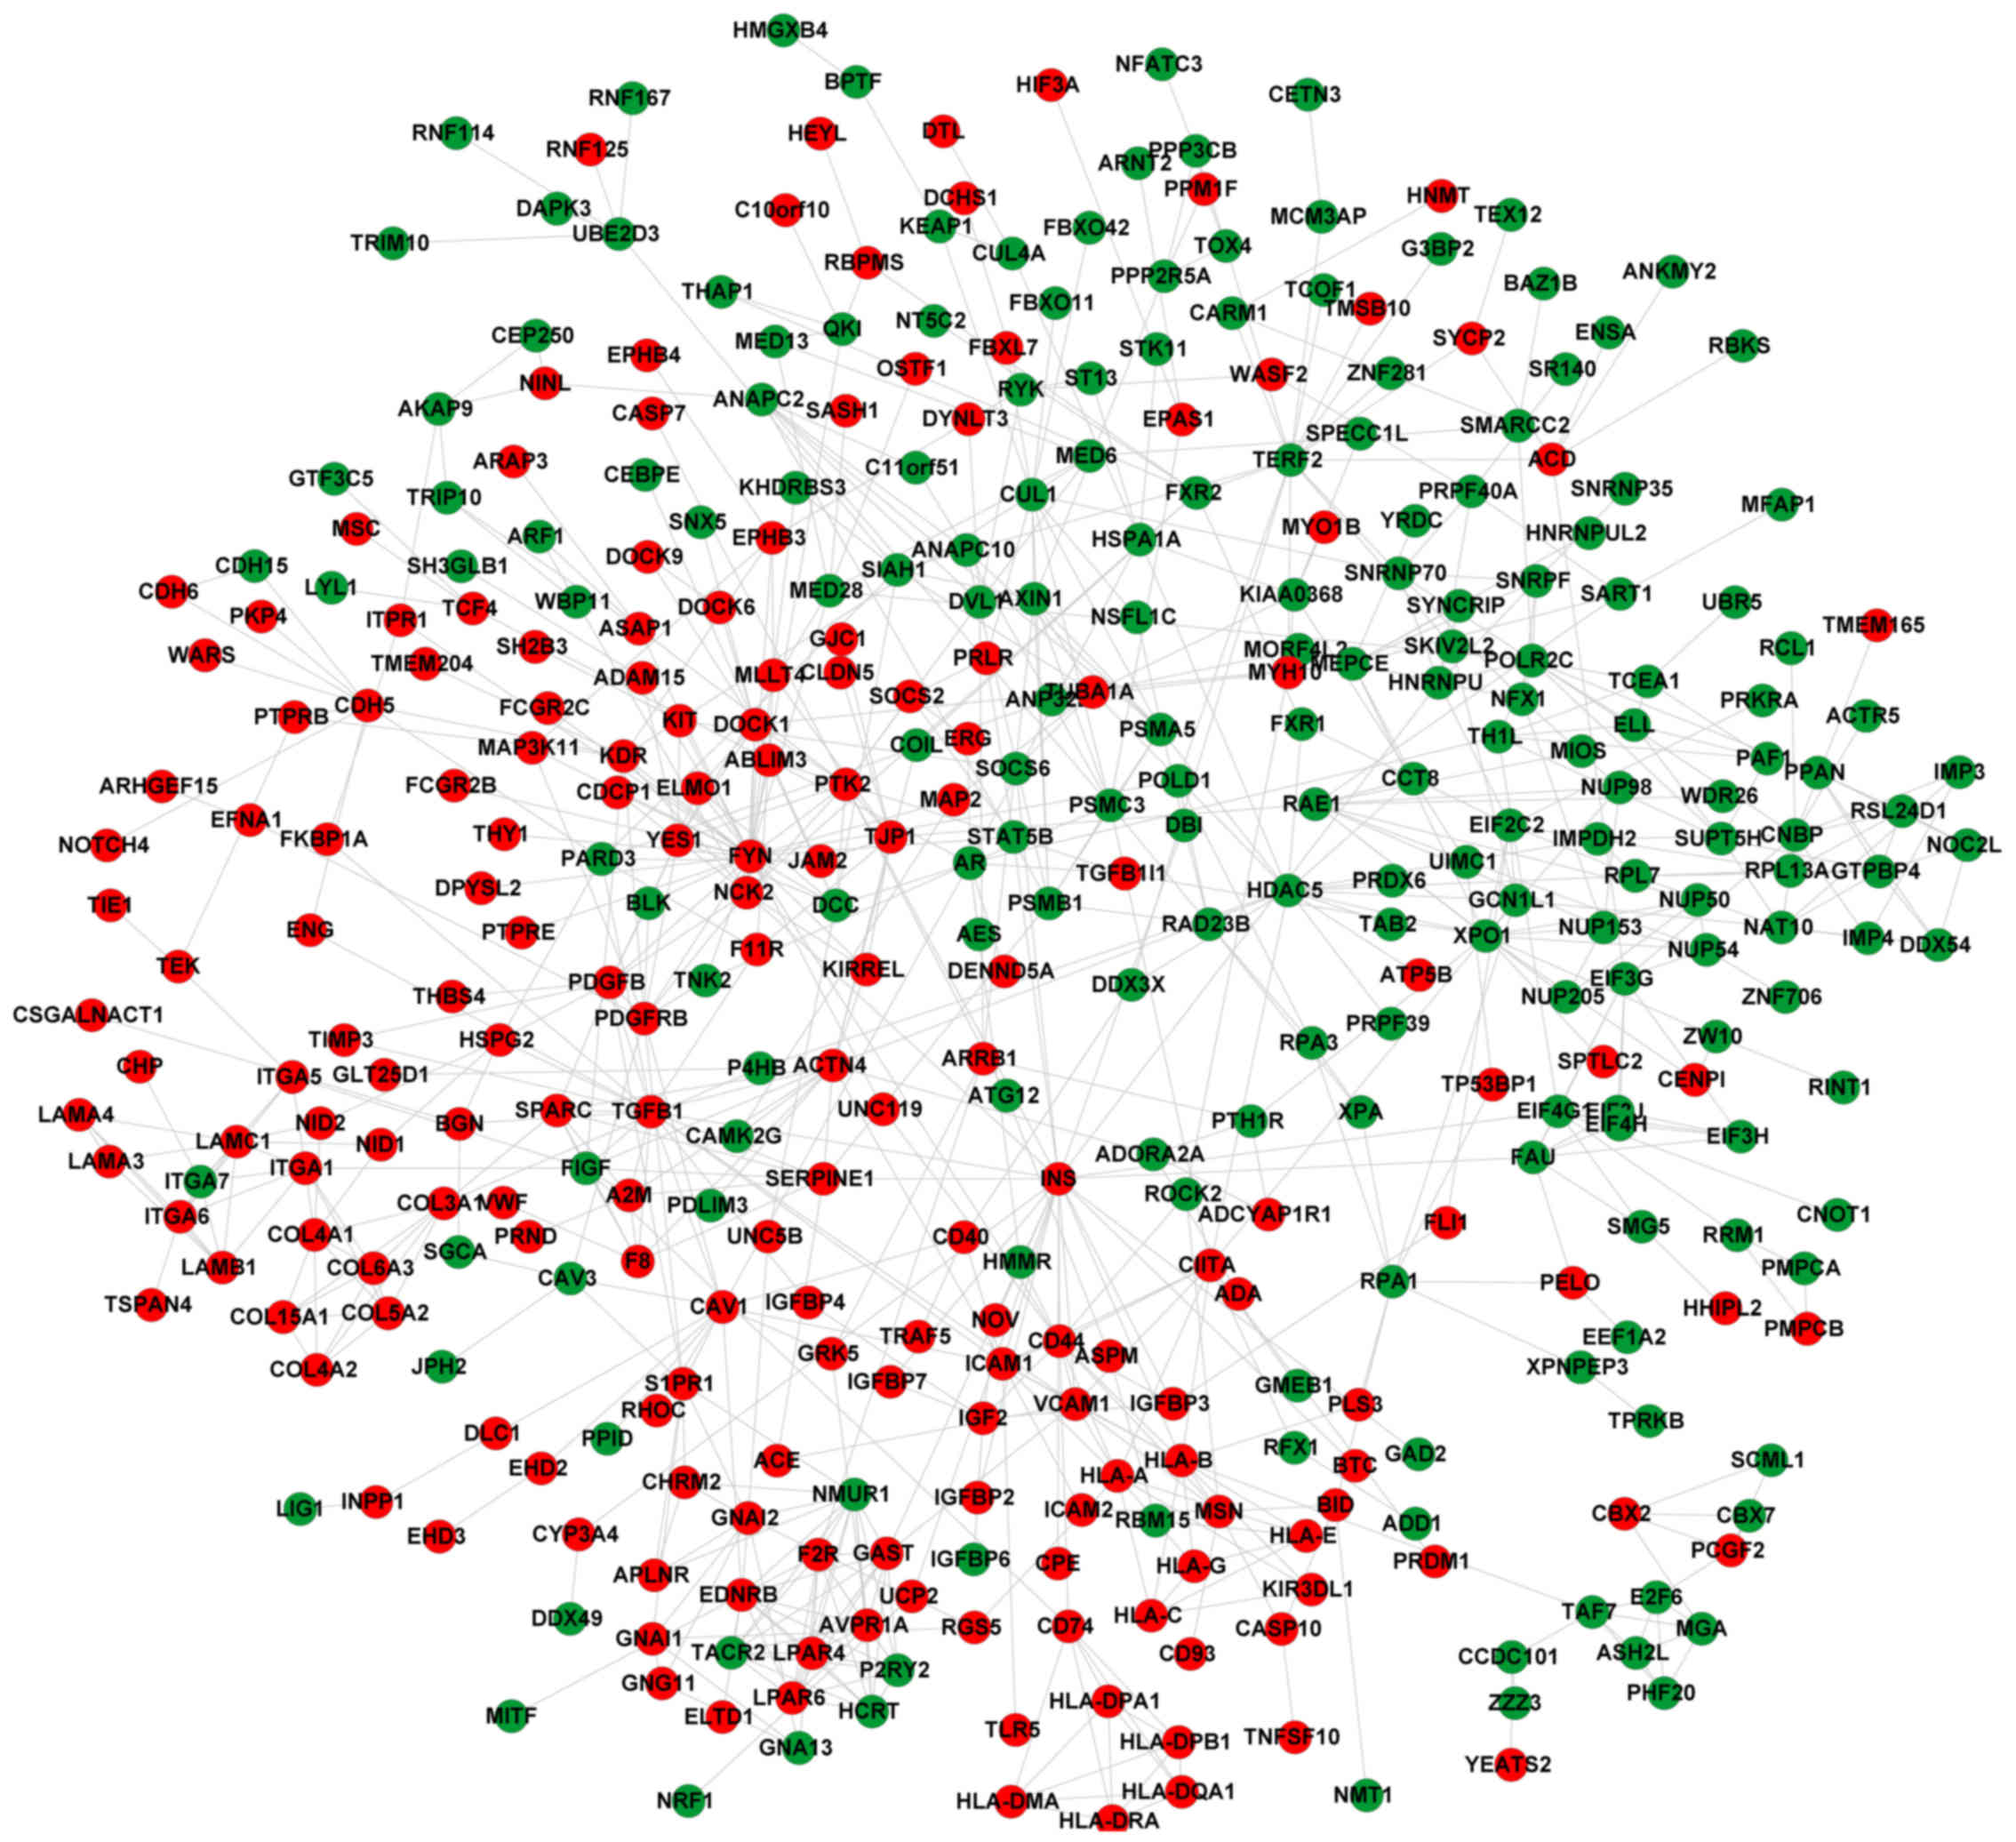
Biological General Repository for Interaction Datasets (BioGrid; http://www.thebiogrid.org) is an interaction database that includes genetic and protein interactions for humans and all major model organism species (23). Human Protein Reference Database (HPRD; http://www.hprd.org/) is a comprehensive protein information resource that provides various features of human proteins (24). The PPI network data in BioGrid (23) and HPRD (24) databases were downloaded and merged. Then, the DEGs were mapped into the human PPI network to identify the PPIs among the DEGs. Subsequently, the PPI network for the DEGs was visualized using Cytoscape software (version 3.5.0, http://www.cytoscape.org) (25). In addition, the network analysis plug-in in Cytoscape software (25) was used to analyze network topological features to screen the hub nodes (26) in the PPI network.

Calculation of function deviation score

To obtain the results with stability and accuracy, function deviation scores were calculated for the significantly enriched terms. The formula was follows:

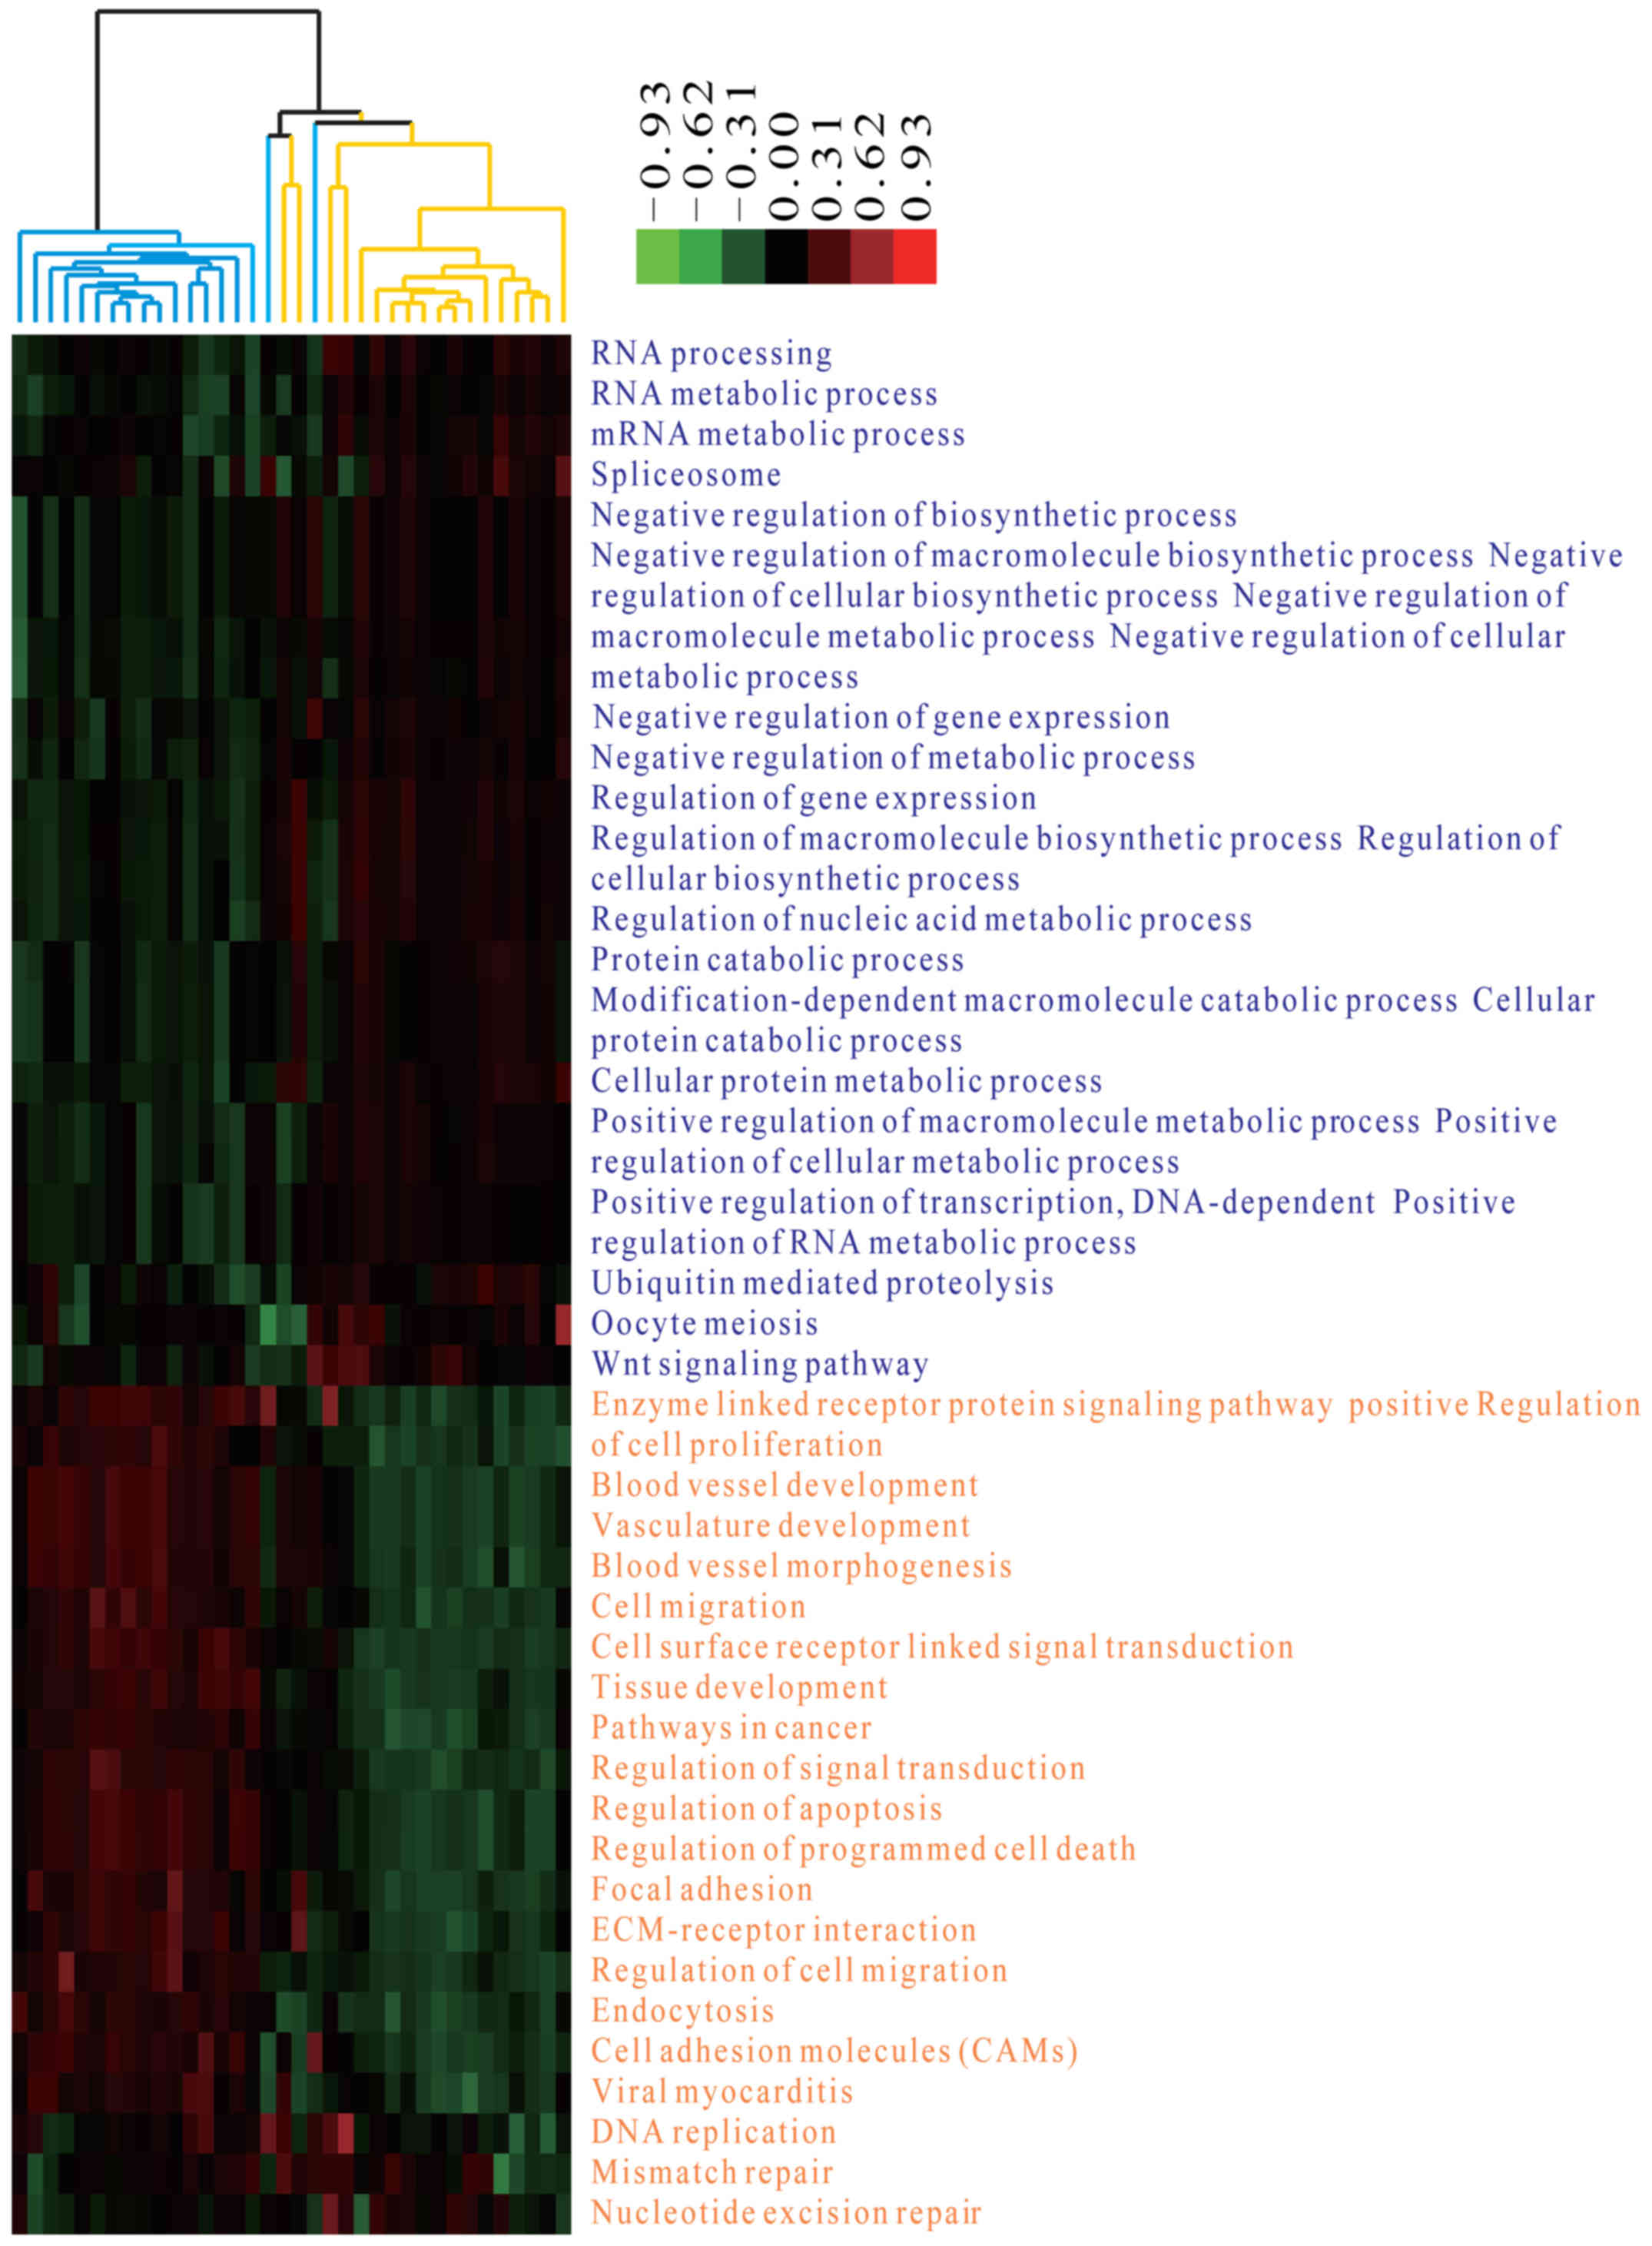
Where m and n separately represent the numbers of upregulated and downregulated genes enriched in term P.d¯ represents the mean value of the upregulated gene, i or downregulated gene, j in the control group. ω represents the node degree of a gene in the PPI network. The Euclidean distance is used to calculate the degree of deviation of the term P influenced by the upregulated and downregulated genes. Function score >0 indicates that the term P is upregulated in the case group compared with the control group. Function score <0 indicates that the term P is downregulated in the case group compared with the control group. Combined with the function deviation scores, hierarchical clustering analysis was performed using Cluster 3.0 software (27) to verify whether these significantly enriched terms clearly distinguished the case group from the control group.

Identification of significantly different terms

To identify the terms with significant differences in OS biopsy specimens before/after metastasis, logistic regression analysis was performed to calculate the significance of each term. The terms with P<0.05 were considered to be significantly different (also defined as metastasis-associated terms).

Validation of the metastasis-associated terms using other independent datasets

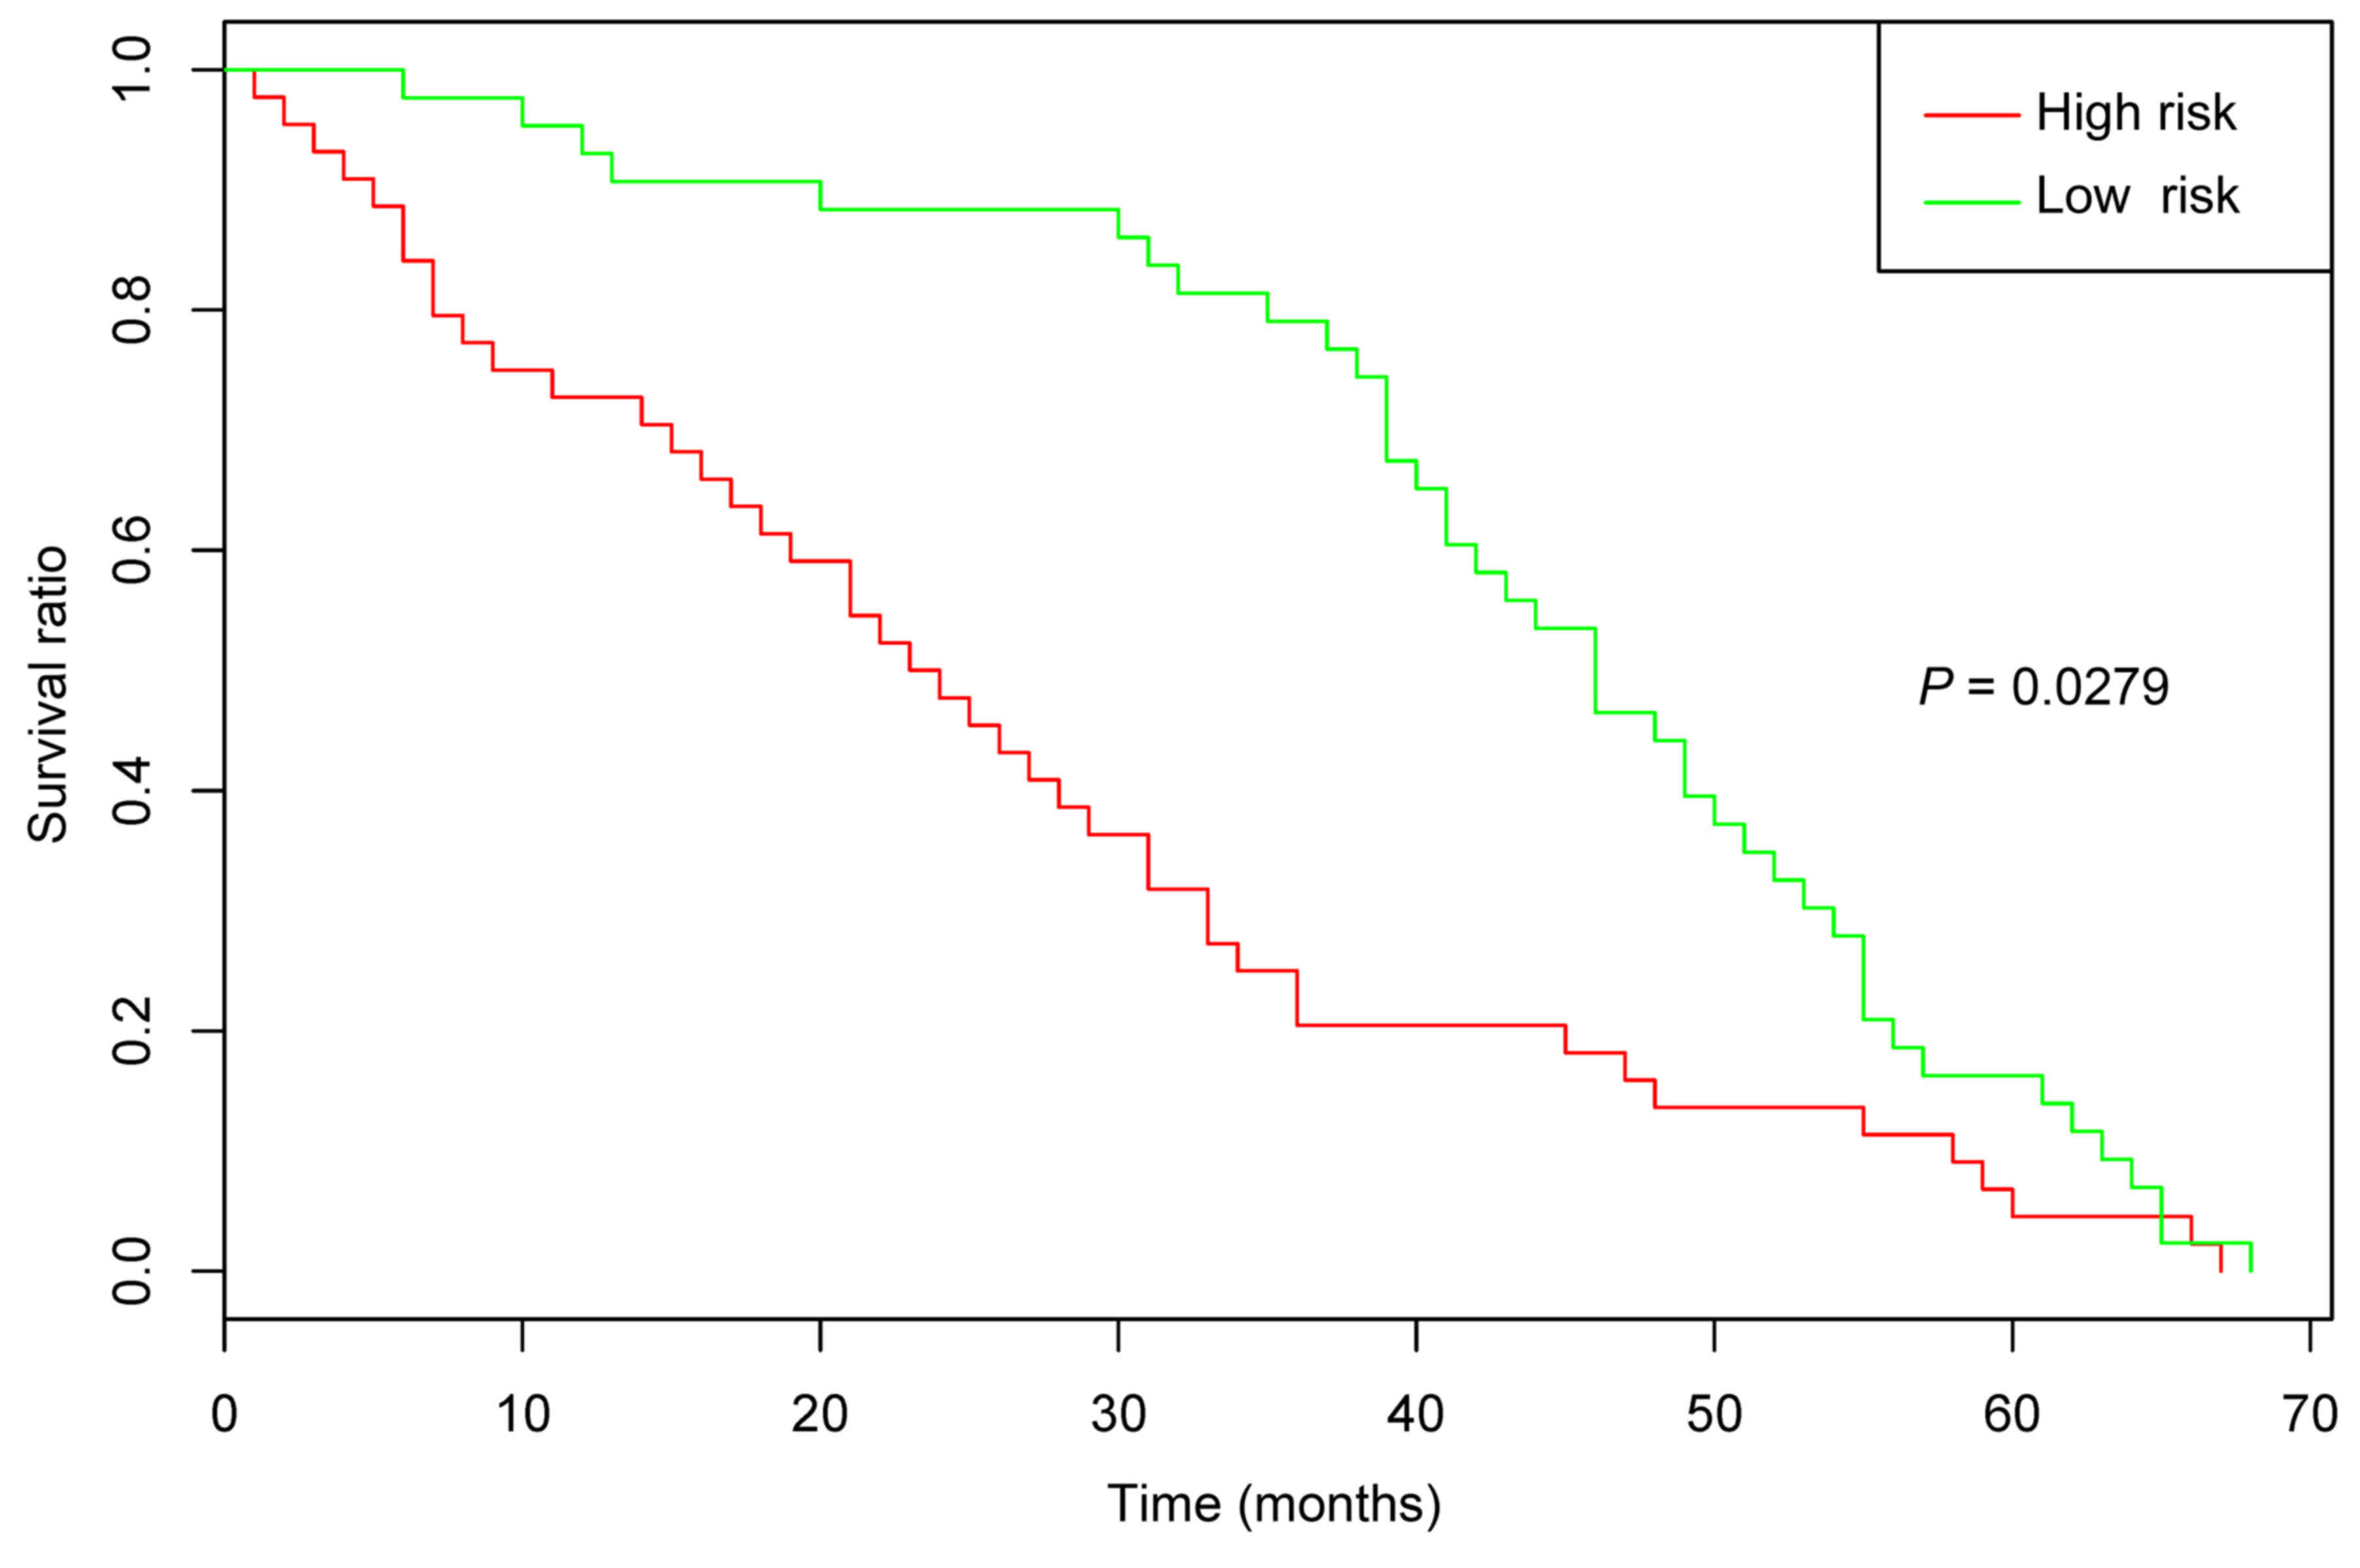
Two microarray datasets, GSE21257 (including 19 OS specimens without metastasis and 34 OS specimens with metastasis) and GSE32981 (including five OS specimens without metastasis and 18 OS specimens with metastasis) were downloaded from the European Molecular Biology Laboratory (http://www.ebi.ac.uk/embl/index.html) Nucleotide Sequence Database. Subsequently, the two datasets were merged and normalized. The OS specimens with/without metastasis were predicted, and the prediction accuracy was exhibited via receiver operating characteristic (ROC) curves. In addition, Kaplan-Meier (KM) survival analysis (28) was used to analyze the correlations between the survival times in GSE21257 and GSE16091 (downloaded from the GEO database) and the metastasis-associated terms.

The main risk factor for disease recurrence and metastasis is the sensitivity of patients to drug treatment, and metastasis/recurrence typically occurs when there is apparent drug resistance (29). Microarray data of GSE81892 (including 21 OS specimens with obvious resistance and 13 OS specimens with drug sensitivity) and GSE14827 (including 16 OS specimens with obvious resistance and 11 OS specimens with drug sensitivity) were downloaded from the GEO database. To confirm whether the metastasis-associated terms affect drug sensitivity and influence the risk of metastasis/recurrence, the terms were used to distinguish the OS specimens with obvious resistance and the OS specimens with drug sensitivity.

Results

DEG analysis

A total of 840 DEGs were identified in the case group compared with the control group, including 420 upregulated genes and 420 downregulated genes. After removing one abnormal sample, the remaining 36 samples were used for the subsequent analysis. Hierarchical clustering analysis demonstrated that 19 samples were included in the case group (accuracy, 95%) and 17 samples were included in the control group (accuracy, 100%) (Fig. 1A). To further evaluate the correlation and distance between the two groups of samples, the distances between the remaining 36 samples were visualized using a distance map (Fig. 1B). The distances between the intra-group samples tended to be closer, while the distances between the inter-group samples were relatively far apart. Meanwhile, unsupervised clustering analysis based on the SOM method demonstrated that the classification effect for the samples in the majority of neurons was good (Fig. 2).

Functional and pathway enrichment analysis

The upregulated and downregulated genes separately underwent enrichment analysis. The GO terms that were enriched for the upregulated genes predominantly included regulation of cell migration (P=2.83E-12), blood vessel development (P=2.74E-10) and vasculature development (P=4.67E-10) (Table I). The upregulated genes were enriched in the KEGG pathways of viral myocarditis (P=7.85E-08), focal adhesion (P=3.70E-06) and endocytosis (P=1.44E-03) (Table II). In addition, the downregulated genes were predominantly enriched in the GO terms of RNA metabolic processes (P=1.11E-06), RNA processing (P=2.11E-06) and regulation of gene expression (P=5.20E-04) (Table III). Furthermore, the KEGG pathways enriched for the downregulated genes were cell adhesion molecules (P=2.32E-09), extracellular matrix-receptor interaction (P=1.49E-08), and pathways in cancer (P=3.04E-02) (Table IV).

Table I

The Gene Ontology (GO) terms significantly enriched for the upregulated genes.

Table I

The Gene Ontology (GO) terms significantly enriched for the upregulated genes.

TermCountP-valueGene symbol
GO:0030334 - regulation of cell migration252.83E-12DLC1, PDGFB, ENPP2, KIT, ADA, TGFB1, ACE, S1PR1, INS, TEK, ROBO4, TIE1, LAMB1, ICAM1, PTPRM, IGF2, VASH1, THY1, KDR, LAMA4, LAMA3, CLIC4, PDGFRB, ARAP3, IGFBP3, F2R
GO:0001568 - blood vessel development272.74E-10EMCN, CAV1, ATP5B, COL3A1, WASF2, ELK3, CDH5, GJC1, PTK2, ACE, S1PR1, CD44, ROBO4, LOX, PLXND1, EPAS1, MYO1E, MMP19, COL15A1, UBP1, THY1, KDR, LAMA4, BGN, PLXDC1, NOTCH4, ENG
GO:0001944 - vasculature development274.67E-10EMCN, CAV1, ATP5B, COL3A1, WASF2, ELK3, CDH5, GJC1, PTK2, ACE, S1PR1, CD44, ROBO4, LOX, PLXND1, EPAS1, MYO1E, MMP19, COL15A1, UBP1, THY1, KDR, LAMA4, BGN, PLXDC1, NOTCH4, ENG
GO:0048514 - blood vessel morphogenesis224.70E-08CAV1, EMCN, EPAS1, ATP5B, MYO1E, MMP19, WASF2, COL15A1, ELK3, UBP1, GJC1, THY1, KDR, PTK2, ACE, S1PR1, BGN, PLXDC1, NOTCH4, ROBO4, PLXND1, ENG
GO:0016477 - cell migration242.82E-07ICAM1, PDGFB, ATP5B, PODXL, WASF2, ITGA1, KIT, TGFB1, KDR, VCAM1, NCK2, EDNRB, PTK2, ITGA6, CD44, CD34, ITGA5, FYN, PDGFRB, MSN, LAMC1, ENG, MYH10, THBS4
GO:0007167 - enzyme linked receptor protein signaling pathway241.11E-05PDGFB, EFNA1, ADCYAP1R1, COL3A1, FKBP1A, KIT, EPHB3, EPHB4, TGFB1, PTK2, INS, TEK, TIE1, PTPRE, SOCS2, MYO1E, IGF2, KDR, LEFTY1, NCK2, PRLR, PDGFRB, TGFB1I1, ENG, GFRA2
GO:0009966 - regulation of signal transduction424.27E-05DLC1, FGD2, CAV1, PDGFB, TBC1D9, EFNA1, AGFG2, PREX2, ASAP2, ASAP1, ITPKB, FKBP1A, KIT, CD74, MCF2L, TGFB1, ADA, S1PR1, NOD1, INS, RAPGEF5, RHOC, TRAF5, RAMP2, SOCS2, PSD3, ITGA1, IGF2, ARHGEF15, CD40, THY1, NCK2, TNFSF10, ARRB1, RGS5, TGFB1I1, GRK5, IGFBP2, ARAP3, ENG, IGFBP3, MAP3K11, F2R
GO:0009888 - tissue development318.58E-04DLC1, CAV1, COL3A1, FKBP1A, TIMP3, TGFB1, GJC1, EDNRB, S1PR1, CD44, SERPINE1, TIE1, F11R, BMP1, HSPG2, MECOM, SNAI2, COL5A2, FZD6, KDR, NOTCH3, LAMA3, SPRR1B, NOTCH4, PDGFRB, LAMC1, TGFB1I1, ENG, FABP5, F2R, MYH10
GO:0008284 - positive regulation of cell proliferation221.26E-03GNAI2, PDGFB, BTC, CDK6, IGF2, KIT, CD40, PNP, ADA, TGFB1, KDR, VCAM1, NCK2, S1PR1, INS, NOTCH4, AVPR1A, PDGFRB, LAMC1, LAMB1, TRAF5, THPO, F2R
GO:0043067 - regulation of programmed cell death342.71E-03DLC1, FGD2, BID, CADM1, BTC, KIT, TIMP3, ADA, TGFB1, MCF2L, CD74, EDNRB, PEA15, PCGF2, NOD1, CASP4, CD44, INS, TRAF5, PHLDA1, HIP1, GIMAP5, ACTN4, SOCS2, ITGA1, IGF2, NLRP1, CASP10, TNFSF10, PRLR, ETS1, IGFBP3, FAIM2, F2R, MAP3K11
GO:0007166 - cell surface receptor linked signal transduction643.44E-03PDGFB, EFNA1, PREX2, WASF2, LPAR4, ITPKB, TGFB1, LPHN2, EDNRB, S1PR1, ELTD1, TIE1, RAMP2, GPR176, SOCS2, CD40, OR10J1, THY1, LEFTY1, NCK2, CPE, CHRM2, LPAR6, GPR56, PDGFRB, TGFB1I1, GNAI2, GNAI1, ENPP2, ADCYAP1R1, COL3A1, GNG11, FKBP1A, GAST, KIT, EPHB3, EPHB4, APLNR, PTK2, DOCK1, INS, TEK, PTPRE, MYO1E, ITGA1, IGF2, OR51E2, CENPI, KDR, FZD6, NOTCH3, SEMA6A, LAMA3, PRLR, ITGA6, FYN, ITGA5, HEYL, NOTCH4, AVPR1A, GRK5, ENG, GFRA2, GPR116, F2R
GO:0042981 - regulation of apoptosis334.22E-03DLC1, FGD2, BID, CADM1, BTC, TIMP3, ADA, TGFB1, MCF2L, CD74, EDNRB, PEA15, PCGF2, NOD1, CASP4, CD44, INS, TRAF5, PHLDA1, HIP1, GIMAP5, ACTN4, SOCS2, ITGA1, IGF2, NLRP1, CASP10, TNFSF10, PRLR, ETS1, IGFBP3, FAIM2, F2R, MAP3K11
hsa04514: Cell adhesion molecules (CAMs)222.32E-09F11R, ICAM1, PTPRM, CADM1, ICAM2, CLDN5, HLA-A, HLA-C, CD40, HLA-B, HLA-E, HLA-DMA, HLA-DQA1, HLA-G, CDH5, VCAM1, ITGA6, CD34, PECAM1, HLA-DPA1, HLA-DPB1, JAM2, HLA-DRA
hsa04512: ECM-receptor interaction171.49E-08COL4A2, COL4A1, COL3A1, ITGA1, HSPG2, COL5A2, VWF, LAMA4, LAMA3, CD44, ITGA6, ITGA5, COL6A3, SV2B, LAMC1, LAMB1, THBS4
hsa05200: Pathways in cancer193.04E-02BID, COL4A2, COL4A1, PDGFB, EPAS1, CDK6, KIT, MECOM, TGFB1, FZD6, PTK2, LAMA4, LAMA3, ITGA6, ETS1, PDGFRB, LAMC1, LAMB1, TRAF5

Table II

The KEGG pathways significant enriched for the upregulated genes.

Table II

The KEGG pathways significant enriched for the upregulated genes.

TermCountP-valueGene symbol
hsa04514: Cell adhesion molecules (CAMs)222.32E-09F11R, ICAM1, PTPRM, CADM1, ICAM2, CLDN5, HLA-A, HLA-C, CD40, HLA-B, HLA-E, HLA-DMA, HLA-DQA1, HLA-G, CDH5, VCAM1, ITGA6, CD34, PECAM1, HLA-DPA1, HLA-DPB1, JAM2, HLA-DRA
hsa04512: ECM-receptor interaction171.49E-08COL4A2, COL4A1, COL3A1, ITGA1, HSPG2, COL5A2, VWF, LAMA4, LAMA3, CD44, ITGA6, ITGA5, COL6A3, SV2B, LAMC1, LAMB1, THBS4
hsa05200: Pathways in cancer193.04E-02BID, COL4A2, COL4A1, PDGFB, EPAS1, CDK6, KIT, MECOM, TGFB1, FZD6, PTK2, LAMA4, LAMA3, ITGA6, ETS1, PDGFRB, LAMC1, LAMB1, TRAF5

Table III

The Gene Ontology (GO) terms significant enriched for the downregulated genes.

Table III

The Gene Ontology (GO) terms significant enriched for the downregulated genes.

TermCountP-valueGene symbol
GO:0016070 - RNA metabolic process491.11E-06EIF2C2, TCOF1, SYNCRIP, SKIV2L2, WTAP, SART1, SMNDC1, INTS8, IMP3, RRP1B, ASH2L, TRMT5, QKI, SUPT5H, IMP4, NFX1, KHDRBS3, AR, ZCCHC11, PRPF39, MED13, HNRNPU, C4ORF23, EIF4G1, HNRPDL, CELF1, SNRPF, MYNN, CPSF3L, ELL, SR140, WBP11, HSPA1A, POLR2C, PPAN, RPL7, PRKRA, C19ORF29, GTF3C5, TCEA1, SNRNP70, SNRNP35, NFATC3, PRPF40A, SMG5, TAF7, PPP1R8, POP1, DDX54
GO:0006396 - RNA processing342.11E-06CPSF3L, EIF2C2, SR140, SYNCRIP, SKIV2L2, WBP11, WTAP, POLR2C, SART1, SMNDC1, INTS8, PPAN, IMP3, RRP1B, RPL7, TRMT5, PRKRA, C19ORF29, QKI, SNRNP70, SNRNP35, IMP4, PRPF40A, KHDRBS3, ZCCHC11, PRPF39, HNRNPU, C4ORF23, HNRPDL, PPP1R8, POP1, CELF1, DDX54, SNRPF
GO:0010468 - regulation of gene expression975.20E-04EIF2C2, ARNT2, STAT5B, MORF4L2, NAA15, SYNCRIP, CNOT1, CBX7, ZNF304, CRY2, DIRAS3, MED28, SUPT5H, EIF2B4, MYST3, GTPBP4, MED13, HNRNPU, BAZ1B, ZNF238, ZNF239, MNX1, MGA, ZZZ3, CELF1, PAF1, MYNN, SIVA1, CNBP, ELL, ADORA2A, HOXA11, TH1L, CYTL1, KEAP1, NR1H2, LYL1, EIF3H, PRKRA, LHX5, DNMT3A, TAF7, ZBTB44, UIMC1, SAFB2, HDAC5, NRF1, EIF4H, ATF7, SMARCC2, RFX1, DDX54, SOX21, E2F6, MITF, CTCF, PHF20, ZKSCAN5, CRX, AES, ASH2L, ACTR5, CCDC101, ZNF146, QKI, NFX1, ZNF281, AR, KHDRBS3, ZCCHC11, GMEB1, ZNF143, HNRPDL, EIF4G1, MED6, BPTF, CARM1, MTDH, ZBTB11, SCML1, GCN1L1, MORC3, HMGXB4, PPP3CB, TCEA1, THAP1, KDM3B, SNRNP70, NFATC3, TERF2, NACC2, CEBPE, SIRT4, ZNF669, PKNOX1, PPP1R8, RBM15
GO:0016071 - mRNA metabolic process219.32E-04EIF2C2, KHDRBS3, SMG5, SYNCRIP, PRPF39, WBP11, SKIV2L2, HSPA1A, WTAP, POLR2C, HNRNPU, SART1, SMNDC1, PPP1R8, C19ORF29, QKI, CELF1, SNRNP35, SNRNP70, SNRPF, PRPF40A
GO:0010605 - negative regulation of macromolecule metabolic process331.34E-03HCRT, EIF2C2, MTDH, E2F6, TH1L, CTCF, ANAPC10, NR1H2, AES, PSMB1, PRKRA, SUPT5H, TERF2, EIF2B4, MYST3, NFX1, ZNF281, DNMT3A, ANAPC2, GTPBP4, NACC2, ZCCHC11, TAF7, SIRT4, UIMC1, HDAC5, ZNF238, BPTF, PSMA5, PSMC3, SMARCC2, CELF1, RBM15
GO:0030163 - protein catabolic process291.68E-03RAD23B, KIAA0368, ATG12, UBE3B, UBE2V2, ANAPC10, UBE2D3, LONP1, USP27X, PSMB1, OTUD7B, RNF167, FBXO42, FBXO9, TPRKB, CUL1, NFX1, AXIN1, ANAPC2, SOCS6, SOCS5, KCMF1, CUL4A, PSMC3, PSMA5, UBR5, SIAH1, PCYOX1, FBXO11
GO:0043632 - modification-dependent macromolecule catabolic process272.20E-03RAD23B, ATG12, UBE3B, KIAA0368, UBE2V2, ANAPC10, LONP1, USP27X, UBE2D3, PSMB1, OTUD7B, RNF167, FBXO42, FBXO9, CUL1, NFX1, ANAPC2, SOCS6, SOCS5, KCMF1, CUL4A, PSMC3, PSMA5, UBR5, SIAH1, PCYOX1, FBXO11
GO:0010629 - negative regulation of gene expression243.64E-03ZNF281, DNMT3A, EIF2C2, NACC2, ZCCHC11, MTDH, E2F6, TH1L, TAF7, SIRT4, CTCF, UIMC1, NR1H2, HDAC5, AES, ZNF238, BPTF, PRKRA, SMARCC2, CELF1, SUPT5H, RBM15, MYST3, NFX1
GO:0019219 - regulation of nucleic acid metabolic process914.03E-03EIF2C2, SOX21, E2F6, MORF4L2, MITF, STAT5B, ARNT2, NAA15, SYNCRIP, CNOT1, CTCF, PHF20, CBX7, ZKSCAN5, CRX, ZNF304, CRY2, AES, ASH2L, MED28, ACTR5, CCDC101, ZNF146, SUPT5H, MYST3, NFX1, ZNF281, AR, KHDRBS3, GTPBP4, GMEB1, ZNF143, MED13, HNRNPU, MED6, HNRPDL, ZNF238, BPTF, BAZ1B, ZNF239, MNX1, MGA, ZZZ3, PAF1, CARM1, MYNN, SIVA1, HCRT, CNBP, MTDH, ADORA2A, ELL, ZBTB11, HOXA11, SCML1, PTH1R, TH1L, CYTL1, UBE2V2, KEAP1, NR1H2, LYL1, HMGXB4, LHX5, THAP1, TCEA1, KDM3B, SNRNP70, NFATC3, TERF2, GUCA1B, DNMT3A, GUCA1A, NACC2, CEBPE, TAF7, SIRT4, ZNF669, ZBTB44, UIMC1, SAFB2, HDAC5, NRF1, P2RY11, PKNOX1, PPP1R8, ATF7, SMARCC2, RFX1, DDX54, RBM15
GO:0044257 - cellular protein catabolic process274.27E-03RAD23B, ATG12, UBE3B, KIAA0368, UBE2V2, ANAPC10, LONP1, USP27X, UBE2D3, PSMB1, OTUD7B, RNF167, FBXO42, FBXO9, CUL1, NFX1, ANAPC2, SOCS6, SOCS5, KCMF1, CUL4A, PSMC3, PSMA5, UBR5, SIAH1, PCYOX1, FBXO11
GO:0010558 - negative regulation of macromolecule biosynthetic process254.95E-03HCRT, EIF2C2, MTDH, E2F6, TH1L, CTCF, NR1H2, AES, SUPT5H, EIF2B4, TERF2, NFX1, MYST3, ZNF281, DNMT3A, GTPBP4, NACC2, TAF7, SIRT4, UIMC1, HDAC5, ZNF238, BPTF, SMARCC2, RBM15
GO:0031325 - positive regulation of cellular metabolic process356.60E-03CNBP, ADORA2A, MORF4L2, ARNT2, MITF, STAT5B, NAA15, CYTL1, CTCF, ANAPC10, CRX, NR1H2, PSMB1, TCEA1, CD24, SUPT5H, NFATC3, TERF2, CUL1, MYST3, AXIN1, ANAPC2, AR, TAF7, MED13, UIMC1, MED6, HDAC5, PKNOX1, BPTF, PSMA5, PSMC3, SMARCC2, TNK2, RBM15
GO:0031327 - negative regulation of cellular biosynthetic process256.64E-03HCRT, EIF2C2, MTDH, E2F6, TH1L, CTCF, NR1H2, AES, SUPT5H, EIF2B4, TERF2, NFX1, MYST3, ZNF281, DNMT3A, GTPBP4, NACC2, TAF7, SIRT4, UIMC1, HDAC5, ZNF238, BPTF, SMARCC2, RBM15
GO:0031324 - negative regulation of cellular metabolic process306.85E-03HCRT, EIF2C2, MTDH, E2F6, TH1L, CTCF, ANAPC10, NR1H2, AES, PSMB1, SUPT5H, EIF2B4, TERF2, MYST3, NFX1, ZNF281, DNMT3A, ANAPC2, GTPBP4, NACC2, TAF7, SIRT4, UIMC1, HDAC5, ZNF238, BPTF, PSMC3, PSMA5, SMARCC2, RBM15
GO:0044267 - cellular protein metabolic process777.19E-03EIF2C2, KIAA0368, NAA15, ART3, USP27X, LONP1, CRY2, FAU, SIK2, EIF2B4, CUL1, MYST3, NFX1, ANAPC2, SGK2, ROCK2, SECISBP2, SOCS6, SOCS5, DAPK3, ST13, EIF4G1, BAZ1B, PSMA5, UBR5, SIAH1, PAF1, PCYOX1, CARM1, TM4SF4, FBXO11, RAD23B, UBE3B, ATG12, STK11, BLK, CAMK2G, MAPKAPK5, ANAPC10, UBE2V2, AKAP9, MTMR3, UBE2D3, EIF3G, RPL7, PSMB1, MORC3, EIF3H, SH3GLB1, PRKRA, OTUD7B, PPP3CB, RNF167, FBXO42, RSL24D1, EIF3J, FBXO9, OBSCN, P4HB, ALPK3, RYK, EEF1A2, SIRT4, OXSR1, LOC653566, UIMC1, HDAC5, NMT1, CUL4A, KCMF1, RPL13A, PSMC3, PPID, EIF4H, CCT8, LGTN, TNK2
GO:0031326 - regulation of cellular biosynthetic process937.26E-03EIF2C2, SOX21, E2F6, MORF4L2, STAT5B, ARNT2, MITF, NAA15, CNOT1, CTCF, PHF20, CBX7, ZKSCAN5, CRX, ZNF304, CRY2, AES, ASH2L, MED28, ACTR5, CCDC101, ZNF146, QKI, SUPT5H, EIF2B4, MYST3, NFX1, ZNF281, AR, KHDRBS3, GTPBP4, GMEB1, ZNF143, MED13, MED6, HNRPDL, EIF4G1, ZNF238, BPTF, BAZ1B, ZNF239, MNX1, MGA, ZZZ3, PAF1, CARM1, MYNN, SIVA1, HCRT, CNBP, MTDH, ADORA2A, ELL, ZBTB11, HOXA11, SCML1, PTH1R, TH1L, CYTL1, KEAP1, GCN1L1, NR1H2, EIF3H, LYL1, HMGXB4, LHX5, THAP1, TCEA1, KDM3B, NFATC3, TERF2, GUCA1B, DNMT3A, GUCA1A, NACC2, CEBPE, TAF7, SIRT4, ZNF669, ZBTB44, UIMC1, SAFB2, HDAC5, NRF1, P2RY11, PKNOX1, PPP1R8, EIF4H, ATF7, SMARCC2, RFX1, DDX54, RBM15
GO:0010604 - positive regulation of macromolecule metabolic process347.79E-03CNBP, MORF4L2, ARNT2, MITF, STAT5B, NAA15, CYTL1, CTCF, ANAPC10, CRX, NR1H2, PSMB1, TCEA1, CD24, SUPT5H, NFATC3, TERF2, CUL1, MYST3, AXIN1, ANAPC2, AR, TAF7, MED13, UIMC1, MED6, HDAC5, PKNOX1, BPTF, PSMA5, PSMC3, SMARCC2, TNK2, RBM15
GO:0045893 - positive regulation of transcription, DNA-dependent227.98E-03AR, CNBP, MORF4L2, ARNT2, STAT5B, MITF, TAF7, CYTL1, NAA15, CTCF, MED13, CRX, NR1H2, MED6, HDAC5, PKNOX1, BPTF, SMARCC2, TCEA1, SUPT5H, NFATC3, RBM15
GO:0009890 - negative regulation of biosynthetic process258.53E-03HCRT, EIF2C2, MTDH, E2F6, TH1L, CTCF, NR1H2, AES, SUPT5H, EIF2B4, TERF2, NFX1, MYST3, ZNF281, DNMT3A, GTPBP4, NACC2, TAF7, SIRT4, UIMC1, HDAC5, ZNF238, BPTF, SMARCC2, RBM15
GO:0051254 - positive regulation of RNA metabolic process228.70E-03AR, CNBP, MORF4L2, ARNT2, STAT5B, MITF, TAF7, CYTL1, NAA15, CTCF, MED13, CRX, NR1H2, MED6, HDAC5, PKNOX1, BPTF, SMARCC2, TCEA1, SUPT5H, NFATC3, RBM15
GO:0045934 - negative regulation of nucleic acid metabolic process238.74E-03ZNF281, DNMT3A, HCRT, GTPBP4, NACC2, MTDH, E2F6, TH1L, TAF7, SIRT4, CTCF, UIMC1, NR1H2, HDAC5, AES, ZNF238, BPTF, SMARCC2, SUPT5H, RBM15, TERF2, MYST3, NFX1
GO:0010556 - regulation of macromolecule biosynthetic process899.86E-03EIF2C2, SOX21, E2F6, MORF4L2, STAT5B, ARNT2, MITF, NAA15, CNOT1, CTCF, PHF20, CBX7, ZKSCAN5, CRX, ZNF304, CRY2, AES, ASH2L, MED28, ACTR5, CCDC101, ZNF146, QKI, SUPT5H, EIF2B4, MYST3, NFX1, ZNF281, AR, KHDRBS3, GTPBP4, GMEB1, ZNF143, MED13, MED6, HNRPDL, EIF4G1, ZNF238, BPTF, BAZ1B, ZNF239, MNX1, MGA, ZZZ3, PAF1, CARM1, MYNN, SIVA1, HCRT, CNBP, MTDH, ADORA2A, ELL, ZBTB11, HOXA11, SCML1, TH1L, CYTL1, KEAP1, GCN1L1, NR1H2, EIF3H, LYL1, HMGXB4, LHX5, THAP1, TCEA1, KDM3B, NFATC3, TERF2, DNMT3A, NACC2, CEBPE, TAF7, SIRT4, ZNF669, ZBTB44, UIMC1, SAFB2, HDAC5, NRF1, PKNOX1, PPP1R8, EIF4H, ATF7, SMARCC2, RFX1, DDX54, RBM15

Table IV

The KEGG pathways significant enriched for the downregulated genes.

Table IV

The KEGG pathways significant enriched for the downregulated genes.

TermCountP-valueGene symbol
hsa05416: Viral myocarditis157.85E-08BID, ICAM1, CAV1, HLA-A, HLA-C, CD40, HLA-B, HLA-E, HLA-DMA, HLA-DQA1, HLA-G, FYN, HLA-DPA1, HLA-DPB1, MYH10, HLA-DRA
hsa04510: Focal adhesion223.70E-06CAV1, COL4A2, COL4A1, ACTN4, PDGFB, COL3A1, ITGA1, COL5A2, KDR, VWF, PTK2, LAMA4, LAMA3, DOCK1, ITGA6, ITGA5, FYN, COL6A3, PDGFRB, LAMC1, LAMB1, THBS4
hsa04144: Endocytosis161.44E-03PSD3, ASAP2, HLA-A, ASAP1, HLA-C, KIT, HLA-B, HLA-E, HLA-G, KDR, ARRB1, GRK5, ARAP3, EHD2, EHD3, F2R, EHD4
PPI network analysis and function deviation score

The PPI network for the DEGs contained 409 nodes (including 195 upregulated and 214 downregulated genes) (Fig. 3). Notably, there were various interactions [including ICAM1-TGF-β1, TGFB1-platelet-derived growth factor β (PDGFB), and PDGFB-platelet derived growth factor receptor β (PDGFRB)] in the PPI network. After calculating the function deviation scores of the significantly enriched terms, hierarchical clustering analysis was performed to verify whether these terms clearly distinguished the case group from the control group. The heat map demonstrated that almost all samples were clearly distinguished, indicating that the significantly enriched terms significantly changed at the functional level during OS metastasis (Fig. 4).

Identification of significantly different terms

To identify the significantly different terms in the two groups of samples, logistic regression analysis was performed. The top 25 terms with P<0.01 were listed in Table V, including regulation of cell migration (P=2.15E-05), nucleotide excision repair (P=1.31E-05), Wnt signaling pathway (P=2.32E-03), and cell migration (P=5.56E-03). Specifically, ICAM1, PDGFB, PDGFRB and TGFB1 were enriched in cell migration and regulation of cell migration.

Table V

The top 25 terms with significant difference in the osteosarcoma biopsy specimens before/after metastasis.

Table V

The top 25 terms with significant difference in the osteosarcoma biopsy specimens before/after metastasis.

TermP-value
Blood vessel development3.01E-05
Vasculature development8.11E-06
RNA processing3.97E-05
Positive regulation of macromolecule metabolic process1.87E-07
Negative regulation of gene expression6.75E-05
Regulation of cell migration2.15E-05
Blood vessel morphogenesis1.77E-05
DNA replication3.78E-05
Nucleotide excision repair1.31E-05
ECM-receptor interaction5.27E-05
Viral myocarditis3.09E-04
Protein catabolic process7.33E-04
Oocyte meiosis9.26E-04
Negative regulation of metabolic process1.85E-03
Mismatch repair2.12E-03
Negative regulation of cellular biosynthetic process2.32E-03
Wnt signaling pathway2.32E-03
mRNA metabolic process3.70E-03
Tissue development5.16E-03
Cell migration5.56E-03
RNA metabolic process7.41E-03
Enzyme linked receptor protein signaling pathway8.33E-03
Focal adhesion8.77E-03
Pathways in cancer9.26E-03
Regulation of apoptosis9.52E-03
Validation of the metastasis-associated terms using other independent datasets

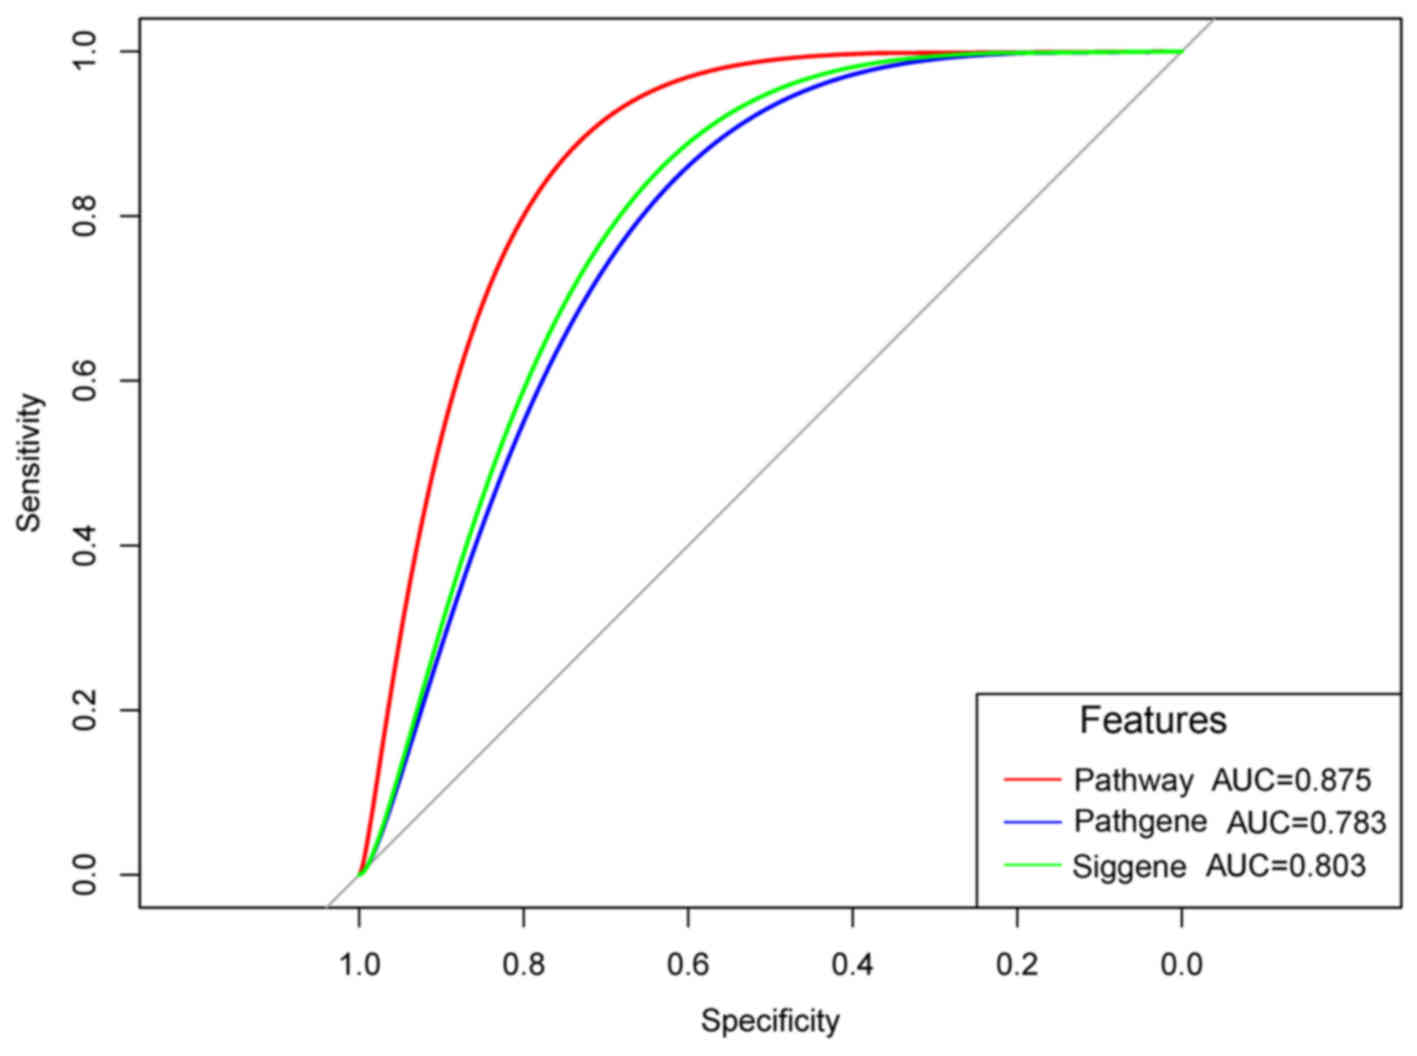
After the microarray datasets, GSE21257 and GSE32981 were merged and normalized, the OS specimens with/without metastasis were predicted. The ROC curves demonstrated that the prediction accuracies of the metastasis-associated terms, the genes enriched in the metastasis-associated terms, and all the DEGs were 0.875, 0.783 and 0.803, respectively (Fig. 5). Thus, the metastasis-associated terms optimized the number of characteristics without reducing the prediction accuracy. In addition, the KM survival curve demonstrated that the survival times of the samples with significant differences in the metastasis-associated terms were significantly changed (P=0.0279) (Fig. 6). In addition, a regression model was used to predict the samples in GSE81892 and GSE14827. The results demonstrated that the prediction accuracies of the model to OS specimens with obvious resistance and OS specimens with drug sensitivity were 82.4 and 65%, respectively. These indicated that the metastasis-associated terms affected drug sensitivity and had better predictive effects for OS specimens with obvious resistance.

Discussion

In the present study, a total of 840 DEGs (including 420 upregulated and 420 downregulated genes) were identified in the case group compared with the control group. Unsupervised clustering analysis indicated that the classification effect for the samples in the majority of neurons was good. Hierarchical clustering analysis indicated that the significantly enriched terms significantly changed at a functional level during OS metastasis. Regulation of cell migration, nucleotide excision repair, the Wnt signaling pathway, and cell migration were among the top 25 terms exhibiting significant differences. ROC curves indicated that the metastasis-associated terms optimized the number of characteristics without reducing the prediction accuracy. Additionally, the KM survival curve indicated that the survival times of the samples with significantly different metastasis-associated terms also demonstrated significant changes. In addition, the metastasis-associated terms affected drug sensitivity and had better predictive effect for OS specimens with obvious resistance.

The nucleotide excision repair pathway, which repairs bulky lesions and is correlated with platinum-based chemotherapy and tumor progression (30,31). ERCC excision repair 2, TFIIH core complex helicase subunit, a member of the nucleotide excision repair pathway, rs1799793 is a marker of OS and is associated with the survival of OS patients following platinum therapy (32). The Wnt signaling pathway has aberrant activation in OS, which is associated with the development and progression of this type of bone malignancy (33,34). The genes involved in Wnt and other Wnt signaling pathways have frequent deletions, indicating that the Wnt signaling pathway is genetically inactivated in patients with OS (35). Therefore, nucleotide excision repair and Wnt signaling pathways may be involved in the pathogenesis of OS.

The present study indicated that ICAM1, PDGFB and PDGFRB were enriched in cell migration and regulation of cell migration. Via promoting the expression of ICAM1, chemokine (C-X3-C motif) ligand 1 (termed fractalkine) contributes to migration and metastasis of OS cells, and thus represents a promising therapeutic target for inhibiting OS metastasis (36). Via the PI3K/Akt signaling pathway, ICAM1 expression is upregulated by amphiregulin and thus leads to enhanced cell metastasis of OS (37,38). Kubo et al (39) demonstrate that the expression levels of PDGF and PDGFR potentially predict the prognosis of OS. Takagi et al (40) observed that platelets promote PDGF function in the proliferation of OS cells via activation of the PDGFR-Akt signaling axis. Thus, ICAM1, PDGFB and PDGFRB may act in OS via cell migration and regulation of cell migration. In the PPI network, there were various interactions (including ICAM1-TGFB1, TGFB1-PDGFB, and PDGFB-PDGFRB). Thus, ICAM1, PDGFB and PDGFRB function in OS via interacting with other genes.

Furthermore, TGFB1 was enriched in cell migration and regulation of cell migration. The serum level of TGFB in OS patients with metastasis is higher than that in OS patients without metastasis, indicating that TGFB may be important in OS (41). TGFB2 activity is inhibited by lumican, which subsequently mediates cell adhesion of OS by regulating integrin-β1, phosphorylated SMAD family member 2 (SMAD2) and phosphorylated focal adhesion kinase (42). Wu et al (43) report that the 29 T>C single nucleotide polymorphism of the TGFB1 gene is correlated with the incidence and invasion of OS. The TGFB/SMAD3 and p53 signaling pathways are critical for the doxorubicin-induced cytotoxicity in OS cells (44). Antisense TGFB1 inhibits matrix metallopeptidase 2 and urokinase expression levels, which suppresses the invasion and metastasis of OS cells (45). Thus, TGFB1 contribute to the metastasis of OS via cell migration and regulation of cell migration.

Limited to the number of collected samples, we cannot validate the results of this study in clinical samples. However, we believe that these results based on large data analysis could provide valuable clues for the study of the pathogenesis of metastasis or may aid in the development of novel treatment strategies for OS.

In conclusion, a total of 840 DEGs were identified in the case group. In addition, nucleotide excision repair and the Wnt signaling pathway, as well as cell migration and regulation of cell migration involving ICAM1, PDGFB, PDGFRB and TGFB1 may represent the metastasis-associated pathways of OS.

References

1 

Luetke A, Meyers PA, Lewis I and Juergens H: Osteosarcoma treatment - where do we stand? A state of the art review. Cancer Treat Rev. 40:523–532. 2014. View Article : Google Scholar

2 

Ottaviani G, Jaffe N, Eftekhari F, Raymond AK and Yasko AW: Pediatric and Adolescent Osteosarcoma. Springer; New York, NY: 2010

3 

Ritter J and Bielack SS: Osteosarcoma. Ann Oncol. 21(Suppl 7): vii320–vii325. 2010. View Article : Google Scholar : PubMed/NCBI

4 

Geller DS and Gorlick R: Osteosarcoma: a review of diagnosis, management, and treatment strategies. Clin Adv Hematol Oncol. 8:705–718. 2010.

5 

Mavrogenis AF, Abati CN, Romagnoli C and Ruggieri P: Similar survival but better function for patients after limb salvage versus amputation for distal tibia osteosarcoma. Clin Orthop Relat Res. 470:1735–1748. 2012. View Article : Google Scholar : PubMed/NCBI

6 

Dong Y, Liang G, Yuan B, Yang C, Gao R and Zhou X: MALAT1 promotes the proliferation and metastasis of osteosarcoma cells by activating the PI3K/Akt pathway. Tumour Biol. 36:1477–1486. 2015. View Article : Google Scholar

7 

Zhang JH, Kang XH, Lu P, Miao ZH, Sun GS, Cao XJ and Cao F: Expression of long non-coding RNA MALAT1 in osteosarcoma and its effect on invasiveness and metastatic potential of osteosarcoma cells. Zhonghua Bing Li Xue Za Zhi. 45:561–565. 2016.In Chinese. PubMed/NCBI

8 

Hou CH, Lin FL, Tong KB, Hou SM and Liu JF: Transforming growth factor alpha promotes osteosarcoma metastasis by ICAM-1 and PI3K/Akt signaling pathway. Biochem Pharmacol. 89:453–463. 2014. View Article : Google Scholar : PubMed/NCBI

9 

Zhao Z, Wu MS, Zou C, Tang Q, Lu J, Liu D, Wu Y, Yin J, Xie X, Shen J, et al: Downregulation of MCT1 inhibits tumor growth, metastasis and enhances chemotherapeutic efficacy in osteosarcoma through regulation of the NF-κB pathway. Cancer Lett. 342:150–158. 2014. View Article : Google Scholar

10 

Zhao S, Kurenbekova L, Gao Y, Roos A, Creighton CJ, Rao P, Hicks J, Man TK, Lau C, Brown AM, et al: NKD2, a negative regulator of Wnt signaling, suppresses tumor growth and metastasis in osteosarcoma. Oncogene. 34:5069–5079. 2015. View Article : Google Scholar : PubMed/NCBI

11 

Sun XZ, Liao Y and Zhou CM: NKD2 a novel marker to study the progression of osteosarcoma development. Eur Rev Med Pharmacol Sci. 20:2799–2804. 2016.PubMed/NCBI

12 

Qian M, Yang X, Li Z, Jiang C, Song D, Yan W, Liu T, Wu Z, Kong J, Wei H, et al: p50-associated COX-2 extragenic RNA (PACER) overexpression promotes proliferation and metastasis of osteosarcoma cells by activating COX-2 gene. Tumour Biol. 37:3879–3886. 2016. View Article : Google Scholar

13 

Kelly AD, Haibe-Kains B, Janeway KA, Hill KE, Howe E, Goldsmith J, Kurek K, Perez-Atayde AR, Francoeur N, Fan JB, et al: MicroRNA paraffin-based studies in osteosarcoma reveal reproducible independent prognostic profiles at 14q32. Genome Med. 5:22013. View Article : Google Scholar : PubMed/NCBI

14 

Ritchie ME, Phipson B, Wu D, Hu Y, Law CW, Shi W and Smyth GK: Limma powers differential expression analyses for RNA-sequencing and microarray studies. Nucleic Acids Res. 43:e472015. View Article : Google Scholar : PubMed/NCBI

15 

Demšar J, Curk T, Erjavec A, Gorup Č, Hočevar T, Milutinovič M, Možina M, Polajnar M, Toplak M, Starič A, et al: Orange: Data mining toolbox in Python. J Mach Learn Res. 14:2349–2353. 2013.

16 

Man D, Uda K, Ito Y and Nakano K: Accelerating computation of Euclidean distance map using the GPU with efficient memory access. Int J Parallel Emergent Distrib Syst. 28:383–406. 2013. View Article : Google Scholar

17 

Nahler G: Pearson correlation coefficient. Springer Top Signal Process. 2:1–4. 2009. View Article : Google Scholar

18 

Zha W, Li M and Fu Y: Empirical analysis of highway traffic accident in average linkage clustering method. ECJTU. 2010.

19 

Kohonen T: The self-organization map. Adv Inf Knowl Process. 1:3–17. 2007.

20 

Tweedie S, Ashburner M, Falls K, Leyland P, McQuilton P, Marygold S, Millburn G, Osumi-Sutherland D, Schroeder A, Seal R, et al FlyBase Consortium: FlyBase: Enhancing Drosophila gene ontology annotations. Nucleic Acids Res. 37:D555–D559. 2009. View Article : Google Scholar :

21 

Kanehisa M and Goto S: KEGG: Kyoto encyclopedia of genes and genomes. Nucleic Acids Res. 28:27–30. 2000. View Article : Google Scholar

22 

Huang DW, Sherman BT, Tan Q, Kir J, Liu D, Bryant D, Guo Y, Stephens R, Baseler MW, Lane HC, et al: DAVID Bioinformatics Resources: Expanded annotation database and novel algorithms to better extract biology from large gene lists. Nucleic Acids Res. 35:W169–175. 2007. View Article : Google Scholar : PubMed/NCBI

23 

Chatr-Aryamontri A, Breitkreutz BJ, Oughtred R, Boucher L, Heinicke S, Chen D, Stark C, Breitkreutz A, Kolas N, O’Donnell L, et al: The BioGRID interaction database: 2015 update. Nucleic Acids Res. 43:D470–D478. 2015. View Article : Google Scholar :

24 

Keshava Prasad TS, Goel R, Kandasamy K, Keerthikumar S, Kumar S, Mathivanan S, Telikicherla D, Raju R, Shafreen B, Venugopal A, et al: Human Protein Reference Database - 2009 update. Nucleic Acids Res. 37:D767–D772. 2009. View Article : Google Scholar

25 

Saito R, Smoot ME, Ono K, Ruscheinski J, Wang PL, Lotia S, Pico AR, Bader GD and Ideker T: A travel guide to Cytoscape plugins. Nat Methods. 9:1069–1076. 2012. View Article : Google Scholar : PubMed/NCBI

26 

Langfelder P, Mischel PS and Horvath S: When is hub gene selection better than standard meta-analysis? PLoS One. 8:e615052013. View Article : Google Scholar : PubMed/NCBI

27 

Roush ET, Das T and Nandana P: Cluster software upgrades. Journal. 2009.

28 

May WL: Kaplan-Meier survival analysis. Encyclopedia of Cancer. 1934–1937. 2011. View Article : Google Scholar

29 

Yoshii T, Geng Y, Peyton S, Mercurio AM and Rotello VM: Biochemical and biomechanical drivers of cancer cell metastasis, drug response and nanomedicine. Drug Discov Today. 21:1489–1494. 2016. View Article : Google Scholar : PubMed/NCBI

30 

Stoehlmacher J, Park DJ, Zhang W, Yang D, Groshen S, Zahedy S and Lenz HJ: A multivariate analysis of genomic polymorphisms: Prediction of clinical outcome to 5-FU/oxaliplatin combination chemotherapy in refractory colorectal cancer. Br J Cancer. 91:344–354. 2004. View Article : Google Scholar : PubMed/NCBI

31 

Reed E: Platinum-DNA adduct, nucleotide excision repair and platinum based anti-cancer chemotherapy. Cancer Treat Rev. 24:331–344. 1998. View Article : Google Scholar : PubMed/NCBI

32 

Biason P, Hattinger CM, Innocenti F, Talamini R, Alberghini M, Scotlandi K, Zanusso C, Serra M and Toffoli G: Nucleotide excision repair gene variants and association with survival in osteosarcoma patients treated with neoadjuvant chemotherapy. Pharmacogenomics J. 12:476–483. 2012. View Article : Google Scholar

33 

Cai Y, Cai T and Chen Y: Wnt pathway in osteosarcoma, from oncogenic to therapeutic. J Cell Biochem. 115:625–631. 2014. View Article : Google Scholar

34 

Lin CH, Ji T, Chen CF and Hoang BH: Wnt signaling in osteosarcoma. Adv Exp Med Biol. 804:33–45. 2014. View Article : Google Scholar : PubMed/NCBI

35 

Du X, Yang J, Yang D, Tian W and Zhu Z: The genetic basis for inactivation of Wnt pathway in human osteosarcoma. BMC Cancer. 14:4502014. View Article : Google Scholar : PubMed/NCBI

36 

Liu JF, Tsao YT and Hou CH: Fractalkine/CX3CL1 induced intercellular adhesion molecule-1-dependent tumor metastasis through the CX3CR1/PI3K/Akt/NF-κB pathway in human osteosarcoma. Oncotarget. 8:54136–54148. 2016.

37 

Liu JF, Tsao YT and Hou CH: Amphiregulin enhances inter-cellular adhesion molecule-1 expression and promotes tumor metastasis in human osteosarcoma. Oncotarget. 6:40880–40895. 2015. View Article : Google Scholar : PubMed/NCBI

38 

Lin YM, Chang ZL, Liao YY, Chou MC and Tang CH: IL-6 promotes ICAM-1 expression and cell motility in human osteosarcoma. Cancer Lett. 328:135–143. 2013. View Article : Google Scholar

39 

Kubo T, Piperdi S, Rosenblum J, Antonescu CR, Chen W, Kim HS, Huvos AG, Sowers R, Meyers PA, Healey JH, et al: Platelet-derived growth factor receptor as a prognostic marker and a therapeutic target for imatinib mesylate therapy in osteosarcoma. Cancer. 112:2119–2129. 2008. View Article : Google Scholar : PubMed/NCBI

40 

Takagi S, Takemoto A, Takami M, Oh-Hara T and Fujita N: Platelets promote osteosarcoma cell growth through activation of the platelet-derived growth factor receptor-Akt signaling axis. Cancer Sci. 105:983–988. 2014. View Article : Google Scholar : PubMed/NCBI

41 

Xu S, Yang S, Sun G, Huang W and Zhang Y: Transforming growth factor-beta polymorphisms and serum level in the development of osteosarcoma. DNA Cell Biol. 33:802–806. 2014. View Article : Google Scholar : PubMed/NCBI

42 

Nikitovic D, Chalkiadaki G, Berdiaki A, Aggelidakis J, Katonis P, Karamanos NK and Tzanakakis GN: Lumican regulates osteosarcoma cell adhesion by modulating TGFβ2 activity. Int J Biochem Cell Biol. 43:928–935. 2011. View Article : Google Scholar : PubMed/NCBI

43 

Wu Y, Zhao J and He M: Correlation between TGF-β1 gene 29 T>C single nucleotide polymorphism and clinicopathological characteristics of osteosarcoma. Tumour Biol. 36:5149–5156. 2015. View Article : Google Scholar : PubMed/NCBI

44 

Sun Y, Xia P, Zhang H, Liu B and Shi Y: P53 is required for Doxorubicin-induced apoptosis via the TGF-beta signaling pathway in osteosarcoma-derived cells. Am J Cancer Res. 6:114–125. 2015.

45 

Bao TZ, Zao HW, Zheng QX, Liu W and Liu Y: Effects of antisense transforming growth factor-β1 on the factors related to metastasis in osteosarcoma. Chin J Exp Surg. 4:477–478. 2005.

Related Articles

Journal Cover

March-2018
Volume 41 Issue 3

Print ISSN: 1107-3756
Online ISSN:1791-244X

Sign up for eToc alerts

Recommend to Library

Copy and paste a formatted citation
x
Spandidos Publications style
Liu Y, Sun W, Ma X, Hao Y, Liu G, Hu X, Shang H, Wu P, Zhao Z, Liu W, Liu W, et al: Logistic regression analysis for the identification of the metastasis-associated signaling pathways of osteosarcoma. Int J Mol Med 41: 1233-1244, 2018
APA
Liu, Y., Sun, W., Ma, X., Hao, Y., Liu, G., Hu, X. ... Liu, W. (2018). Logistic regression analysis for the identification of the metastasis-associated signaling pathways of osteosarcoma. International Journal of Molecular Medicine, 41, 1233-1244. https://doi.org/10.3892/ijmm.2018.3360
MLA
Liu, Y., Sun, W., Ma, X., Hao, Y., Liu, G., Hu, X., Shang, H., Wu, P., Zhao, Z., Liu, W."Logistic regression analysis for the identification of the metastasis-associated signaling pathways of osteosarcoma". International Journal of Molecular Medicine 41.3 (2018): 1233-1244.
Chicago
Liu, Y., Sun, W., Ma, X., Hao, Y., Liu, G., Hu, X., Shang, H., Wu, P., Zhao, Z., Liu, W."Logistic regression analysis for the identification of the metastasis-associated signaling pathways of osteosarcoma". International Journal of Molecular Medicine 41, no. 3 (2018): 1233-1244. https://doi.org/10.3892/ijmm.2018.3360