Introduction
Diabetes mellitus refers to a group of metabolic
diseases that are characterized by hyperglycemia, which results
from defects in the secretion and/or action of insulin. The vast
majority of cases of diabetes fall into two broad categories: Type
1 diabetes mellitus, which is caused by an absolute deficiency of
insulin secretion; and type 2 diabetes mellitus (T2DM), which is
caused by resistance to insulin action alongside an inadequate
compensatory insulin secretory response (1). According to recent World Health
Organization estimates, ~347 million individuals have T2DM. The
number of patients with diabetes is expected to rise to 438 million
by 2030, and >135 million people are affected by diabetes
worldwide (2,3). The degree of hyperglycemia is
sufficient to induce pathological and functional alterations in
various target tissues, thus resulting in an increased risk of
developing various disease-associated microvascular and
macrovascular complications, including hypertension, retinopathy,
nephropathy, neuropathy, myocardial infarction and stroke (4). Therefore, the maintenance of normal
plasma glucose levels is a key factor to delay or prevent the
development of diabetes-associated complications (5,6).
Numerous drugs, including sulfonylurea, metformin and insulin
injections, are able to control high blood glucose levels and
prevent these complications. Among these drugs, metformin is widely
prescribed to control blood glucose levels (7,8),
and is often administered as a preliminary drug to treat T2DM
combined with other agents, including glimepiride and pioglitazone
(9,10).
The liver serves as the 'metabolic center' of the
body, and is involved in the metabolism of various molecules,
including carbohydrates, lipids, proteins and hormones. Therefore,
the liver serves a crucial role in the maintenance of material
metabolism, which concerns the digestion, absorption, movement and
decomposition of substances in the body, and energy metabolism. It
is generally accepted that metformin reduces fasting blood glucose
(FBG) levels by reducing the rate of hepatic glucose production
(11). In a previous study,
metformin was able to increase glucose utilization in muscles and
fat synthesis (12). Further
studies indicated that metformin may activate adenosine
monophosphate-activated protein kinase (AMPK) in peripheral
tissues, which is a major cellular regulator of lipid and glucose
metabolism (13,14), without stimulating insulin
production (9). Therefore, it is
clear that metformin exhibits antidiabetes efficacy via multitarget
and multipathway mechanisms; however, the target genes associated
with the mechanisms underlying the effects of metformin on glucose
remain unclear (15). Network
pharmacology is a systems biology-based methodology and technology,
which is based on the fundamental concept that effective
therapeutic drugs act on several, rather than single, targets
(16,17). These targets can be determined
using molecular networks that integrate multidisciplinary concepts,
including biochemical networks, bioinformatics and systems biology.
The combination of network theory and 'omics' data may help to
forecast off-target effects at a higher efficiency, which could
improve drug discovery through a novel network mode of 'multiple
targets, multiple effects, complex diseases' (18). Therefore, network analyses based
on network pharmacology theories have garnered attention as a
powerful tool to systematically reveal the complex mechanism of
action of metformin. Unlike traditional pharmacology, network
pharmacology considers the relationship between genes and/or
proteins to determine biologically important genes, which may
reveal the intricate mechanism underlying the disease or drug
action through multiple genes and targets, rather than single genes
and targets.
The present study aimed to reveal the interactions
between representative genes and proteins underlying T2DM, in order
to identify genes and proteins central to their topology and probe
the molecular interactions between metformin and these targets.
Furthermore, multitargeted antidiabetic genes targeted by metformin
were determined by gene network and protein network analyses.
Materials and methods
Experimental animals and drug
treatment
Male Sprague-Dawley rats (Shanghai SLAC Laboratory
Animal Co., Ltd., Shanghai, China; age, 8 weeks; weight, ~200 g)
were used in the present study. Rats were housed (n=3/cage) under a
12-h light/dark cycle at an ambient temperature of 22–25°C. In
addition, rats were fed a standard chow diet (Zhejiang Academy of
Medical Sciences, Hangzhou, China) and water ad libitum for
2 weeks. T2DM was induced by injecting freshly prepared
streptozotocin (STZ, 30 mg/kg, i.p.; Cas: 8883-66-4, Shanghai
Haoran Biotechnology Co., Ltd, Shanghai, China) in cold citrate
buffer (0.1 M, pH 4.2) into overnight-fasted Sprague-Dawley rats.
Normal Sprague-Dawley rats were fed a standard chow diet. T2DM
Sprague-Dawley rats were fed a high-fat diet consisting of 69.75%
standard chow diet, 10% lard, 10% yolk powder, 0.25% cholesterol
and 10% sucrose (Zhejiang Academy of Medical Sciences). All rats
were maintained under standard laboratory conditions for 11 weeks.
Fasting blood glucose (FBG) was determined using a glucose meter
(Accu-Chek Performa; Roche Diagnostics GmbH, Mannheim, Germany)
every 7 days, and diabetic rats exhibiting blood glucose levels
between 15 and 25 mmol/l were selected to assess the antidiabetic
activity of metformin. T2DM rats were randomly assigned into the
T2DM group (n=11), in which diabetic rats received 10 ml/kg 0.25%
sodium carboxymethyl cellulose (CMC-Na); and the metformin group
(n=10), in which diabetic rats received 200 mg/kg metformin
(Sino-American Shanghai Squibb Pharmaceutical Ltd., Shanghai,
China) dissolved in 0.25% CMC-Na once daily for 11 consecutive
weeks by gavage. The normal group (n=9) consisted of Sprague-Dawley
rats treated with 10 ml/kg CMC-Na once daily for 11 consecutive
weeks by gavage. Prior to treatment, measurements (at 0 weeks) of
FBG, hemoglobin A1c (HbA1C), total cholesterol (TC), triglycerides
(TG), high-density lipoprotein cholesterol (HDL-C), low-density
lipoprotein cholesterol (LDL-C) and serum insulin levels were
taken. FBG levels were measured every week and HbA1C was measured
every month; however, TC, TG, HDL-C, LDL-C and serum insulin levels
were measured at the 11th week only, and the rats were sacrificed.
In addition, the rats underwent an oral glucose tolerance test.
Blood samples were collected by puncturing the retro-orbital plexus
under 10% chloral hydrate anesthesia (300 mg/kg, i.p), and rats
were euthanized by rapid excision of the heart, liver, kidney,
spleen, and skeletal muscle and fat tissues under anesthesia. Liver
samples were weighed, quickly frozen in liquid nitrogen and stored
at −80°C. The liver index and insulin sensitivity index were
subsequently calculated. The rat experiments were conducted at the
Zhejiang Chinese Medical University Laboratory Animal Research
Center (Hangzhou, China; rodent licence no. SCXK 2013–2016), and
the present study was approved by the Laboratory Animal Management
and Welfare Ethics Review Committee of Zhejiang Chinese Medical
University (permit no. ZSLL-2013-48). All animal experiments were
undertaken according to the guidelines of the Laboratory Animal
Management and Welfare Ethics Review Committee.
Measurement of biochemical
parameters
Blood samples were collected from the tail vein
after a 16-h fast. FBG levels and body weight were estimated every
7 days after the treatments. Glycated HbA1c was estimated using an
automated analyzer (Que-Test Analyzer; Quotient Diagnostics Ltd.,
London, UK) every month. Individual rats were placed in metabolic
cages to obtain 24-h urine collections, and daily urinary albumin
excretion levels were measured. Metformin was administered to the
overnight-fasted rats at the last administration, and after 1-h
treatments, all animals were anesthetized with 10% chloral hydrate
(300 mg/kg, i.p). Blood samples were obtained by puncturing the
retro-orbital plexus and were stored with or without disodium EDTA
to evaluate the biochemical parameters, including serum TC (cat.
no. 113009910704), HDL-C (cat. no. 135219910704), LDL-C (cat. no.
141219910930) and TG (cat. no. 157109910717; all from DiaSys
Diagnostic Systems GmbH, Frankfurt, Germany), using commercially
available kits in a semi-auto analyzer (Photometer 4040; Riele,
Berlin, Germany). Serum insulin levels were estimated using the
ELISA method (cat. no. 10-1250-01; Mercodia AB, Uppsala, Sweden).
The liver index was calculated as liver weight (mg)/body weight
(g). Furthermore, insulin sensitivity index was calculated as 1/FBG
(mmol/l) × serum insulin (µg/l).
Microarray experiment
Total RNA was extracted from liver tissues
(n=6/group) following treatment using the miRNeasy kit (217004;
Qiagen, Inc., Valencia, CA, USA) according to the manufacturer's
protocol. Isolated RNA was considered pure if the ratio of
absorbance readings at 260 and 280 nm was 1.7:2.1. A total of 250
ng quality-checked total cellular RNA was reverse transcribed using
the Low-input RNA Linear Amplification kit (Agilent Technologies,
Inc., Santa Clara, CA, USA) and was then transcribed into
Cy3-labeled cRNA according to the manufacturer's protocol. The
labeled cRNA was purified using the RNeasy kit (Qiagen, Inc.), and
the dye content (>9.0 pmol dye/mg cRNA) and concentration of
cRNA were measured using a NanoDrop ND-1000 spectrophotometer
(NanoDrop Technologies; Thermo Fisher Scientific, Inc., Wilmington,
DE, USA). A total of 1,650 ng Cy3-labeled cRNA was hybridized to
Whole Rat Genome Oligo 4×44K microarrays (Agilent Technologies,
Inc.) overnight at 65°C, after which the slides were washed and
treated with Stabilization and Drying Solution, and were scanned
using Agilent Microarray Scanner (both from Agilent Technologies,
Inc.). All steps were performed according to the manufacturer's
protocols.
Gene expression data and network
analysis
All microarray data were extracted using
GenePix® pro 6.1 (Molecular Devices, LLC, Sunnyvale, CA,
USA). The data were normalized using Agilent_Analyze_V1.0 (Agilent
Technologies, Inc.), with default parameter settings for one-color
oligonucleotide microarrays, after which the statistics were
further analyzed. Genes with a >1.5-fold differential expression
were further analyzed using statistical analyses. An unpaired
t-test was used to compare the groups. The Benjamini-Hochberg
multiple testing correction method was applied with a P<0.05
cutoff. For gene network analysis, gene symbols, Agilent probe IDs,
and the fold change of the differentially expressed genes (DEGs;
metformin-treated samples vs. T2DM samples, and T2DM samples vs.
control samples) were imported into GeneMANIA software (http://www.genemania.org). In GeneMANIA, the analysis
was conducted with P<0.05 as the cut-off point. Genes with known
gene symbols and their corresponding expression values were
uploaded into the software. Each gene symbol was mapped to its
corresponding gene object in the Ingenuity Pathways Knowledge Base.
A Kyoto Encyclopedia of Genes and Genomes (KEGG) pathway and the
Gene Ontology (GO) enrichment analysis was performed using the
Database for Annotation, Visualization and Integrated Discovery
(DAVID; https://david.ncifcrf.gov/home.jsp) 6.7 tools to
obtain the biological meaning of the networks.
Protein preparation
Liver samples acquired from the control, T2DM and
metformin groups (n=6/group) were ground into powder in liquid
nitrogen and proteins were extracted using lysis buffer, which
consisted of 7 M urea, 2 M thiourea, 4%
3-[(3-cholamidopropyl)dimethylammonio]-1-propanesulfonate and 40 mM
Tris-HCl (pH 8.5) containing 1 mM phenylmethylsulfonyl fluoride and
2 mM EDTA. After 5 min, 10 mM dithiothreitol (DTT) was added to the
samples. The suspension was sonicated at 200 W for 15 min, and was
then centrifuged at 4°C and 30,000 × g for 15 min. The supernatant
was mixed well with 5X chilled acetone containing 10% (v/v)
trichloroacetic acid and was incubated at −20°C overnight.
Following centrifugation at 4°C and 30,000 × g for 15 min, the
supernatant was discarded. The precipitate was washed three times
with chilled acetone. The pellet was air-dried and dissolved in
lysis buffer [7 M urea, 2 M thiourea, 4% NP-40 and 20 mM Tris-HCl
(pH 8.0–8.5)]. The suspension was sonicated at 200 W for 15 min,
and was then centrifuged at 4°C and 30,000 × g for 15 min. The
supernatant was transferred to another tube. To reduce the
disulfide bonds in proteins in the supernatant, 10 mM DTT was added
and the samples were incubated at 56°C for 1 h. Subsequently, 55 mM
iodoacetamide was added to block the cysteines and the samples were
incubated for 1 h in the dark at 4°C. The supernatant was then
mixed well with 5X chilled acetone for 2 h at −20°C to precipitate
proteins. Following centrifugation at 4°C and 30,000 × g for 15
min, the pellet was air-dried for 5 min, dissolved in 500 µl
0.5 M triethylammoniumbicarbonate (TEAB) (Applied Biosystems;
Thermo Fisher Scientific, Inc., Waltham, MA, USA) and sonicated at
200 W for 15 min. Finally, the samples were centrifuged at 4°C and
30,000 × g for 15 min. The supernatant was transferred to a new
tube and quantified using a 2-D Quant kit (GE Healthcare Life
Sciences, Little Chalfont, UK). The proteins in the supernatant
were maintained at −80°C for further analysis.
Isobaric tags for relative and absolute
quantitation (iTRAQ) labeling and strong cation exchange (SCX)
fractionation
iTRAQ marker technology is an effective method used
to study cells or tissues in various physiological states, and to
determine specific protein markers. Total proteins (100 µg)
from each sample were digested with Trypsin Gold (Promega
Corporation, Madison, WI, USA) in a ratio of 30:1 at 37°C for 16 h.
After trypsin digestion, peptides were dried by vacuum
centrifugation. Peptides were reconstituted in 0.5 M TEAB and
processed using 8-plex iTRAQ reagent (Applied Biosystems; Thermo
Fisher Scientific, Inc.) according to the manufacturer's protocol.
The samples were labeled with the iTRAQ tags as follows: Normal
samples (114 tag), T2DM samples (116 tag) and metformin samples
(118 tag). The labeled peptide mixtures were then pooled and dried
by vacuum centrifugation. Subsequently, the labeled peptides were
pooled and purified using a SCX chromatography column (Phenomenex,
Inc., Torrance, CA, USA), and were separated by liquid
chromatography (LC) using a LC-20AB HPLC Pump system (Shimadzu
Corporation, Kyoto, Japan). The iTRAQ-labeled peptide mixtures were
reconstituted with 4 ml buffer A [25 mM
NaH2PO4 in 25% acetonitrile (ACN), pH 2.7]
and loaded onto a 4.6×250 mm Ultremex SCX column containing
5-µm particles (Phenomenex, Inc.). The peptides were eluted
at a flow rate of 1 ml/min with a gradient of buffer A for 10 min,
5–60% buffer B (25 mM NaH2PO4, 1 M KCl in 25%
ACN, pH 2.7) for 27 min, and 60–100% buffer B for 1 min. The system
was then maintained at 100% buffer B for 1 min prior to
equilibrating with buffer A for 10 min before the next injection.
Elution was monitored by measuring the absorbance at 214 nm, and
fractions were collected every 1 min. The eluted peptides were
pooled into 20 fractions, desalted with a Strata X C18 column
(Phenomenex, Inc.), and vacuum-dried.
LC-electrospray ionization-tandem mass
spectrometry (LC-ESI-MS/MS) analysis based on Triple time-of-flight
(TOF) 5600
Each fraction was resuspended in buffer A [5% ACN,
0.1% formic acid (FA)] and centrifuged at 20,000 × g for 10 min;
the final concentration of the peptide was ~0.5
µg/µl. Subsequently, 10 µl supernatant was
loaded on a LC-20AD nano-HPLC (Shimadzu Corporation) using an
autosampler onto a 2-cm C18 trap column. The peptides were then
eluted onto a 10-cm analytical C18 column (inner diameter, 75
µm) packed in-house. The samples were loaded at 8
µl/min for 4 min; the 35-min gradient was run at 300 nl/min
starting at 2 to 35% buffer B (95% ACN, 0.1% FA), followed by 5-min
linear gradient to 60%, then 2-min linear gradient to 80%, and
maintenance at 80% buffer B for 4 min. Finally, buffer B was
returned to 5% in 1 min. Data acquisition was performed using a
Triple TOF 5600 system fitted with a Nanospray III source (SCIEX,
Framingham, MA, USA) with a pulled quartz tip as the emitter (New
Objective, Inc., Woburn, MA, USA). Data were acquired using an ion
spray voltage of 2.5 kV, curtain gas of 30 psi, nebulizer gas of 15
psi, and an interface temperature of 150°C. Mass spectrometry (MS)
was operated with a reversed phase ≥30,000 FWHM for TOF MS scans.
For information-dependent acquisition, survey scans were acquired
in 250 msec, and as many as 30 product ion scans were collected if
exceeding a threshold of 120 counts per second and with a
2+ to 5+ charge state. Total cycle time was
fixed to 3.3 sec. The Q2 transmission window was 100 kDa for 100%.
Particle signal was obtained at a pulser frequency value of 11 kHz
via monitoring of the 40-GHz multichannel time-to-digital detector
with a four-anode channel to record four times for combined
transformation. A sweeping collision energy setting of 35±5 eV
coupled with iTRAQ adjust rolling collision energy was applied to
all precursor ions for collision-induced dissociation. Dynamic
exclusion was set for 1/2 of peak width (15 sec), and the precursor
was refreshed off the exclusion list.
Protein data and network analysis
Raw data files acquired from the Orbitrap (Thermo
Fisher Scientific, Inc.) were converted into Mascot Generic Format
(MGF) files using Proteome Discoverer 1.2 (PD 1.2; Thermo Fisher
Scientific, Inc.), and the MGF files were searched. Protein
identification was performed using Mascot search engine (Matrix
Science Ltd., London, UK). The parameters used included Gln- >
pyro-Glu (N-term Q), oxidation (M) and deamidated (NQ) as the
potential variable modifications; and carbamidomethyl (C),
iTRAQ8plex (N-term) and iTRAQ8plex (K) as the fixed modifications.
The charge states of peptides were set to 2+ and
3+. iTRAQ data from three biological replicates were
analyzed using Mascot 2.3.02 software (Matrix Science Ltd.) and
protein identification was performed using the most recently
updated IPI_Rat V 3.87 SwissProt database (39,925 sequences;
http://www.gpmaw.com/html/swiss-prot.html). To reduce
the probability of false peptide identification, only peptides with
significance scores (≥20) at the 99% confidence interval, as
determined by a Mascot probability analysis, greater than
'identity' were counted as identified. Each confident protein
identification involved at least one unique peptide. For protein
quantization, it was required that a protein must contain at least
two unique peptides. The quantitative protein ratios were weighed
and normalized by the median ratio in Mascot. Only ratios with
P<0.05 and fold changes >1.2 were considered significant.
Functional annotations of the proteins were conducted using
Blast2GO program against the nonredundant protein database
(https://www.blast2go.com/). The KEGG
database (http://www.genome.jp/kegg/) and the
COG database (http://www.ncbi.nlm.nih.gov/COG/) were used to
classify and group these identified proteins.
Screening DEGs with microarray and
iTRAQ
Genes with a >1.5-fold differential expression
and proteins with a >1.2-fold differential expression were
further analyzed. To identify the key genes involved in T2DM,
microarray and iTRAQ analysis was used to analyze the same
expressed trend (up or down) of the genes. The key genes
upregulated or downregulated in both microarray and iTRAQ analyses
were verified using quantitative polymerase chain reaction (qPCR)
and western blot analysis.
Verification of DEGs with qPCR and
western blot analysis
Total RNA was extracted from the tissues using
TRIzol® (Invitrogen; Thermo Fisher Scientific, Inc.)
according to the manufacturer's protocol. cDNA was then synthesized
using a reverse transcription kit (Thermo Fisher Scientific, Inc.)
according to the manufac turer's protocol. The cycling condi tions
for reverse transcription were as follows: 42°C for 60 min to start
the reaction and 70°C for 5 min to terminate the reaction, after
which the samples were immediately cooled on ice. cDNA was used as
a template for qPCR, which was conducted using the following
primers purchased from Sangon Biotech Co., Ltd. (Shanghai, China):
Carboxylesterase 1C subunit (Ces1C), upstream 5′-AAG CAA GAG TTT
GGC TGG AT-3′, downstream 5′-TTA GGG CTG AAC CTC CTC AA-3′ (106
bp); cholesterol 7α-hydroxylyase (Cyp7a1), upstream 5′-GCA TCT CAA
GCA AAC ACC AT-3′, downstream 5′-TCC ACT CAC TTC TTC AGA GGC-3′ (98
bp); and β-actin, upstream 5′-GCT CTC TTC CAG CCT TCC TT-3′ and
downstream 5′-GGT CTT TAC GGA TGT CAA CG-3′ (105 bp). qPCR was
performed using an Eppendorf RealPlex 4 Real-Time PCR Machine
(Eppendorf, Hamburg, Germany); β-actin was used as an internal
normalization control. The qPCR thermocycling conditions were as
follows: pre-denaturation at 95°C for 30 sec, followed by 40 cycles
of denaturation at 95°C for 5 sec and annealing at 60°C for 30 sec.
The dissolution curve conditions were 65°C for 0.05 sec and 95°C
for 0.5 sec. The results were presented as the fold change in gene
expression relative to that of β-actin (2−ΔΔCq)
(19).
For western blotting, tissues were lysed in lysis
buffer (Beyotime Institute of Biotechnology, Haimen, China) for 30
min on ice. The lysates were separated by centrifugation at 12,000
× g for 15 min at 4°C. The total protein concentration in the
supernatants was detected using Bicinchoninic Acid Protein assay
kit (Nanjing KeyGen Biotech Co., Ltd., Nanjing, China). SDS-PAGE
was performed using 10% standard polyacrylamide gels, and 20
µg protein was loaded onto gels. Proteins were subsequently
transferred to polyvinylidene fluoride membranes, which were
saturated with 5% milk in Tris-buffered saline and 1% Tween-20
(TBST) at 4°C for 2 h, and were then incubated with primary
antibodies against Ces1C (1:2,000; rabbit polyclonal, ab193485;
Abcam, Cambridge, MA, USA), Cyp7a1 (1:1,000; rabbit polyclonal,
sc-25536; Santa Cruz Biotechnology, Inc., Dallas, TX, USA), and
β-actin (1:1,000; mouse monoclonal, sc-47778; Santa Cruz
Biotechnology, Inc.) overnight at 4°C. Membranes were washed three
times with TBST and were incubated with goat anti-rabbit
immunoglobulin G-horseradish peroxidase (1:1,000; cat. no. A0208)
or goat anti-mouse immunoglobulin G (1:1,000; cat. no. A0216; both
from Beyotime Institute of Biotechnology) for 2 h. The blots were
then washed three times with TBST at room temperature and were
developed on photographic film by an Omega Lum G Image Capture
software (version 81-12100-00; Gel company, Inc., San Francisco,
CA, USA) in a dark room using enhanced chemiluminescence solution
(cat. no. P0018A; Beyotime Institute of Biotechnology).
Statistical analysis
The independent experiments were repeated 3 times
and all results are presented as the means ± standard deviation.
Results were statistically analyzed using one-way analysis of
variance. Statistical analysis was conducted using SPSS 17.0 (SPSS,
Inc., Chicago, IL, USA) and the figures were produced using
GraphPad Prism 5 (GraphPad Software, Inc., La Jolla, CA, USA).
P<0.05 was considered to indicate a statistically significant
difference.
Results
Effects of metformin on FBG, HbA1c, liver
weight, liver index, serum insulin levels and insulin sensitivity
index in rats with T2DM
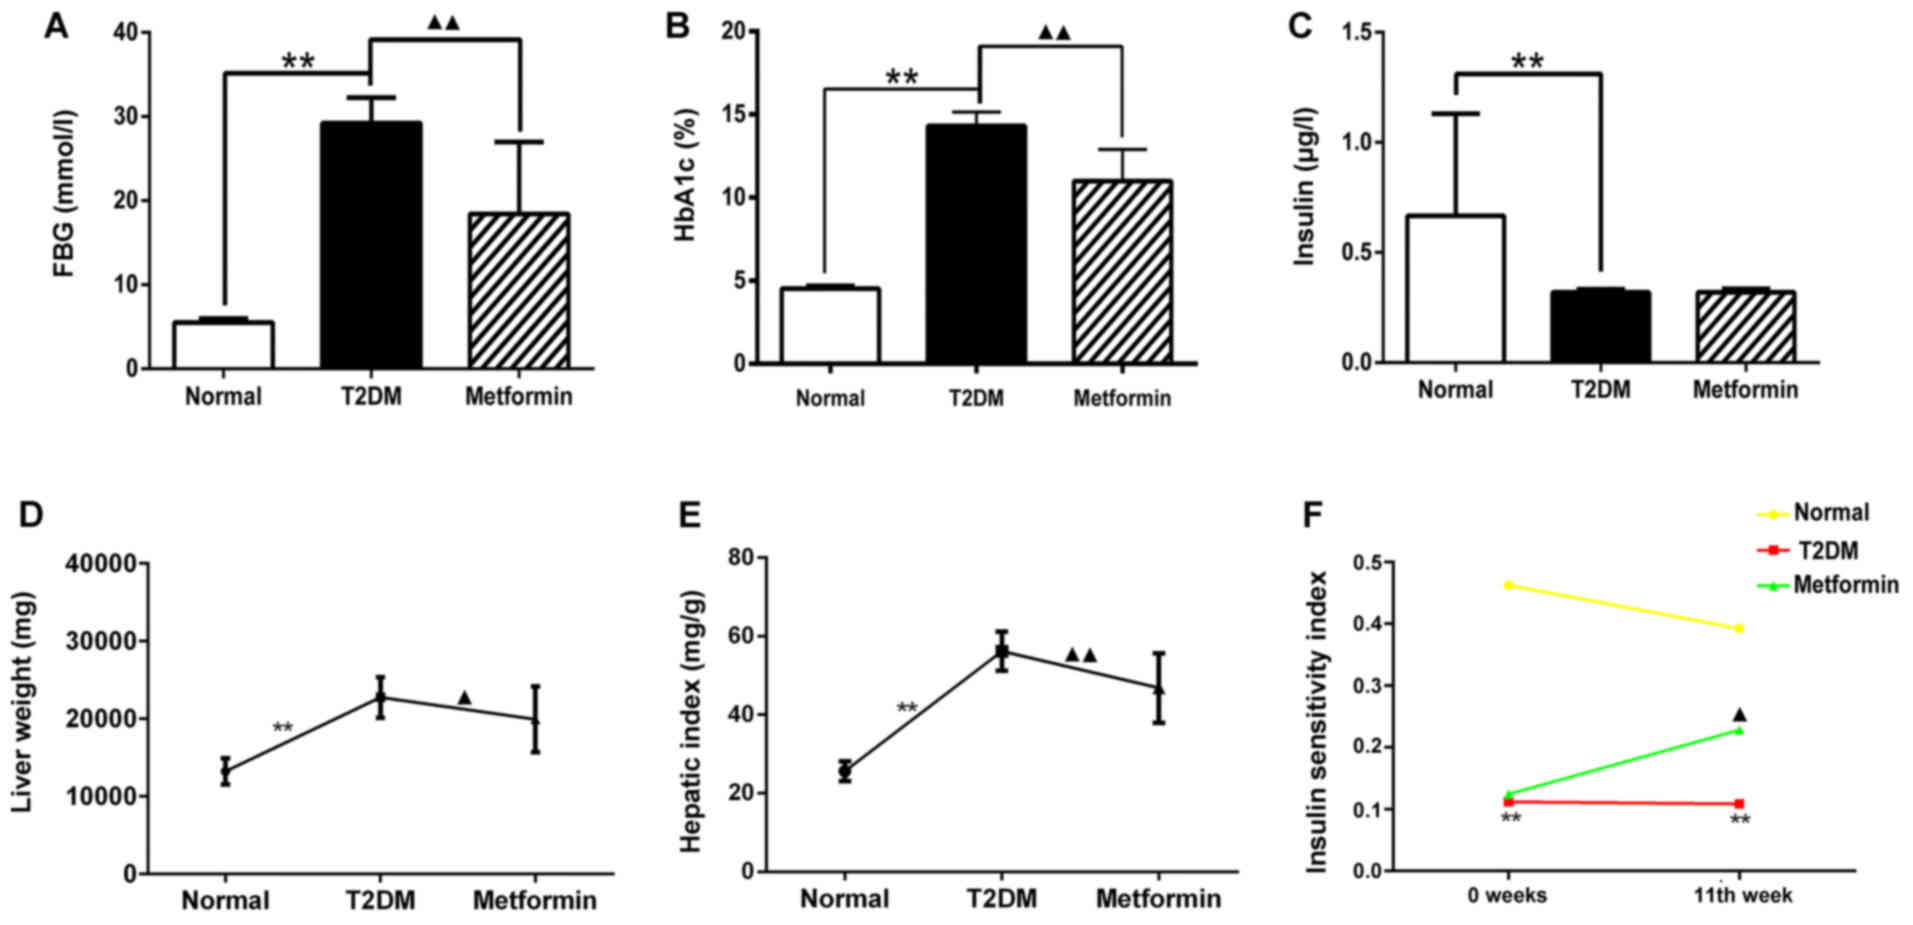
The levels of FBG, HbA1C and insulin were measured
from sera collected by puncturing the retro-orbital plexus at week
11. The results demonstrated that the T2DM group had high levels of
FBG and HbA1C, and low insulin levels compared with in the normal
group (Fig. 1A–C; P<0.01).
Following treatment with metformin, FBG and HbA1C levels were
markedly decreased compared with in the T2DM group (P<0.01);
however, the insulin levels exhibited no difference between the
T2DM and metformin groups (P>0.05). These results indicated that
metformin had no effect on serum insulin secretion in T2DM rats
under the present experimental conditions. Liver weight and hepatic
index were also measured; the results suggested that metformin
exerted a protective effect on the liver (Fig. 1D and 1E). In addition, the euglycemic agent
metformin had no effect on serum insulin secretion; however, it did
improve the insulin sensitivity index, thus suggesting that
metformin may enhance insulin sensitivity in the liver (Fig. 1F). These findings also indicated
that the T2DM model generated in the present study met the
experimental requirements.
Effects of metformin on metabolic and
biochemical parameters in rats with T2DM
Rats in the T2DM group exhibited a significant
increase in food intake compared with in the normal group
(P<0.05). In addition, body weight was increased in the normal
group (P<0.01), but was decreased in the T2DM group, in spite of
the increase in food intake. These results were consistent with the
pathological features of the rats in the T2DM group. Metformin did
not significantly improve food intake and body weight compared with
in the T2DM group (P>0.05; Table
I). Water intake and urine weight were significantly increased
in the T2DM rats compared with in the normal rats throughout the
treatment period (Table II).
Conversely, metformin significantly reduced water intake and urine
weight from week 7 (P<0.05) and week 5 (P<0.05),
respectively. These findings suggested that low water intake may
result in reduced urine weight.
 | Table IComparison of average food intake and
body weight among the treatment groups. |
Table I
Comparison of average food intake and
body weight among the treatment groups.
| Group | 0 week | 1 week | 3 week | 5 week | 7 week | 9 week | 11 week |
|---|
| Food intake | | | | | | | |
| Con | 23.62±3.17 | 18.28±6.06a | 25.10±4.51 | 23.72±5.29a | 24.88±3.11a | 19.97±3.05a | 20.37±3.43b |
| T2DM | 28.20±6.32 | 28.55±4.76 | 29.82±5.23 | 33.32±4.97 | 34.40±6.90 | 31.98±5.38 | 30.32±3.78 |
| Metformin | 30.17±8.77 | 27.65±5.96 | 31.53±4.16 | 30.53±5.13 | 28.08±7.62 | 38.50±11.16 | 27.43±8.26 |
| Body weight | | | | | | | |
| Con | 435.83±29.78 | 440.17±37.68 | 465.50±26.93 | 480.34±38.01 | 479.00±28.81 | 524.67±29.56 |
532.75±31.08a |
| T2DM | 456.00±26.55 | 438.17±28.90 | 447.67±27.92 | 457.17±42.54 | 451.17±41.06 | 469.17±43.59 | 411.50±34.06 |
| Metformin | 465.33±62.18 | 416.00±28.24 | 414.00±47.39 | 437.17±42.94 | 447.83±47.09 | 456.83±48.81 | 430.83±43.60 |
| Table IIComparison of average water intake
and urine weight among the treatment groups. |
Table II
Comparison of average water intake
and urine weight among the treatment groups.
| Group | 0 week | 1 week | 3 week | 5 week | 7 week | 9 week | 11 week |
|---|
| Water intake | | | | | | | |
| Con | 51.13±9.64a | 71.83±17.42a | 49.25±11.19a | 52.52±15.41a | 53.48±12.55a | 49.02±19.00a | 49.55±20.36a |
| T2DM | 113.10±41.39 | 116.98±13.24 | 131.45±29.69 | 149.70±33.89 | 137.13±24.52 | 130.25±28.07 | 157.53±17.59 |
| Metformin | 128.26±11.66 | 109.70±27.49 | 123.98±23.09 | 127.67±15.96 |
103.55±16.88b | 91.72±31.10b | 87.95±37.33a |
| Urine weight | | | | | | | |
| Con | 29.70±9.45a | 41.43±18.06a | 35.75±10.40a | 32.02±13.22a | 31.18±12.37a | 39.03±16.13a | 36.72±16.88a |
| T2DM | 85.38±27.93 | 96.25±20.83 | 99.13±28.57 | 129.87±27.76 | 115.42±16.46 | 119.87±20.27 | 134.50±17.75 |
| Metformin | 94.35±26.77 | 72.10±27.99b | 86.63±22.75 |
101.98±19.67b | 68.10±29.52a | 65.18±29.54a | 65.18±29.94a |
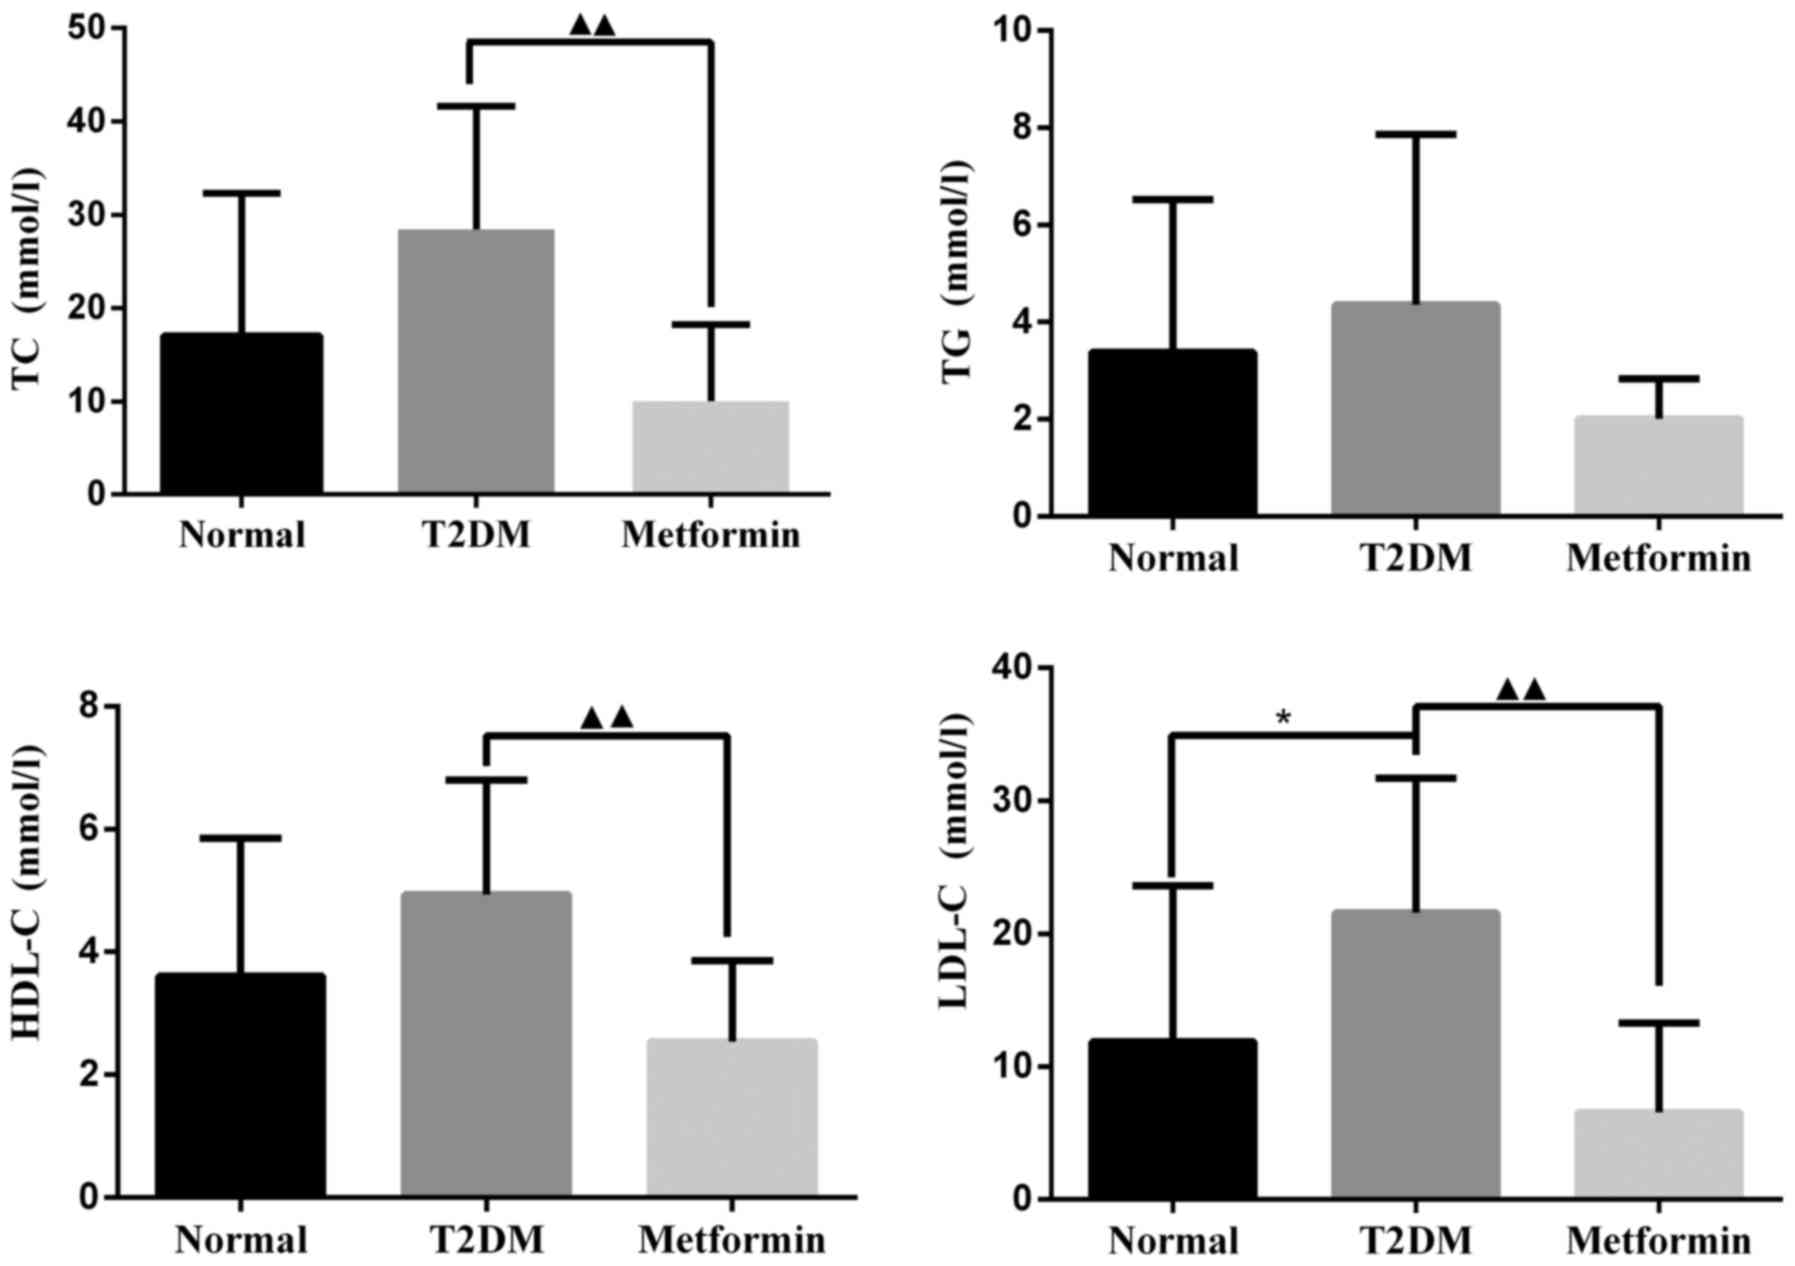
As shown in Fig.
2, TC, TG and HDL-C were markedly increased in the T2DM group;
however, there was no significant difference when compared with the
control group. LDL-C levels were significantly increased in the
T2DM group compared with in the control group (P<0.05). After 11
weeks of treatment with metformin, TC, HDL-C and LDL-C levels were
significantly decreased compared with in the T2DM group
(P<0.01). There was no significant difference in TG levels
between the metformin and T2DM groups (P=0.064); however, metformin
did slightly reduce TG levels under the present experimental
conditions.
Gene expression profiles in liver tissues
from metformin-treated T2DM rats
Microarray experiments were performed three times in
each experimental group to obtain accurate results. DEGs associated
with the onset of T2DM in the livers of metformin-treated rats were
determined. Analysis of the microarray data demonstrated that
metformin had a significant effect on gene expression in hepatic
tissues. The expression levels of 1,021 genes were altered
>1.5-fold; 592 genes were upregulated and 429 genes were
downregulated in T2DM rats compared with the normal group.
Metformin administration significantly altered the expression of
431 genes >1.5-fold; 238 genes were upregulated and 193 genes
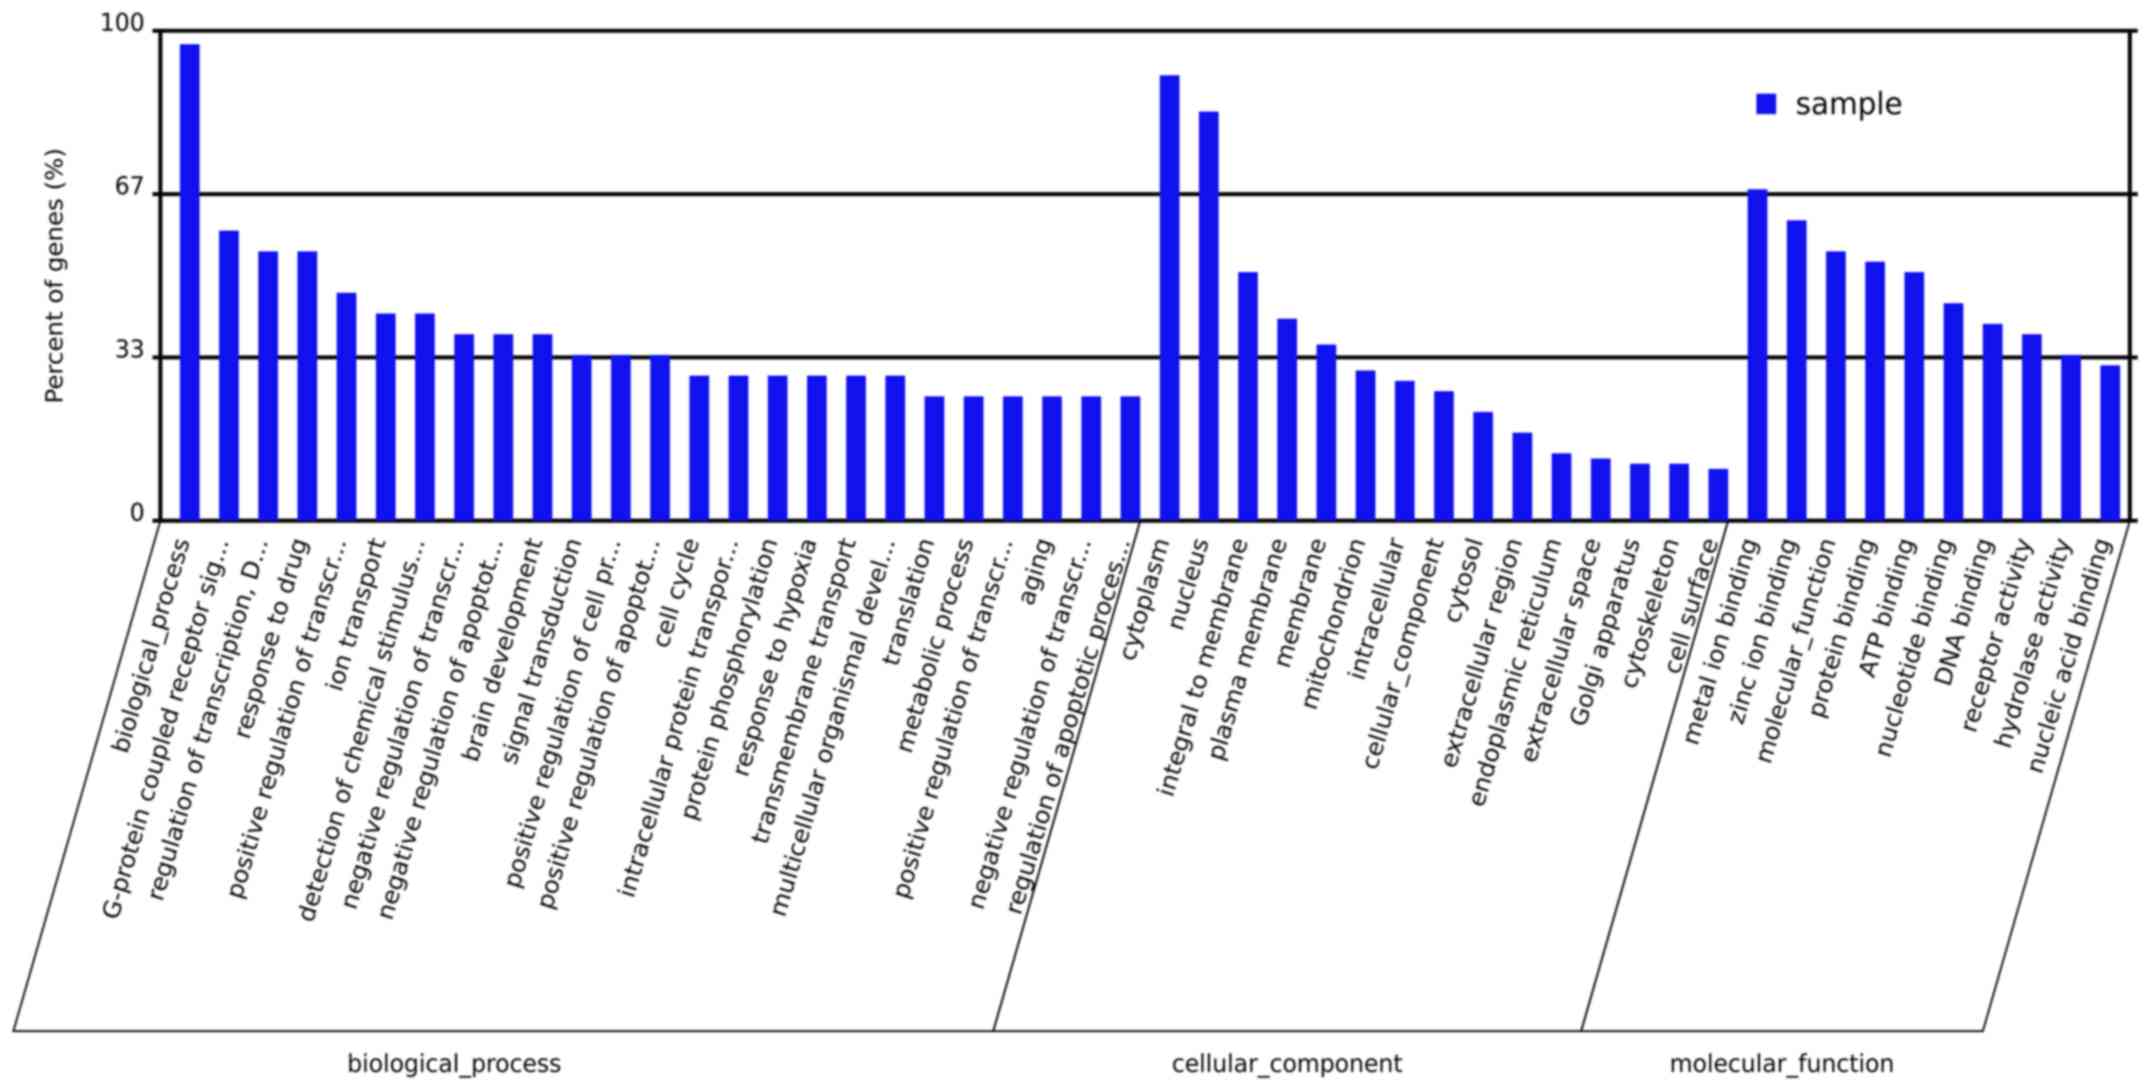
were downregulated. Evaluation of these genes demonstrated that
metformin treatment had a considerable impact on various biological
processes, molecular functions and cellular components in the
liver. The primary biological processes affected by metformin
treatment included the G-protein coupled receptor signal pathway,
regulation of transcription, ion transport, response to drugs and
signal transduction (Fig. 3). The
molecular function ontologies most affected included metal ion
binding, molecular function, protein binding, ATP binding and
nucleotide binding receptor activity. The cellular components
associated with metformin treatment were cytoplasm, nucleus,
membrane, mitochondrion, intracellular part and cytosol. A total of
19 pathways were revealed to be significantly altered by metformin
(P<0.05; Table III). The
genes that exhibited altered expression upon metformin treatment
were categorized according to pathway analysis, the associated
pathways included protein processing in endoplasmic reticulum,
metabolic pathways, endocytosis, ABC transporters, GnRH signaling
pathway, WNT signaling pathway, fat digestion and absorption,
metabolism of xenobiotics by cytochrome P450, and starch and
sucrose metabolism.
| Table IIIPathways associated with the gene
expression profiles of metformin-treated rat livers, as determined
by KEGG analysis. |
Table III
Pathways associated with the gene
expression profiles of metformin-treated rat livers, as determined
by KEGG analysis.
| No. | Pathway ID | KEGG pathway | P-value |
|---|
| 1 | ko04370 | VEGF signaling
pathway | <0.001 |
| 2 | ko04141 | Protein processing
in endoplasmic reticulum | <0.001 |
| 3 | ko04144 | Endocytosis | <0.001 |
| 4 | ko01100 | Metabolic
pathways | <0.001 |
| 5 | ko02010 | ABC
transporters | <0.01 |
| 6 | ko04912 | GnRH signaling
pathway | <0.01 |
| 7 | ko04310 | Wnt signaling
pathway | <0.01 |
| 8 | ko04650 | Natural killer
cell-mediated cytotoxicity | <0.01 |
| 9 | ko04010 | MAPK signaling
pathway | <0.01 |
| 10 | ko04975 | Fat digestion and
absorption | <0.05 |
| 11 | ko03040 | Spliceosome | <0.05 |
| 12 | ko04330 | Notch signaling
pathway | <0.05 |
| 13 | ko00980 | Metabolism of
xenobiotics by cytochrome P450 | <0.05 |
| 14 | ko03022 | Basal transcription
factors | <0.05 |
| 15 | ko00982 | Drug metabolism -
cytochrome P450 | <0.05 |
| 16 | ko04070 |
Phosphatidylinositol signaling system | <0.05 |
| 17 | ko00190 | Oxidative
phosphorylation | <0.05 |
| 18 | ko00500 | Starch and sucrose
metabolism | <0.05 |
| 19 | ko03010 | Ribosome | <0.05 |
Protein expression profiles in liver
tissues from metformin-treated rats with T2DM
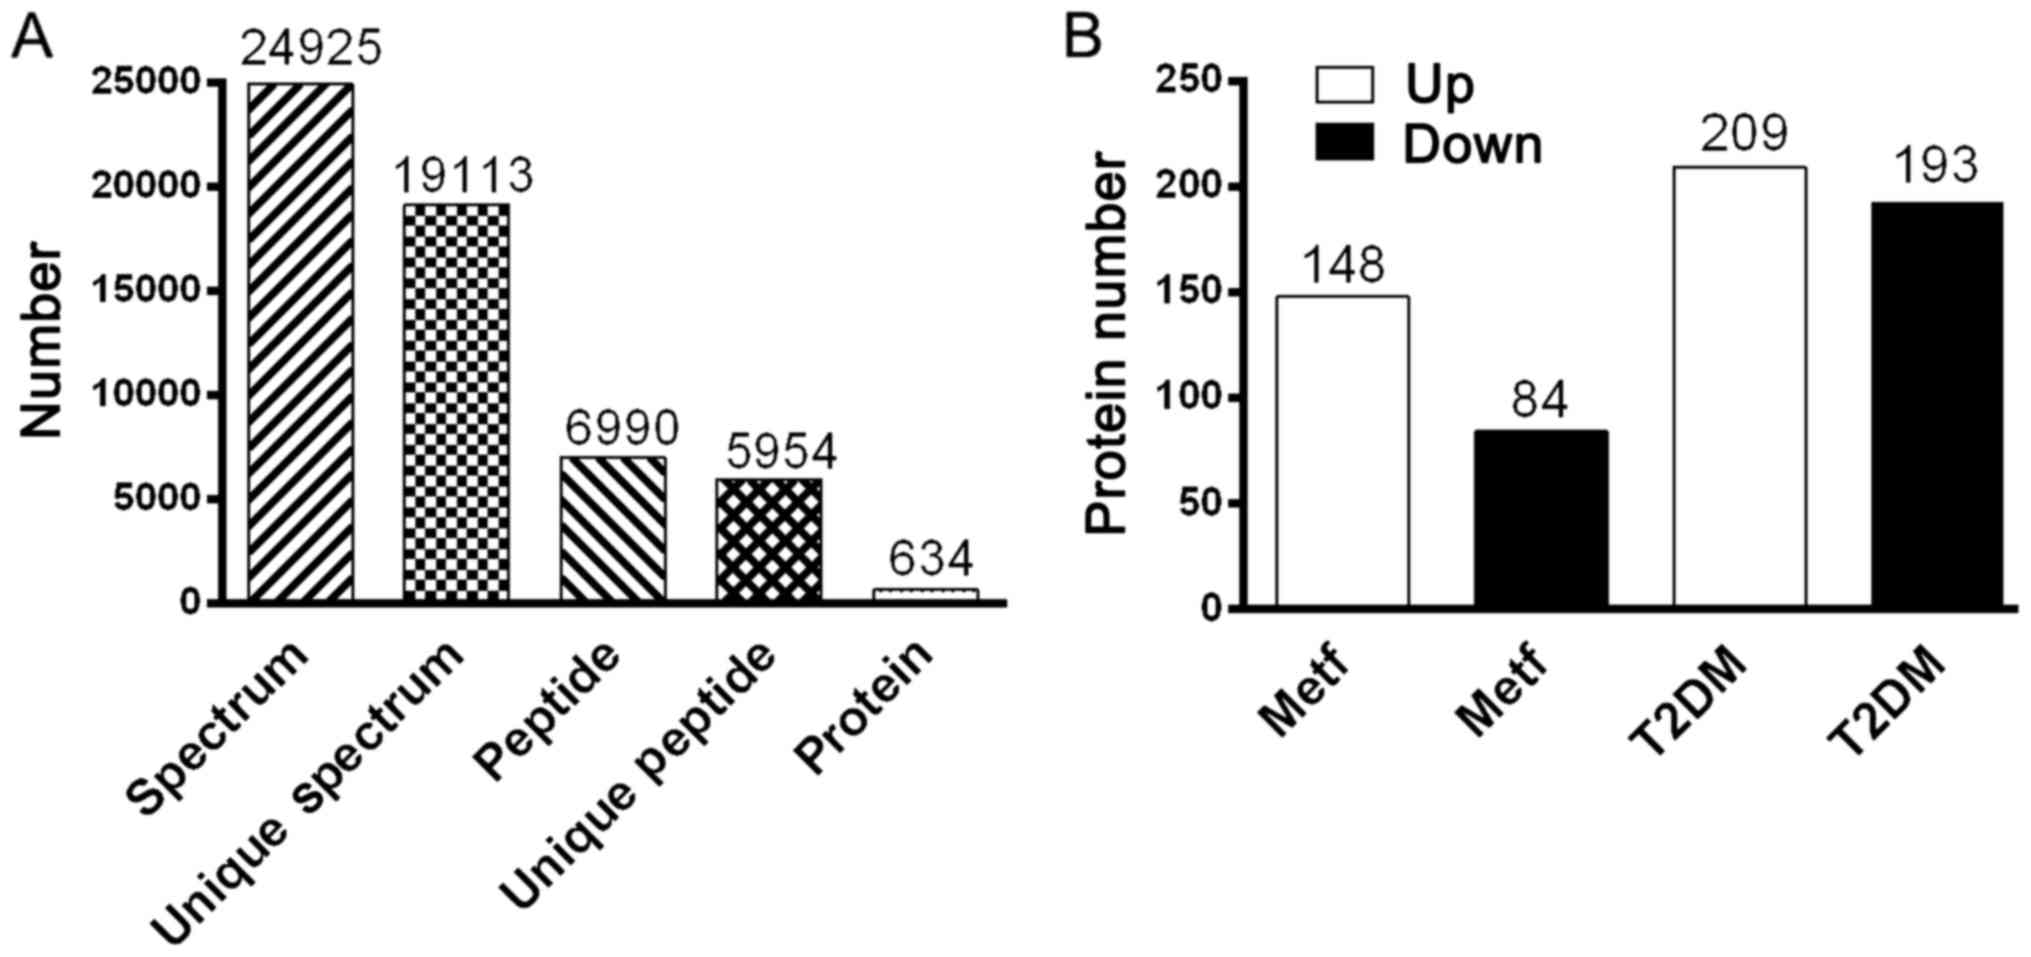
All MS/MS spectra were processed using Mascot
software 2.3.02. As shown in Fig.
4A, iTRAQ analysis of the IPI_rat V 3.87 proteome detected
5,954 unique peptides in the database (39,925 sequences), resulting
in 634 differential protein (>1.2-fold) hits in Mascot. As shown
in Fig. 4B, 232 differential
proteins were identified between the metformin and normal groups,
of which 148 proteins were upregulated and 84 proteins were
downregulated. Furthermore, 402 differential proteins were
identified between the metformin and T2DM groups, of which 209
proteins were upregulated and 193 proteins were downregulated. As
presented in Table IV, 64
upregulated proteins and 31 downregulated proteins were identified
when comparing both the metformin and normal groups, and the
metformin and T2DM groups. Of the upregulated proteins in the
metformin group, 3/148 were involved in translation, 1/148 was
involved in transcription, 4/148 were signal transduction proteins,
12/148 were secondary metabolite biosynthesis proteins, 16/148 were
post-translational modification proteins, 1/148 was a nucleotide
transport and metabolism protein, 10/148 were lipid transport and
metabolism proteins, 1/148 was a secretion and vesicular transport
protein, 13/148 were general function proteins, 2/148 were
inorganic ion transport and metabolism proteins, 8/148 were energy
production and conversion proteins, 3/148 were cytoskeleton
proteins, 5/148 were carbohydrate transport and metabolism
proteins, 11/148 were amino acid transport and metabolism proteins,
1/148 was a membrane protein, and others were listed as unknown
proteins. Of the downregulated proteins in the metformin group,
4/84 were translation proteins, 1/84 was a signal transduction
protein, 5/84 were secondary metabolite biosynthesis proteins, 4/84
were post-translational modification proteins, 4/84 were nucleotide
transport and metabolism proteins, 8/84 were lipid transport and
metabolism proteins, 2/84 were secretion and vesicular transport
proteins, 6/84 were general function proteins, 4/84 were energy
production and conversion proteins, 1/84 was a defense protein,
1/84 was a cytoskeleton protein, 2/84 were coenzyme transport and
metabolism proteins, 1/84 was a membrane protein, 1/84 was a cell
division protein, 5/84 were carbohydrate transport and metabolism
proteins, 7/84 were amino acid transport and metabolism proteins,
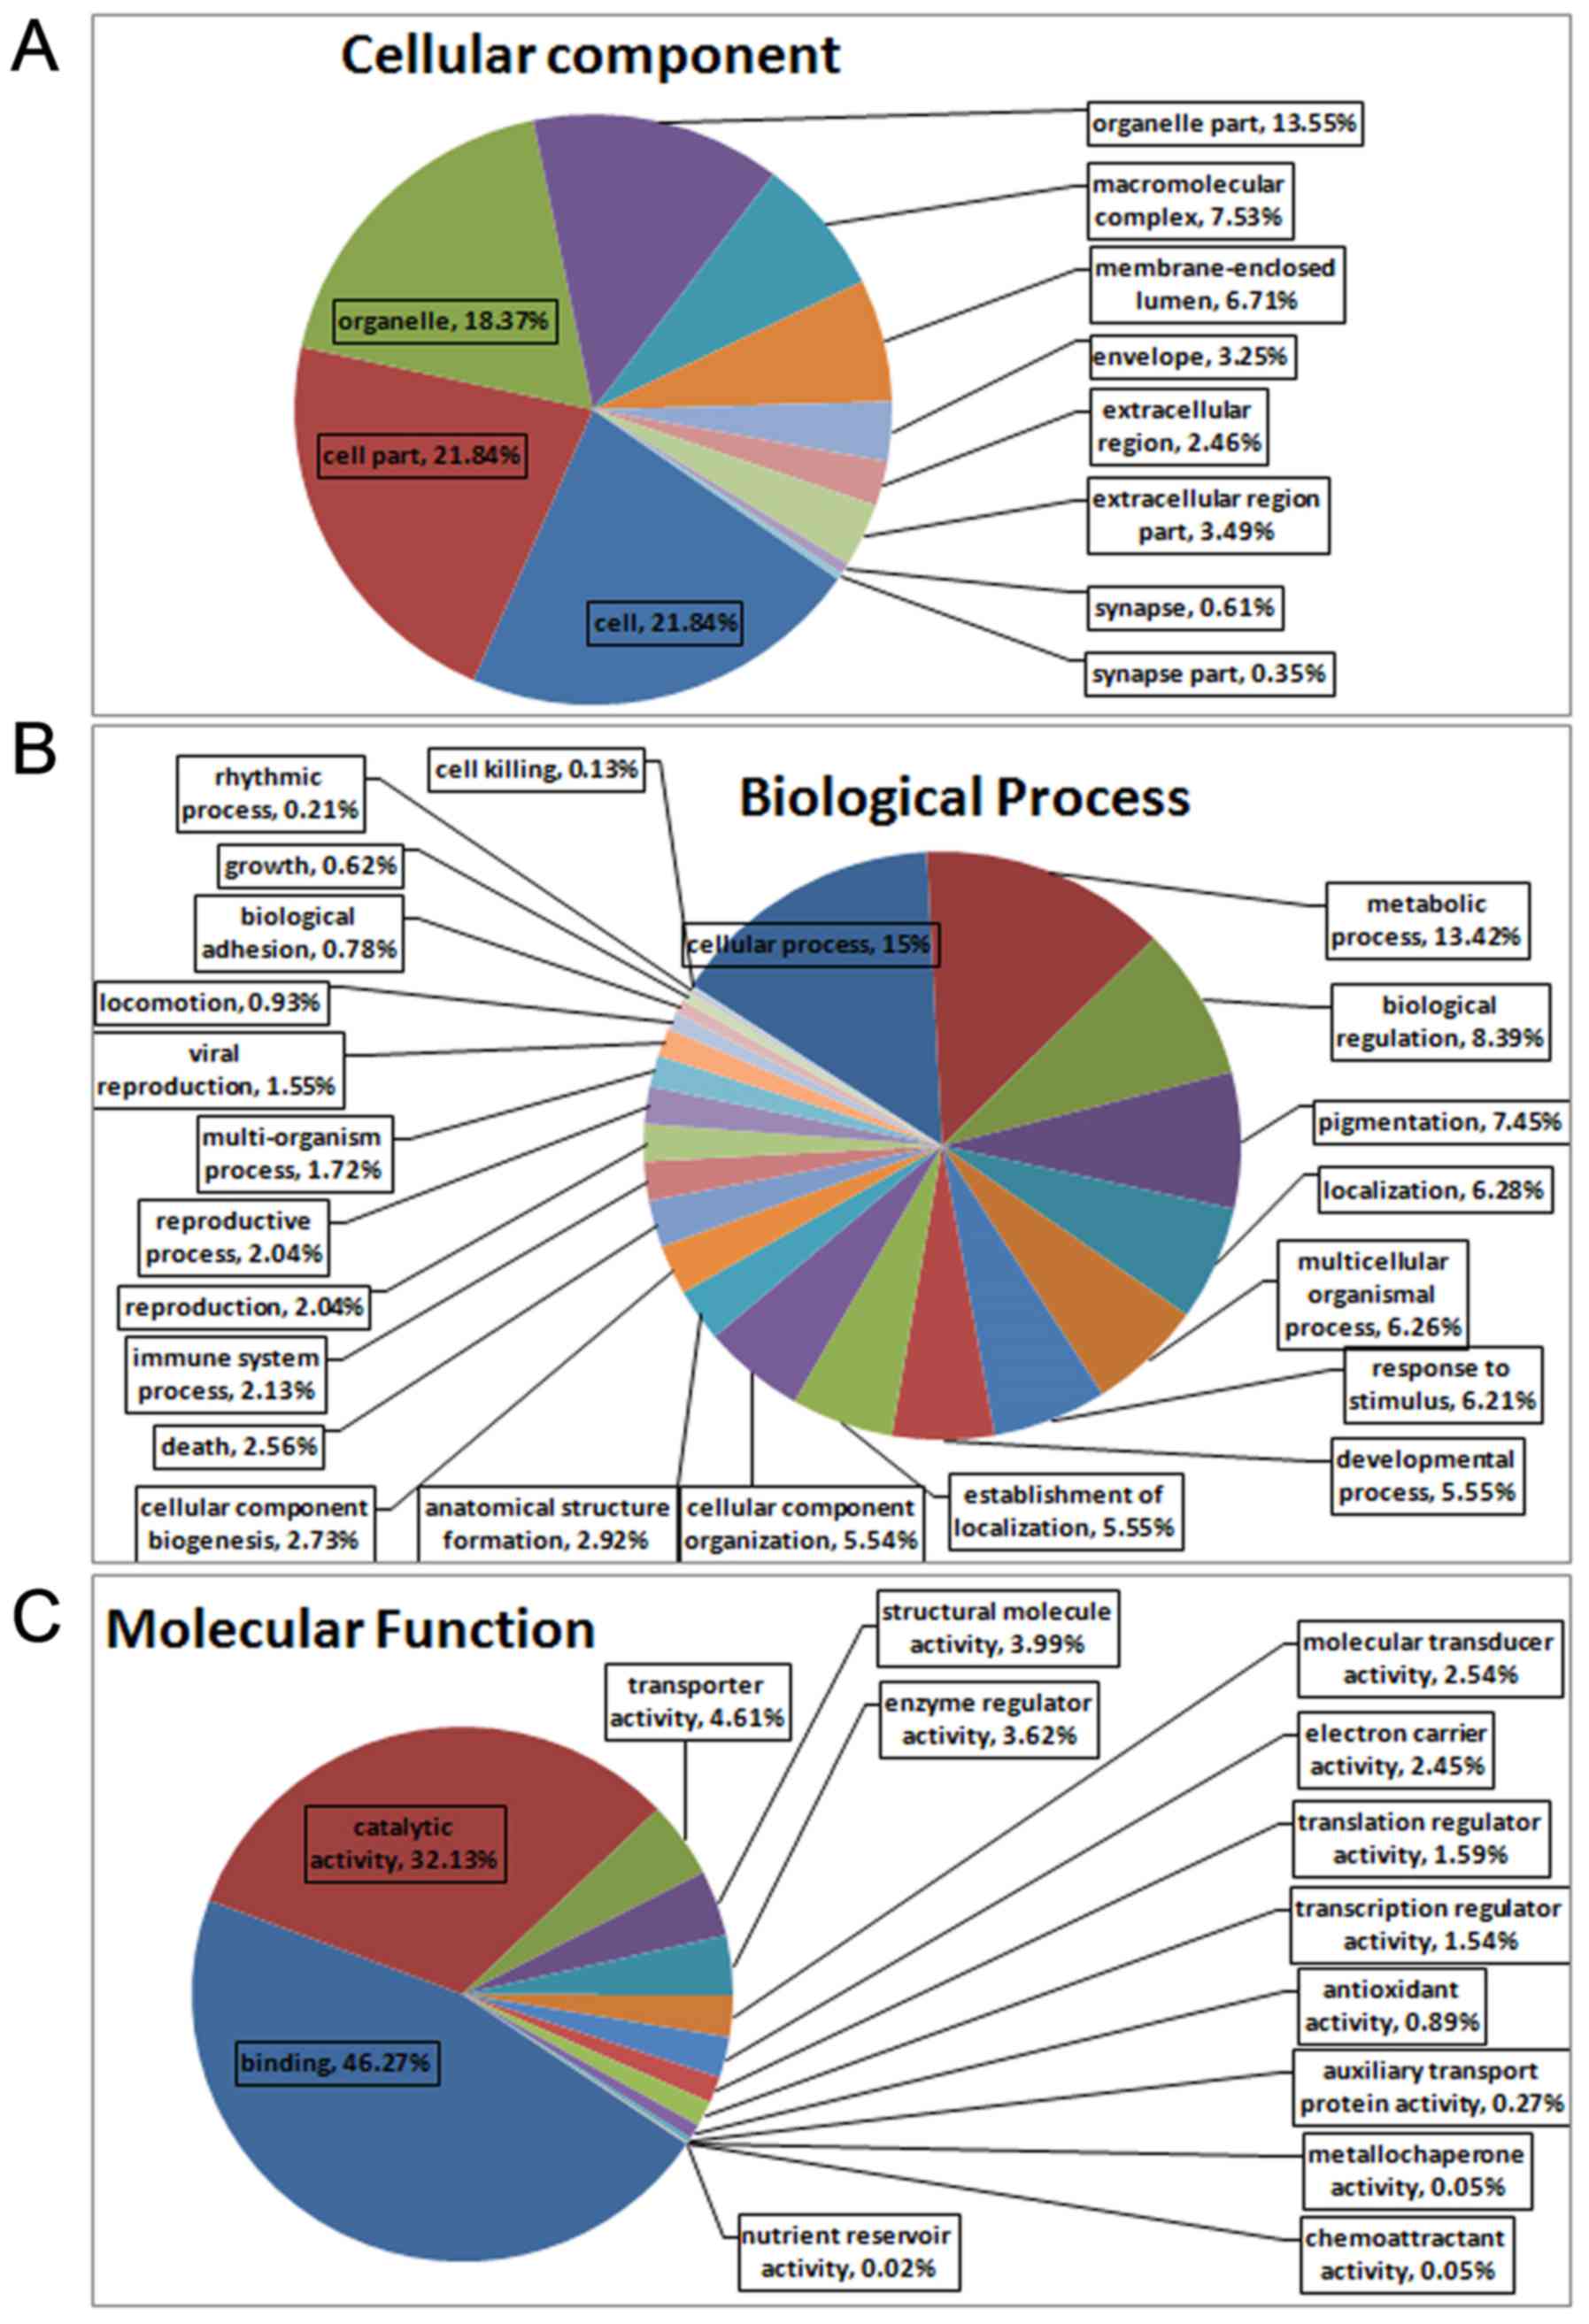
and others were listed as unknown proteins. The associated cellular
components, as determined by Gene Ontology (GO) analysis of the
proteins, were cell (21.84%), cell part (21.84%), organelle
(18.37%) and organelle part (13.55%) (Fig. 5A). The proteins could also be
categorized into numerous biological processes, including cellular
process (15%), metabolic process (13.42%) and biological regulation
(8.39%) (Fig. 5B). The major
molecular functions of the proteins, as obtained by GO analysis,
were binding (46.27%) and catalytic activity (32.13%) (Fig. 5C). The results of KEGG analysis
indicated that 10 pathways were significantly affected by
metformin, with a cut-off value of P<0.05. The pathway analysis
was used to categorize proteins with altered expression upon
metformin treatment; significant pathways included retinol
metabolism, steroid hormone biosynthesis, drug metabolism, bile
secretion, linoleic acid metabolism, arachidonic acid metabolism,
metabolism of xenobiotics by cytochrome P450 and PPAR signaling
pathway (Table V).
| Table IVUpregulated and downregulated
proteins identified when comparing both the metformin and normal
groups, and the metformin and T2DM groups. |
Table IV
Upregulated and downregulated
proteins identified when comparing both the metformin and normal
groups, and the metformin and T2DM groups.
| Upregulated
proteins | Downregulated
proteins |
|---|
| CERU, CP3A1, CP3AI,
IGG2A, HPRT, REEP6, ANXA3, GCST, LDHD, PDK2, CP7A1, SNTB2, KNT1,
PSD12, HACD3, K0664, H17B6, CAH5A, APOC1, ACSF2, THIKB, SRSF2,
ACTN1, PLCB, HSPB1, BIEA, ADH4, S22AI, MGLL, ADH6, MET7B, KCRB,
VNN1, CP3A9, FABP4, EST1, CP2C7, MYH10, APOB, LEG3, HXK3, XPP2,
S27A2, CRP, LASP1, CX6B1, EST1C, KPYM, MOSC2, PSB10, CP4V2, HPPD,
UD2B4, GMFB, TOM22, FLOT1, CLUS, CP255, CO1A1, PP2AA, HRG, IIGP1,
HVM57, EST5 | DCPS, GLGB, PPM1A,
FAS, AAAD, CP4F6, DHCR7, FPPS, DHB13, DYR, TYPH, TRAM1, MCEE,
GRHPR, NMRL1, KAD4, UD16, AT2L1, CISD1, NDUA7, TXTP, ADO, HBB1,
ACBP, UK114, SYCC, CSAD, ASGR2, NTF2, GSH1, NDUAA |
| Table VPathways associated with the
differential proteins in metformin-treated rat livers, as
determined by KEGG analysis. |
Table V
Pathways associated with the
differential proteins in metformin-treated rat livers, as
determined by KEGG analysis.
| No. | Pathway ID | KEGG pathway | P-value |
|---|
| 1 | ko00830 | Retinol
metabolism | <0.00001 |
| 2 | ko00140 | Steroid hormone
biosynthesis | <0.00001 |
| 3 | ko00983 | Drug
metabolism-other enzymes | <0.00001 |
| 4 | ko04976 | Bile secretion | <0.00001 |
| 5 | ko01100 | Metabolic
pathways | <0.0001 |
| 6 | ko00980 | Linoleic acid
metabolism | <0.001 |
| 7 | ko00982 | Arachidonic acid
metabolism | <0.001 |
| 8 | ko00590 | Drug
metabolism-cytochrome P450 | <0.001 |
| 9 | ko00591 | Metabolism of
xenobiotics by cytochrome P450 | <0.001 |
| 10 | ko03320 | PPAR signaling
pathway | <0.001 |
Potential therapeutic target genes,
screened for with micro-array and iTRAQ analysis
A 1.2-fold change in protein expression and 1.5-fold
alteration in gene expression served as benchmarks for significant
physiological changes; 18 genes were reported to exhibit the same
trend in microarray and iTRAQ analyses in the T2DM group, with a
cut-off value of P<0.05. Among these genes, 12 genes were
upregulated and 6 genes were downregulated (Table VI). Further analysis demonstrated
that 7 genes exhibited the same trend in micro-array and iTRAQ
analyses in the metformin group, as shown in Table VII. Among these genes,
ethanolamine-phosphate phospholyase (LOC687071) was downregulated,
whereas Cyp7a1, Ces1C, solute carrier family 27 member 2 (Slc27a2),
ceruloplasmin (Cp), pyruvate kinase M (PKM) and clustered
mitochondria homolog (Cluh) were upregulated. As shown in Tables VI and VII, Ces1C and Cyp7a1 were
differentially altered in both the T2DM and metformin groups,
indicating that these two genes/proteins were altered in T2DM and
metformin groups. Therefore, it may be hypothesized that Cyp7a1 and
Ces1C serve important roles in diabetes and may be primary
candidate targets for metformin. Furthermore, Slc27a2, Cp, PKM,
Cluh and LOC687071 may be worthy of further study under certain
conditions. The log2 (DM/NOR) value for Ces1C in the
microarray analysis was −0.58, thus indicating that Ces1C
expression was increased in the normal group compared with in the
T2DM group. The log2 (DM/MET) value for Ces1C in the
microarray analysis was −0.63, thus suggesting that Ces1C
expression was increased in the metformin group compared with in
the T2DM group. These findings indicated that Ces1C expression was
increased in the metformin group. The iTRAQ analysis demonstrated
that Ces1C protein levels were highest in the normal group and
lowest in the T2DM group. With regards to the Cyp7a1 gene, the
results of microarray and iTRAQ analyses were similar; the
expression was highest in the normal group and lowest in the T2DM
group among the three groups.
| Table VImRNA and protein expression levels in
DM model rats. |
Table VI
mRNA and protein expression levels in
DM model rats.
| Gene symbol | Transcriptomics
| Proteomics
|
|---|
| log2
(DM/NOR) | Up or down | DM/NOR | Up or down |
|---|
| Ces1C | −0.58 | Down | 0.496 | Down |
| Fgb | −0.59 | Down | 0.821 | Down |
| Cyp7a1 | −1.52 | Down | 0.361 | Down |
| Tfrc | −2.33 | Down | 0.637 | Down |
| Banf1 | −0.64 | Down | 0.644 | Down |
| Psmd6 | −1.63 | Down | 0.672 | Down |
| Gsta2 | 0.41 | Up | 1.289 | Up |
| Tst | 0.49 | Up | 1.256 | Up |
| Rpl10 | 0.85 | Up | 1.884 | Up |
| Ugt1a6 | 0.34 | Up | 1.241 | Up |
| Rars | 1.86 | Up | 1.222 | Up |
| Fam120a | 1.24 | Up | 1.266 | Up |
| Actr1a | 0.70 | Up | 1.219 | Up |
| Tram1 | 0.76 | Up | 1.529 | Up |
| Rpl23a | 0.39 | Up | 1.455 | Up |
| Rps27l | 0.54 | Up | 1.465 | Up |
| LOC687071 | 2.88 | Up | 1.735 | Up |
| Hdhd3 | 1.71 | Up | 1.265 | Up |
| Table VIImRNA and protein expression levels in
metformin-treated rats. |
Table VII
mRNA and protein expression levels in
metformin-treated rats.
| Gene symbol | Transcriptomics
| Proteomics
| Up or down |
|---|
|
Log2(DM/MET) |
Log2(DM/NOR) | DM/MET | DM/NOR |
|---|
| Cyp7a1 | −0.60 | −1.52 | 0.56 | 0.361 | Up |
| Ces1C | −0.63 | −0.58 | 0.636 | 0.496 | Up |
| Slc27a2 | −0.92 | −1.80 | 0.764 | 0.517 | Up |
| Cp | −1.06 | −1.15 | 0.788 | 0.648 | Up |
| PKM | −0.54 | −0.99 | 0.756 | 0.655 | Up |
| Cluh | −0.30 | −0.45 | 0.831 | 0.758 | Up |
| LOC687071 | 0.55 | 2.88 | 1.477 | 1.735 | Down |
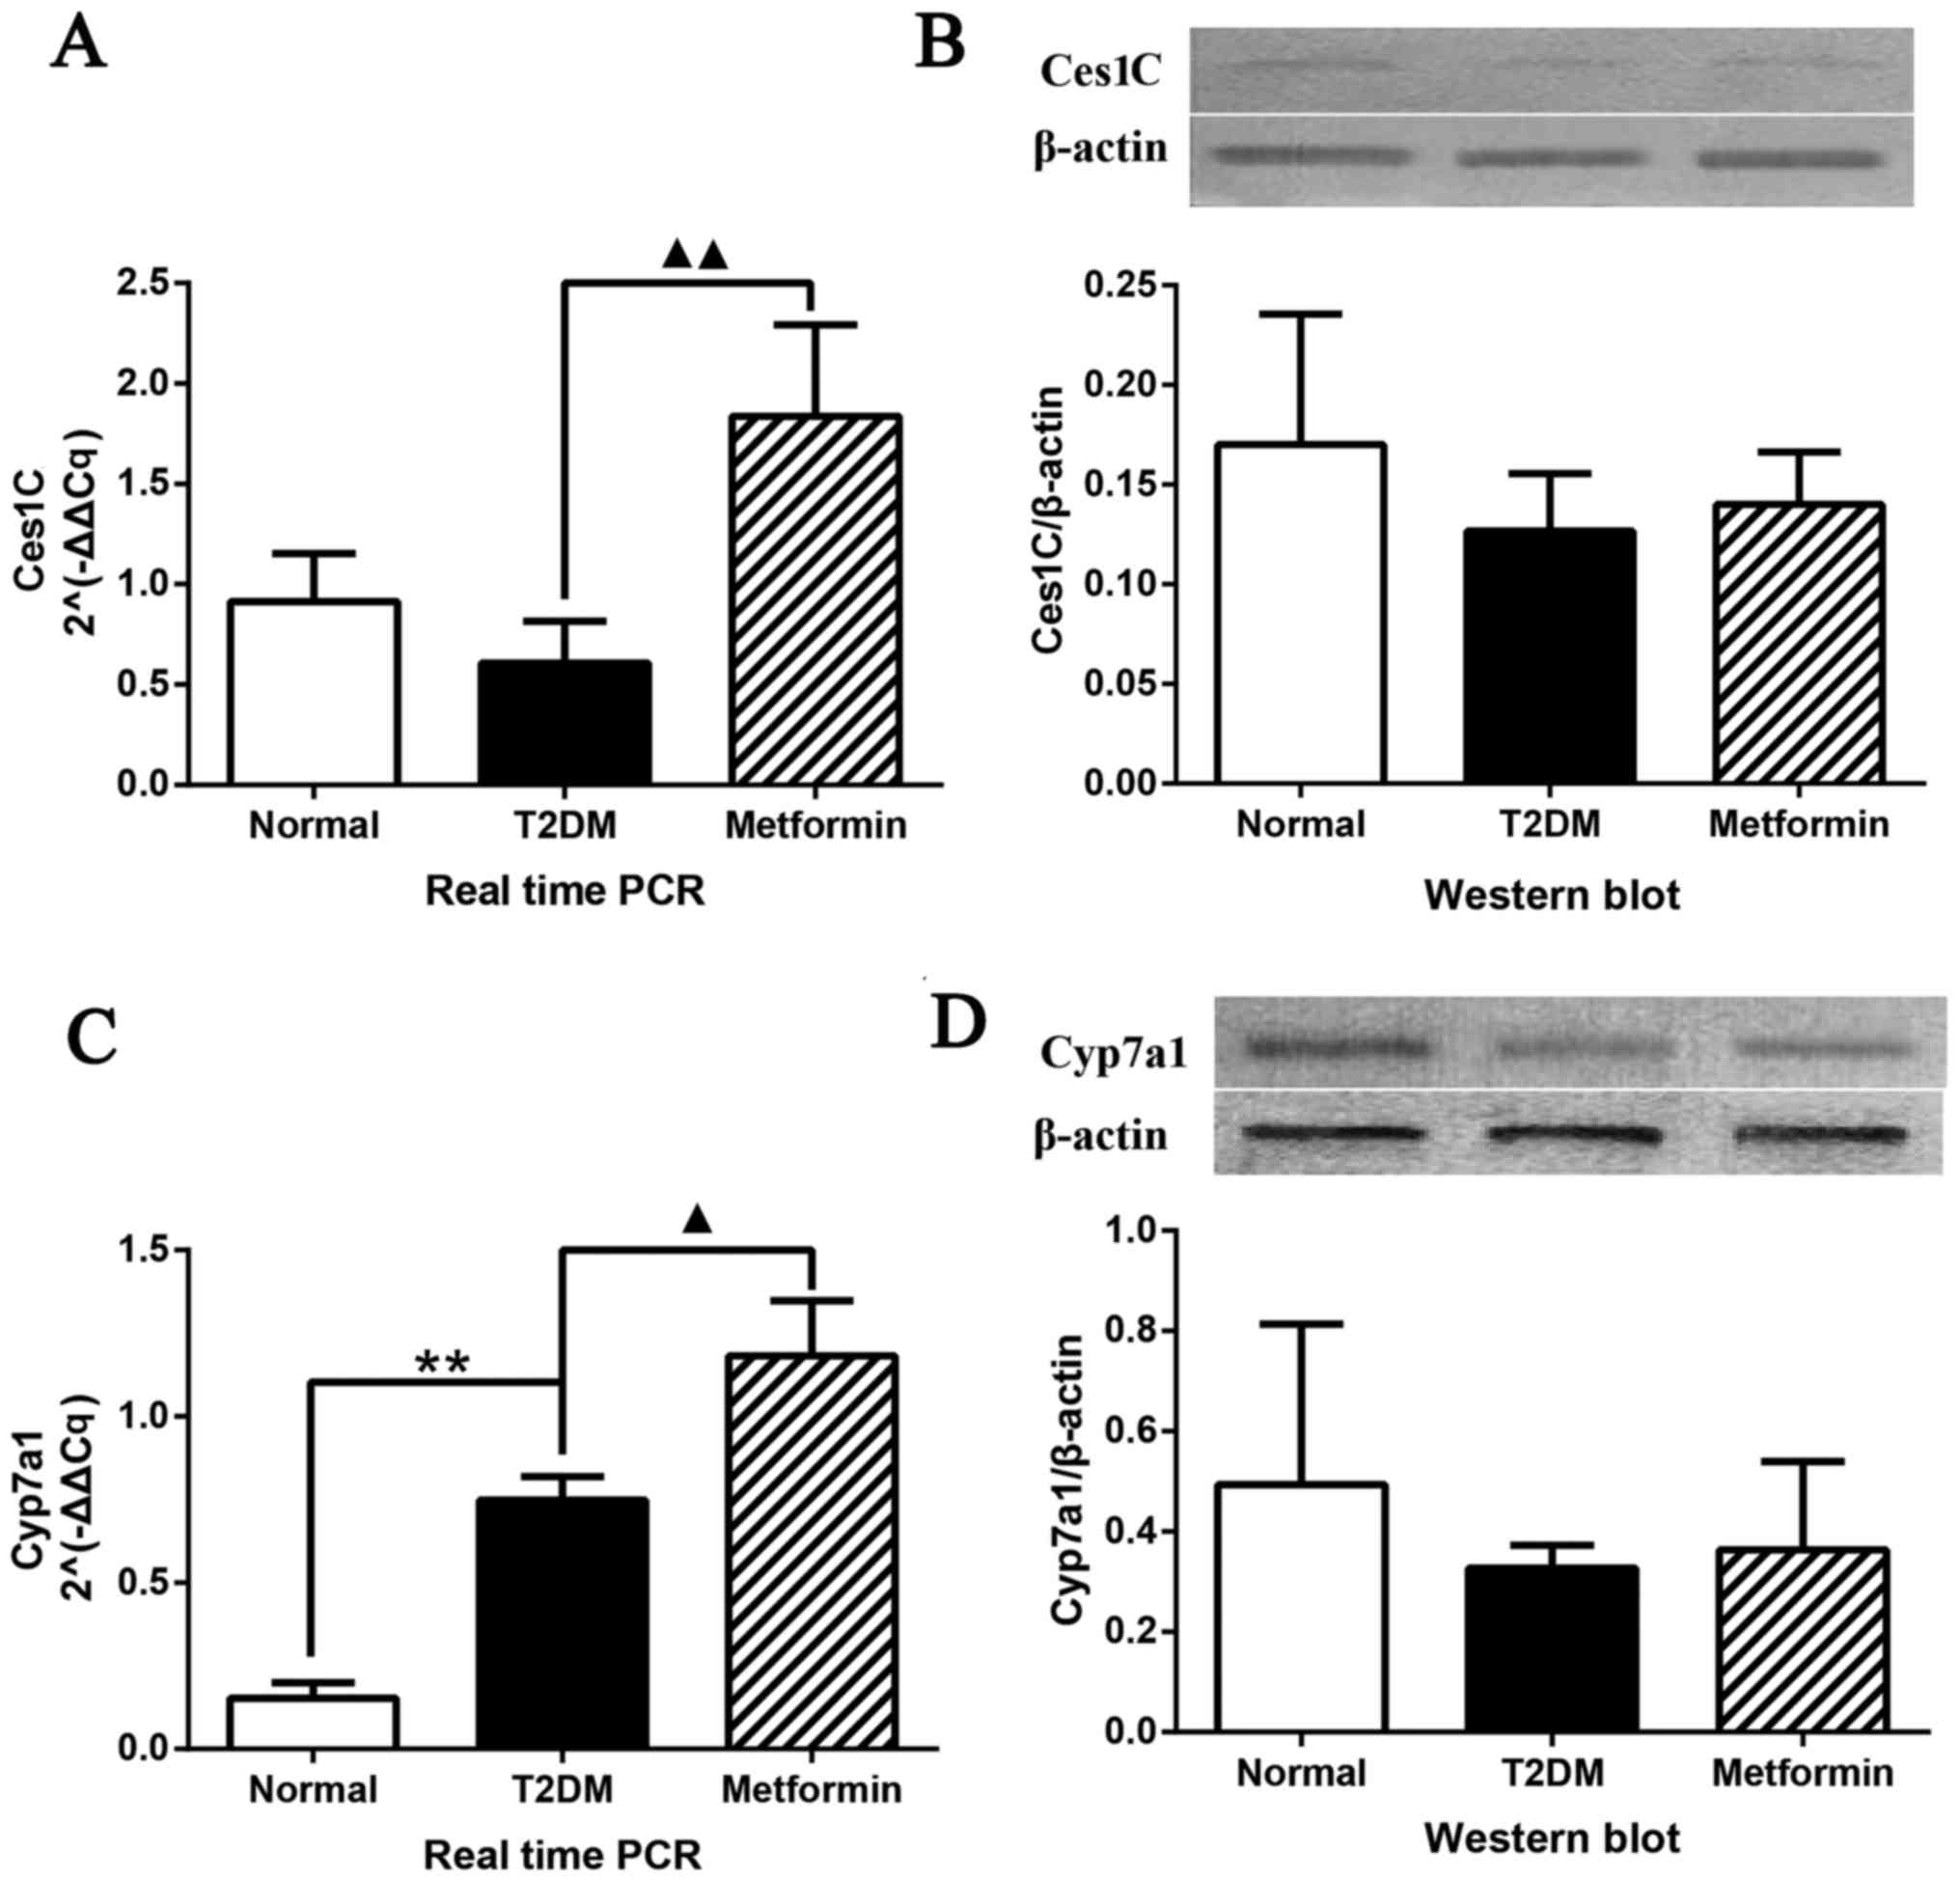
To determine the mRNA and protein expression levels,
qPCR and western blot analysis were performed on selected potential
therapeutic target genes, identified using microarray and iTRAQ
analyses (Fig. 6). The mRNA
expression levels of Ces1C were significantly altered (P<0.01);
Ces1C expression was increased in rat liver tissues obtained from
the metformin group; however, no difference was detected between
the normal and T2DM groups (Fig.
6A). The protein expression levels of Ces1C are presented in
Fig. 6B. Although no significant
differences were detected among the groups, a similar trend to
iTRAQ analysis was determined. qPCR and western blot analysis
confirmed the results of the microarray and iTRAQ analyses. The
expression levels of Cyp7a1 are shown in Fig. 6C and D. qPCR demonstrated that
Cyp7a1 expression was significantly increased in the T2DM group;
this finding was inconsistent with the findings of the microarray
analysis. However, metformin significantly increased Cyp7a1
expression, which was consistent with the findings of the
microarray analysis. Western blot analysis exhibited a similar
trend to the results of the iTRAQ analysis with regards to Cyp7a1
protein expression; the protein expression levels of Cyp7a1 were
highest in the normal group and lowest in the T2DM group; however,
these were findings were not significantly different.
Discussion
T2DM is a complex chronic metabolic disease, which
is associated with microvascular and macrovascular complications. A
great deal of research has focused on elucidating the
pathophysiology of T2DM over the past 50 years (20,21); however, the mechanisms underlying
T2DM remain poorly understood. It is, however, now well known that
insulin resistance or low insulin secretion is a major mechanism
(22). In general, normoglycemia
is maintained by the balance between insulin secretion and the
efficacy of insulin action. Blood glucose levels increase when this
balance is disrupted, which leads to structural destruction and
functional visceral disorder. Serious, long-term hyperglycemia can
be fatal; therefore, decreasing high blood glucose levels is
considered a direct and efficient therapeutic strategy (23).
The present study established a rat model of T2DM
using STZ, according to methods described by Reed et al
(24). STZ-induced T2DM is a
typical T2DM rat model, which ensured the veracity of the present
experiments. STZ is a DNA alkylation reagent, which selectivity
destructs pancreatic β cells, thus resulting in hyperglycemia. In
the present study, obvious weight losses were detected in the T2DM
group compared with in the metformin group in the first week, which
may be because of individual differences, fasting (hypoglycemia)
resistance difference and unadaptable under conditions of
hyperglycemia. In the present study, diabetic rats exhibited
polydipsia and polyuria, thus suggesting that increased water
intake results in increased urine output. The present data
demonstrated that metformin improved body weight and urine weight
but did not return it to normal levels. Numerous studies have
reported that increased HDL levels are an independent risk factor
for the development of cardiovascular disease, and decreases in LDL
can significantly reduce the risk of cardiovascular disease and
mortality in patients with T2DM (25,26). In the present study, HDL-C and
LDL-C were significantly downregulated in the metformin-treated
group, which indicated that metformin exerted protective effects
against cardiovascular disease in T2DM rats. HbA1c is an
approximation of an individual's average blood glucose levels for
the prior 2–3 months, and is currently considered the gold standard
for monitoring glycemic control. In the present study, rats were
treated with metformin for ~3 months, which was enough to reduce
HbA1c levels in a similar trend to FBG (27). The T2DM model was evaluated by
measuring FPG, HbA1c, plasma insulin, liver index and insulin
sensitivity index, the results of which confirmed that the T2DM
model had been successfully generated.
FPG and HbA1c were significantly reduced following
metformin treatment compared with in the T2DM group. Subsequently,
gene chip and iTRAQ analyses were performed to identify the
significant DEGs and proteins in order to screen the key genes in
the liver. Ces1C and Cyp7a1 were downregulated in T2DM rats and
were upregulated in metformin-treated rats at mRNA and protein
levels; therefore, they were regarded as potential therapeutic
target genes associated with metformin intervention in the liver
tissues of rats with T2DM. In addition, KEGG and GO analysis
suggested that the DEGS and proteins were associated with the
following pathways: Lipid metabolism, steroid hormone biosynthesis,
bile secretion, arachidonic acid, ABC transporters, fat digestion
and absorption, PPAR signaling pathway and metabolism of
xenobiotics by cytochrome P450.
The Ces1C gene encodes a subunit of carboxylesterase
1, also known as cholesteryl ester hydrolase, which has been
demonstrated to mediate hydrolysis in adipose tissues (28). In a previous study, Ces1 was
reported to be upregulated in obese subjects, and was revealed to
have a close association with transport and catabolism of
cholesteryl ester and free fatty acids (29,30). The mutation and variation of the
Ces1 gene may result in metabolic disorders and obesity-associated
diseases, including diabetes mellitus and hypercholesterolemia.
Cyp7a1 belongs to the cytochrome P450 enzyme family, which is
exclusively expressed in the liver, and is a key enzyme in
cholesterol catabolism to bile acids that is important for
maintaining appropriate cholesterol levels. Since Cyp7a1 catalyzes
the initial and rate-limiting step in the neutral synthetic pathway
of bile acids from cholesterol, it is considered an essential
enzyme in cholesterol homeostasis. In addition, Cyp7a1 gene
expression is regulated by oxysterols, bile acids, hormones,
nutrients and cytokines (31). In
response to a high-fat diet, Cyp7a1 expression has been reported to
be induced (32). A previous
study demonstrated that Cyp7a1 serves a crucial role in maintaining
whole-body lipid levels, glucose levels and energy homeostasis.
Therefore, Cyp7a1 may be a potential therapeutic target for the
treatment of metabolic disorders, such as fatty liver diseases,
obesity and diabetes in humans (33). However, in the present study, the
results of western blotting demonstrated that the protein
expression levels of Ces1C and Cyp7a1 were not consistent with the
mRNA alterations. Ces1C is a drug-metabolizing enzyme, which is
synthesized and secreted in the liver, and the mRNA expression and
activity of Ces1C exhibit significant individual differences
(34,35). Single nucleotide polymorphisms
have an important effect on the expression and/or activity of
drug-metabolizing enzymes, which may explain the individual
differences in protein response in the present study. In addition,
the inconsistencies in mRNA and protein expression of Ces1C may be
caused by upstream regulation and epigenetic alterations. Bile
acids are the end products of cholesterol metabolism, which have an
important role in cholesterol homeostasis. Upregulated Cyp7a1 may
lead to higher levels of bile acids (35,37). Subsequently, increased bile acid
levels may inhibit the catabolism of cholesterol via a negative
feedback mechanism, thus suppressing Cyp7a1 expression and function
by promoting the hepatic and intestinal farnesoid X receptor signal
pathways (38). It may be
hypothesized that elevated bile acids suppress the protein
expression levels of Cyp7a1 in the present study, hence the
inconsistency. However, the effects of metformin on bile acids and
Cyp7a1 require further studies.
As shown in Fig.
7, high glucose and fat levels induce an increase in acetyl
coenzyme A (Acetyl-CoA). Since all carbon atoms in cholesterol are
supplied by Acetyl-CoA, increased Acetyl-CoA content may increase
cholesterol synthesis. Cholesterol homeostasis is maintained by the
selective transfer of cholesterol from the peripheral cell to HDL,
from HDL to the liver for bile acid synthesis or disposal via bile,
and finally to steroidogenic cells for hormone synthesis. High
Cyp7a1 expression may result in the rapid conversion of cholesterol
to bile acids and bile salts in the liver. Furthermore, the
oversupply of cholesterol may be transferred into the plasma via
very LDL and LDL. LDL may then enter LDL receptor-containing cells
via endocytosis. Cholesteryl ester is thus released and hydrolyzed
to fatty acids and cholesterol by lysosomal enzymes. In addition,
LDL may be engulfed by macrophages via a scavenger receptor.
Cholesteryl ester is thus released and hydrolyzed to fatty acids
and cholesterol by carboxyl esterase 1. The efflux of cholesterol
from macrophages to HDL is mediated by ATP-binding cassette ABC
transporter (39). In the plasma,
cholesterol is taken up by HDL and immediately esterified by the
plasma enzyme lecithin-cholesterol acyltransferase. Cholesteryl
ester is then transferred to the liver via reverse cholesterol
transport.
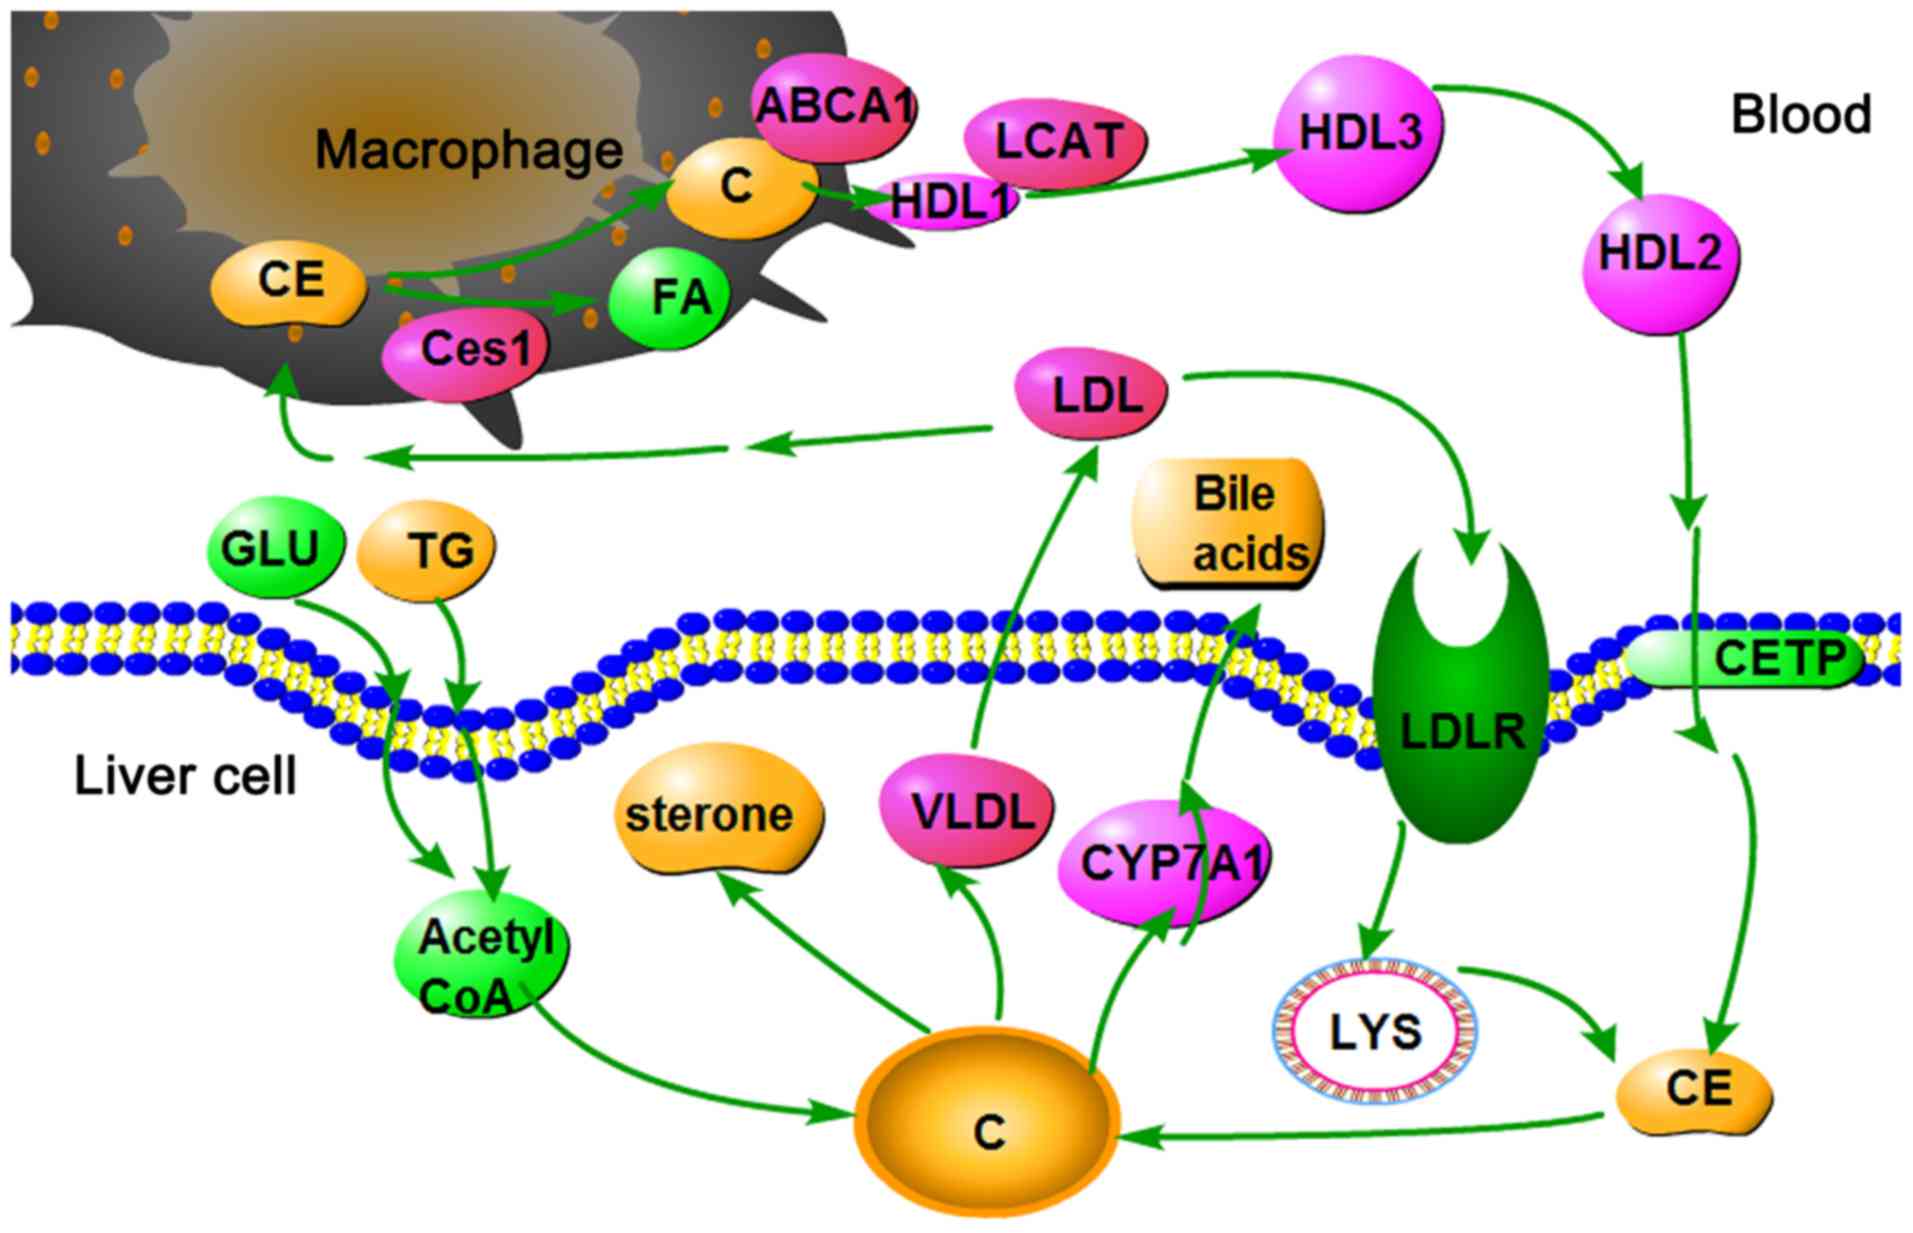 | Figure 7Cholesterol metabolism pathway in the
liver. ABCA1, ATP-binding cassette ABC transporter; C, cholesterol;
CE, cholesteryl ester; Ces1, carboxylesterase 1C subunit; CETP,
cholesteryl ester transfer protein; CYP7A1, cholesterol
7α-hydroxylyase; FA, fatty acid; GLU, glucose; HDL, high-density
lipoprotein; LCAT, lecithin cholesterol acyltransferase; LDL,
low-density lipoprotein; LYS, lysosome; TG, triglycerides; VLDL,
very low-density lipoprotein. |
The present study demonstrated that Cyp7a1 and Ces1C
are upregulated by metformin. These findings indicated that
cholesterol was removed from the body via rapid conversion to bile
acids and hydrolysis into the cholesteryl ester form. Finally,
cholesterol levels were decreased.
It has previously been reported that metformin may
induce the activation of AMPK. Furthermore, activation of AMPK may
inhibit fatty acid and cholesterol synthesis (4). Although AMPK stimulation was not
detected in the present study, the present results revealed that
metformin significantly upregulated the expression of two genes
associated with cholesterol metabolism; therefore, stimulation of
cholesterol breakdown, instead of synthesis, would be expected,
which is the outcome of AMPK activation. Furthermore, the present
study demonstrated that metformin upregulated the expression of Cp,
which is an enzyme combined with copper (40). Logie et al (41) previously indicated that the
cellular effects of metformin depended on metal-binding properties,
particularly on the copper ion. In a sense, the present study is
therefore consistent with previous studies regarding the
antidiabetic mechanism of metformin.
The other DEGs discovered in the present study were
involved in carbohydrate metabolism, lipid metabolism and protein
transport. Family with sequence similarity 120A, which belongs to
the peroxisome proliferator-activated receptors-γ family, and
Slc27a2, also known as long-chain-fatty-acid-CoA ligase 1, were
previously reported to be associated with lipid metabolism and
diabetes mellitus (42,43). PKM is the third key enzyme in
glycolysis, which is inhibited in patients with diabetes mellitus
(44). In addition,
translocation-associated membrane protein 1 inhibition has been
revealed to decrease protein transport in defective insulin
secretion (45). Therefore, we
aim to investigate these other DEGs in a follow-up study.
In conclusion, the present study demonstrated that
metformin is a multitarget antidiabetic drug, which can affect the
expression of numerous hepatic genes involved in several metabolic
pathways, particularly those associated with lipid and cholesterol
metabolism. In addition, Ces1C and Cyp7a1 were differentially
expressed in the T2DM and metformin groups. It is expected that
these findings may be useful to aid understanding of the mechanism
underlying the antidiabetic action of metformin. The present study
may also offer a novel approach to drug discovery based on
comprehensive research and assessment.
Acknowledgments
The authors would like to thank Professor Lisheng
Chu, Dr Qiyang Shou and Mr. Yongle Yang (Zhejiang Chinese Medical
University) for helpful discussions.
Notes
[1]
Funding
The present study was supported by grants from the
Project of National Great New Drug Research and Development (grant
no. 2012ZX09503001-001) and the National Natural Science Foundation
Project (grant no. 81374023). The study was also supported by the
Traditional Chinese Medicine Open Funds of Zhejiang Chinese Medical
University (grant no. 752223A00201/005/019).
[2] Availability
of data and materials
All data generated or analyzed during this study are
included in this published article.
[3] Authors'
contributions
YC, YW, YY, ZX and CL conceived and designed the
experiments and performed the experiments. JT, ZL and XZ analyzed
the data. YC wrote the manuscript. All authors read and approved
the final manuscript.
[4] Ethics
approval and consent to participate
The present study was approved by the Laboratory
Animal Management and Welfare Ethics Review Committee of Zhejiang
Chinese Medical University (permit no. ZSLL-2013-48).
[5] Consent for
publication
Not applicable.
[6] Competing
interests
The authors declare that they have no competing
interests.
References
|
1
|
Wei S, Zhang M, Yu Y, Lan X, Yao F, Yan X,
Chen L and Hatch GM: Berberine attenuates development of the
hepatic gluconeogenesis and lipid metabolism disorder in type 2
diabetic mice and in palmitate-incubated HepG2 cells through
suppression of the HNF-4α miR122 pathway. PLoS One.
11:e01520972016. View Article : Google Scholar
|
|
2
|
Reboldi G, Gentile G, Angeli F, Ambrosio
G, Mancia G and Verdecchia P: Effects of intensive blood pressure
reduction on myocardial infarction and stroke in diabetes: A
meta-analysis in 73,913 patients. J Hypertens. 29:1253–1269. 2011.
View Article : Google Scholar : PubMed/NCBI
|
|
3
|
Zhang Q, Xiao X, Li M, Li W, Yu M, Zhang
H, Ping F, Wang Z and Zheng J: Berberine moderates glucose
metabolism through the GnRH-GLP-1 and MAPK pathways in the
intestine. BMC Complement Altern Med. 14:1882014. View Article : Google Scholar : PubMed/NCBI
|
|
4
|
Correia S, Carvalho C, Santos MS, Seiça R,
Oliveira CR and Moreira PI: Mechanisms of action of metformin in
type 2 diabetes and associated complications: An overview. Mini Rev
Med Chem. 8:1343–1354. 2008. View Article : Google Scholar : PubMed/NCBI
|
|
5
|
No authors listed. Intensive blood-glucose
control with sulphonylureas or insulin compared with conventional
treatment and risk of complications in patients with type 2
diabetes (UKPDS 33). UK Prospective Diabetes Study (UKPDS) Group.
Lancet. 352:837–853. 1998. View Article : Google Scholar : PubMed/NCBI
|
|
6
|
No authors listed. Effect of intensive
blood-glucose control with metformin on complications in overweight
patients with type 2 diabetes (UKPDS 34). UK Prospective Diabetes
Study (UKPDS) Group. Lancet. 352:854–865. 1998. View Article : Google Scholar : PubMed/NCBI
|
|
7
|
Tian S, Li Y, Li D, Xu X, Wang J, Zhang Q
and Hou T: Modeling compound-target interaction network of
traditional Chinese medicines for type II diabetes mellitus:
Insight for polypharmacology and drug design. J Chem Inf Model.
53:1787–1803. 2013. View Article : Google Scholar : PubMed/NCBI
|
|
8
|
Kirpichnikov D, McFarlane SI and Sowers
JR: Metformin: An update. Ann Intern Med. 137:25–33. 2002.
View Article : Google Scholar : PubMed/NCBI
|
|
9
|
Bailey CJ and Turner RC: Metformin. N Engl
J Med. 334:574–579. 1996. View Article : Google Scholar : PubMed/NCBI
|
|
10
|
Cusi K and DeFronzo RA: Metformin: A
review of its metabolic effects. Diabetes Res. 6:89–131. 1998.
|
|
11
|
Stumvoll M, Nurjhan N, Perriello G, Dailey
G and Gerich JE: Metabolic effects of metformin in
non-insulin-dependent diabetes mellitus. N Engl J Med. 333:550–554.
1995. View Article : Google Scholar : PubMed/NCBI
|
|
12
|
Epstein S: Role of metformin in type II
diabetes. Cleve Clin J Med. 62:278–279. 1995. View Article : Google Scholar : PubMed/NCBI
|
|
13
|
Zhou G, Myers R, Li Y, Chen Y, Shen X,
Fenyk-Melody J, Wu M, Ventre J, Doebber T, Fujii N, et al: Role of
AMP-activated protein kinase in mechanism of metformin action. J
Clin Invest. 108:1167–1174. 2001. View
Article : Google Scholar : PubMed/NCBI
|
|
14
|
Shaw RJ, Lamia KA, Vasquez D, Koo SH,
Bardeesy N, Depinho RA, Montminy M and Cantley LC: The kinase LKB1
mediates glucose homeostasis in liver and therapeutic effects of
metformin. Science. 310:1642–1646. 2005. View Article : Google Scholar : PubMed/NCBI
|
|
15
|
Kim J, Shon E, Kim CS and Kim JS: Renal
podocyte injury in a rat model of type 2 diabetes is prevented by
metformin. Exp Diabetes Res. 2012:2108212012. View Article : Google Scholar : PubMed/NCBI
|
|
16
|
Hopkins AL: Network pharmacology. Nat
Biotechnol. 25:1110–1111. 2007. View Article : Google Scholar : PubMed/NCBI
|
|
17
|
Hopkins AL: Network pharmacology: The next
paradigm in drug discovery. Nat Chem Biol. 4:682–690. 2008.
View Article : Google Scholar : PubMed/NCBI
|
|
18
|
Zhang GB, Li QY, Chen QL and Su SB:
Network pharmacology: A new approach for chinese herbal medicine
research. Evid Based Complement Alternat Med. 2013:621423.
2013.PubMed/NCBI
|
|
19
|
Livak KJ and Schmittgen TD: Analysis of
relative gene expression data using real-time quantitative PCR and
the 2(−Delta Delta C(T)) Method. Methods. 25:402–408. 2001.
View Article : Google Scholar
|
|
20
|
Yang W, Lu J, Weng J, Jia W, Ji L, Xiao J,
Shan Z, Liu J, Tian H, Ji Q, et al: China National Diabetes and
Metabolic Disorders Study Group: Prevalence of diabetes among men
and women in China. N Engl J Med. 362:1090–1101. 2010. View Article : Google Scholar : PubMed/NCBI
|
|
21
|
Xu Y, Wang L, He J, Bi Y, Li M, Wang T,
Wang L, Jiang Y, Dai M, Lu J, et al: 2010 China Noncommunicable
Disease Surveillance Group: Prevalence and control of diabetes in
Chinese adults. JAMA. 310:948–959. 2013. View Article : Google Scholar : PubMed/NCBI
|
|
22
|
Stumvoll M, Goldstein BJ and van Haeften
TW: Pathogenesis of type 2 diabetes. Endocr Res. 32:19–37. 2007.
View Article : Google Scholar
|
|
23
|
Hundal RS, Krssak M, Dufour S, Laurent D,
Lebon V, Chandramouli V, Inzucchi SE, Schumann WC, Petersen KF,
Landau BR, et al: Mechanism by which metformin reduces glucose
production in type 2 diabetes. Diabetes. 49:2063–2069. 2000.
View Article : Google Scholar : PubMed/NCBI
|
|
24
|
Reed MJ, Meszaros K, Entes LJ, Claypool
MD, Pinkett JG, Gadbois TM and Reaven GM: A new rat model of type 2
diabetes: The fat-fed, streptozotocin-treated rat. Metabolism.
49:1390–1394. 2000. View Article : Google Scholar : PubMed/NCBI
|
|
25
|
Sharif S, van der Graaf Y, Nathoe HM, de
Valk HW, Visseren FL and Westerink J; SMART Study Group: HDL
cholesterol as a residual risk factor for vascular events and
all-cause mortality in patients with type 2 diabetes. Diabetes
Care. 39:1424–1430. 2016. View Article : Google Scholar : PubMed/NCBI
|
|
26
|
Morton J, Zoungas S, Li Q, Patel AA,
Chalmers J, Woodward M, Celermajer DS, Beulens JW, Stolk RP,
Glasziou P, et al: ADVANCE Collaborative Group: Low HDL cholesterol
and the risk of diabetic nephropathy and retinopathy: Results of
the ADVANCE study. Diabetes Care. 35:2201–2206. 2012. View Article : Google Scholar : PubMed/NCBI
|
|
27
|
American Diabetes Association: Diagnosis
and classification of diabetes mellitus. Diabetes Care. 36(Suppl
1): S67–S74. 2013. View Article : Google Scholar : PubMed/NCBI
|
|
28
|
Nagashima S, Yagyu H, Takahashi N,
Kurashina T, Takahashi M, Tsuchita T, Tazoe F, Wang XL, Bayasgalan
T, Sato N, et al: Depot-specific expression of lipolytic genes in
human adipose tissues - association among CES1 expression,
triglyceride lipase activity and adiposity. J Atheroscler Thromb.
18:190–199. 2011. View Article : Google Scholar
|
|
29
|
Marrades MP, González-Muniesa P, Martínez
JA and Moreno-Aliaga MJ: A dysregulation in CES1, APOE and other
lipid metabolism-related genes is associated to cardiovascular risk
factors linked to obesity. Obes Facts. 3:312–318. 2010. View Article : Google Scholar : PubMed/NCBI
|
|
30
|
Jernås M, Olsson B, Arner P, Jacobson P,
Sjöström L, Walley A, Froguel P, McTernan PG, Hoffstedt J and
Carlsson LM: Regulation of carboxylesterase 1 (CES1) in human
adipose tissue. Biochem Biophys Res Commun. 383:63–67. 2009.
View Article : Google Scholar : PubMed/NCBI
|
|
31
|
Shin DJ, Plateroti M, Samarut J and
Osborne TF: Two uniquely arranged thyroid hormone response elements
in the far upstream 5′ flanking region confer direct thyroid
hormone regulation to the murine cholesterol 7α hydroxylase gene.
Nucleic Acids Res. 34:3853–3861. 2006. View Article : Google Scholar :
|
|
32
|
Noshiro M, Usui E, Kawamoto T, Kubo H,
Fujimoto K, Furukawa M, Honma S, Makishima M, Honma K and Kato Y:
Multiple mechanisms regulate circadian expression of the gene for
cholesterol 7α-hydroxylase (Cyp7a), a key enzyme in hepatic bile
acid biosynthesis. J Biol Rhythms. 22:299–311. 2007. View Article : Google Scholar : PubMed/NCBI
|
|
33
|
Li T, Owsley E, Matozel M, Hsu P, Novak CM
and Chiang JY: Transgenic expression of cholesterol 7α-hydroxylase
in the liver prevents high-fat diet-induced obesity and insulin
resistance in mice. Hepatology. 52:678–690. 2010. View Article : Google Scholar : PubMed/NCBI
|
|
34
|
Fukami T, Nakajima M, Maruichi T,
Takahashi S, Takamiya M, Aoki Y, McLeod HL and Yokoi T: Structure
and characterization of human carboxylesterase 1A1, 1A2, and 1A3
genes. Pharmacogenet Genomics. 18:911–920. 2008. View Article : Google Scholar : PubMed/NCBI
|
|
35
|
Yoshimura M, Kimura T, Ishii M, Ishii K,
Matsuura T, Geshi E, Hosokawa M and Muramatsu M: Functional
polymorphisms in carboxylesterase1A2 (CES1A2) gene involves
specific protein 1 (Sp1) binding sites. Biochem Biophys Res Commun.
369:939–942. 2008. View Article : Google Scholar : PubMed/NCBI
|
|
36
|
Gu S, Cao B, Sun R, Tang Y, Paletta JL, Wu
X, Liu L, Zha W, Zhao C, Li Y, et al: A metabolomic and
pharmacokinetic study on the mechanism underlying the
lipid-lowering effect of orally administered berberine. Mol
Biosyst. 11:463–474. 2015. View Article : Google Scholar
|
|
37
|
Murphy C, Parini P, Wang J, Björkhem I,
Eggertsen G and Gåfvels M: Cholic acid as key regulator of
cholesterol synthesis, intestinal absorption and hepatic storage in
mice. Biochim Biophys Acta. 1735:167–175. PubMed/NCBI
|
|
38
|
Li T and Chiang JY: Bile Acid signaling in
liver metabolism and diseases. J Lipids. 2011:7540672012.
|
|
39
|
Ferrier Denise R: Biochemistry. 6th
edition. Peking University Medical Press; pp. 219–224. 2013
|
|
40
|
Memişoğullari R and Bakan E: Levels of
ceruloplasmin, transferrin, and lipid peroxidation in the serum of
patients with type 2 diabetes mellitus. J Diabetes Complications.
18:193–197. 2004. View Article : Google Scholar
|
|
41
|
Logie L, Harthill J, Patel K, Bacon S,
Hamilton DL, Macrae K, McDougall G, Wang HH, Xue L, Jiang H, et al:
Cellular responses to the metal-binding properties of metformin.
Diabetes. 61:1423–1433. 2012. View Article : Google Scholar : PubMed/NCBI
|
|
42
|
Schoonjans K, Watanabe M, Suzuki H,
Mahfoudi A, Krey G, Wahli W, Grimaldi P, Staels B, Yamamoto T and
Auwerx J: Induction of the acyl-coenzyme A synthetase gene by
fibrates and fatty acids is mediated by a peroxisome proliferator
response element in the C promoter. J Biol Chem. 270:19269–19276.
1995. View Article : Google Scholar : PubMed/NCBI
|
|
43
|
Suzuki H, Kawarabayasi Y, Kondo J, Abe T,
Nishikawa K, Kimura S, Hashimoto T and Yamamoto T: Structure and
regulation of rat long-chain acyl-CoA synthetase. J Biol Chem.
265:8681–8685. 1990.PubMed/NCBI
|
|
44
|
Saltiel AR and Kahn CR: Insulin signalling
and the regulation of glucose and lipid metabolism. Nature.
414:799–806. 2001. View Article : Google Scholar : PubMed/NCBI
|
|
45
|
Tang Z, Zhang W, Wan C, Xu G, Nie X, Zhu
X, Xia N, Zhao Y, Wang S, Cui S, et al: TRAM1 protect HepG2 cells
from palmitate induced insulin resistance through ER stress-JNK
pathway. Biochem Biophys Res Commun. 457:578–584. 2015. View Article : Google Scholar : PubMed/NCBI
|