Introduction
Oligodendrocyte damage-induced demyelination is a
typical pathological event in white matter impairment in numerous
neurological disorders, including stroke, Alzheimer's disease,
intracranial tumors, cerebral hemorrhage and chronic cerebral
hypoperfusion (1).
Oligodendrocytes, as the primary component of periventricular white
matter and the only myelin-producing cells in the central nervous
system (CNS), are fragile and vulnerable to ischemic white matter
lesions (WMLs) (2). Inflammatory
cytokines derived from activated microglia and astrocytes are the
main factors responsible for oligodendrocyte injury (3).
Microglia are the predominant resident immune cell
in the human brain and white matter (4). Microglia becomes activated under
oxygen and glucose deprivation (OGD) or low glucose/hypoxia. Once
activated, the morphology and secretory phenotype of the microglia
changes; protrusion retraction, polarization and an increase in the
soma area occurs (5). A recent
study reported that OGD activated microglia, which then had
neurotoxic effects on oligodendrocyte progenitor cells by inducing
the rapid release of proinflammatory molecules and free radicals
(6). Due to sharing analogous
pathological mechanisms (7), it
may be speculated that microglia will exhibit similar effects under
low glucose/hypoxia conditions. Therefore, selective modulation of
the activation of microglia may be a strategy for the treatment of
white matter injury, such as WMLs.
There is an urgent need for treatments for
microglia-induced neuroinflammation of the ischemic brain.
Adenosine has been highlighted as a crucial regulatory autocrine
and paracrine factor, which is required for microglial-mediated
inflammatory activity (8). The
extracellular ectonucleotidases cluster of differentiation (CD)39
and CD73 metabolize adenosine triphosphate (ATP) and adenosine
diphosphate to adenosine monophosphate (AMP), and then metabolize
AMP into adenosine. Subsequently, adenosine triggers an efflux of
K+ from the cell, followed by a Ca2+ influx
and activation of phosphatidylcholine-specific phospholipase C and
calcium-independent phospholipase A2, which induces an
unconventional release of GAPDH and inflammatory cytokines from the
microglia (9). However, the role
of adenosine receptors (ARs) in the modulation of the secretion of
inflammatory cytokines from the microglia during hypoxia is not
well understood.
Adenosine is a ubiquitous nucleoside that has an
influence on the immune properties of microglia through
interactions with four AR subtypes; A1, A2a, A2b and A3 (10). The adenosine A1 receptor (A1R) and
adenosine A2a receptor (A2aR) have been reported to form
complicated tetrameric heteromers in astrocytes and neurons,
suggesting a putative regulatory interaction with A1R and A2aR
(11). A1R and A2aR have
antagonistic effects on gliosis and the release of glutamate
because of different couplings with the guanine nucleotide-binding
(G) proteins Gi and Gs, and their elicitation
of the release of Ca2+ from intracellular stores
(12). Furthermore, activation of
A2aR reduces the affinity of A1R to agonists during the formation
of A1R-A2aR heteromers in mammalian cells, providing a switch
mechanism by which low (0.3 μM) and high (3-10 μM)
concentrations of adenosine can inhibit and stimulate glutamatergic
neurotransmission (13). Little
is known about whether an imbalance of A1R to A2aR contributes to
the immune cascade in microglia. Our group previously demonstrated
that ablation of the A2aR gene promotes microglial activation and
deteriorates chronic cerebral hypoperfusion-induced WMLs (14). Given that chronic cerebral
ischemia can induce a downregulation of adenosine A1R during white
matter damage, the functional antagonistic interactions between A1R
and A2aR that modulate the release of inflammatory cytokines from
the microglia should be further investigated. In the present study,
a co-culture model of microglia/oligodendrocytes undergoing low
glucose/hypoxia exposure to mimic chronic cerebral hypoperfusion
was utilized to determine whether an A1R-A2aR imbalance regulates
the activation of microglia.
Mechanically, activation of microglia is linked to
the response of transcription factors, including cyclic adenosine
monophosphate (cAMP) response element binding protein (CREB) and
nuclear factor (NF)-κB (15). A1R
and A2aR affect the level of cAMP through Gi and
Gs proteins, activating cAMP-dependent protein kinase A
(PKA), and promoting the phosphorylation of CREB and NF-κB, thereby
regulating microglial activation and the production of inflammatory
cytokines (16,17). Nevertheless, a better
understanding of the distinct role of A1R and A2aR in CREB and
NF-κB phosphorylation is required. The present study aimed to
investigate whether an imbalance of A1R-A2aR regulates low
glucose/hypoxia-induced microglial activation, thereby contributing
to oligodendrocyte injury through modulating the phosphorylation of
NF-κB and CREB.
Materials and methods
Experimental animals
Animals were provided by Animal Center of Third
Military Medical University (Chongqing, China). A total of 8
Sprague Dawley rats (3-days-old) were used in the present study.
Prior to the experiment, the mice were housed in a cage at a
constant temperature (22±2°C) and humidity (60±5%) with a 12-h
light/dark cycle. The rats had free access to food and water. All
animal care and experimental procedures were approved by the
Institutional Animal Care and Use Committee of Third Military
Medical University (approval no. SYXK-PLA-2007035). Efforts were
made to minimize animal suffering and to reduce the number of
animals used. All surgeries were performed under sodium
pentobarbital anesthesia and mice were sacrificed by cervical
dislocation under deep anesthesia.
Drugs
The following drugs were used in the present study
(Table I): A1R agonist,
2-chloro-N6-cyclopentyladenosine (CPA); A1R antagonist,
cyclopentyl-1,3-dipropylxanthine (DPCPX); A2AR agonist,
2-p-(carboxyethyl) phenethylamino-5′-N-ethylcarboxamideadenosine
hydrochloride (CGS 21680); and A2AR antagonist,
2-(2-furanyl)-7-(2-phenylethyl)-7H-pyrazolo[4,3-e]
[1,2,4]triazolo[1,5-c]pyrimidin-5-amine (SCH 58261). Saline, 5 mM
dimethylsulfoxide and 10 mM ethanol were used for the vehicle. The
drugs were purchased from eBioscience (Thermo Fisher Scientific,
Inc., Waltham, MA, USA).
 | Table IA1R and A2aR agonists and antagonists
used and their effects. |
Table I
A1R and A2aR agonists and antagonists
used and their effects.
| Drug | Dosage (nM) | Effect |
|---|
| CPA | 1,000 | Activated A1R |
| DPCPX | 100 | Inhibits'A1R |
| CGS | 100 | Activates A2aR |
| SCH | 100 | Inhibits A2aR |
Microglia culture
The microglial cell line BV2 (Cell Resource Center,
Institute of Basic Medical Sciences, Chinese Academy of Medical
Sciences/Peking Union Medical College, Beijing, China) was used.
The cells were cultured in Dulbecco's modified Eagle medium (low
glucose; Invitrogen; Thermo Fisher Scientific, Inc.), 5% fetal
bovine serum (FBS; HyClone; GE Healthcare Life Sciences, Logan, UT,
USA), 4 mM glutamine (Invitrogen; Thermo Fisher Scientific, Inc.),
100,000 U/l penicillin G and 100 mg/l streptomycin (Mediatech,
Inc., Herndon, VA, USA), and were maintained at 37°C with 5%
CO2.
Oligodendrocyte culture
Primary oligodendrocyte cultures were isolated and
maintained as described by Seki et al (18). Briefly, the subventricular zone
was removed from 3-day-old Sprague Dawley rats (n=8) using a
dissecting microscope. The tissues were mechanically dissociated
into single cells on 100-mm-pore nylon mesh cell strainers (BD
Biosciences, Franklin Lakes, NJ, USA) and collected in PBS.
Subsequently, the cells were filtered through 40-mm-pore nylon mesh
cell strainers (BD Biosciences) and centrifuged at 800 × g for 5
min at 4°C. The cell pellet was re-suspended in cold Neurobasal
Medium supplemented with 2% B27, 1% L-glutamine, 1%
penicillin/streptomycin/amphotericin B (all Thermo Fisher
Scientific, Inc.), 20 ng/ml epidermal growth factor and 10 ng/ml
basic fibroblast growth factor (both Sigma-Aldrich, Merck KGaA,
Darmstadt, Germany). The cell suspension was plated into
poly-L-lysine coated 12-well plates at a density of
1.5×10⁵ cells/well. Cells were maintained at 37°C in an
atmosphere of 5% CO2. At day 7, triiodothyronine (T3; 30
μg/ml) and thyroxine (T4; 40 μg/ml) (both
Sigma-Aldrich; Merck KGaA) were added to the culture media. A total
of 14 days after the addition of T3 and T4, the differentiated
oligodendrocytes were subjected to further experiments.
Co-culture model of microglia and
oligodendrocytes
As previously described (18), BV2 microglial cells were plated on
tissue culture inserts for 12-well plates (Greiner Bio-One GmbH,
Frickenhausen, Germany) at a density of 5×10⁵
cells/well. The microglial cells were incubated for 12 h in the
presence of CPA (1 μM), DPCPX (100 nM) CGS (100 nM) or SCH
(100 nM). In triplicate, using 5-μm pore Transwell filters
(Corning Incorporated, Corning, NY, USA), each BV2 culture insert
was placed on the primary oligodendrocytes (1.5×10⁵
cells/cm2) in the 12-well plates. Both layers of cells
were submerged in Neurobasal Medium with the aforementioned
supplements. A total of 24 h after a 37°C incubation, the upper
cells in the filter inserts were removed from the 12-well plates.
Thus, only oligodendrocytes were involved in the subsequent lactate
dehydrogenase (LDH) and Cell Counting Kit (CCK)-8 assays.
Morphological changes in the primary microglia and oligodendrocytes
were observed under a phase-contrast microscope (magnification,
×200). All procedures were performed in triplicate independently in
this experiment.
Low glucose/hypoxia stimulation
In conventional experiments, cells are cultured
under normoxic conditions (5% CO2, 20% O2 and
3.0 g/l glucose). For the low glucose/hypoxia-mimicking assessments
in the present study, the cells were cultured at 37°C in low
glucose medium, in which glucose was partly replaced by 10% FBS
under hypoxic conditions (5% CO2, 1.5% O2 and
1.4 g/l glucose). To maintain cell viability, high glucose and
oxygen recovery after exposure to low glucose/hypoxia is required.
Thus, the cells suffered from low glucose/hypoxia for 0, 2, 4, 6,
8, 10 and 12 h, followed by 24 h of high glucose and oxygen
recovery treatment (5% CO2, 30% O2 and 4.5
g/l glucose).
NO production assessment
NO production from microglia was used as an
indicator of microglial activation. Thus, the accumulation of
NO2−, a stable end product of NO production, was assayed
using the Griess reaction as previously reported (19). Mouse BV2 cells were plated on
96-well tissue culture plates (Greiner Bio-One GmbH) at a density
of 1×10⁵ cells/200 μl medium. The cells were
pre-incubated under low glucose/hypoxia conditions for 12 h
followed by 24 h of high glucose and oxygen recovery incubation.
Subsequently, the cell-free supernatants were assayed for NO
accumulation using a Griess assay kit (Dojindo Molecular
Technologies, Inc., Kumamoto, Japan) and read at 550 nm using a
micro-plate reader (Multiscan MS; Thermo Labsystems, Helsinki,
Finland).
ELISA
The secretion of inflammatory cytokines, including
interleukin (IL)-6 (cat. no. BMS603HS), interferon (IFN)-β (cat.
no. BMS606), IL-1β (cat. no. KMC0012) and tumor necrosis factor
(TNF)-α (cat. no. BMS607HS), was detected using ELISA kits
(Invitrogen; Thermo Fisher Scientific, Inc.). BV2 cells were
pre-incubated in low glucose/hypoxia plus CPA (1 μM), DPCPX
(100 nM), CGS (100 nM) or SCH (100 nM) for 8 h, and the conditioned
media was collected for detection. All ELISA procedures were
performed according to the manufacturer's protocol. Optical
densities were determined by the measurement of indicator color
shifts at 450 nm on a microplate reader (Multiscan MS).
LDH assay
Oligodendrocyte cell damage was determined by the
colorimetric measurement of LDH, the increased production of which
is an indicator of damage. Cells were collected 24 h after
co-culture. The LDH level was measured by a spectrophotometric
enzyme assay using an LDH Assay kit (Wako Pure Chemical Industries,
Ltd., Osaka, Japan). The assay was performed according to the
manufacturer's protocol. In brief, LDH converts pyruvate into
lactate that reduces the developer to a colored product with
absorbance at 450 nm measured by a microplate reader (Multiscan
MS).
CCK-8 assay
To assess cell proliferation, oligodendrocytes that
had undergone low glucose/hypoxia plus CPA (1 μM), DPCPX
(100 nM) CGS (100 nM) or SCH (100 nM) treatment for 12 h were
seeded into 96-well cell culture plates (Corning Incorporated) at a
concentration of 2×10⁴ cells/well in a volume of 100
μl and cultured overnight at 37°C. CCK-8 reagents (Dojindo
Molecular Technologies, Inc.) were added to each well at 0, 2, 4,
6, 8, 10 and 12 h. The plates were then incubated for another 2 h
at 37°C in the dark. The absorbency of the wells was measured at
450 nm using the Immunomini NJ-2300 microplate reader (InterMed,
Tokyo, Japan).
Reverse transcription-quantitative
polymerase chain reaction (RT-qPCR) analysis
RT-qPCR analyses of inflammatory cytokines were
performed as previously reported (20). A Transcriptor First Strand cDNA
Synthesis kit (Roche Applied Science, Penzberg, Germany) was used
according to the manufacturer's protocol. Briefly, microglial
cultures were collected to extract total RNA using TRIzol reagent
(Invitrogen; Thermo Fisher Scientific, Inc.), which was reverse
transcribed with a combination of anchored-oligo(dT) and random
primers that were included in the kit. Gene expression analysis was
performed for four inflammatory cytokines (IL-6, IFN-β, IL-1β and
TNF-α) and the primers (5′-3′) were as follows: IL-1β forward (F),
CAACAACAAGTGATATTCTCCATG and reverse (R), GATCCACACTCTCCAGCTGCA;
TNF-α F, GCGGTGCCTATGTCTCAG and R, GCCATTTGGGAACTTCTCATC; IFN-β F,
CCCTATGGAGATGACGGAGA and R, CTGTCTGCTGGTGGAGTTCA; IL-6 F,
ATGAACTCCTTCTCCACAAGC and R, CTACATTTGCCGAAGAGCCCTCAGGCTGGACTG; and
β-actin F, AGAGGGAAATCGTGCGTG AC and R, CAATAGTGATGACCTGGCCGT. qPCR
analysis was performed in a final volume of 10 μl using 5 ng
cDNA/well and 5 μl LightCycler® 480 Probes Master
(Roche Applied Science). The reagents and samples were pipetted by
an epMotion 5070 Liquid Handling Robot (Eppendorf, Hamburg,
Germany). The thermocycling conditions were as follows: Enzyme
activation at 95°C for 10 min; 45 cycles of amplification at 95°C
for 10 sec, 60°C for 30 sec and signal detection at 72°C for 1 sec;
and cooling at 40°C for 30 sec. The expression levels were
quantified using the 2−ΔΔCq method (21). For data normalization, the β-actin
control was used. Interactive dot diagrams were used to represent
the scale of the differences, and indicate the specificity and
sensitivity values of the analyzed markers.
Western blotting
Western blotting was performed according to
previously described method (22). Primary microglia were rinsed with
ice-cold PBS and lysed in 8 M urea, 2% SDS, 100 mM DTT and 375 mM
Tris (pH 6.8) by heating at 37°C for 2 h. The proteins were
resolved by 5-10% SDS-PAGE. A total of 30 μg protein was
loaded in each lane. Following this, the gels were transferred to
polyvinylidene difluoride membranes using a semidry transfer
system. Subsequently, the membranes were immunoblotted overnight at
4°C with the following primary antibodies: Mouse anti-A2a (1:1,500;
cat. no. ab79714; Abcam, Cambridge, MA, USA), rabbit anti-A1
(1:1,000; cat. no. ab82477; Abcam), rabbit anti-NF-κB p65 (1:2,000;
cat. no. 04-1008; EMD Millipore, Billerica, MA, USA), rabbit
anti-phosphorylated (p)-NF-κB p65 (1:1,000; cat. no. ab222494;
Abcam), mouse anti-CREB antibody (1:1,000; cat. no. MAB5432;
Millipore), mouse anti-phosphorylated CREB (1:1,000; cat. no.
05-667; Millipore), mouse anti-phosphorylated protein kinase C
(p-PKC; 1:1,000; cat. no. ab75837; Abcam) and mouse anti protein
kinase C (PKC; 1:1,000; cat. no. 05-983; Millipore). The membranes
were then washed five times in 0.1% TBST and incubated with the
secondary antibody [horseradish peroxidase-conjugated goat
anti-mouse/rabbit immunoglobulin (Ig)G antibody; 1:1,000; cat. no.
A0208 and A0216; Beyotime Institute of Biotechnology, Haimen,
China] for 2 h at room temperature. The immunoreactive bands were
developed using a chemiluminescent detection kit, visualized by
ChemiDoc Imaging system (Bio-Rad Laboratories, Inc., Hercules, CA,
USA) and quantified using ImageJ software (version 1.50i; National
Institutes of Health, Bethesda, MD, USA). The membranes were then
stripped and re-probed with a rabbit anti-α-tubulin polyclonal
primary antibody at 4°C overnight (1:1,000; cat. no. 11224-1-AP;
Wuhan Sanying Biotechnology, Wuhan, China), followed by incubation
with a horseradish peroxidase-conjugated goat anti-rabbit IgG
antibody (1:1,000; cat. no. A0216; Beyotime Institute of
Biotechnology) for 2 h at room temperature.
Statistical analysis
Statistical analyses were performed using GraphPad
Prism (version 5.0; GraphPad Software, Inc., La Jolla, CA, USA).
All experiments were repeated at least three times. All data were
presented as the mean ± standard error of the mean. Comparisons
between groups were performed using one-way analysis of variance
followed by a Bonferroni post hoc test where appropriate. P<0.05
was considered to indicate a statistically significant
difference.
Results
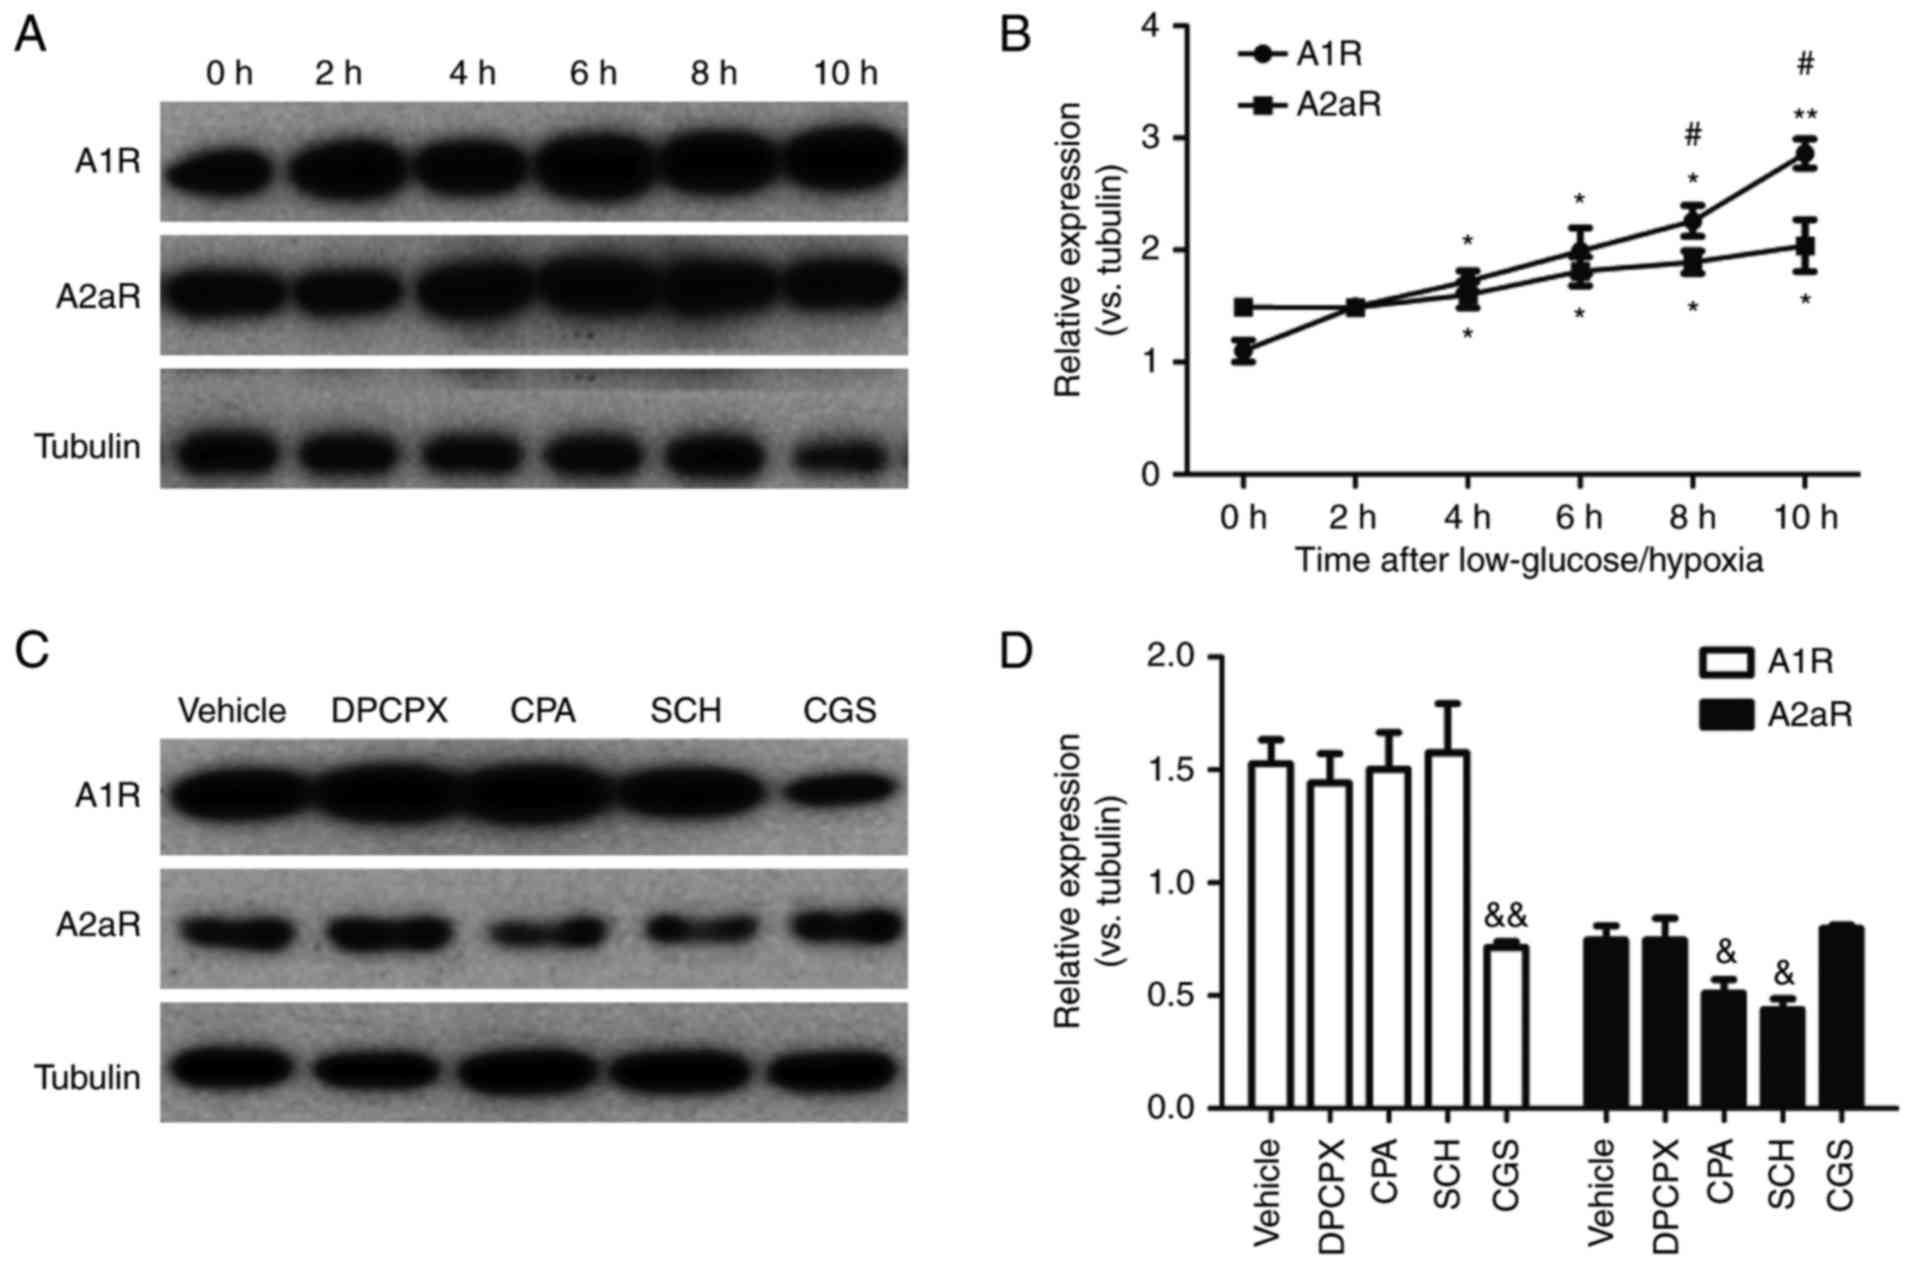
Imbalanced elevation and the antagonism
between A1R and A2aR after low glucose/hypoxia in microglia
To mimic general ischemic injury, cells were
cultured in low glucose and hypoxic conditions. Then, the
expression of A1R and A2aR was measured in microglia exposed to low
glucose/hypoxia for up to 10 h. This revealed that low
glucose/hypoxia induced an upregulation of A1R and A2aR at 4, 6, 8
and 10 h after exposure (Fig. 1A and
B). Furthermore, the expression of A1R enhanced faster than
that of A2aR at 8 and 10 h after low glucose/hypoxia, suggesting an
imbalance in A1R vs. A2aR expression. Next, agonists and
antagonists of A1R and A2aR were applied to treat microglia that
had been exposed to low glucose/hypoxia for 8 h (Fig. 1C and D). Interestingly, activation
of A1R by CPA reduced the expression of A2aR, whereas inactivation
of A1R by DPCPX did not notably increase A2aR expression.
Conversely, activation of A2aR by CGS significantly reduced the
expression of A1R, while the inhibition of A2aR with SCH did not
significantly increase A1R expression. These data indicate an
imbalance of A1R-A2aR expression after low glucose/hypoxia.
However, this phenomenon requires verification under different
metabolic tissue-specific conditions in vivo in the
future.
Effects of A1R and A2aR on the activation
of microglia
Compared to normal resting microglia, cells
undergoing low glucose/hypoxia displayed a unique
activation-associated morphology, including a larger and round
soma, retracted projections and intercellular adhesion (Fig. 2A). To detect the effects of low
glucose/hypoxia on the activation of microglia, the level of NO, an
indicator of activated microglia, was measured in cultures exposed
to low glucose/hypoxia for 2, 4, 6, 8, 10 and 12 h. Low
glucose/hypoxia induced an increased release of NO within 12 h,
peaking at 8 h (Fig. 2B).
Furthermore, following an 8 h exposure to low glucose/hypoxia with
agonists or antagonists of A1R and A2aR, the NO concentration in
the microglia cultures was assayed (Fig. 2C). Inactivation of A1R by DPCPX
and activation of A2aR by CGS significantly reduced the NO level in
microglial cultures under low glucose/hypoxia conditions. Notably,
inhibition of A2aR with SCH significantly increased the NO level.
The A1R agonist CPA had no significant effect on NO levels. These
findings suggest that A1R and A2aR serve distinct roles in the
activation of microglia under low glucose/hypoxia conditions.
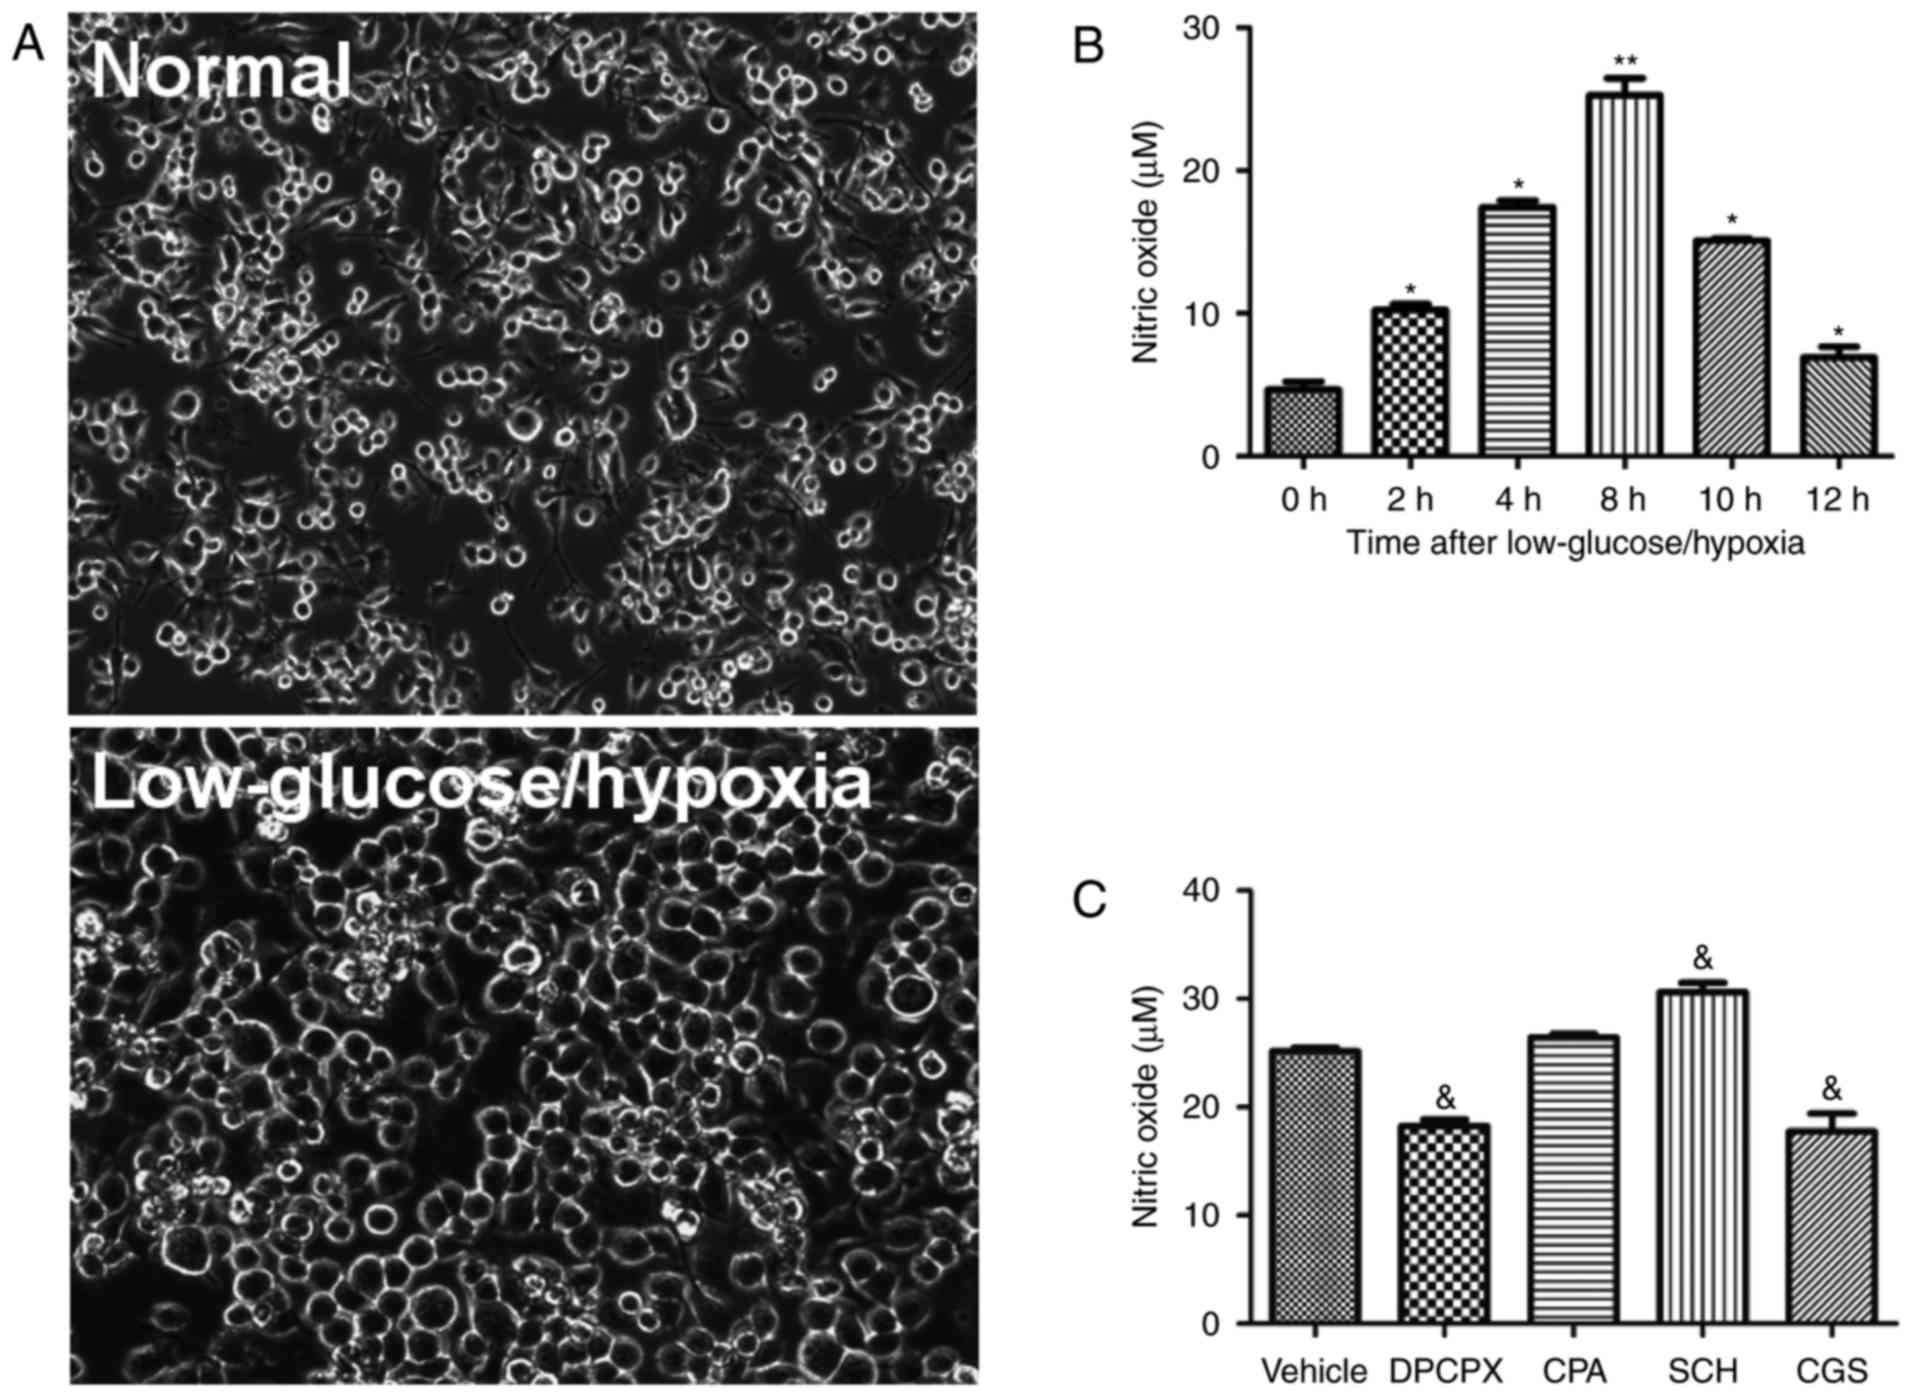 | Figure 2Effects of A1R and A2aR on the
activation of microglia. (A) Phase-contrast microscopy images of
microglia cell morphology under normal and low glucose/hypoxia
conditions (magnification, ×200). (B) Concentrations of NO, an
indicator of microglial activation, at 0, 2, 4, 6, 8, 10 and 12 h
after exposure to low glucose/hypoxia. (C) NO levels following
treatment with A1R and A2aR agonists and antagonists (n=6/group).
*P≤0.05, **P≤0.01 vs. the 0 h group;
&P≤0.05 vs. the vehicle group. A1R, adenosine A1
receptor; A2aR, adenosine A2a receptor; NO, nitric oxide. |
Effects of A1R and A2aR on the production
of IL-6, IFN-β, IL-1β and TNF-α by microglia
To determine whether activated microglia secrete
proinflammatory cytokines, the protein and mRNAs level of IL-6,
IFN-β, IL-1β and TNF-α were measured in cultures after low
glucose/hypoxia treatment, and exposure to agonists or antagonists
of A1R and A2aR, for 8 h (Table
II and Fig. 3). The
inhibition of A1R and activation of A2aR reduced the concentration
of IL-6, IL-1β and IFN-β in cultures (Fig. 3A, B and D). By contrast,
activation of A1R or suppression of A2aR increased the production
of IL-6, IL-1β and TNF-α (Fig.
3A-C). Notably, the expression of IFN-β mRNA was promoted by
the A2aR antagonist SCH and reduced by its agonist CGS (Fig. 3H). In addition, the A1R agonist
CPA significantly enhanced the mRNA expression of IL-6, IL-1β and
TNF-α (Fig. 3E-G). These results
indicate that the activation of A1R and/or inactivation of A2aR
cause the secretion of microglia-derived proinflammatory cytokines
under low glucose/hypoxia conditions.
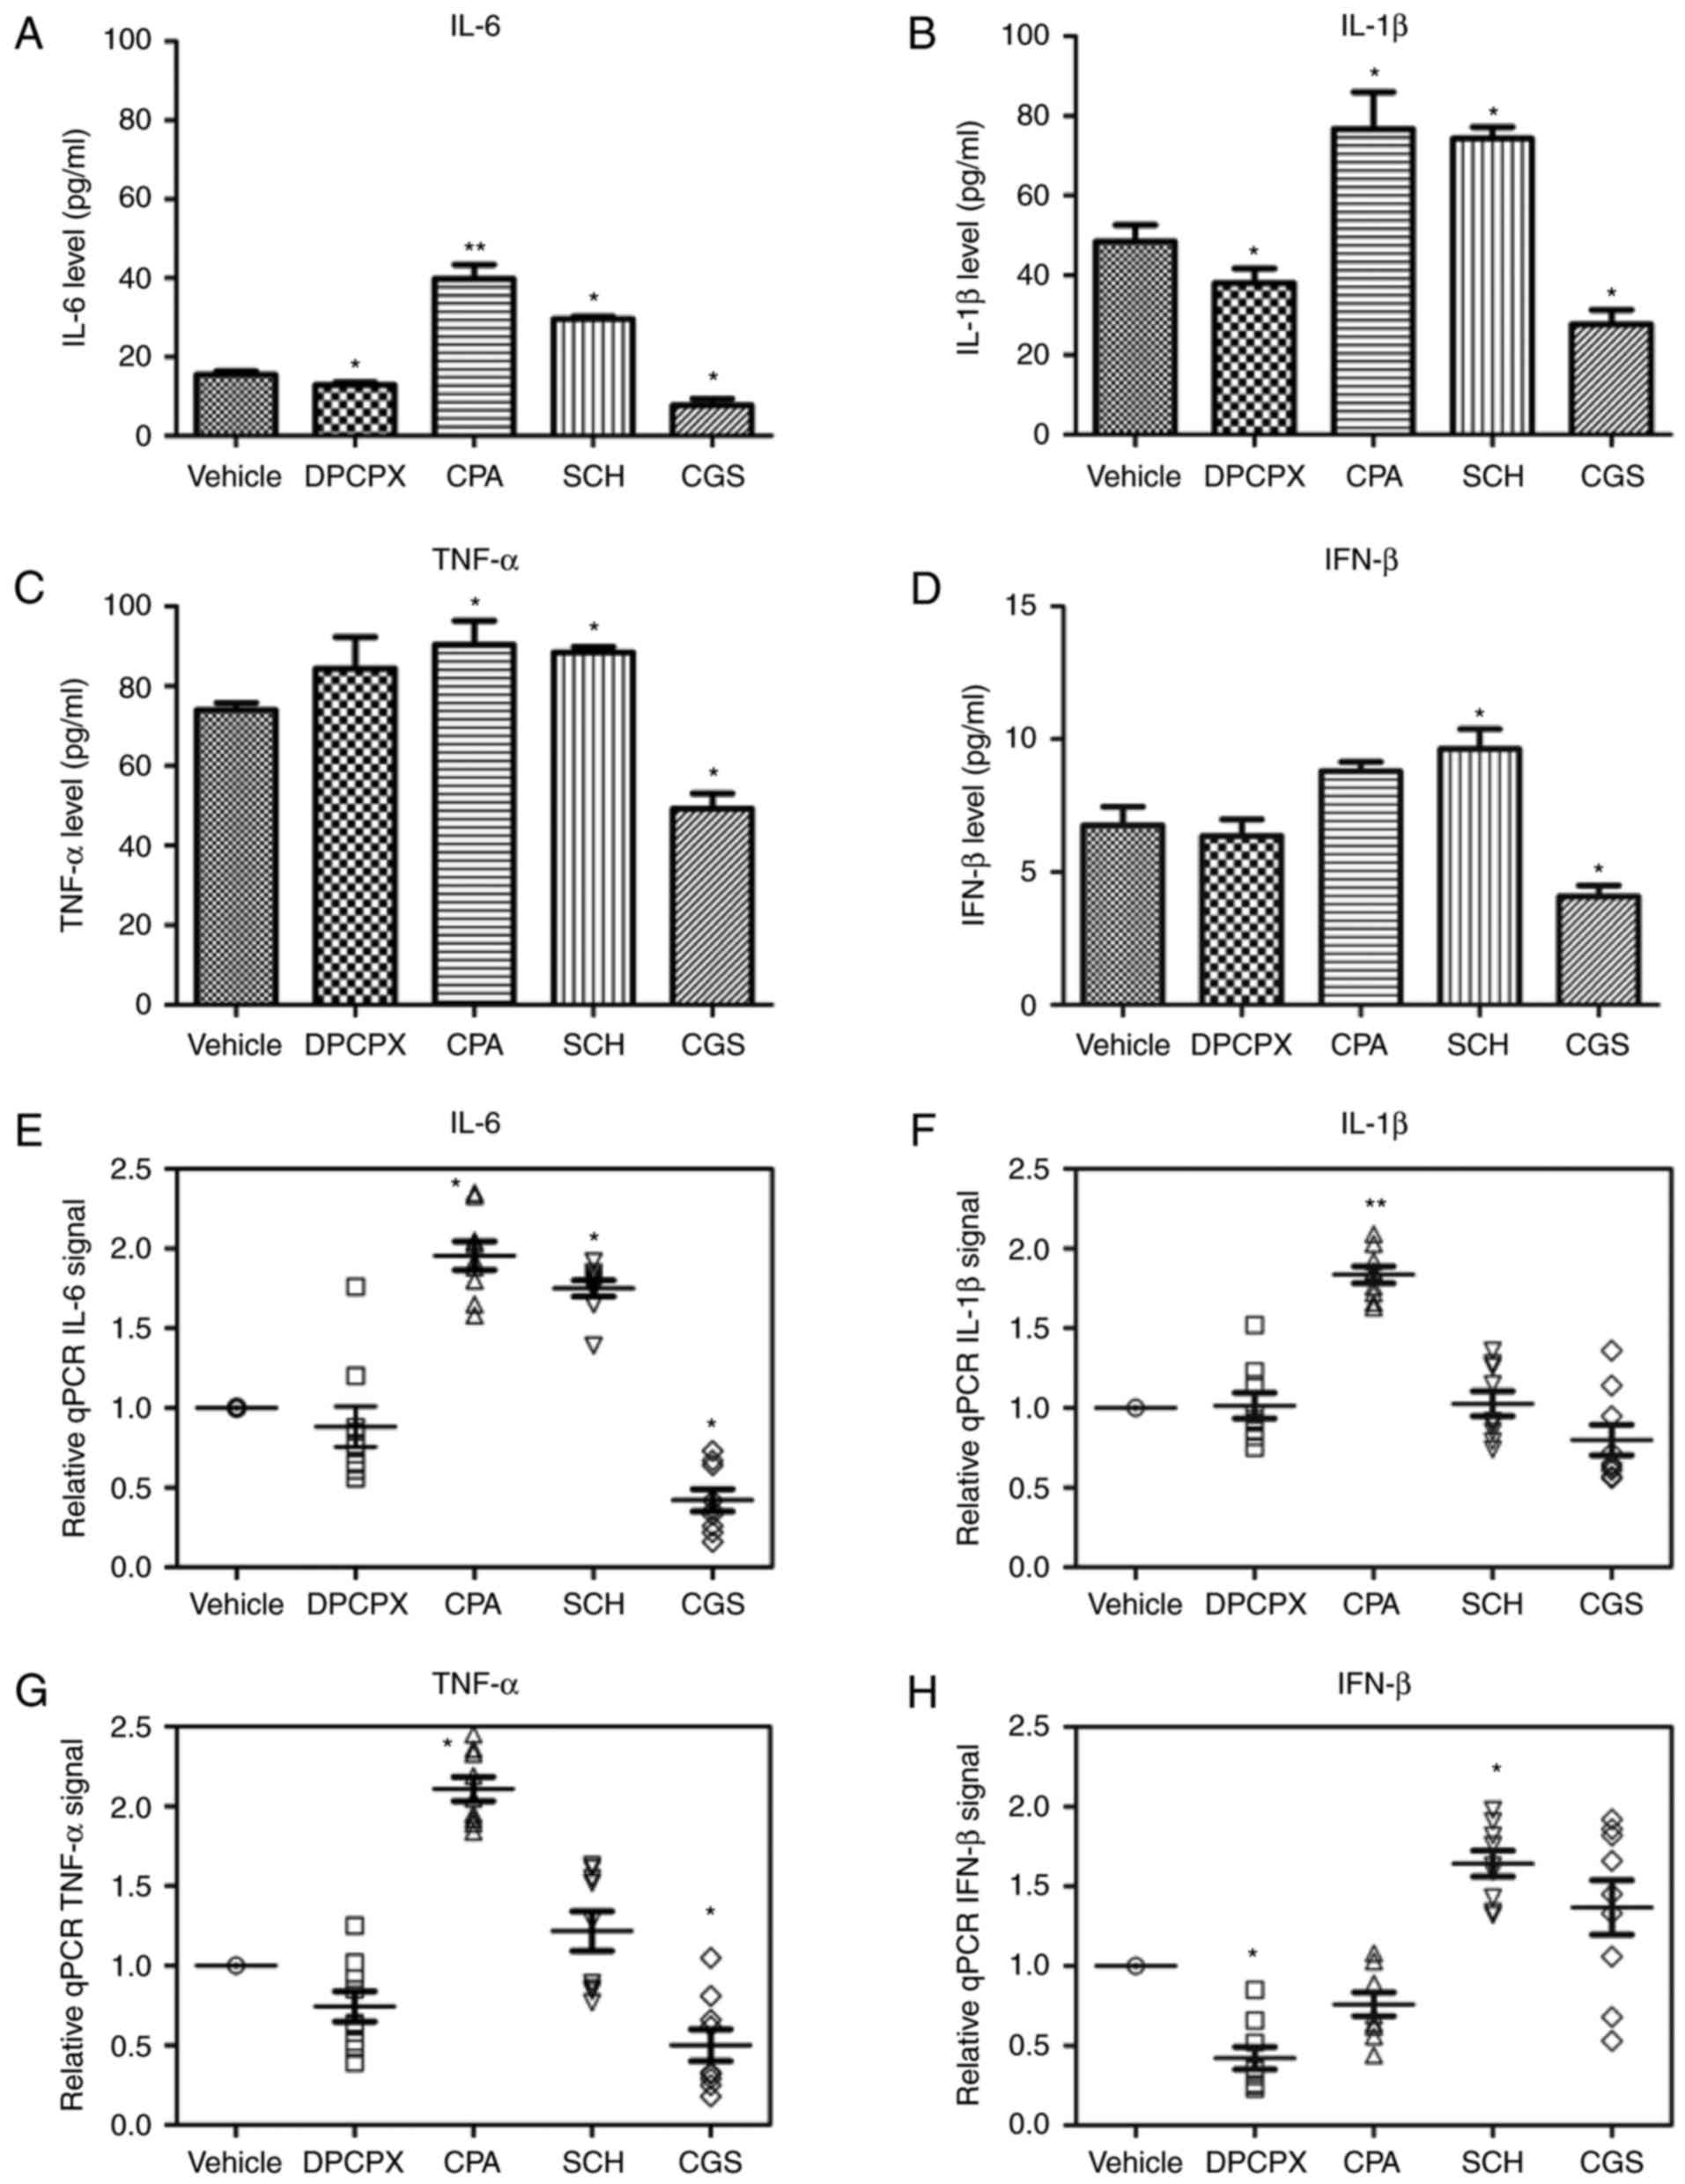 | Figure 3Effects of A1R and A2aR on the
production of IL-6, IFN-β, IL-1β and TNF-α by microglia. The
concentration of (A) IL-6, (B) IL-1β, (C) TNF-α and (D) IFN-β after
exposure to A1R and A2aR agonists and antagonists (n=9/group) was
detected by ELISAs. The mRNA levels of (E) IL-6, (F) IL-1β, (G)
TNF-α and (H) IFN-β after exposure to A1R and A2aR agonists and
antagonists (n=9/group) were determined by reverse-transcription
quantitative polymerase chain reaction analysis.
*P≤0.05, **P≤0.01 vs. the vehicle group. A1R,
adenosine A1 receptor; A2aR, adenosine A2a receptor; IL,
interleukin; IFN, interferon; TNF, tumor necrosis factor. |
| Table IIEffects of the A1R and A2aR agonists
and antagonists on proinflammatory cytokine levels. |
Table II
Effects of the A1R and A2aR agonists
and antagonists on proinflammatory cytokine levels.
| Cytokine | Drug
|
|---|
| DPCPX (A1R
inhibitor) | CPA (A1R
activator) | SCH (A2aR
inhibitor) | CGS (A2aR
activator) |
|---|
| IL-6 protein |
Downregulationa |
Upregulationb |
Upregulationa |
Downregulationa |
| IL-6 mRNA | – |
Upregulationa |
Upregulationa |
Downregulationa |
| IL-1β protein |
Downregulationa |
Upregulationa |
Upregulationa |
Downregulationa |
| IL-1β mRNA | – |
Upregulationb | – | – |
| TNF-α protein | – |
Upregulationa |
Upregulationa |
Downregulationa |
| TNF-α mRNA | – |
Upregulationa | – |
Downregulationa |
| IFN-β protein | – |
Upregulationb |
Upregulationa |
Downregulationa |
| IFN-β mRNA |
Downregulationa | – |
Upregulationa | – |
Effects of A1R and A2aR on
oligodendrocyte damage
To further determine the effects of activated
microglia on oligodendrocyte growth, a co-culture model of
microglia and oligodendrocytes was used. The cytotoxicity induced
by microglia-derived inflammatory cytokines was investigated by an
LDH release assay and cell viability was measured using a CCK-8
assay. Reduced cell density and processes were observed in the low
glucose/hypoxia stimulated groups (Fig. 4A). Low glucose/hypoxia caused a
significant increase in LDH release and significantly decreased the
viability of oligodendrocytes within 12 h compared with the vehicle
group (Fig. 4B and C).
Inactivation of A1R by DPCPX and activation of A2aR by CGS
significantly reduced LDH release and significantly increased
viability within 12 h compared with the vehicle group (Fig. 4D and E). Although activation of
A1R by CPA and inactivation A2aR by SCH did not further enhance LDH
release, they significantly reduced cell viability compared with
the vehicle group (Fig. 4D and
E). These data suggest that A1R and A2aR serve distinct roles
in oligodendrocyte impairment. The inactivation of A1R and
activation of A2aR may be an effective way of reducing
oligodendrocyte damage after low glucose/hypoxia.
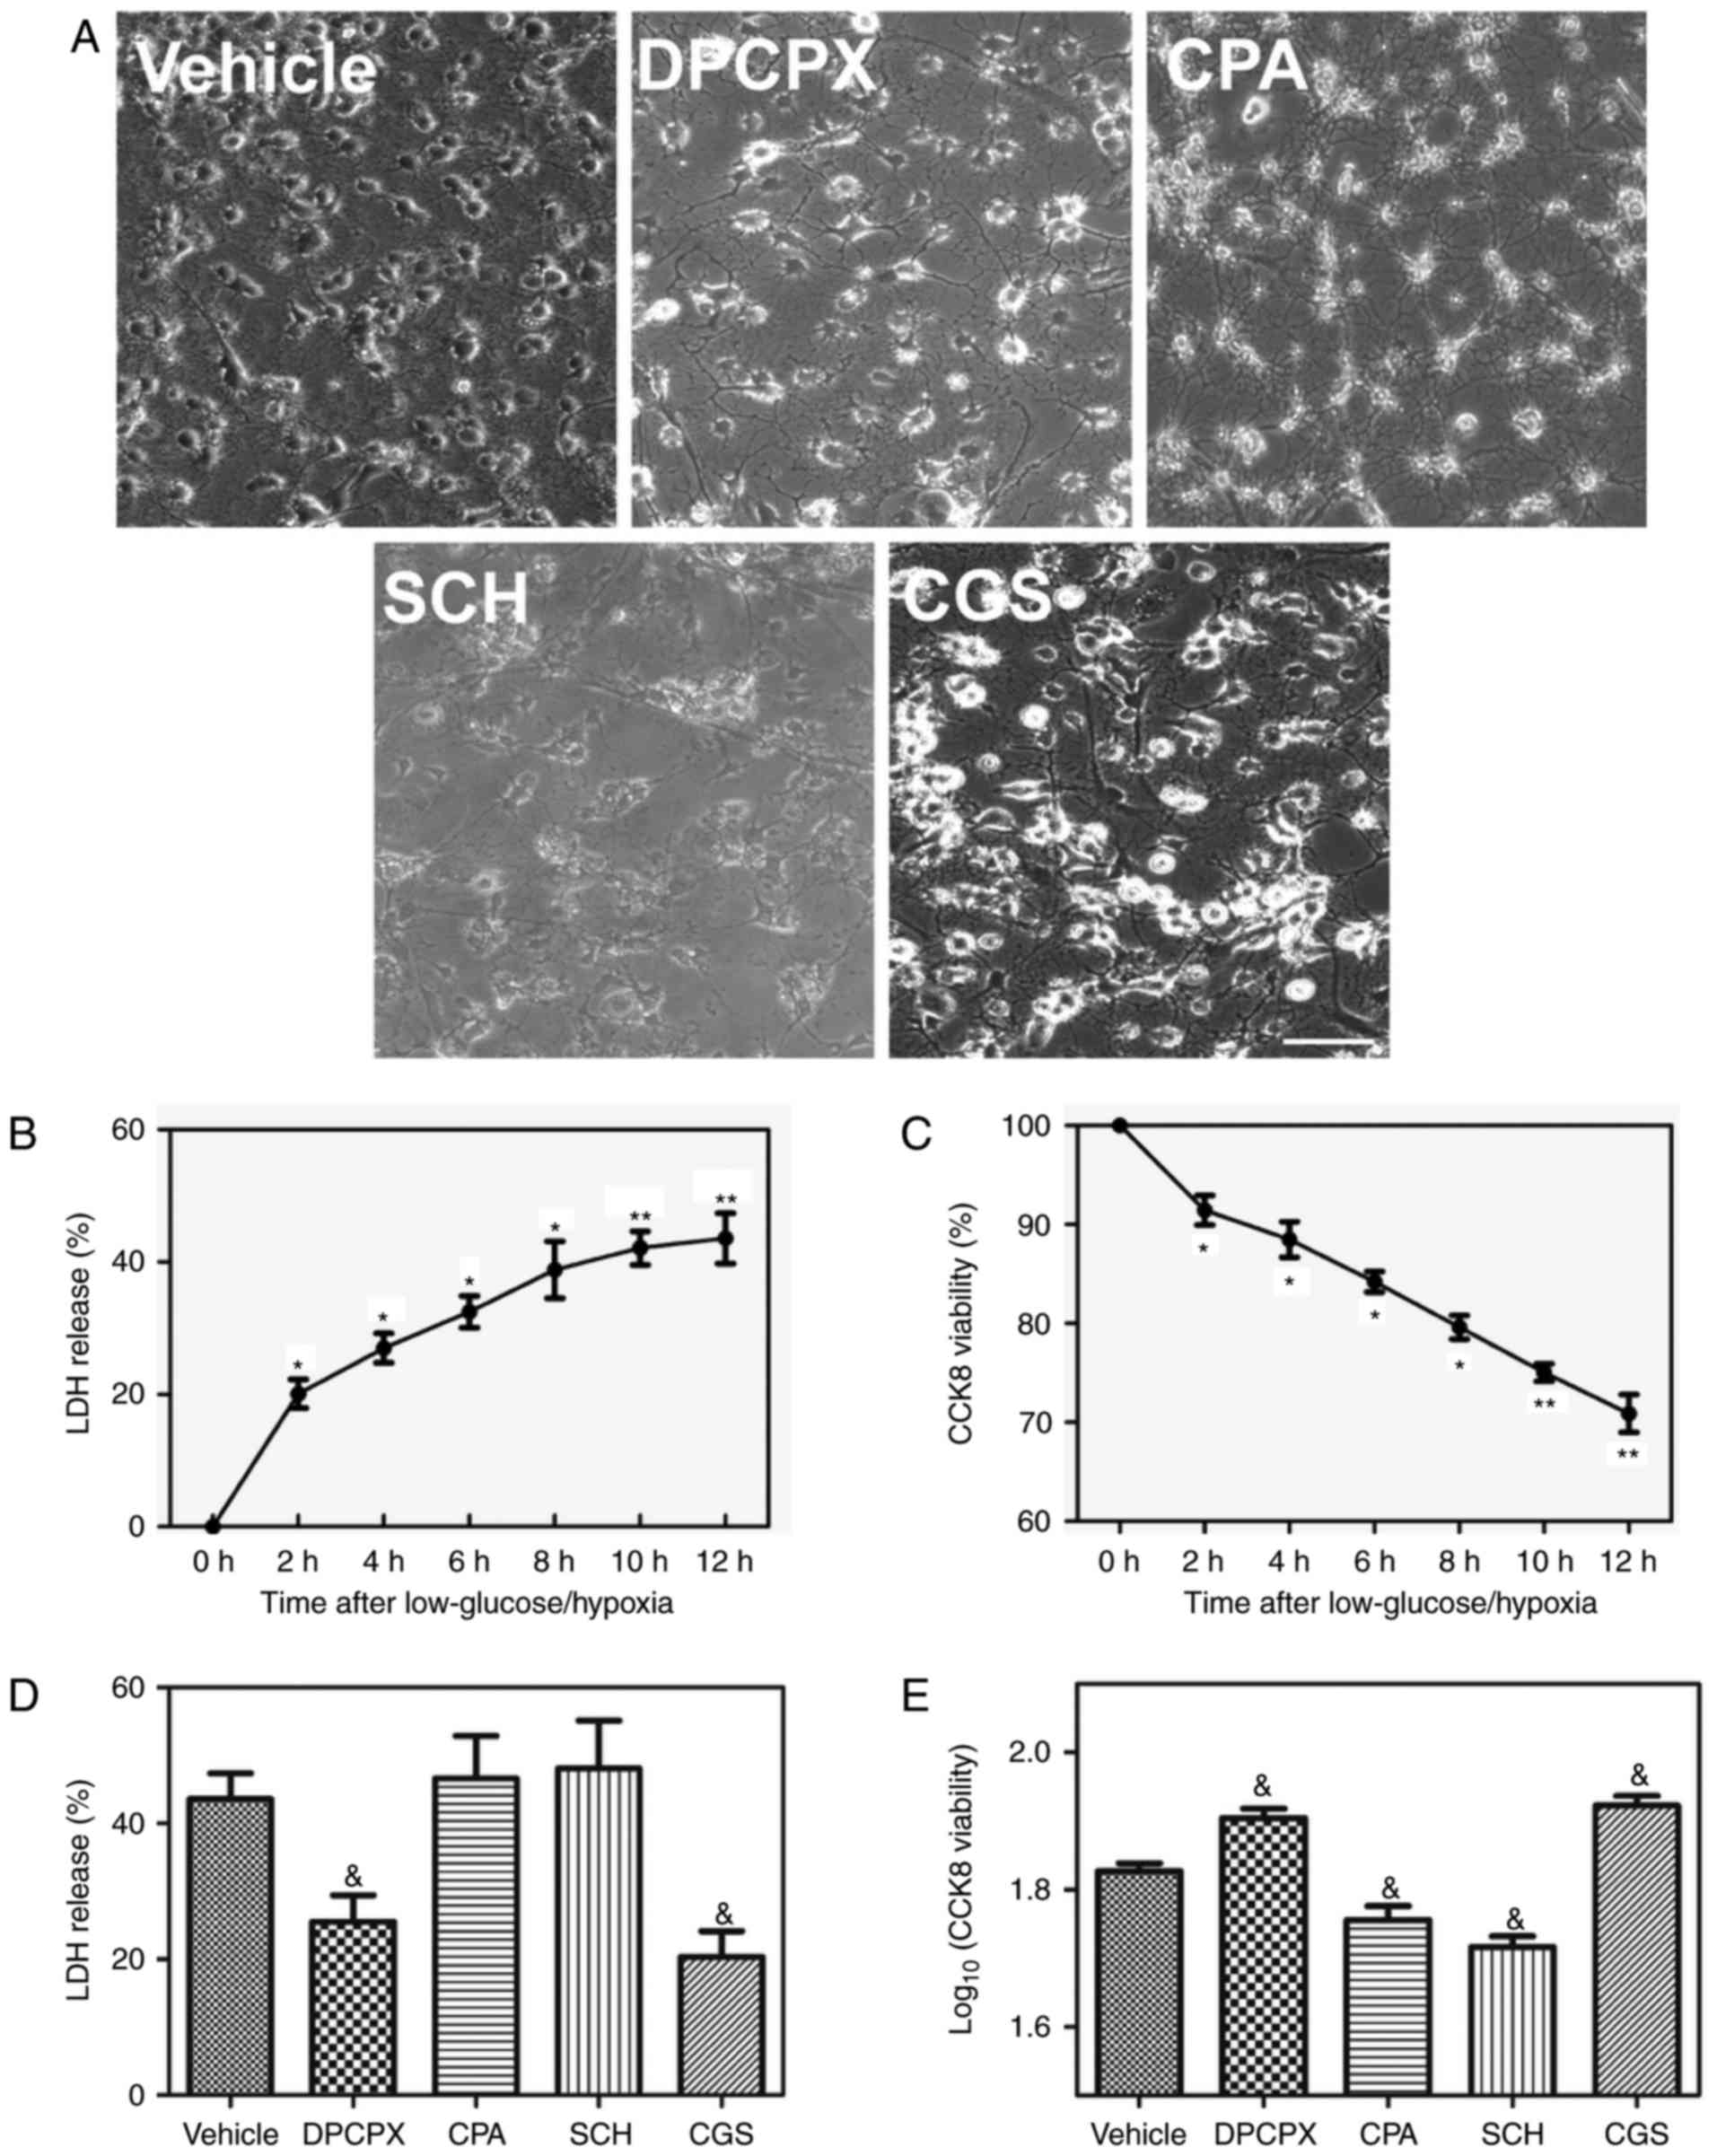 | Figure 4Effects of A1R and A2aR on
oligodendrocyte damage. (A) Phase-contrast microscopy images of
oligodendrocyte cell morphology (magnification, ×200) after
exposure to A1R and A2aR agonists and antagonists. Changes in the
(B) LDH released and (C) CCK-8 assay-measured viability of
oligodendrocytes at 0, 2, 4, 6, 8, 10 and 12 h after exposure to
low glucose/hypoxia. (D) LDH release (E) viability of
oligodendrocytes after exposure to A1R and A2aR agonists and
antagonists (n=3/group). *P≤0.05, **P≤0.01
vs. the 0 h group; &P≤0.05 vs. the vehicle group.
A1R, adenosine A1 receptor; A2aR, adenosine A2a receptor; LDH,
lactate dehydrogenase; CCK-8, Cell Counting Kit-8. |
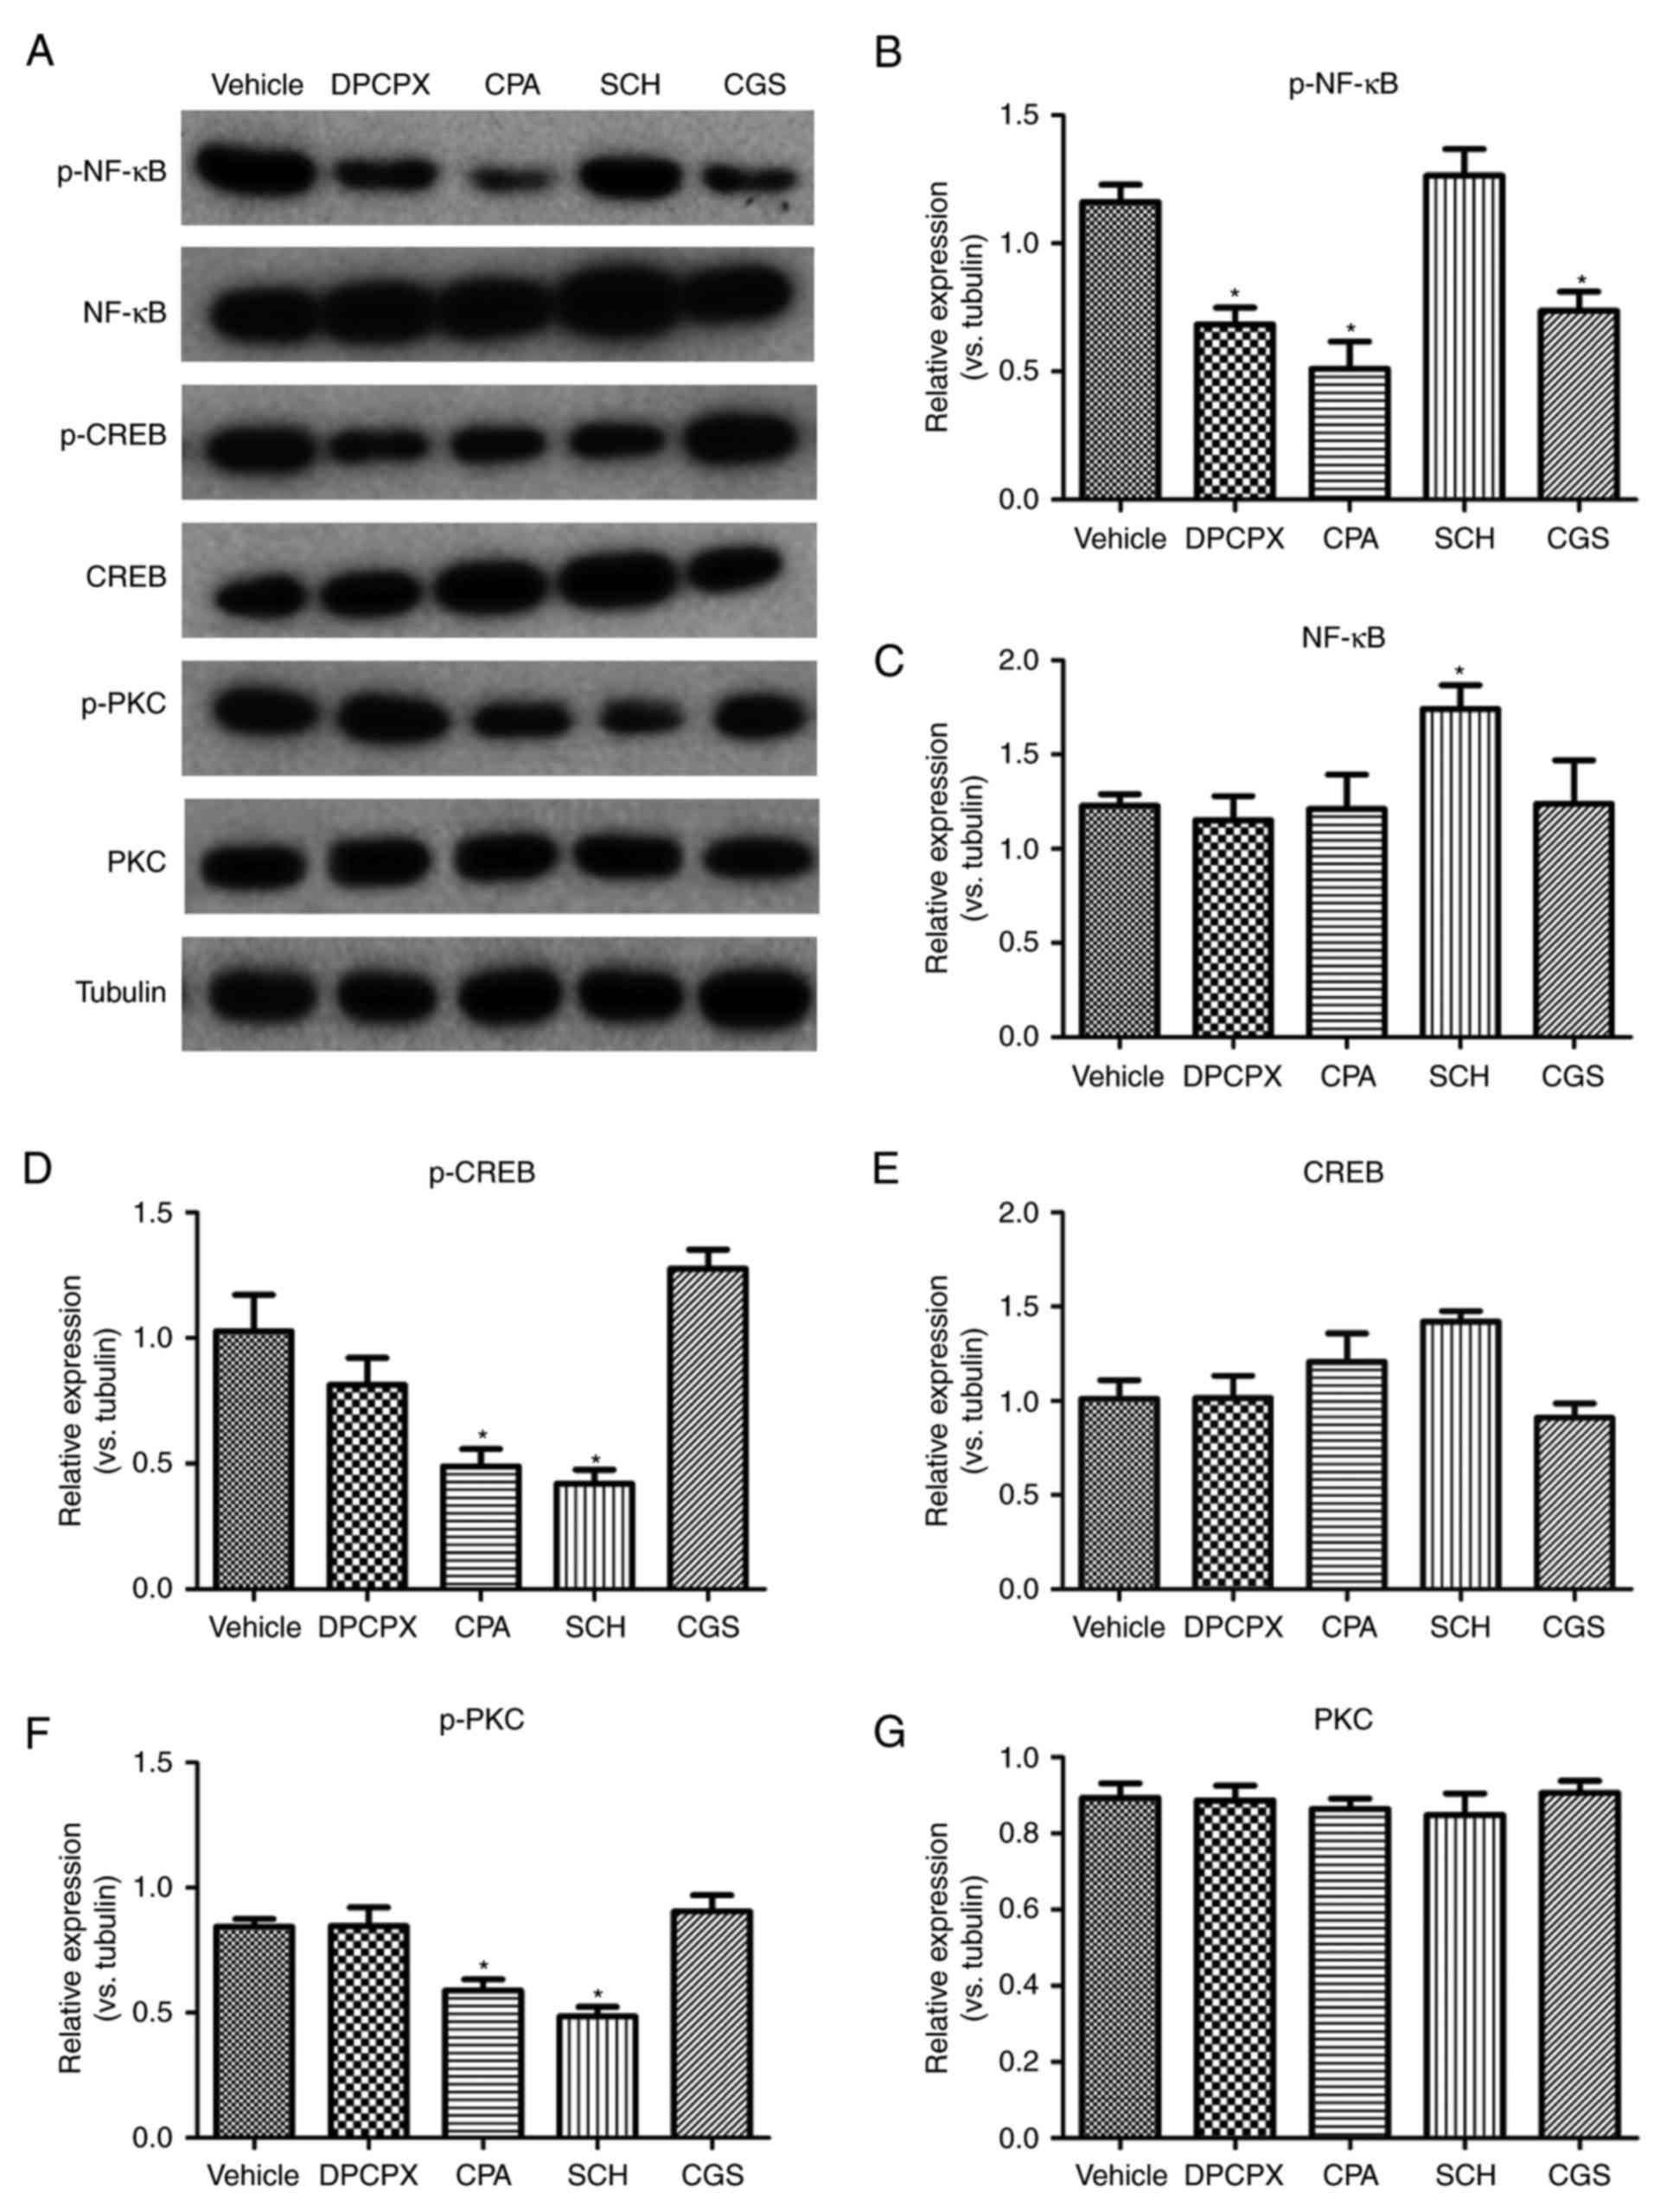
NF-κB and CREB are involved in the
effects of the interaction between A1R and A2aR
NF-κB and CREB are critical transcriptional
regulators of inflammation. Thus, whether an A1R-A2aR imbalance
could affect the expression of NF-κB and CREB in microglia was
investigated (Fig. 5). Compared
with the vehicle group, inactivation of A1R by DPCPX and activation
of A2aR by CGS significantly reduced the phosphorylation of NF-κB
p65 (Fig. 5B). Paradoxically,
activation of A1R also significantly reduced the expression of
p-NF-κB (Fig. 5B). Inactivation
of A2aR by SCH significantly enhanced the expression of NF-κB but
not p-NF-κB (Fig. 5B and C).
Activation of A1R by CPA and inactivation of A2aR by SCH
significantly reduced the protein levels of p-PKC and p-CREB
(Fig. 5D and F). However, the
expression of PKC and CREB was not significantly changed by any of
the drugs (Fig. 5E and G).
Together, as illustrated in the schematic in
Fig. 6, an imbalanced elevation
of A1R and A2aR can result in the activation of microglia under low
glucose/hypoxia conditions. Low glucose/hypoxia induces the
phosphorylation of NF-κB p65 and CREB, promoting the release of
inflammatory cytokines and causing oligodendrocyte damage.
Therefore, rebalancing A1R-A2aR via the inactivation of A1R and
activation of A2aR may inhibit this microglia-mediated immune
cascade and prevent the damage of oligodendrocytes under low
glucose/hypoxia conditions.
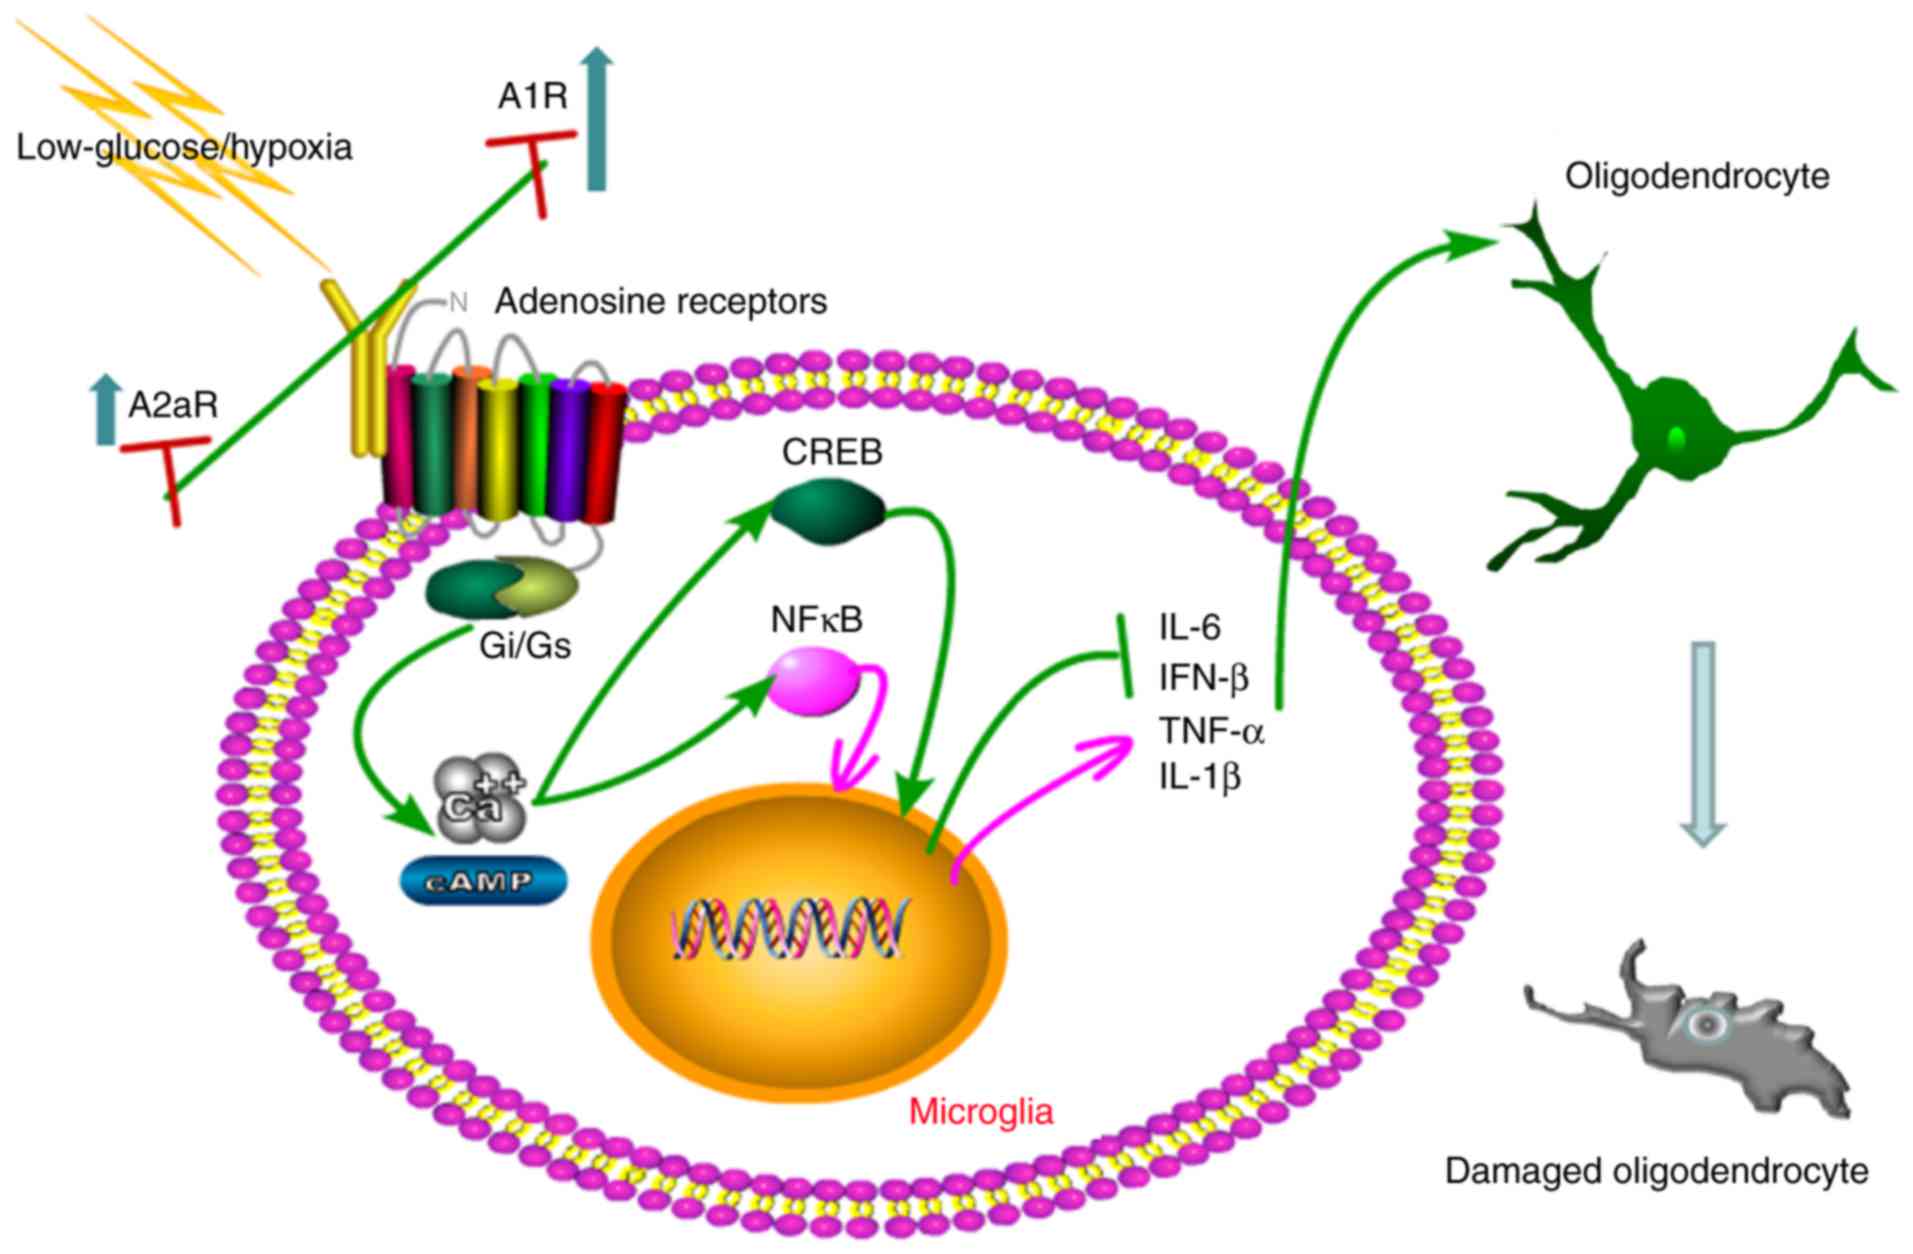 | Figure 6Schematic of the mechanisms by which
A1R-A2aR imbalance activates microglia and damages oligodendrocytes
under low glucose/hypoxia conditions. Low glucose/hypoxia
stimulation causes an imbalance in elevation of A1R and A2a, with
A1R levels increasing faster than A2aR levels. This imbalance
triggers activation of the microglia and the following immune
cascade. Mechanisms proposed to be involved include the
inflammatory modulation of adenosine receptors coupled to
Gi/Gs proteins. Overexpressed A1R activates
cAMP or Ca2+, promoting the phosphorylation of NF-κB p65
and CREB. Activation of these transcription factors regulates the
release of inflammatory cytokines from the microglia, causing
oligodendrocyte damage. A1R, adenosine A1 receptor; A2aR, adenosine
A2a receptor; NF, nuclear factor; cAMP, cyclic adenosine
monophosphate; CREB, cAMP response element binding protein; IL,
interleukin; IFN, interferon; TNF, tumor necrosis fact. |
Discussion
The present study investigated the role of A1R-A2aR
imbalance in low glucose/hypoxia-induced microglial activation. The
results indicated that an imbalance of A1R-A2aR serves an important
role in the onset of microglial activation and inflammation after
exposure to a low glucose/hypoxia in a NF-κB- and CREB-dependent
manner. In addition, an A1R antagonist and A2aR agonist were
applied to rebalance A1R-A2aR, which suppressed microglial
activation and exhibited anti-inflammatory activity. Taking into
account the results of our previous study, which identified that
A2aR in bone marrow-derived dendritic cells is an important
modulator of chronic cerebral hypoperfusion-induced WMLs (14), an A1R-A2aR imbalance may have
important consequences for neuroinflammation and serve a role in
the pathology of numerous CNS diseases.
The release of ATP in the brain serves an
irreplaceable role in recruiting and formatting microglia to mount
neuroinflam-matory responses after hypoxia (15). This response involves the
activation of different ATP purinergic 2 receptors, as well as ARs
(16). However, the distinct role
and interaction of these ARs remains unknown. The present study
demonstrated that the activation of A2aR inhibits A1R in microglia,
and vice versa. This antagonistic association between A1R and A2aR
has been identified in previous studies. For example, A2R inhibits
neutrophil adhesion to the endothelial layer, thereby blocking
inflammatory initiation, while A1R enhances this process (17). Activation of presynaptic A1R
suppresses excitatory transmission by reducing the probability of
release, whereas A2aR exerts a facilitating effect on synaptic
transmission by inhibiting A1R-mediated suppression (18). The neuromodulatory role of
adenosine relies on a balanced activation of inhibitory A1R and
facilitating A2aR (19). The
current study revealed that the activation of A2aR with CGS
attenuated inflammatory activity and improved oligodendrocyte
viability. However, certain studies have reported that inhibition
of A2aR alleviates the long-term burden of brain disorders in
different neurodegenerative and psychiatric conditions, including
ischemia, epilepsy, Parkinson's disease and Alzheimer's disease
(19,22,23). The distinct role of A2aR in
different pathological scenarios requires further study. By
contrast, A1R acts as a regulator that effectively controls
neurodegeneration if activated in the temporal vicinity of brain
damage (11,24). In the present study, the
upregulation of A1R was presumably responsible for the activation
of microglia. This in vitro finding is in agreement with the
results of a previous in vivo study of A1R−/−
mice with neonatal brain hypoxic ischemia (25). Intriguingly, pharmacological
preconditioning with an A1R agonist has been demonstrated to
suppress the cellular immune response through an A2aR-dependent
mechanism (26). These results
suggest that targeting A1R and A2aR is a promising approach for
researching and treating neuroinflammation.
The distinct effects of A1R and A2aR allude to
different mechanisms of control for microglial activation. This
mechanism may be similar to the process observed in neurons, in
which the interaction between A1R and A2aR modulates
neurotransmitter transporters via coupling to
Gi/Gs proteins (27,28). A1R and A2aR may closely interact
in such a way that the A1R is often inhibitory and couples to
Gi/Go proteins, while A2aR is usually coupled
to Gs proteins, enhancing cAMP accumulation and PKA
activity (29). Furthermore, the
present study revealed that the A1R antagonist DPCPX reduced the
phosphorylation of NF-κB p65, and the production of IL-1β and
TNF-α. Conversely, NF-κB has been reported to regulate A2aR gene
transcription through a mechanism involving IL-1β and TNF-α
(29). A2aR is able to enhance
CREB phosphorylation via raising cAMP levels. Furthermore, p-CREB
competitively binds with CREB binding protein, a ligand of NF-κB
p65, and inhibits NF-κB transcription (30). In addition, the NO/cyclic
guanosine monophosphate/protein kinase G/ATP-sensitive
K+ channel and the p38 mitogen-activated protein kinase
signaling pathways can modulate CREB and NF-kB expression,
insinuating a more complex signaling interaction between A1R and
A2aR (31-34). These data indicate that NF-κB and
CREB can be exploited as important nodes of the signaling network
for the dissection of the interaction between A1R and A2aR.
The present study had several limitations. Firstly,
a co-culture model of microglia and oligodendrocytes was used to
investigate the effects of microglial-derived inflammatory
cytokines on oligodendrocyte damage. However, an in vivo
study should be performed in the future. Secondly, despite an
association between A1R-A2aR imbalance and microglial activation
after low glucose/hypoxia being demonstrated in the current study,
the underlying mechanisms require elucidation. Thirdly, the
mechanisms of the production of inflammatory cytokines from
microglia are sophisticated and individualized; thus, additional
signaling pathways apart from NF-κB and CREB should be explored.
Lastly, A1R and A2aR have been reported to form complicated
tetrameric heteromers in astrocytes and neurons using
bioluminescence resonance energy transfer (BRET) and fluorescence
resonance energy transfer (FRET) methods (13,35). Thus, whether A1R-A2aR
heteromerization also occurs in microglia requires more direct
evidence by means of BRET or FRET in the future.
In conclusion, the present study demonstrated that
there is an imbalanced elevation of A1R-A2aR in microglia after
exposure to low glucose/hypoxia, which initiates the release of
inflammatory cytokines via modulation of NF-κB and CREB
phosphorylation, thus contributing to oligodendrocyte damage. These
results implicate an imbalance of A1R-A2aR in white matter
impairment-induced demyelinating diseases. Suppression of A1R and
activation of A2aR may be beneficial for rebalancing A1R-A2aR,
thereby providing novel therapeutic strategies for the treatment of
excessive nerve inflammation.
Acknowledgments
The present study was supported by the National
Natural Science Foundation of China (grant nos. 81171113 and
81571129) and the Natural Science Foundation of Chongqing (grant
no. CSTC 2011BA5012).
Notes
[1] Competing
interests
The authors declare that there are no competing
interests.
References
|
1
|
Kaur C and Ling EA: Periventricular white
matter damage in the hypoxic neonatal brain: Role of microglial
cells. Prog Neurobiol. 87:264–280. 2009. View Article : Google Scholar : PubMed/NCBI
|
|
2
|
Pang Y, Campbell L, Zheng B, Fan L and Cai
Z: Rhodes P. Lipopolysaccharide-activated microglia induce death of
oligodengroctye progenitor cells and impede their development.
Neuroscience. 166:464–475. 2010. View Article : Google Scholar
|
|
3
|
Steinman L: No quiet surrender: Molecular
guardians in multiple sclerosis brain. J Clin Invest.
125:1371–1378. 2015. View
Article : Google Scholar : PubMed/NCBI
|
|
4
|
Mittelbronn M, Dietz K, Schluesener HJ and
Meyermann R: Local distribution of microglia in the normal adult
human central nervous system differs by up to one order of
magnitude. Acta Neuropathol. 101:249–255. 2001.PubMed/NCBI
|
|
5
|
Yenari MA, Kauppinen TM and Swanson RA:
Microglial activation in stroke: Therapeutic targets.
Neurotherapeutics. 7:378–391. 2010. View Article : Google Scholar : PubMed/NCBI
|
|
6
|
Yu Y, Yu Z, Xie M, Wang W and Luo X: Hv1
proton channel facilitates production of ROS and pro-inflammatory
cytokines in microglia and enhances oligodendrocyte progenitor
cells damage from oxygen-glucose deprivation in vitro. Biochem
Biophys Res Commun. Jul 1–2017.Epub ahead of print.
|
|
7
|
Espinoza-Rojo M, Iturralde-Rodríguez KI,
Chánez-Cárdenas ME, Ruiz-Tachiquín ME and Aguilera P: Glucose
transporters regulation on ischemic brain: Possible role as
therapeutic target. Cent Nerv Syst Agents Med Chem. 10:317–235.
2010. View Article : Google Scholar : PubMed/NCBI
|
|
8
|
Butt AM: ATP: A ubiquitous gliotransmitter
integrating neuron-glial networks. Semin Cell Dev Biol. 22:205–213.
2011. View Article : Google Scholar : PubMed/NCBI
|
|
9
|
Takenouchi T, Tsukimoto M, Iwamaru Y,
Sugama S, Sekiyama K, Sato M, Kojima S, Hashimoto M and Kitani H:
Extracellular ATP induces unconventional release of
glyceraldehyde-3-phosphate dehydrogenase from microglial cells.
Immunol Lett. 167:116–124. 2015. View Article : Google Scholar : PubMed/NCBI
|
|
10
|
Antonioli L, Blandizzi C, Pacher P and
Haskó G: Immunity, inflammation and cancer: A leading role for
adenosine. Nat Rev Cancer. 13:842–857. 2013. View Article : Google Scholar : PubMed/NCBI
|
|
11
|
Serchov T, Clement HW, Schwarz MK,
Iasevoli F, Tosh DK, Idzko M, Jacobson KA, de Bartolomeis A,
Normann C, Biber K and van Calker D: Increased signaling via
adenosine A1 receptors, sleep deprivation, imipramine, and ketamine
inhibit Depressive-like behavior via induction of Homer1a. Neuron.
87:549–562. 2015. View Article : Google Scholar : PubMed/NCBI
|
|
12
|
Di Virgilio F, Ceruti S, Bramanti P and
Abbracchio MP: Purinergic signalling in inflammation of the central
nervous system. Trends Neurosci. 32:79–87. 2009. View Article : Google Scholar : PubMed/NCBI
|
|
13
|
Cristóvão-Ferreira S, Navarro G,
Brugarolas M, Pérez-Capote K, Vaz SH, Fattorini G, Conti F, Lluis
C, Ribeiro JA, McCormick PJ, et al: A1R-A2AR heteromers coupled to
Gs and Gi/0 proteins modulate GABA transport into astrocytes.
Purinergic Signal. 9:433–449. 2013. View Article : Google Scholar
|
|
14
|
Ran H, Duan W, Gong Z, Xu S, Zhu H, Hou X,
Jiang L, He Q and Zheng J: Critical contribution of adenosine A2a
receptors in bone marrow-derived cells to white matter lesions
induced by chronic cerebral hypoperfusion. J Neuropathol Exp
Neurol. 74:305–318. 2015. View Article : Google Scholar : PubMed/NCBI
|
|
15
|
Burnstock G, Fredholm BB and Verkhratsky
A: Adenosine and ATP receptors in the brain. Curr Top Med Chem.
11:973–1011. 2011. View Article : Google Scholar : PubMed/NCBI
|
|
16
|
Rodrigues RJ, Tomé AR and Cunha RA: ATP as
a multi-target danger signal in the brain. Front Neurosci.
9:1482015. View Article : Google Scholar : PubMed/NCBI
|
|
17
|
He W, Mazumder A, Wilder T and Cronstein
BN: Adenosine regulates bone metabolism via A1, A2A, and A2B
receptors in bone marrow cells from normal humans and patients with
multiple myeloma. FASEB J. 27:3446–3454. 2013. View Article : Google Scholar : PubMed/NCBI
|
|
18
|
Seki Y, Kato TA, Monji A, Mizoguchi Y,
Horikawa H, Sato-Kasai M, Yoshiga D and Kanba S: Pretreatment of
aripiprazole and minocycline, but not haloperidol, suppresses
oligodendrocyte damage from interferon-γ-stimulated microglia in
co-culture model. Schizophr Res. 151:20–28. 2013. View Article : Google Scholar : PubMed/NCBI
|
|
19
|
Gomes CV, Kaster MP, Tomé AR, Agostinho PM
and Cunha RA: Adenosine receptors and brain diseases:
Neuroprotection and neurodegeneration. Biochim Biophys Acta.
1808:1380–1399. 2011. View Article : Google Scholar
|
|
20
|
Latini S and Pedata F: Adenosine in the
central nervous system: Release mechanisms and extracellular
concentrations. J Neurochem. 79:463–484. 2001. View Article : Google Scholar : PubMed/NCBI
|
|
21
|
Livak KJ and Schmittgen TD: Analysis of
relative gene expression data using real-time quantitative PCR and
the 2−ΔΔCT method. Methods. 25:402–408. 2001.
View Article : Google Scholar
|
|
22
|
Rudolphi KA, Schubert P, Parkinson FE and
Fredholm BB: Adenosine and brain ischemia. Cerebrovasc Brain Metab
Rev. 4:346–369. 1992.PubMed/NCBI
|
|
23
|
Boison D: Adenosine kinase, epilepsy and
stroke: Mechanisms and therapies. Trends Pharmacol Sci. 27:652–658.
2006. View Article : Google Scholar : PubMed/NCBI
|
|
24
|
Dauer W and Przedborski S: Parkinson's
disease: Mechanisms and models. Neuron. 39:889–909. 2003.
View Article : Google Scholar : PubMed/NCBI
|
|
25
|
Masino SA, Li T, Theofilas P, Sandau US,
Ruskin DN, Fredholm BB, Geiger JD, Aronica E and Boison D: A
ketogenic diet suppresses seizures in mice through adenosine A1
receptors. J Clin Invest. 121:2679–2683. 2011. View Article : Google Scholar : PubMed/NCBI
|
|
26
|
Winerdal M, Winerdal ME, Wang YQ, Fredholm
BB, Winqvist O and Adén U: Adenosine A1 receptors contribute to
immune regulation after neonatal hypoxic ischemic brain injury.
Purinergic Signal. 12:89–101. 2016. View Article : Google Scholar :
|
|
27
|
Naamani O, Chaimovitz C and Douvdevani A:
Pharmacological preconditioning with adenosine A1
receptor agonist suppresses cellular immune response by an
A2A receptor dependent mechanism. Int Immunopharmacol.
20:205–212. 2014. View Article : Google Scholar : PubMed/NCBI
|
|
28
|
Zhang P, Bannon NM, Ilin V, Volgushev M
and Chistiakova M: Adenosine effects on inhibitory synaptic
transmission and excitation-inhibition balance in the rat
neocortex. J Physiol. 593:825–841. 2015. View Article : Google Scholar : PubMed/NCBI
|
|
29
|
Fenton RA and Dobson JG Jr: Adenosine
A1 and A2A receptor effects on G-protein
cycling in beta-adrenergic stimulated ventricular membranes. J Cell
Physiol. 213:785–792. 2007. View Article : Google Scholar : PubMed/NCBI
|
|
30
|
Morello S, Ito K, Yamamura S, Lee KY,
Jazrawi E, Desouza P, Barnes P, Cicala C and Adcock IM: IL-1 beta
and TNF-alpha regulation of the adenosine receptor (A2A)
expression: Differential requirement for NF-kappa B binding to the
proximal promoter. J Immunol. 177:7173–7183. 2006. View Article : Google Scholar : PubMed/NCBI
|
|
31
|
Loram LC, Taylor FR, Strand KA, Harrison
JA, Rzasalynn R, Sholar P, Rieger J, Maier SF and Watkins LR:
Intrathecal injection of adenosine 2A receptor agonists reversed
neuropathic allodynia through protein kinase (PK)A/PKC signaling.
Brain Behav Immun. 33:112–122. 2013. View Article : Google Scholar : PubMed/NCBI
|
|
32
|
Yang Y, Wang H, Lv X, Wang Q, Zhao H, Yang
F, Yang Y and Li J: Involvement of cAMP-PKA pathway in adenosine
A1 and A2A receptor-mediated regulation of
acetaldehyde-induced activation of HSCs. Biochimie. 115:59–70.
2015. View Article : Google Scholar : PubMed/NCBI
|
|
33
|
Lima FO, Souza GR, Verri WJ Jr, Parada CA,
Ferreira SH, Cunha FQ and Cunha TM: Direct blockade of inflammatory
hypernociception by peripheral A1 adenosine receptors: Involvement
of the NO/cGMP/PKG/KATP signaling pathway. Pain. 151:506–515. 2010.
View Article : Google Scholar : PubMed/NCBI
|
|
34
|
Haack KK, Mitra AK and Zucker IH: NF-κB
and CREB are required for angiotensin II type 1 receptor
upregulation in neurons. PLoS One. 8:e786952013. View Article : Google Scholar
|
|
35
|
Ciruela F, Casadó V, Rodrigues RJ, Luján
R, Burgueño J, Canals M, Borycz J, Rebola N, Goldberg SR, Mallol J,
et al: Presynaptic control of striatal glutamatergic
neurotransmis-sion by adenosine A1-A2A receptor heteromers. J
Neurosci. 26:2080–2087. 2006. View Article : Google Scholar : PubMed/NCBI
|