Introduction
As a high-grade type and mesenchymally-derived bone
sarcoma (1), osteosarcoma (OS) is
the most prevalent primary bone cancer and the 8th most frequent
type of cancer affecting young patients (2). Being characterized by a high
malignant degree, rapid progression and a poor survival, OS
consists up to 15% of all solid extracranial cancers in patients
aged 15–19 years (3,4). Thus, it is necessary to identify
biomarkers involved in OS.
DNA repair gene RecQ protein-like 4 (RECQL4)
is overexpressed in OS, and its overexpression is related to
overall genomic instability (5).
Human epidermal growth factor receptor 2 (Her-2/neu)
expression can induce lung metastasis in OS and may be related to
gene amplification (6).
Overexpressed c-fos (FOS) and runt-related transcription
factor 2 (RUNX2) may play a role in OS; in particular,
RUNX2 expression may serve as a marker of chemotherapy
failure in patients with OS (7,8).
The cell cycle regulator, CDC5 cell division cycle 5-like
(CDC5L), is essential for the G2-M transition and may be
potential oncogene for the 6p12-p21 amplicon in OS (9). It has been reported that genes with
the function of transcription factors (TFs) can also play a role in
OS, such as Yin Yang 1 (YY1), which is expressed in the
early process of osteoblastic transformation and its detection may
be used as a promising diagnostic method in human OS (10). In addition, the TF osterix
(Osx) can suppress the lung migration of OS tumor cells;
thus, the expression of Osx may be implicated in the growth
and metastasis of OS (11).
There are also many studies which have investigated
the direct or indirect effect of microRNAs (miRNAs or miRs) on OS.
For example, by targeting matrix metalloprotease 13 (MMP13)
and B-cell CLL/lymphoma 2 (Bcl-2), miR-143 may be
involved in the lung metastasis of human OS cells and may thus be
used as a target in cancer therapy (12,13). In addition, downregulated
miR-199a-3p may function in the growth and proliferation of
OS cells; hence, restoring the function of miR-199a-3p may
contribute to the treatment of OS (14). By mediating
reversion-inducing-cysteine-rich protein with kazal motifs
(RECK), miR-21 plays an important role in regulating
cell invasion and migration in OS and may be a potential
therapeutic target (15). By
regulating c-Met and other genes, miR-34a can
function as a tumor suppressor gene and suppresses the pulmonary
metastasis of OS; thus, it may be a useful gene therapeutic agent
(16).
In 2012, Namløs et al (17) used global microarray analyses to
identify the differentially expressed miRNAs (DE-miRNAs) between OS
cell lines and normal bones, and obtained 177 DE-miRNAs. In this
study, using the same data by Namløs et al (17), we aimed to further screen the
differentially expressed genes (DEGs) and DE-miRNAs. The potential
functions of the DEGs were analyzed by Gene Ontology (GO) and Kyoto
Encyclopedia of Genes and Genomes (KEGG) pathway enrichment
analyses. Subsequently, the interaction associations of the
proteins encoded by the DEGs were investigated by protein-protein
interaction network (PPI) network and modules of PPI network. In
addition, the TF-DEG regulatory network, DE-miRNA-DEG regulatory
network and miRNA-function collaborative network were separately
constructed to obtain key DEGs and DE-miRNAs.
Data collection methods and analysis
Microarray data
The microarray of GSE28425 deposited by Namløs et
al (17) was downloaded from
Gene Expression Omnibus (GEO, http://www.ncbi.nlm.nih.gov/geo/), which included the
miRNA expression profile, GSE28423, and the mRNA expression
profile, GSE28424. Each of the expression profiles included a
collection of 19 OS cell lines and 4 normal bones. GSE28423 was
based on the platform of GPL8227 Agilent-019118 Human miRNA
Microarray 2.0 G4470B (Agilent Technologies Inc., Santa Clara, CA,
USA). GSE28424 was based on the platform of GPL13376 Illumina
HumanWG-6 v2.0 expression beadchip (Illumina, San Diego, CA, USA).
The OS samples were from a panel collected within EuroBoNeT and
from the Norwegian Radium Hospital. Meanwhile, normal bones were
from Capital Biosciences or from amputations of cancer patients at
the University College London and Norwegian Radium Hospital.
Screening of DEGs and DE-miRNAs
After GSE28425 was downloaded, the microarray data
was pre-processed using the limma package (18) in Bioconductor (http://www.bioconductor.org/packages/release/bioc/html/limma.html).
In brief, the pre-processing process included Background
Correction, Quantile Normalization and Probe Summarization. The
limma (linear models for microarray data) package (18) was used to analyze the DEGs and
DE-miRNAs between the OS cell lines and normal bones. The FDR (that
is, adjusted p-value) <0.05 and |log2fold-change (FC)| >1
were used as the cut-off criteria. Screening the tumor suppressor
(TS) gene (http://bioinfo.mc.vanderbilt.edu/TSGene/download.cgi)
(19) and tumor-associated gene
(TAG) (http://www.binfo.ncku.edu.tw/TAG/GeneDoc.php)
(20) databases, the DEGs
associated with tumors were screened and annotated.
Functional and pathway enrichment
analysis
GO provides controlled and structured vocabularies
which model biological process (BP), cell components (CC) and
molecular function (MF) (21).
KEGG is a database containing 16 main databases, roughly divided
into systems information, chemical information and genomic
information (22). GO functional
enrichment analyses, which involved the BP, MF and CC categories,
as well as KEGG pathway enrichment analyses were performed for the
DEGs and the DE-miRNAs. A p-value <0.05 was used as the cut-off
criterion.
PPI network and module construction
The interaction associations of the proteins encoded
by the DEGs were searched using STRING online software (http://string-db.org; v9.05) (23), and the combined score of >0.7
was used as the cut-off criterion. The PPI network was visualized
using Cytoscape software (http://www.cytoscape.org) (24). Modules of the PPI network were
screened using the ClusterOne plugin (25) in Cytoscape, and the significant
p-value of the modules were set to 1.1E-6.
TF-DEG regulatory network
construction
Human TF-gene regulatory pairs were downloaded from
the UCSC database (http://genome.ucsc.edu/) (26). The DEGs which can also function as
TFs and their target genes were then identified. Moreover,
Cytoscape software (24) was used
to visualize the the TF-DEG regulatory network.
DE-miRNA-DEG regulatory network
construction
By comparing the experimental validated miRNA-mRNA
pairs in the miRecords (http://www.mirecords.umn.edu) (27) and mirWalk (http://mirwalk.uni-hd.de/) (28) databases, pairs of DE-miRNAs from
the miRNA expression profile, GSE28423, and DEGs from the mRNA
expression profile, GSE28424, were obtained. The DE-miRNA-DEG pairs
should appear in either miRecords database or mirWalk database.
miRNA-function collaborative network
construction
According to the functional enrichment results of
the DE-miRNAs, the DE-miRNAs which targeted the genes involved in
one BP term were identified. Subsequently, miRNA-function
collaborative network was constructed. A p-value <0.01 was used
as the cut-off criterion.
Results
DEGs analysis
Compared with normal bones, there were 1,609 DEGs
(including 774 upregulated and 835 downregulated mRNAs) and 149
DE-miRNAs (including 76 upregulated and 73 downregulated miRNAs)
screened in the OS cell lines. The DEGs associated with tumors were
annotated and are listed in Table
I. Importantly, upregulated FOS-like antigen 1 (FOSL1)
also had the function of an oncogene.
 | Table IThe DEGs associated with tumors. |
Table I
The DEGs associated with tumors.
| Category | Oncogene | TSG | TAG |
|---|
| UP | CDC5L,
FOSL1, HMMR, AURKA, MLF1, CDK4,
MET, TRIO, NRAS, HOXA10, WHSC1,
PIK3CA | S100A2,
TUSC3, PAWR, LZTS1, YAP1,
GADD45GIP1, PTPRG, RND3, DFNA5,
HOXB13, BAI2, ZDHHC2, NF2,
BCL10, FANCG, AMH, RCN2, HLTF,
NME1, REV3L, DAPK3, FH, MEN1,
HECA, TRIM3, SCRIB, BRMS1,
EXTL3, SMARCB1, PCGF2 | TFAP2A,
BUB1, NKX3-1, DNMT3B, PMS1,
SHC1, YEATS4, FADD, C1QBP |
| DOWN | FGF20,
LYN, BCL6, TAL1, ESR1, WISP2,
LMO2, LCN2, LYL1 | HSD17B7,
PRODH, MAL, DUSP22, TSC22D1,
COL4A3, BAI3, BNIP3L, PER1,
PAEP, RASSF4, FOXC1, EXTL1,
ARHGAP20, CMTM5, NGFR, TXNIP,
NOTCH1, MRVI1, MTSS1, MTUS1,
PPAP2A, TCF4, ST5, PYHIN1,
PRKCD, TGFBR3, CBFA2T3, MT1G,
TSPAN32, RASSF2, CEBPA, LTF,
RARRES1, MAP4K1, BTG2, PLA2G2A,
ZBTB16, SYK, GPX3, PYCARD, H19,
PTPN6, C2orf40 | TAL2,
WISP3, STAT3, CBLB, NR4A2, LYST,
RGS2, FES, MGP |
Functional and pathway enrichment
analysis
The top 5 enriched GO functions in the BP, CC and MF
categories separately for the upregulated and downregulated genes
are listed in Table II. For the
upregulated genes, the enriched functions included cell cycle
(p=0), intracellular membrane-bounded organelle (p=0) and catalytic
activity (p=3.05E-10). For the downregulated genes, the enriched
functions included cell activation (p=0), extracellular region
(p=0) and carbohydrate derivative binding (p=1.55E-08).
| Table IIThe top 5 enriched GO functions in
BP, CC and MF categories, as well as the top 10 enriched KEGG
pathways separately for the upregulated and downregulated
genes. |
Table II
The top 5 enriched GO functions in
BP, CC and MF categories, as well as the top 10 enriched KEGG
pathways separately for the upregulated and downregulated
genes.
| Category | Term | Description | Gene no. | Gene symbol | p-value |
|---|
| UP_BP | GO:0007049 | Cell cycle | 133 | KPNA2,
UBE2C | 0 |
| GO:0000278 | Mitotic cell
cycle | 90 | CDCA3,
E2F7 | 2.22E-16 |
| GO:0022402 | Cell cycle
process | 108 | FAM83D,
SPC25 | 1.22E-15 |
| GO:0051301 | Cell division | 62 | UBE2C,
CDCA3 | 3.86E-14 |
| GO:0048285 | Organelle
fission | 52 | FAM83D,
SPC25 | 7.72E-14 |
| UP_CC | GO:0005622 | Intracellular | 611 | TFAP2A,
CBS | 0 |
| GO:0031981 | Nuclear lumen | 161 | CBS,
KPNA2 | 0 |
| GO:0043231 | Intracellular
membrane-bounded organelle | 509 | KPNA2,
JPH3 | 0 |
| GO:0044422 | Organelle part | 384 | SHROOM3,
UBE2C | 0 |
| GO:0044424 | Intracellular
part | 607 | FOXD1,
UBE2C | 0 |
| UP_MF | GO:0003824 | Catalytic
activity | 300 | PSAT1,
UBE2C | 3.05E-10 |
| GO:0016740 | Transferase
activity | 123 | PSAT1,
CCNB1 | 3.95E-09 |
| GO:0005515 | Protein
binding | 382 | TFAP2A,
CBS | 1.13E-07 |
| GO:0032549 | Ribonucleoside
binding | 115 | UBE2C,
KIF2C | 3.57E-06 |
| GO:0035639 | Purine
ribonucleoside triphosphate binding | 114 | SEPT3,
PTK7 | 4.27E-06 |
| DOWN_BP | GO:0001775 | Cell
activation | 104 | GRAP2,
IL12RB1 | 0 |
| GO:0001816 | Cytokine
production | 73 | STAT5B,
LIPA | 0 |
| GO:0002376 | Immune system
process | 252 | FGF20,
FCGR3A | 0 |
| GO:0002682 | Regulation of
immune system process | 153 | BLK,
CD200R1 | 0 |
| GO:0002684 | Positive regulation
of immune system process | 99 | FCGR3A,
GRAP2 | 0 |
| DOWN_CC | GO:0005576 | Extracellular
region | 191 | FGF20,
FCGR3A | 0 |
| GO:0005615 | Extracellular
space | 98 | CCL25,
APOC2 | 0 |
| GO:0005886 | Plasma
membrane | 316 | IL12RB1,
BLK | 0 |
| GO:0044421 | Extracellular
region part | 120 | IL12RB1,
BLK | 0 |
| GO:0044459 | Plasma membrane
part | 174 | OPRD1,
MAL | 0 |
| DOWN_MF | GO:0097367 | Carbohydrate
derivative binding | 29 | FGF7,
TLR2 | 1.55E-08 |
| GO:0005515 | Protein
binding | 417 | FGF20,
HMGN3 | 3.54E-08 |
| GO:0046983 | Protein
dimerization activity | 80 | ADD2,
APOC2 | 5.30E-08 |
| GO:0008307 | Structural
constituent of muscle | 13 | DMD,
MYL4 | 9.25E-08 |
| GO:0042803 | Protein
homodimerization activity | 55 | MZF1,
ADD1 | 1.31E-07 |
| UP_KEGG | 01100 | Metabolic
pathways | 89 | CBS,
PSAT1 | 1.14E-06 |
| 00100 | Steroid
biosynthesis | 7 | DHCR24,
SQLE | 2.02E-05 |
| 03040 | Spliceosome | 14 | CDC5L,
SMNDC1 | 0.003765459 |
| 03008 | Ribosome biogenesis
in eukaryotes | 10 | NXT2,
NMD3 | 0.005664746 |
| 00270 | Cysteine and
methionine metabolism | 6 | CBS,
DNMT3B | 0.007673661 |
| 00510 | N-Glycan
biosynthesis | 7 | TUSC3,
ALG10B | 0.009627025 |
| 00970 | Aminoacyl-tRNA
biosynthesis | 8 | MARS,
YARS | 0.011699718 |
| 00620 | Pyruvate
metabolism | 6 | ME1,
ACAT2 | 0.012824724 |
| 00290 | Valine, leucine and
isoleucine biosynthesis | 3 | BCAT1,
VARS, LARS | 0.014647016 |
| 01040 | Biosynthesis of
unsaturated fatty acids | 4 | PTPLA,
ELOVL5, PTPLB, SCD | 0.017934809 |
| DOWN_KEGG | 05150 | Staphylococcus
aureus infection | 21 | FCAR,
C3AR1 | 2.29E-12 |
| 04640 | Hematopoietic cell
lineage | 21 | IL4R,
CR1 | 4.15E-08 |
| 04145 | Phagosome | 27 | TLR2,
NOX1 | 4.14E-07 |
| 05140 | Leishmaniasis | 17 | CR1,
IFNGR1 | 9.79E-07 |
| 04060 | Cytokine-cytokine
receptor interaction | 36 | CCL25,
TNFSF8 | 3.76E-06 |
| 04380 | Osteoclast
differentiation | 22 | LILRA6,
NOX1 | 7.87E-06 |
| 04650 | Natural killer cell
mediated cytotoxicity | 22 | IFNGR1,
NFATC3 | 2.14E-05 |
| 04514 | Cell adhesion
molecules (CAMs) | 21 | MAG,
F11R | 4.77E-05 |
| 05310 | Asthma | 9 | MS4A2,
EPX | 4.91E-05 |
| 05416 | Viral
myocarditis | 14 | DMD,
SGCA | 6.63E-05 |
The top 10 enriched KEGG pathways separately for the
upregulated and downregulated genes are also listed in Table II. For the upregulated genes, the
enriched pathways included metabolic pathways (p=1.14E-06), steroid
biosyn-thesis (p=2.02E-05) and spliceosome (p=0.003765459). For the
downregulated genes, the enriched pathways included
cytokine-cytokine receptor interaction (p=3.76E-06) and osteoclast
differentiation (p=7.87E-06).
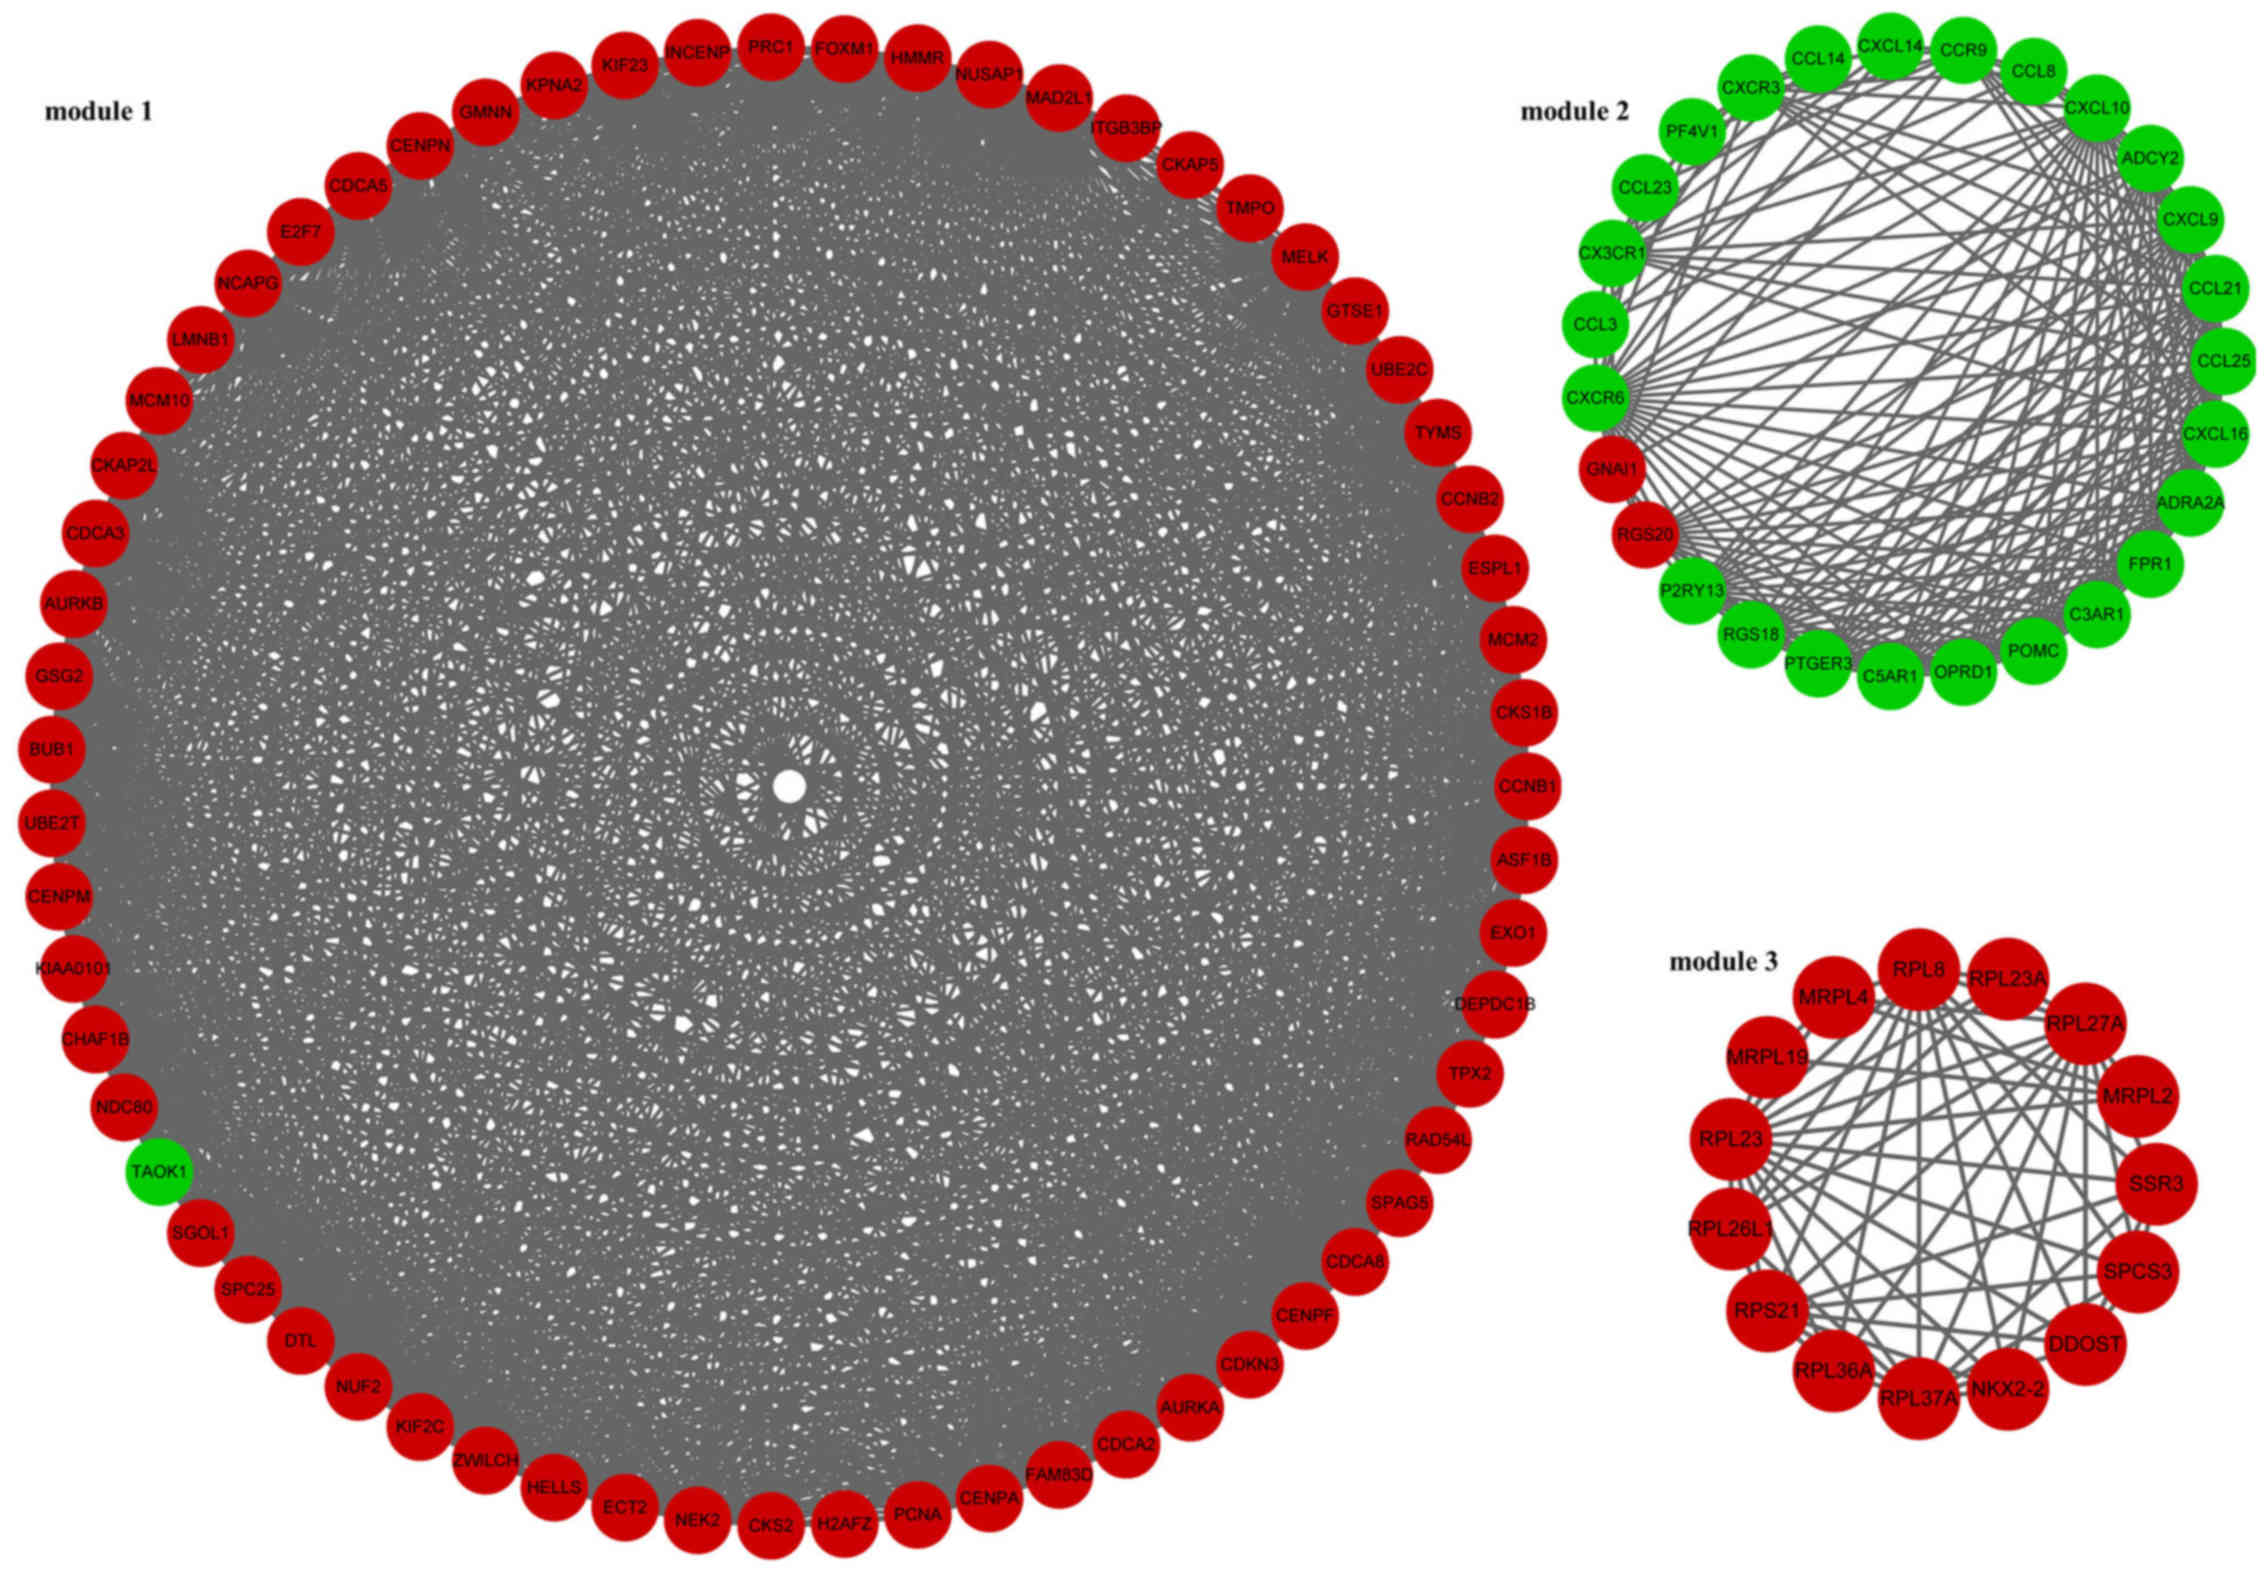
PPI network and module analysis
The PPI network of the DEGs had 844 nodes and 3,400
interactions. In particular, MAD2 mitotic arrest deficient-like 1
(MAD2L1, degree, 65), cyclin B1 (CCNB1, degree, 65) and aurora
kinase A (AURKA, degree, 64) had high degrees in the PPI network.
In addition, 3 modules (module 1, module 2 and module 3) of the PPI
network were screened (Fig. 1).
In module 1, TAO kinase 1 (TAOK1) was the only downregulated gene.
The enriched KEGG pathways for the DEGs in module 1 included oocyte
meiosis (p=2.04E-08), cell cycle (p=4.16E-08) and
progesterone-mediated oocyte maturation (p=0.000112373) (Table III). In module 2, guanine
nucleotide binding protein, α inhibiting 1 (GNAI1) and regulator of
G-protein signaling 20 (RGS20) were downregulated. The enriched
KEGG pathways for the DEGs in module 2 included chemokine signaling
pathway (p=0) and cytokine-cytokine receptor interaction
(p=9.77E-15) (Table III).
Furthermore, the DEGs involved in module 3 were all upregulated
genes. The enriched KEGG pathways for the DEGs in module 3 included
ribosome (p=1.26E-12) and protein processing in endoplasmic
reticulum (p=0.043084724) (Table
III).
| Table IIIThe enriched KEGG pathways for the
DEGs in module 1, module 2 and module 3 of the PPI network. |
Table III
The enriched KEGG pathways for the
DEGs in module 1, module 2 and module 3 of the PPI network.
| Term | Description | Gene no. | Gene symbol | p-value |
|---|
| Module 1 | 04114 | Oocyte meiosis | 7 | AURKA,
SGOL1 | 2.04E-08 |
| 04110 | Cell cycle | 7 | PCNA,
MCM2 | 4.16E-08 |
| 04914 |
Progesterone-mediated oocyte
maturation | 4 | CCNB2, BUB1,
MAD2L1, CCNB1 | 0.000112373 |
| 04115 | p53 signaling
pathway | 3 | CCNB2,
CCNB1,GTSE1 | 0.001071355 |
| 03430 | Mismatch
repair | 2 | PCNA,
EXO1 | 0.002163033 |
| 03030 | DNA
replication | 2 | PCNA,
MCM2 | 0.00526065 |
| Module 2 | 04062 | Chemokine signaling
pathway | 17 | ADCY2,
CX3CR1 | 0 |
| 04060 | Cytokine-cytokine
receptor interaction | 15 | CX3CR1,
CXCR6 | 9.77E-15 |
| 04080 | Neuroactive
ligand-receptor interaction | 7 | OPRD1,
P2RY13 | 9.93E-05 |
| 05150 | Staphylococcus
aureus infection | 3 | C3AR1,
FPR1,C5AR1 | 0.001547235 |
| 04916 | Melanogenesis | 3 | ADCY2, POMC,
GNAI1 | 0.008639105 |
| 04620 | Toll-like receptor
signaling pathway | 3 | CCL3, CXCL9,
CXCL10 | 0.008876016 |
| 04672 | Intestinal immune
network for IgA production | 2 | CCL25,
CCR9 | 0.017427247 |
| 04610 | Complement and
coagulation cascades | 2 | C3AR1,
C5AR1 | 0.034329309 |
| 04971 | Gastric acid
secretion | 2 | ADCY2,
GNAI1 | 0.039017822 |
| Module 3 | 03010 | Ribosome | 8 | RPL27A,
RPL37A | 1.26E-12 |
| 04141 | Protein processing
in endoplasmic reticulum | 2 | DDOST,
SSR3 | 0.043084724 |
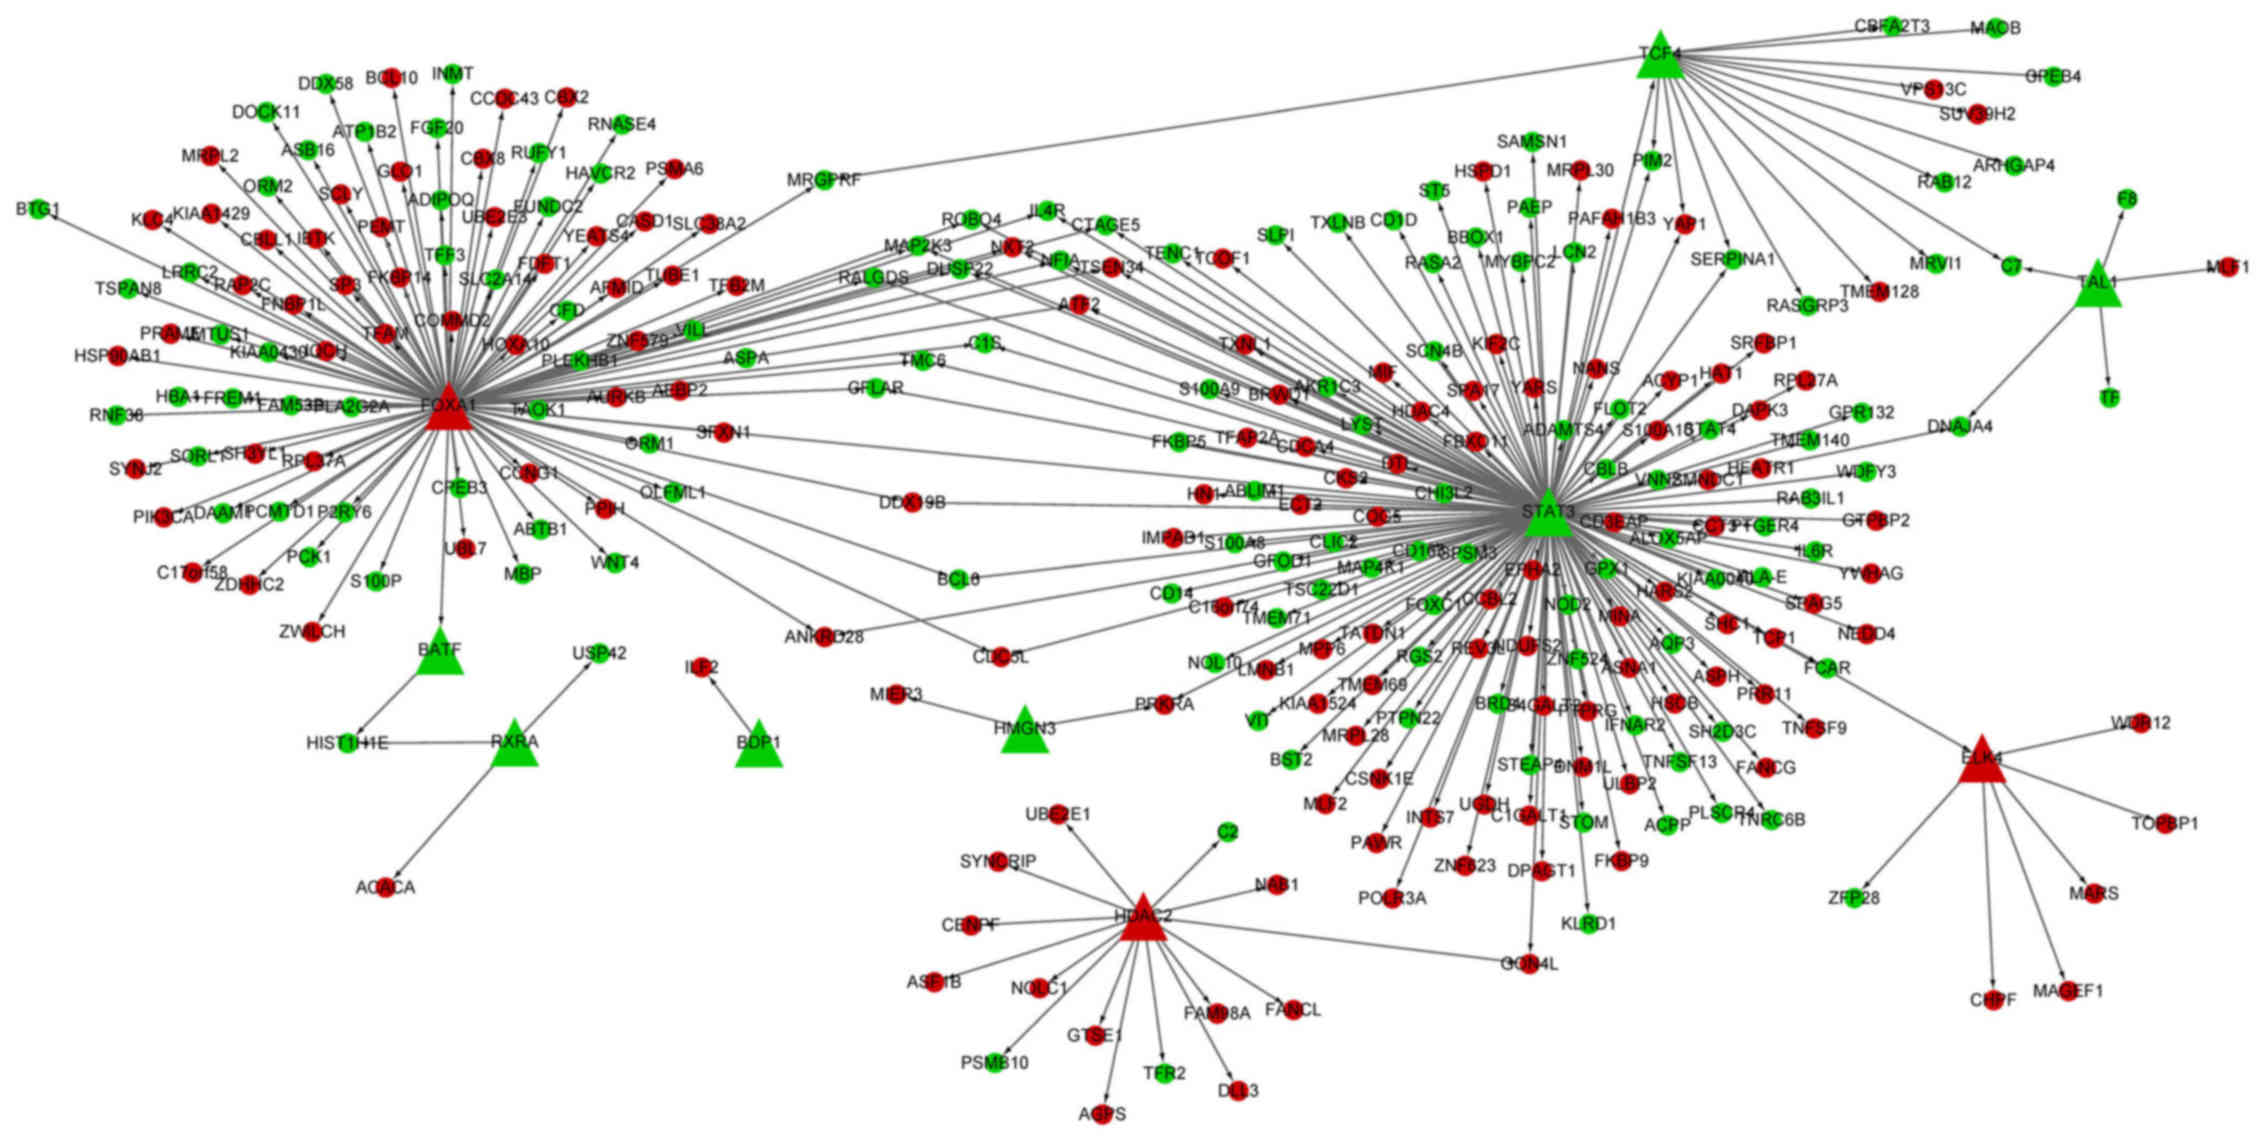
TF-DEG regulatory network analysis
The TF-DEG regulatory network had 311 interactions
(involving 10 transcription factors and 285 DEGs) (Fig. 2). Importantly, the TFs, signal
transducer and activator of transcription 3 (STAT3, degree,
158) and forkhead box A1 (FOXA1, degree, 106) targeted the
most DEGs.
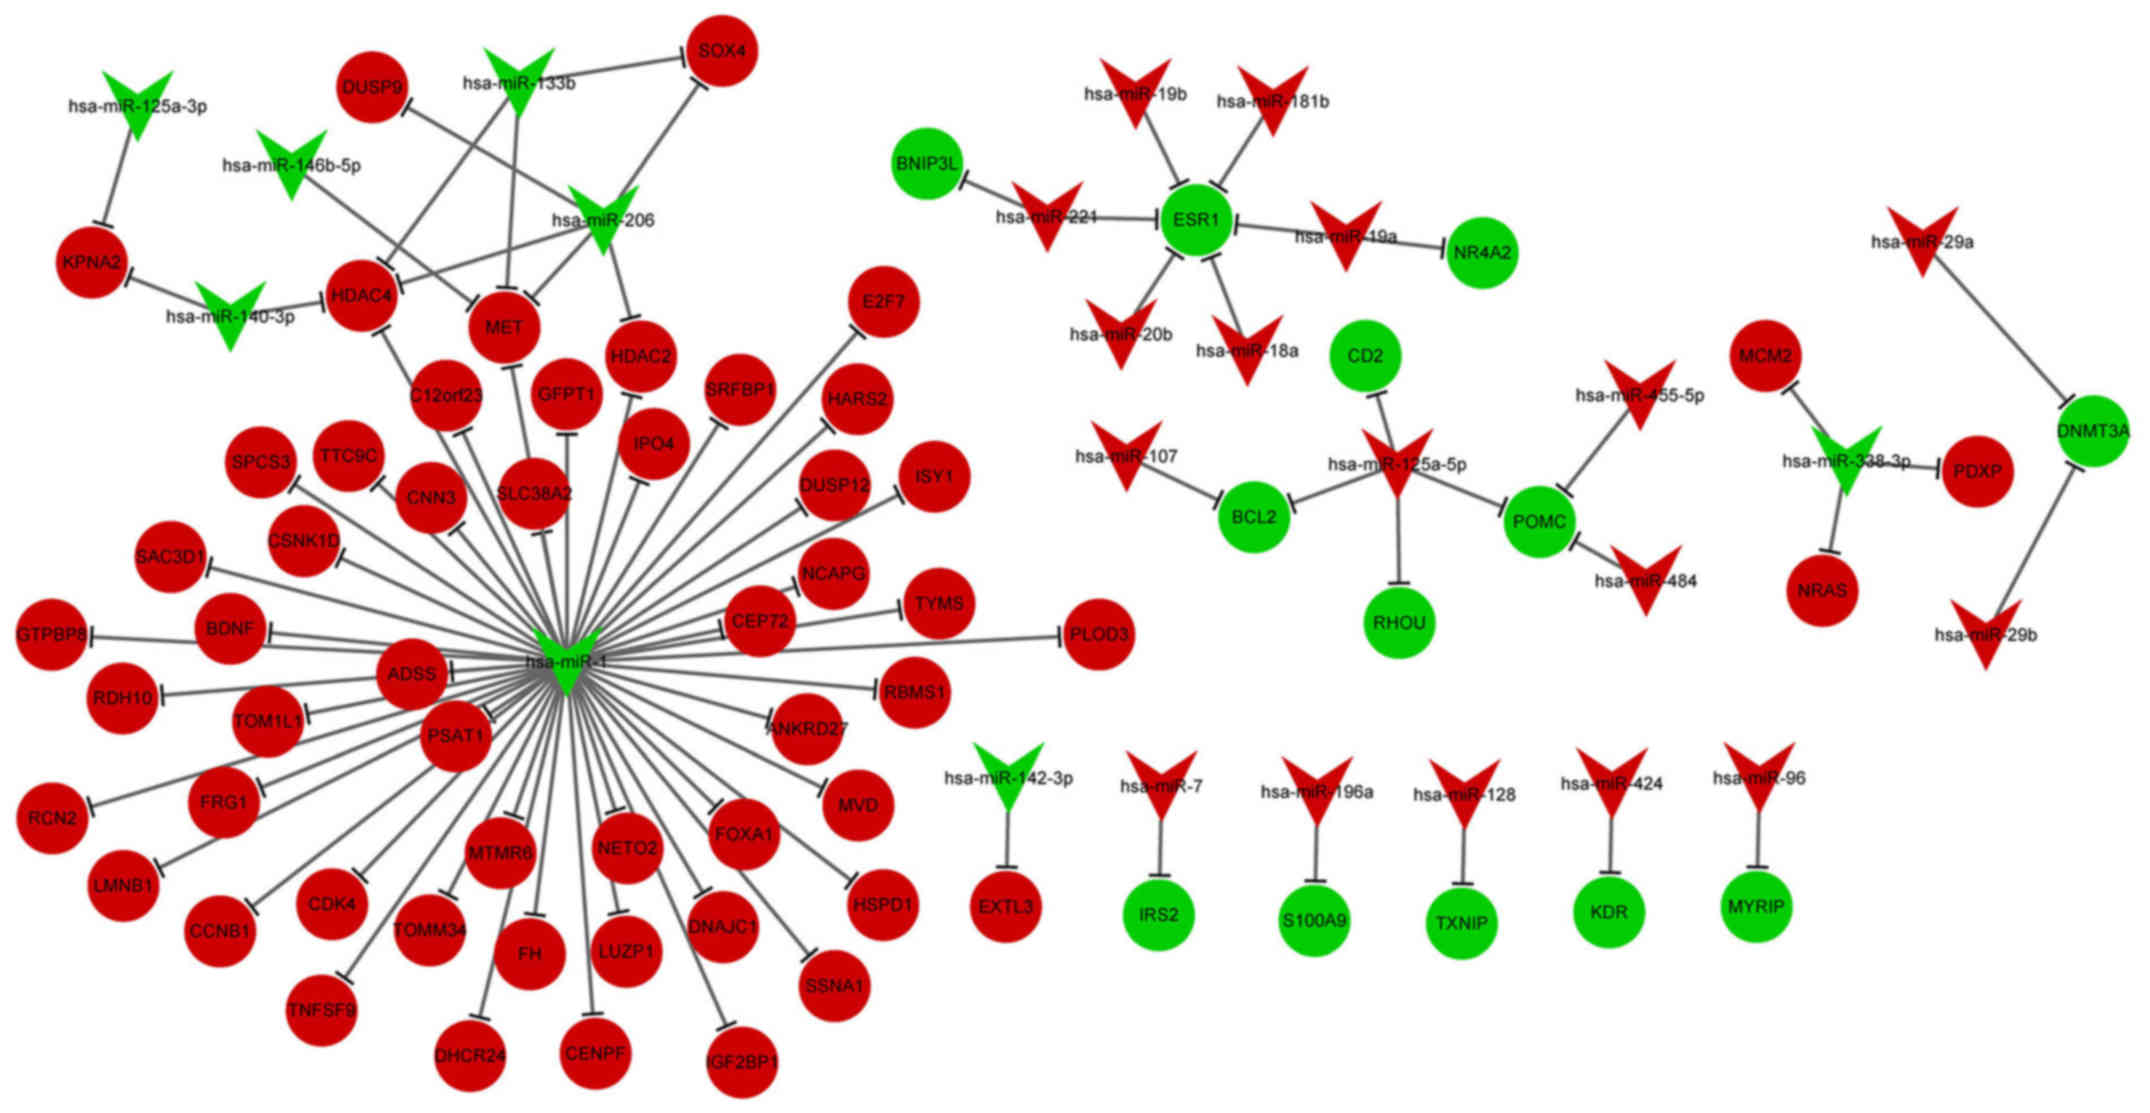
DE-miRNA-DEG regulatory network
analysis
The DE-miRNA-DEG regulatory network involved 23
upregulated miRNAs and 64 downregulated miRNAs (Fig. 3). In the DE-miRNA-DEG regulatory
network, downregulated miR-1 targeted and activated many
DEGs. Moreover, downregulated estrogen receptor 1 (ESR1) was
targeted by several high-expressed miRNAs, including miR-221,
miR-20b and miR-18a. The enriched GO functions for the upregulated
and downregulated miRNAs are listed in Table IV. For the upregulated miRNAs,
the enriched functions included positive regulation of retinoic
acid receptor signaling pathway (p=0.000211583) and type 1
metabotropic glutamate receptor binding (p=0.000150457). For the
downregulated miRNAs, the enriched functions included response to
inactivity (p=0.001989302) and potassium ion binding
(p=0.006643278).
| Table IVThe enriched GO functions for the
upregulated and downregulated miRNAs involved in the DE-miRNA-DEG
regulatory network. |
Table IV
The enriched GO functions for the
upregulated and downregulated miRNAs involved in the DE-miRNA-DEG
regulatory network.
| Category | Term | Description | miRNA no. | miRNA symbol | p-value |
|---|
| UP_BP | 0048386 | Positive regulation
of retinoic acid Receptor signaling pathway | 6 | miR-221,
miR-18a | 0.000211583 |
| 0060523 | Prostate epithelial
cord elongation | 6 | miR-20b,
miR-18a | 0.001058491 |
| 0060745 | Mammary gland
branching involved in pregnancy | 6 | miR-221,
miR-20b | 0.001196154 |
| 0001766 | Membrane raft
polarization | 2 | miR-125a-5p,
miR-128 | 0.002429205 |
| 0030885 | Regulation of
myeloid dendritic cell activation | 2 | miR-125a-5p,
miR-128 | 0.002429205 |
| 0030887 | Positive regulation
of myeloid dendritic cell activation | 2 | miR-125a-5p,
miR-128 | 0.002429205 |
| UP_MF | 0031798 | Type 1 metabotropic
glutamate receptor binding | 6 | miR-221,
miR-20b | 0.000150457 |
| 0030235 | Nitric-oxide
synthase regulator activity | 6 | miR-19b,
miR-20b | 0.000413057 |
| 0035256 | G-protein coupled
glutamate receptor binding | 6 | miR-19b,
miR-18a | 0.000413057 |
| 0030284 | Estrogen receptor
activity | 6 | miR-19a,
miR-18a | 0.002145221 |
| 0034056 | Estrogen response
element binding | 6 | miR-19b,
miR-19a | 0.003216968 |
| 0031779 | Melanocortin
receptor binding | 3 | miR-455-5p,
miR-125a-5p, miR-484 | 0.009585627 |
| 0031781 | Type 3 melanocortin
receptor binding | 3 | miR-455-5p,
miR-484, miR-125a-5p | 0.009585627 |
| DOWN_BP | 0014854 | Response to
inactivity | 4 | miR-133b,
miR-206 | 0.001989302 |
| 0014870 | Response to muscle
inactivity | 4 | miR-1,
miR-133b | 0.001989302 |
| 0014877 | Response to muscle
inactivity involved in regulation of muscle adaptation | 4 | miR-206,
miR-1 | 0.001989302 |
| 0014894 | Response to
denervation involved in regulation of muscle adaptation | 4 | miR-1,
miR-133b | 0.001989302 |
| 0002368 | B cell cytokine
production | 2 | miR-206,
miR-1 | 0.002474699 |
| 0002424 | T cell mediated
immune response to tumor cell | 2 | miR-1,
miR-206 | 0.002474699 |
| DOWN_ MF | 0005008 | Hepatocyte growth
factor-activated receptor activity | 4 | miR-133b,
miR-206 | 0.001415624 |
| 0030955 | Potassium ion
binding | 4 | miR-206,
miR-140-3p | 0.006643278 |
| 0031420 | Alkali metal ion
binding | 4 | miR-133b,
miR-1 | 0.007459611 |
| 0003688 | DNA replication
origin binding | 2 | miR-206,
miR-1 | 0.014287542 |
| 0031078 | Histone deacetylase
activity (H3-K14 specific) | 4 | miR-206,
miR-140-3p | 0.016613831 |
| 0032041 | NAD-dependent
histone deacetylase activity (H3-K14 specific) | 4 | miR-1,
miR-206 | 0.016613831 |
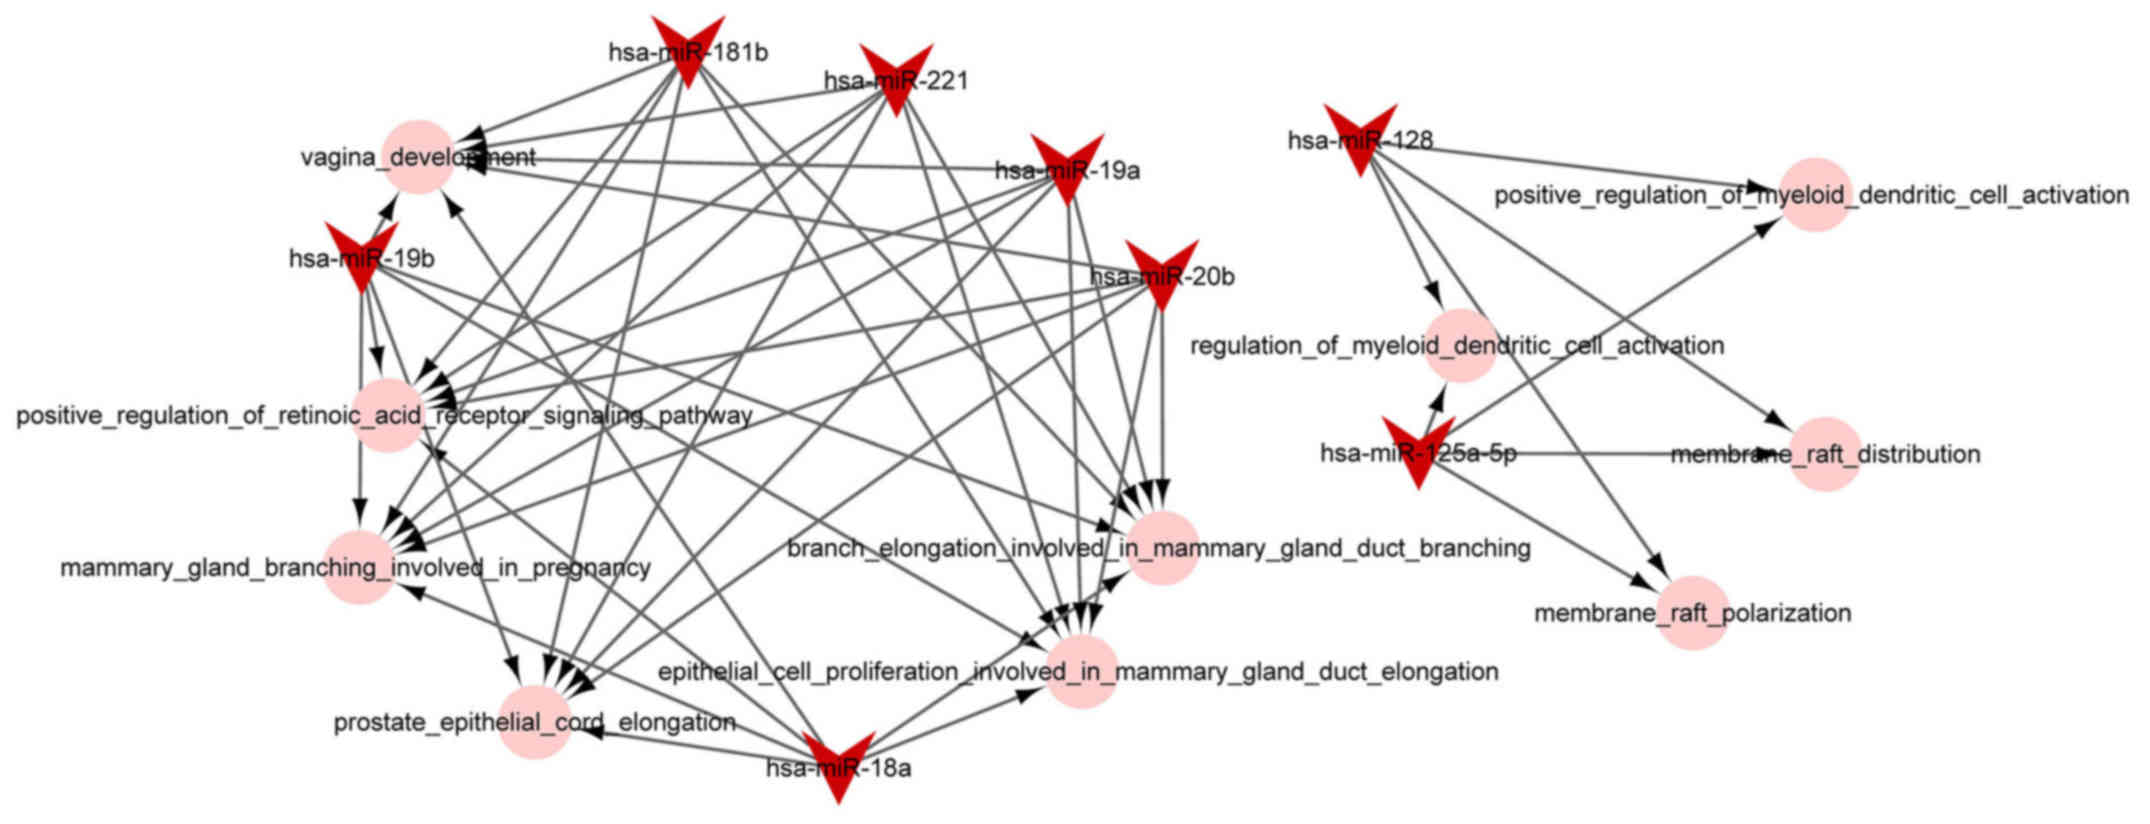
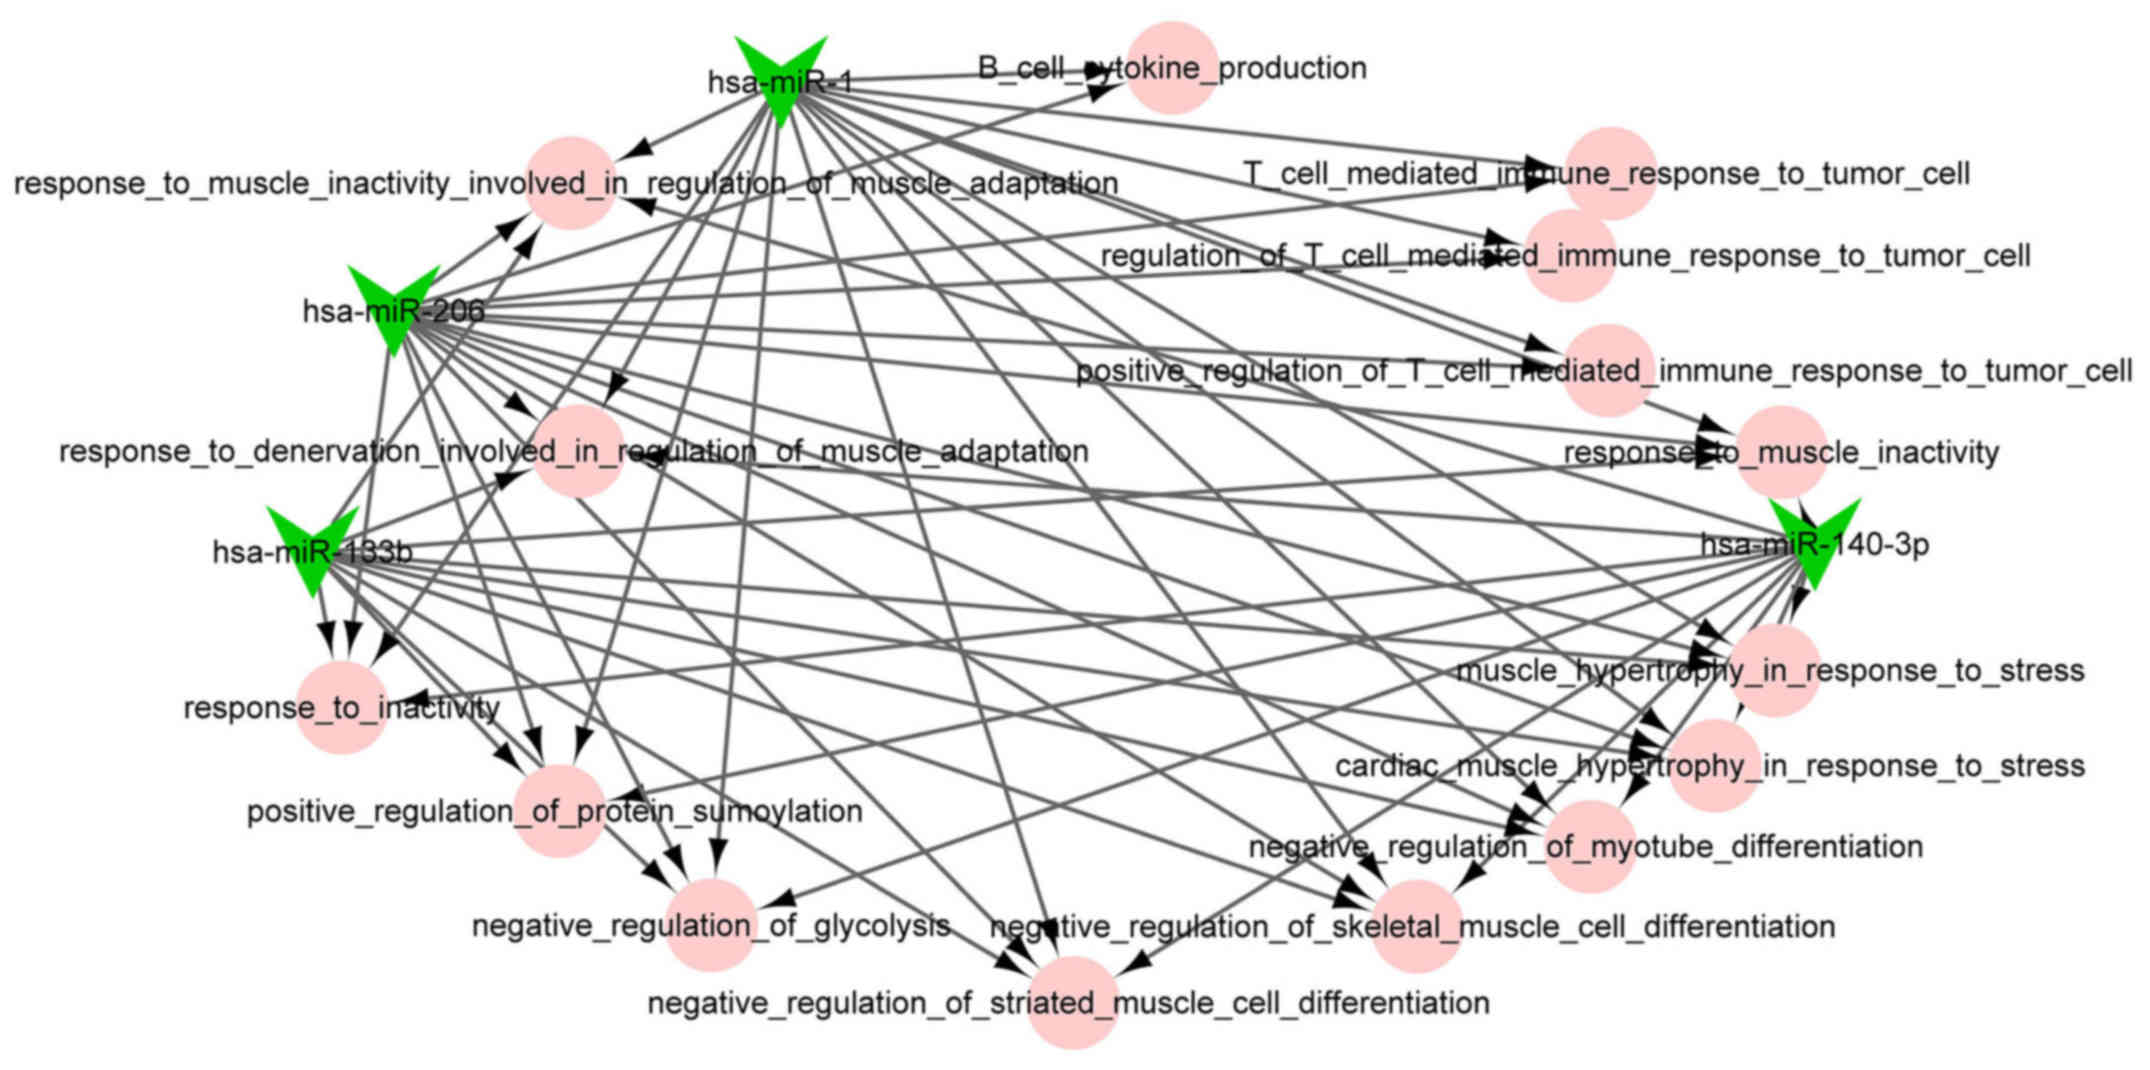
miRNA-function collaborative network
analysis
The miRNA-function collaborative networks of
upregulated (Fig. 4) and
downregulated (Fig. 5) miRNAs
were constructed, respectively. In the miRNA-function collaborative
networks of upregulated miRNAs, myeloid dendritic associated
functions were targeted by miR-128 and miR-125a-5p.
Discussion
In this study, we screened 1,609 DEGs (including 774
upregulated and 835 downregulated mRNAs) and 149 DE-miRNAs
(including 76 upregulated and 73 downregulated miRNAs) in the OS
cell lines compared with normal bones. Importantly, upregulated
FOSL1 also had the function of an oncogene. MAD2L1 (degree,
65) and AURKA (degree, 64) had higher degrees in the PPI network of
the DEGs. In the DE-miRNA-DEG regulatory network, downregulated
miR-1 targeted many DEGs and ESR1 were targeted by
several highly expressed miRNAs. Moreover, in the miRNA-function
collaborative networks of upregulated miRNAs, miR-128
targeted myeloid dendritic associated functions.
In the PPI network of the DEGs, MAD2L1 and AURKA
were with high degrees. The overexpression of Mad2 can induce early
dyscrasia, lung metastasis and poor survival in OS (29). The knockdown of Mad2 leads
to OS cell death through apoptosis associated with Rad21
cleavage; thus, Mad2 may serve as a target for cancer
therapy (30). AURKA can
promote cell cycle and suppress cell apoptosis, and the inhibition
of AURKA by specific short hairpin RNA (shRNA) may be a
promising therapeutic strategy of OS (31). Furthermore, in the TF-DEG
regulatory network, the TF, STAT3, targeted the most DEGs.
By binding to the promoter region of miR-125b and acting as
a transactivator, STAT3 regulates miR-125b which
serves as a potential target in the therapy of OS (32). The overexpression of
phosphorylated-STAT3 in OS cells is implicated in poor prognosis
and may function as a prognostic indicator and therapeutic target
for OS (33,34). These data suggest that
MAD2L1, AURKA and STAT3 may be closely
associated with OS.
Some other molecules have also been involved in OS.
The deregulation of miR-1 and miR-133b may correlate
with cell cycle and cell proliferation of OS by mediating c-met
(MET) protein expression (35).
Through directly regulating PTEN/AKT signaling, miR-128 functions
in the proliferation of human OS cells (36). The hypermethylation of p14ARF and
ESR1 separately correlates with the absence of metastases at
diagnoses and poor survival, therefore, p14ARF and ESR1
hypermethylation may be used as prognostic indicators for in OS
(37). In 143B OS cells,
phosphorylated and activated c-Jun and Fra-1 (also
known as FOSL1) can induce MMP1 gene expression which
may be a target for invasive and pulmonary metastases of OS,
therefore, phosphorylated c-Jun and Fra-1 may affect
invasion of OS through mediating MMP1 (38).
In conclusion, this study identified key genes or
miRNAs involved in OS. We screened 1,609 DEGs and 149 DE-miRNAs in
the OS cell lines compared with normal bones. Besides, some
molecules may correlate with OS, such as MAD2L1,
AURKA, STAT3, ESR1, FOSL1, miR-1
and miR-128. However, experimental researches are still
necessary to validate the functions of these molecules in OS.
References
|
1
|
Wittig JC, Bickels J, Priebat D, Jelinek
J, Kellar-Graney K, Shmookler B and Malawer MM: Osteosarcoma: A
multidisciplinary approach to diagnosis and treatment. Am Fam
Physician. 65:1123–1132. 2002.PubMed/NCBI
|
|
2
|
Ottaviani G and Jaffe N: The epidemiology
of osteosarcoma. Pediatric and Adolescent Osteosarcoma. Springer;
pp. 3–13. 2010
|
|
3
|
Stiller CA, Bielack SS, Jundt G and
Steliarova-Foucher E: Bone tumours in European children and
adolescents, 1978–1997. Report from the Automated Childhood Cancer
Information System project. Eur J Cancer. 42:2124–2135. 2006.
View Article : Google Scholar : PubMed/NCBI
|
|
4
|
Stiller CA, Craft AW and Corazziari I;
EUROCARE Working Group: Survival of children with bone sarcoma in
Europe since 1978: Results from the EUROCARE study. Eur J Cancer.
37:760–766. 2001. View Article : Google Scholar : PubMed/NCBI
|
|
5
|
Maire G, Yoshimoto M, Chilton-MacNeill S,
Thorner PS, Zielenska M and Squire JA: Recurrent RECQL4 imbalance
and increased gene expression levels are associated with structural
chromosomal instability in sporadic osteosarcoma. Neoplasia.
11:260–268. 2009. View Article : Google Scholar : PubMed/NCBI
|
|
6
|
Zhou H, Randall RL, Brothman AR, Maxwell
T, Coffin CM and Goldsby RE: Her-2/neu expression in osteosarcoma
increases risk of lung metastasis and can be associated with gene
amplification. J Pediatr Hematol Oncol. 25:27–32. 2003. View Article : Google Scholar : PubMed/NCBI
|
|
7
|
Sadikovic B, Thorner P, Chilton-Macneill
S, Martin JW, Cervigne NK, Squire J and Zielenska M: Expression
analysis of genes associated with human osteosarcoma tumors shows
correlation of RUNX2 overexpression with poor response to
chemotherapy. BMC Cancer. 10:2022010. View Article : Google Scholar : PubMed/NCBI
|
|
8
|
Gamberi G, Benassi MS, Bohling T,
Ragazzini P, Molendini L, Sollazzo MR, Pompetti F, Merli M,
Magagnoli G, Balladelli A, et al: C-myc and c-fos in human
osteosarcoma: Prognostic value of mRNA and protein expression.
Oncology. 55:556–563. 1998. View Article : Google Scholar : PubMed/NCBI
|
|
9
|
Lu XY, Lu Y, Zhao YJ, Jaeweon K, Kang J,
Xiao-Nan L, Ge G, Meyer R, Perlaky L, Hicks J, et al: Cell cycle
regulator gene CDC5L, a potential target for 6p12-21 amplicon in
osteosarcoma. Mol Cancer Res. 6:937–946. 2008. View Article : Google Scholar : PubMed/NCBI
|
|
10
|
de Nigris F, Botti C, de Chiara A,
Rossiello R, Apice G, Fazioli F, Fiorito C, Sica V and Napoli C:
Expression of transcription factor Yin Yang 1 in human
osteosarcomas. Eur J Cancer. 42:2420–2424. 2006. View Article : Google Scholar : PubMed/NCBI
|
|
11
|
Cao Y, Zhou Z, de Crombrugghe B, Nakashima
K, Guan H, Duan X, Jia SF and Kleinerman ES: Osterix, a
transcription factor for osteoblast differentiation, mediates
antitumor activity in murine osteosarcoma. Cancer Res.
65:1124–1128. 2005. View Article : Google Scholar : PubMed/NCBI
|
|
12
|
Osaki M, Takeshita F, Sugimoto Y, Kosaka
N, Yamamoto Y, Yoshioka Y, Kobayashi E, Yamada T, Kawai A, Inoue T,
et al: MicroRNA-143 regulates human osteosarcoma metastasis by
regulating matrix metalloprotease-13 expression. Mol Ther.
19:1123–1130. 2011. View Article : Google Scholar : PubMed/NCBI
|
|
13
|
Zhang H, Cai X, Wang Y, Tang H, Tong D and
Ji F: microRNA-143, downregulated in osteosarcoma, promotes
apoptosis and suppresses tumorigenicity by targeting Bcl-2. Oncol
Rep. 24:1363–1369. 2010.PubMed/NCBI
|
|
14
|
Duan Z, Choy E, Harmon D, Liu X, Susa M,
Mankin H and Hornicek F: MicroRNA-199a-3p is downregulated in human
osteosarcoma and regulates cell proliferation and migration. Mol
Cancer Ther. 10:1337–1345. 2011. View Article : Google Scholar : PubMed/NCBI
|
|
15
|
Ziyan W, Shuhua Y, Xiufang W and Xiaoyun
L: MicroRNA-21 is involved in osteosarcoma cell invasion and
migration. Med Oncol. 28:1469–1474. 2011. View Article : Google Scholar
|
|
16
|
Yan K, Gao J, Yang T, Ma Q, Qiu X, Fan Q
and Ma B: MicroRNA-34a inhibits the proliferation and metastasis of
osteosarcoma cells both in vitro and in vivo. PLoS One.
7:e337782012. View Article : Google Scholar : PubMed/NCBI
|
|
17
|
Namløs HM, Meza-Zepeda LA, Barøy T,
Østensen IH, Kresse SH, Kuijjer ML, Serra M, Bürger H,
Cleton-Jansen AM and Myklebost O: Modulation of the osteosarcoma
expression phenotype by microRNAs. PLoS One. 7:e480862012.
View Article : Google Scholar : PubMed/NCBI
|
|
18
|
Smyth GK: Limma: linear models for
microarray data. Bioinformatics and computational biology solutions
using R and Bioconductor. Springer; pp. 397–420. 2005, View Article : Google Scholar
|
|
19
|
Zhao M, Sun J and Zhao Z: TSGene: A web
resource for tumor suppressor genes. Nucleic Acids Res.
41:D970–D976. 2013. View Article : Google Scholar :
|
|
20
|
Chen JS, Hung WS, Chan HH, Tsai SJ and Sun
HS: In silico identification of oncogenic potential of fyn-related
kinase in hepatocellular carcinoma. Bioinformatics. 29:420–427.
2013. View Article : Google Scholar
|
|
21
|
Boyle EI, Weng S, Gollub J, Jin H,
Botstein D, Cherry JM and Sherlock G: GO:TermFinder - open source
software for accessing Gene Ontology information and finding
significantly enriched Gene Ontology terms associated with a list
of genes. Bioinformatics. 20:3710–3715. 2004. View Article : Google Scholar : PubMed/NCBI
|
|
22
|
Kanehisa M, Goto S, Furumichi M, Tanabe M
and Hirakawa M: KEGG for representation and analysis of molecular
networks involving diseases and drugs. Nucleic Acids Res.
38:D355–D360. 2010. View Article : Google Scholar :
|
|
23
|
Franceschini A, Szklarczyk D, Frankild S,
Kuhn M, Simonovic M, Roth A, Lin J, Minguez P, Bork P, von Mering
C, et al: STRING v9.1: Protein-protein interaction networks, with
increased coverage and integration. Nucleic Acids Res.
41:D808–D815. 2013. View Article : Google Scholar :
|
|
24
|
Kohl M, Wiese S and Warscheid B:
Cytoscape: software for visualization and analysis of biological
networks. Data Mining in Proteomics. Springer; pp. 291–303.
2011
|
|
25
|
Nepusz T, Yu H and Paccanaro A: Detecting
overlapping protein complexes in protein-protein interaction
networks. Nat Methods. 9:471–472. 2012. View Article : Google Scholar : PubMed/NCBI
|
|
26
|
Fujita PA, Rhead B, Zweig AS, Hinrichs AS,
Karolchik D, Cline MS, Goldman M, Barber GP, Clawson H, Coelho A,
et al: The UCSC genome browser database: Update 2011. Nucleic Acids
Res. 39:D876–D882. 2011. View Article : Google Scholar :
|
|
27
|
Xiao F, Zuo Z, Cai G, Kang S, Gao X and Li
T: miRecords: An integrated resource for microRNA-target
interactions. Nucleic Acids Res. 37:D105–D110. 2009. View Article : Google Scholar
|
|
28
|
Dweep H, Sticht C, Pandey P and Gretz N:
miRWalk - database: Prediction of possible miRNA binding sites by
'walking' the genes of three genomes. J Biomed Inform. 44:839–847.
2011. View Article : Google Scholar : PubMed/NCBI
|
|
29
|
Yu L, Liu S, Guo W, Zhang B, Liang Y and
Feng Q: Upregulation of Mad2 facilitates in vivo and in vitro
osteosarcoma progression. Oncol Rep. 28:2170–2176. 2012. View Article : Google Scholar : PubMed/NCBI
|
|
30
|
Yu L, Guo W, Zhao S, Tang J and Liu J:
Knockdown of Mad2 induces osteosarcoma cell apoptosis-involved
Rad21 cleavage. J Orthop Sci. 16:814–820. 2011. View Article : Google Scholar : PubMed/NCBI
|
|
31
|
Jiang Z, Jiang J, Yang H, Ge Z, Wang Q,
Zhang L, Wu C and Wang J: Silencing of Aurora kinase A by RNA
interference inhibits tumor growth in human osteosarcoma cells by
inducing apoptosis and G2/M cell cycle arrest. Oncol Rep.
31:1249–1254. 2014. View Article : Google Scholar : PubMed/NCBI
|
|
32
|
Liu LH, Li H, Li JP, Zhong H, Zhang HC,
Chen J and Xiao T: miR-125b suppresses the proliferation and
migration of osteosarcoma cells through downregulation of STAT3.
Biochem Biophys Res Commun. 416:31–38. 2011. View Article : Google Scholar : PubMed/NCBI
|
|
33
|
Ryu K, Choy E, Yang C, Susa M, Hornicek
FJ, Mankin H and Duan Z: Activation of signal transducer and
activator of transcription 3 (Stat3) pathway in osteosarcoma cells
and overexpression of phosphorylated-Stat3 correlates with poor
prognosis. J Orthop Res. 28:971–978. 2010.PubMed/NCBI
|
|
34
|
Wang YC, Zheng LH, Ma BA, Zhou Y, Zhang
MH, Zhang DZ and Fan QY: Clinical value of signal transducers and
activators of transcription 3 (STAT3) gene expression in human
osteosarcoma. Acta Histochem. 113:402–408. 2011. View Article : Google Scholar
|
|
35
|
Novello C, Pazzaglia L, Cingolani C, Conti
A, Quattrini I, Manara MC, Tognon M, Picci P and Benassi MS: miRNA
expression profile in human osteosarcoma: Role of miR-1 and
miR-133b in proliferation and cell cycle control. Int J Oncol.
42:667–675. 2013. View Article : Google Scholar
|
|
36
|
Shen L, Chen XD and Zhang YH: MicroRNA-128
promotes proliferation in osteosarcoma cells by downregulating
PTEN. Tumour Biol. 35:2069–2074. 2014. View Article : Google Scholar
|
|
37
|
Sonaglio V, de Carvalho AC, Toledo SR,
Salinas-Souza C, Carvalho AL, Petrilli AS, de Camargo B and Vettore
AL: Aberrant DNA methylation of ESR1 and p14ARF genes could be
useful as prognostic indicators in osteosarcoma. Onco Targets Ther.
6:713–723. 2013.PubMed/NCBI
|
|
38
|
Kimura R, Ishikawa C, Rokkaku T, Janknecht
R and Mori N: Phosphorylated c-Jun and Fra-1 induce matrix
metalloproteinase-1 and thereby regulate invasion activity of 143B
osteosarcoma cells. Biochim Biophys Acta. 1813:1543–1553. 2011.
View Article : Google Scholar : PubMed/NCBI
|