Introduction
Hepatocellular carcinoma (HCC) is the most common
type of primary liver tumor, accounting for ~80% of all cases, with
cholangiocarcinoma being the second most common (~10% of cases).
HCC is the fifth most common cancer type in the world and is
responsible for >600,000 deaths per annum (1). The majority of patients with HCC die
within 1 year of diagnosis. The disease is often diagnosed at a
late stage when potentially curative therapies are less effective.
For these patients, medical treatments, including chemotherapy,
chemoembolization, ablation and proton beam therapy, remain
ineffective. Most patients develop disease recurrence that rapidly
progresses to advanced stages with vascular invasion and multiple
intrahepatic metastases, and their 5-year survival rate is only 7%.
Although the prognosis of HCC patients with surgically resectable,
localized tumors is better, their 5-year survival rates have been
reported to only range from 15 to 39% (2).
Important factors for HCC development are, among
others, angiogenesis and signaling cascades regulating cell
proliferation such as the Raf/MAPK kinase/MAPK pathway, which is
activated in numerous hepatic carcinoma-derived cell lines and
tumor samples (3). Current
research on drug development aims at inhibition of the MAPK pathway
as exemplified by sorafenib (Sora), a potent Raf kinase inhibitor,
which causes tumor regression in HCC models and prolongs survival
in HCC patients (4).
Sora, an oral multiple kinase inhibitor, is the
first and only molecular targeted medicine approved by the U.S.
Food and Drug Administration (FDA) for advanced HCC, and it is now
a standard treatment. It significantly inhibits the activities of
multiple tyrosine and serine/threonine kinases, as well as tumor
angiogenesis, cell proliferation and apoptosis to exert its
anticancer activity (5). However,
in the clinic, Sora produces relatively low tumor response rates in
the majority of HCC patients and is beneficial in only ~30% of
patients (4).
Sora treatment has severe toxicity, leading to
adverse events including hand-foot skin reactions, diarrhea,
hyperbilirubinemia, fatigue, anorexia and gastrointestinal
bleeding. Even with treatment, the survival of certain patients is
short (6). Owing to these
toxicities, a large percentage of patients require a dose reduction
or termination of treatment (7).
In addition, in most patients who initially responded to Sora,
tumor recurrence and progression often occurred after a few months
of Sora therapy (8). Furthermore,
no alternative effective therapeutic regimens are available after
the failure of treatment with Sora. Modulation of the activity of
Sora, which may lessen its toxicity, is therefore a desirable
goal.
Certain natural products are excellent
chemotherapeutic and chemopreventive agents, and ~70% of the
current anti-cancer drugs are derived from natural products
(9,10). They tend to be well tolerated,
non-toxic, easily available and inex-pensive (11). It is well known that biologically
active natural produces may act synergistically with
chemotherapeutic drugs used in clinical applications. The aim of
the present study was to investigate the potential of natural
phenolic compounds (NPCs), including curcumin (Cur), quercetin
(Que), kaempherol (Kmf) and resveratrol (Rsv), in potentiating the
anticancer effects of the multikinase inhibitor Sora on hepatic
cancer cell lines, identify the best drug combinations and best
combination strategies to potentiate the anticancer effect of Sora
on hepatic cancer, and examine the possible mechanisms of
action.
Materials and methods
Cell culture
The hepatic cancer cell lines, Hep3b and HepG2 and
the normal human fibroblast cell line CRL1554 were obtained from
the American Type Culture Collection (Manassas, VA, USA). HepG2 and
Hep3b cells were grown in Eagle's minimal essential medium (EMEM;
Gibco; Thermo Fisher Scientific, Inc., Waltham, MA, USA) containing
10% fetal bovine serum (FBS; Gibco; Thermo Fisher Scientific, Inc.)
in a 5% CO2 incubator at 37°C. HepG2 cells, which were
originally thought to be a HCC cell line (12,13), have been misidentified and are
considered to be a hepatoblastoma cell line (14). CRL1554 cells were grown in
Dulbecco's modified Eagle's medium (DMEM; Gibco; Thermo Fisher
Scientific, Inc.) containing 10% FBS in a CO2 incubator
at 37°C. Penicillin/streptomycin (Sigma-Aldrich; Merck KGaA,
Darmstadt, Germany), gentamicin (Gibco; Thermo Fisher Scientific,
Inc.), L-glutamine (Fluka; Honeywell Labs, Muskegon, MI, USA) and
sodium hydrogen carbonate were added to all media during
preparation. The NPCs were all obtained from Sigma-Aldrich (Merck
KGaA) and included homoharringtonine (HHG), Kmf, Cur, Que, Rsv,
hesperetin (Hsp), betulinic acid (BetA), indol-3-carbinol (IC3),
coumarin (Cmr), sulanidac (Sul), irinotecan (Irt), lycopene (Lyp),
silibinin (Sil) and sinirgin (Snn).
Dose-dependent anti-proliferative effect
of a panel of NPCs on CRL1554 normal human fibroblasts
The growth inhibitory effects of a panel of 14 NPCs
(Kmf, Cur, Que, Rsv, HHG, Hsp, BetA, IC3, Cmr, Sul, Irt, Lyc, Sil
and Snn) on CRL1554 normal human fibroblast cells was determined by
an MTT assay. CRL1554 cells were seeded into 96-well flat-bottomed
plates at 27×103 cells/well and incubated at 37°C for 18
h. On the following day, the medium was removed, the cells were
washed with Hank's balanced salt solution (HBSS; 100
μl/well), and treated with various concentrations of NPCs
(20, 40, 60, 80, 100, 120, 140 and 160 μM) for 72 h. The
cells were then washed twice with HBSS and 100 μl medium
plus 20 μl MTT solution (5 mg/ml) in PBS was added to each
well, followed by incubation at 37°C for 4 h. The supernatants were
aspirated and 200 μl dimethyl sulfoxide was added to
dissolve the formazan crystals. Finally, the absorbance was
measured spectrophotometrically using a multiwell spectrophotometer
(Thermo/Lab-systems 352Multiskan MS Microplate Reader; Artisan
Technology Group, Champaign, IL, USA) at two wavelengths (λ=490 for
absorbance/detection and 650 nm as a reference wavelength).
Schedule-dependent anti-proliferative
effect of combined treatments with Sora and NPCs (Cur, Kmf, Que and
Rsv) on human hepatic cancer cell lines Hep3b and HepG2
To determine the schedule dependency of the combined
treatments with Sora and NPCs, Hep3b and HepG2 cells were seeded
into 96-well flat-bottomed plates at 27×103 cells/well
and incubated for 18 h. The medium was removed and the cells were
washed with HBSS (100 μl/well). For sequential treatments,
Sora (0.25-10 μM) was added and the cells were incubated at
37°C for 24 h. The next day, the plates were washed and an NPC
[Kmf, Cur or Que (60 or 120 μM) or Rsv (40 or 80 μM)]
was added, followed incubation at 37°C for 48 h.
For inverted sequential treatments, an NPC [Kmf, Cur
or Que (60 or 120 μM) or Rsv (40 or 80 μM)] was
added, followed by incubation at 37°C for 24 h. The next day, the
plates were washed and Sora (0.25-10 μM) was added, followed
by incubation for 48 h. For simultaneous treatments, Sora (0.25-10
μM) and an NPC [Kmf, Cur or Que (60 or 120 μM) or Rsv
(40 or 80 μM)] were added simultaneously, followed by
incubation at 37°C for 72 h. Cell growth was monitored as mentioned
above.
Cell cycle analysis
To investigate the detailed mechanism of the
underlying antiproliferative activity of Sora, Cur/Kmf and their
simultaneous combinations, flow cytometry was used to determine the
distribution of cells in the different cell cycle phases
(G0/G1, S and G2/M) by measuring
the DNA content of the nuclei labeled with propidium iodide (PI),
as described previously (15). In
brief, cells (2.5×10⁵ cells/well) were seeded into
24-well plates and incubated in a CO2 incubator at 37°C
for 18 h, followed by mono- or simultaneous combined treatment with
Sora (5 μM) and Cur or Kmf (200 and 400 μM) with
incubation at 37°C for 72 h. The cells were then processed using a
DNA-prep kit and a DNA-Prep EPICS workstation (Beckman Coulter,
Inc., Brea, CA, USA). In brief, the cells were treated with a
non-ionic detergent that was used as a cell membrane-permeabilizing
agent, followed by addition of PI and RNase A (Sigma-Aldrich; Merck
KGaA) and incubation at 15-20°C for 15 min. The cells were
re-suspended in binding buffer at a concentration of
3–10×106 cells/ml for optimal staining. Fluorescence was
measured with a flow cytometer (FC500; Beckman Coulter, Miami, FL,
USA), and the percentage of cells in the different cell cycle
phases was calculated using the phoenix statistical software
package, advanced DNA cell cycle software, version 4, 0, 0,
307-MultiCycle for Windows (Phoenix Flow Systems, San Diego, CA,
USA).
Cell death analysis
DNA fragmentation assay
Induction of apoptosis was monitored using a DNA
fragmentation assay according to the manufacturer's instructions
(Abcam Apoptotic DNA Ladder Detection kit; Abcam, Cambridge, MA,
USA). In brief, cells were seeded into 24-well plates at
2.5×10⁵ cells/well and incubated in a CO2
incubator at 37°C for 18 h, followed by single and simultaneous
treatment with Cur or Kmf (200 and 400 μM) plus Sora (5
μM) and incubation at 37°C for 72 h. The cells were then
trypsinized, harvested, washed, pelleted and lysed with Tris + EDTA
lysis buffer (35 μl). Enzyme A Solution (RNase; 5 μl)
was added, followed by incubation at 37°C for 10 min. Enzyme B
Solution (proteinase; 5 μl) was then added, followed by
incubation at 50°C for 30 min. Ammonium acetate solution (5
μl) plus isopropanol (50 μl) were added to each
sample, followed by incubation at -20°C for 10 min. Finally, the
DNA was pelleted at 13,000 x g, for 10 min at 4°C, washed with 0.5
ml 70% ethanol and suspended in 30 μl DNA suspension buffer.
The extracted DNA samples were loaded into a 1.2% agarose gel and
subjected to electrophoresis using running buffer containing 1.35
μg/ml ethidium bromide along with loading marker (1 kb DNA
Ladder) at 5 V/cm for 1 h. Ethidium bromide-stained DNA bands were
visualized using trans-illumination with ultraviolet light.
Annexin V-fluorescein isothiocyanate
(FITC) and PI double staining assay
The apoptotic cells were estimated by determing the
levels of phosphatidylserine on cell surface. HepG2 and Hep3b cells
were seeded into 24-well plates at 2.5×10⁵ cells/well
and incubated in a CO2 incubator at 37°C for 18 h. The
cells were then simultaneously treated with Cur and Kmf (200 or 400
μM) and Sora (5 μM) for 72 h, washed twice with HBSS,
harvested by trypsinization and washed. Finally, the cells were
double-stained using the Annexin V-FITC-FLOUS staining kit
according to manufacturer's instructions (Roche Diagnostics GmbH,
Mannheim, Germany). In brief, Annexin V-FLOUS labeling solution
containing Annexin V-FITC and PI (100 μl) was added to
treated and control cell groups, followed by incubation at 15-20°C
for 15 min. The cells (1×10⁶ cells/ml) were then
re-suspended in binding buffer and fluorescence was monitored by
flow cytometry (FC500; Beckman Coulter).
Mitochondrial membrane potential
(MMP)
The mitochondrial inner membrane is negatively
charged as it is rich in negatively charged glycoproteins. A large
accumulation of protons out of the inner membrane caused
transmembrane potential. The MMP was monitored by an NIR
Mitochondrial Membrane Potential Assay kit (Abcam) according to the
manufacturer's protocol. In brief, cells (2.5×10⁵
cells/well) were seeded into 24-well plates and incubated in a
CO2 incubator at 37°C for 18 h. The cells were
simultaneously treated with Cur or Kmf (200 or 400 μM) and
Sora (5 μM) for 72 h. MitoNIR Dye (200X, 5 μl/ml) was
added to each sample, followed by incubation at 37°C for 15-30 min.
Finally, the cells were pelleted and re-suspended in 1 ml assay
buffer, and the fluorescence intensity was monitored using flow
cytometry in the FL4 channel
(λExcitation/λEmission=635/660 nm).
Western blot analysis
The expression of genes associated with the control
of the cell cycle and apoptosis after mono- and simultaneous
combined treatment with Sora (5 μM) and Cur (200 or 400
μM) was monitored by western blot analysis. In brief,
whole-cell protein extraction was performed using the Mammalian
Cell & Tissue Extraction kit (BioVision, Milpitas, CA, USA)
according to the manufacturer's protocols. Protein concentrations
were determined using the Protein assay kit II (Bio-Rad
Laboratories, Inc., Hercules, CA, USA). Protein extracts (60
μg) were mixed with 2X Laemmli sample loading buffer and
loaded into gels (Criterion™ TGX Stain-free™ Precast gels; Bio-Rad
Laboratories, Inc.) along with Precision Plus Protein™ dual color
standards pre-stained marker (Bio-Rad Laboratories, Inc.) and
subjected to electrophoresis at 250 V for 25 min. The bands were
transferred onto low-fluorescence-polyvinylidene difluoride
membranes using the Trans Blot® Turbo™ system (Bio-Rad
Laboratories, Inc.) for 7 min, and the blots were checked using the
complementary imaging system and software (Image Lab™ version 5).
The membranes were washed 3 times for 5 min each with Tris-buffered
saline containing 0.05% Tween-20 (TBST) and the nonspecific binding
sites were blocked by incubating with 5% bovine serum
albumin-Tris-buffered saline Tween-20 buffer (BSA/TBST; Bio-Rad
Laboratories, Inc.) at 37°C for 1 h. The membranes were washed
again and incubated at 4°C overnight with the following primary
antibodies: Cyclin A2 rabbit monoclonal antibody (mAb) (E399; cat.
no. ab32498), cyclin B1 XP® rabbit mAb (D5C10, cat. no.
12231), cyclin D1 rabbit mAb (92G2; cat. no. 2978),
p27Kip1 XP® rabbit mAb (D69C12; cat. no.
3686), phospho-retinoblastoma protein (p-Rb), rabbit mAb (Ser780,
C84F6; cat. no. 3590), cleaved caspase-3, rabbit mAb (Asp175, 5A1E;
cat. no. 9664), cleaved caspase-9, rabbit mAb (Asp330, D2D4; cat.
no. 7237), B-cell lymphoma 2-associated X protein (Bax), rabbit mAb
(D2E11; cat. no. 5023), B-cell lymphoma extra-large protein
(Bcl-xL),rabbit mAb (54H6; cat. no. 2764) and β-actin rabbit mAb
(cat. no. 4967; Cell Signaling Technologies, Inc., Danvers, MA,
USA) at 1:1,000 dilution in 5% BSA-TBST. The membranes were washed
and incubated with horseradish peroxidase-conjugated rabbit
anti-mouse immunoglobulin G as the secondary antibody (Cell
Signaling Technologies, Inc.) at 1:2,000 dilutions in 5% BSA-TBST
at room temperature for 1 h. The membranes were washed in TBST and
stained using the Bio-Rad Clarity™ western enhanced
chemiluminescence substrate mixture (Bio-Rad Laboratories, Inc.; 6
ml peroxide solution + 6 ml of Luminol/enhance solution) in the
dark for 5 min. The bands were detected using the ChemiDoc™ MP
imaging system and Image Lab™ software, version 5 (Bio-Rad
Laboratories, Inc). Signal intensities of the respective bands were
quantified with a GS-800 calibrated imaging densitometer (Bio-Rad
Laboratories, Inc.).
Statistical analysis
Statistical analyses were performed using SPSS v. 23
(IBM Corp., Armonk, NY, USA) and the results are expressed as the
mean ± standard error of the mean. Statistical significance of
differences between the control and treated groups was determined
by one-way analysis of variance and Fisher's least-significant
differences test. P<0.05 was considered to indicate a
statistically significant difference between groups.
Results
Inhibition studies
Dose-dependent-anti-proliferative
effects of Sora and NPCs on CRL1554 normal human fibroblast
cells
To assess the potential growth inhibitory effect of
Sora and NPCs, CRL1554 normal human fibroblast cells were treated
with various concentrations of Sora (0.25-10 μM) and NPCs
(20-160 μM), including Kmf, Que, Rsv, Cur, Irt, Sil, Snn,
Sul, Lyp, Hsp, BetA, Cmr, I3C and HHG, for 72 h. Sora exhibited a
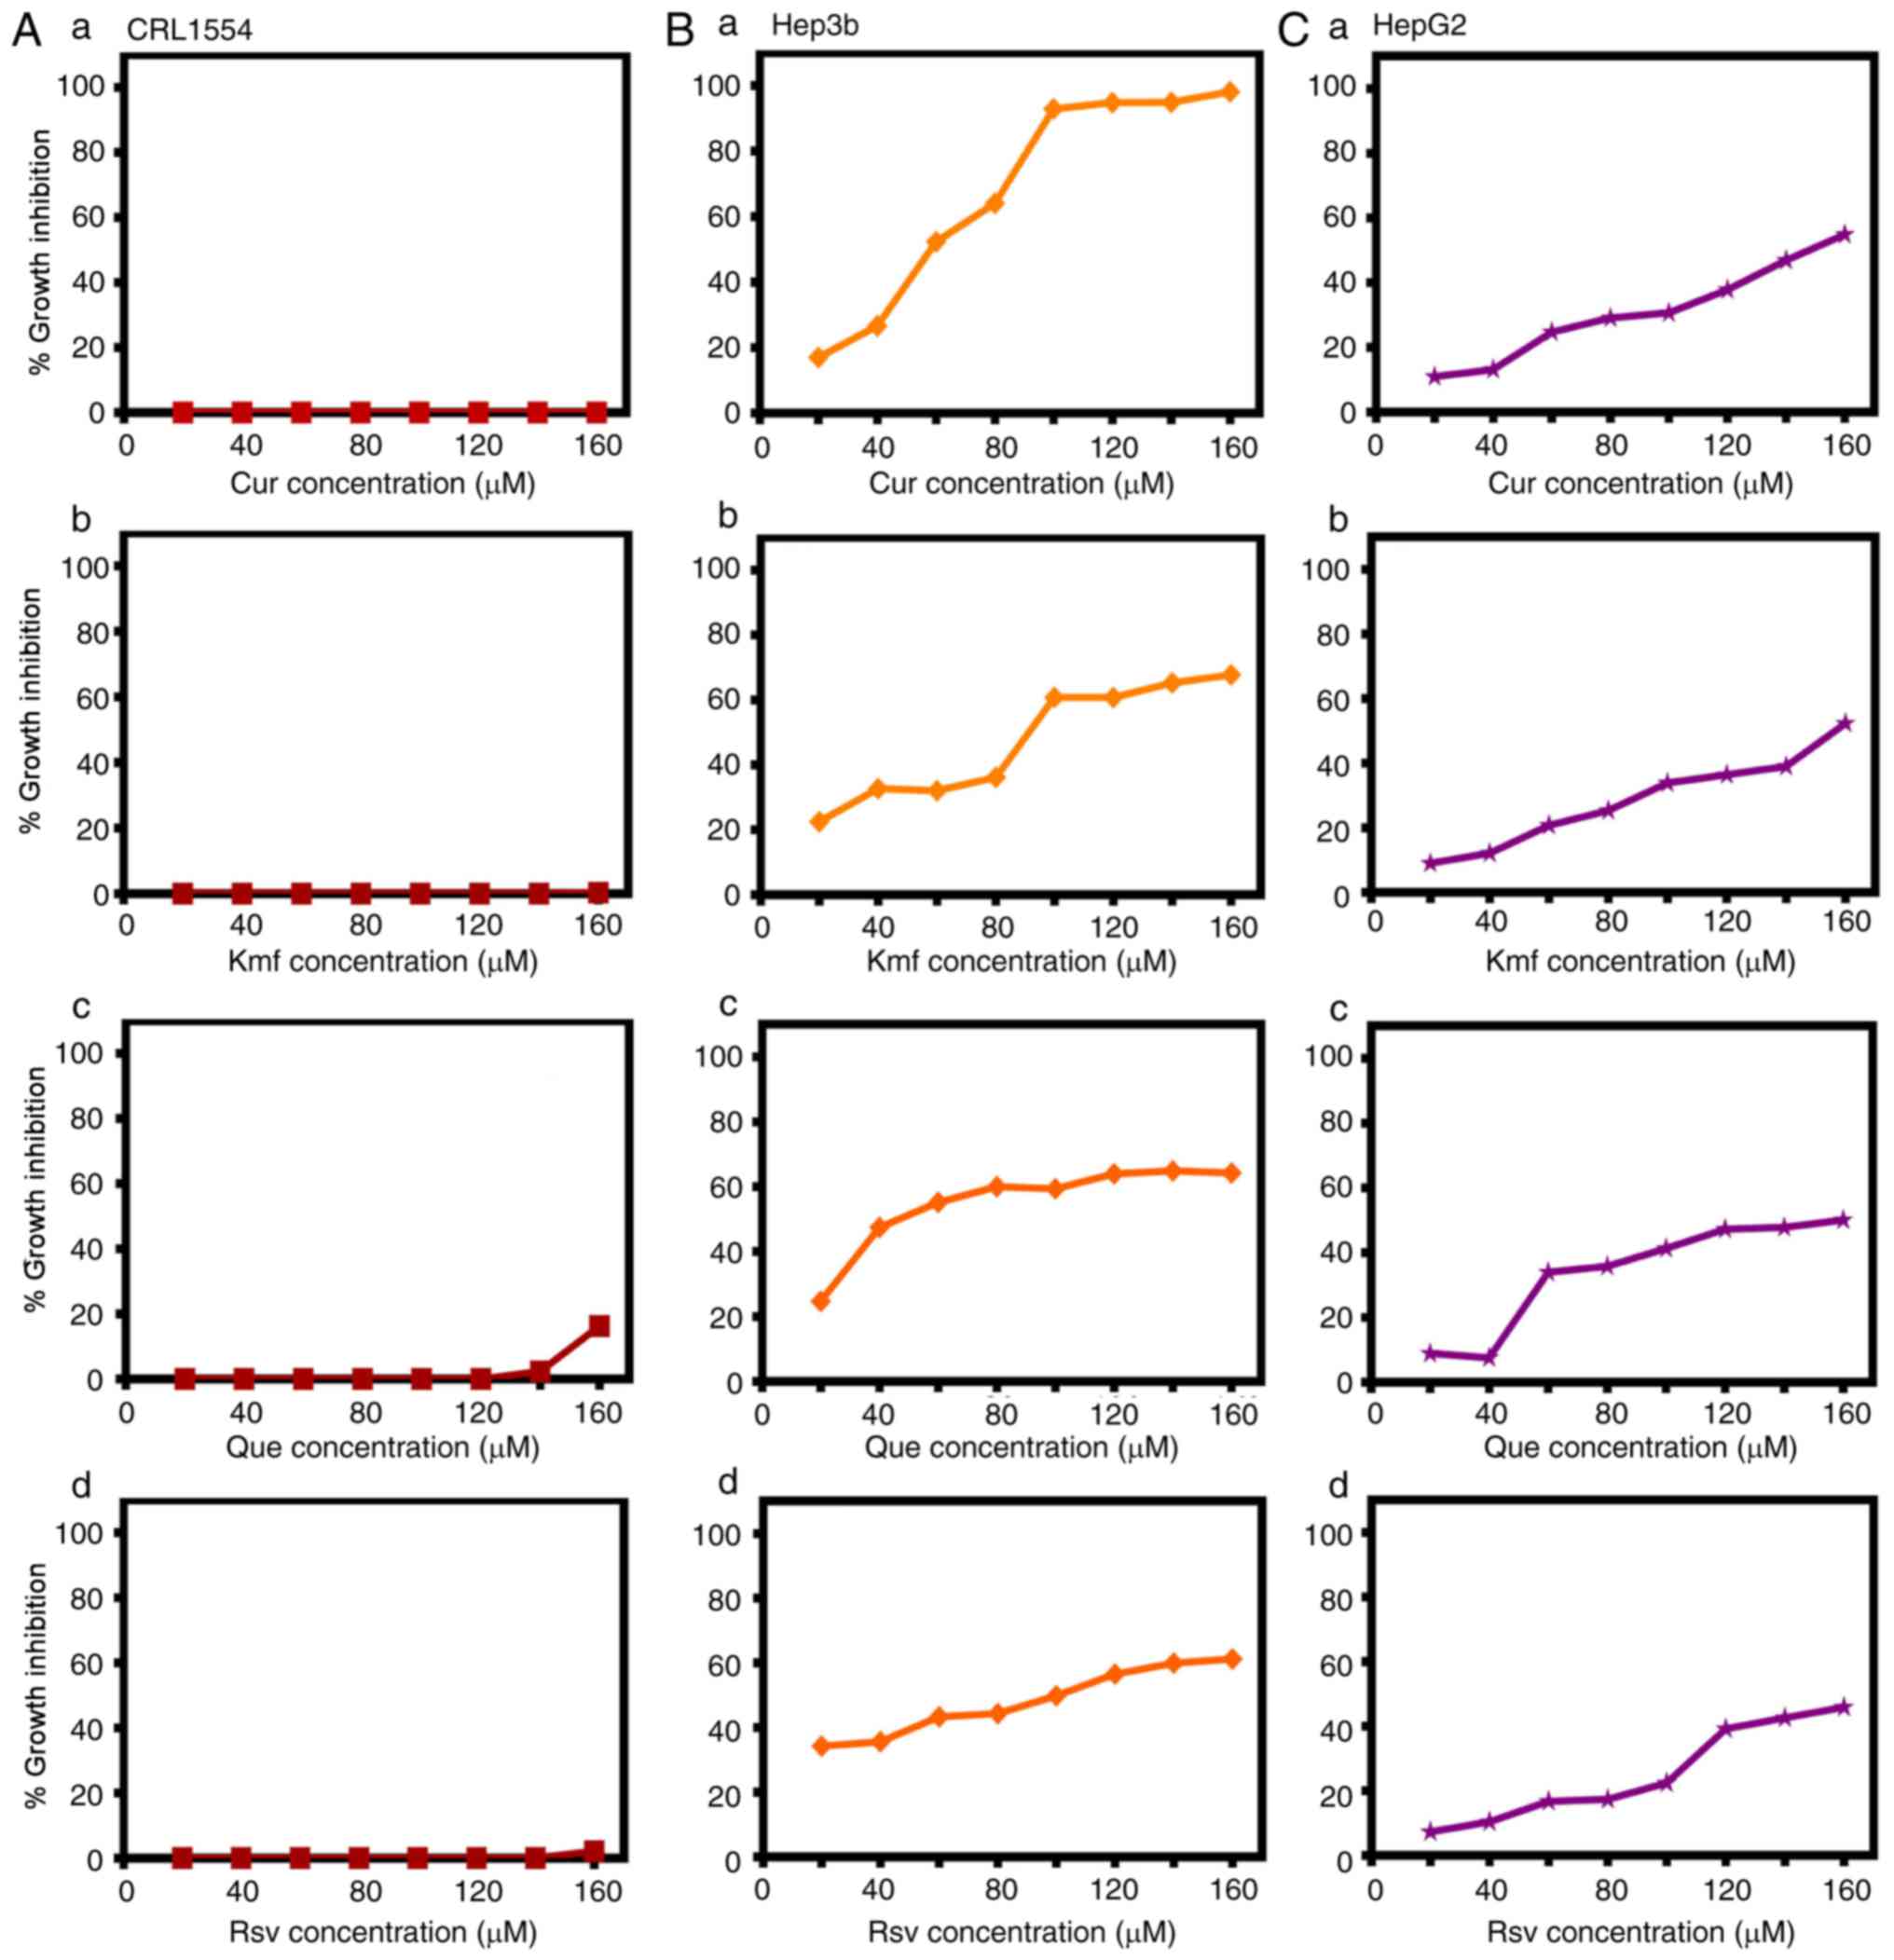
marked growth inhibitory effect (5-100%), while the NPCs exerted
differential anti-proliferative effects on CRL1554 cells. The
results of the 14 tested NPCs were classified into two groups based
on their growth inhibitory effect: i) NPCs exerting no or little
effect (0.0-20% cytotoxicity) on CRL1554 cells, including Cur
(0.0%; Fig. 1A-a), Kmf (0.0-1.1%;
Fig. 1A-b), Que (0.0-16.2%;
Fig. 1A-c) and Rsv (0.0-3.3%;
Fig. 1A-d), as well as Hsp
(0.0-4.4%), Sin (0.0-5.54%), Snn (0.0-7.3%), I3C (0.2-9.2%), and
Cmr (7.4-11.3%; results not shown), and ii) NPCs exerting marked
growth inhibitory effects on CRL1554, including Lyp (40.0-67.0%),
Irt (45.0-82.0%), Sul (39.0-98.0%), BetA (69.0-98.0%) and HHG
(99.0-100.0%; results not shown). Based on the growth inhibitory
effects of the tested NPCs, further research efforts were focused
on testing the potential of Cur, Que, Rsv, and Kmf to potentiate
the lethality of Sora on hepatic cancer cells, as they exhibited
little or no growth inhibitory effect against CRL1554 (Fig. 1A).
Dose-dependent anti-proliferative
effects of Cur, Kmf, Que and Rsv on human hepatic cancer cell
lines
To assess the growth inhibitory effect of the
selected NPCs (Cur, Kmf, Que and Rsv) on hepatic cancer cell lines,
Hep3b and HepG2 cells were treated with various concentrations of
these compounds. The tested NPCs inhibited the growth of Hep3b
cells as follows: Cur [concentration causing a 50% reduction in the
amount of cells (IC50)=60 μM], Kmf
(IC50=95 μM), Que (IC50=40 μM),
and Rsv (IC50=100 μM) (Fig. 1B). The tested NPCs exhibited lower
anticancer effects on HepG2 than on Hep3b cells. The anticancer
effect on HepG2 cells was as follows: Cur (IC50=140
μM), Kmf (IC50=155 μM), Que
(IC50=140 μM) and Rsv (IC50=120
μM) (Fig. 1C).
Sequence and dose-dependent
anti-proliferative effects of combined treatment with Sora and Cur,
Kmf, Que or Rsv on human hepatic cancer cell lines
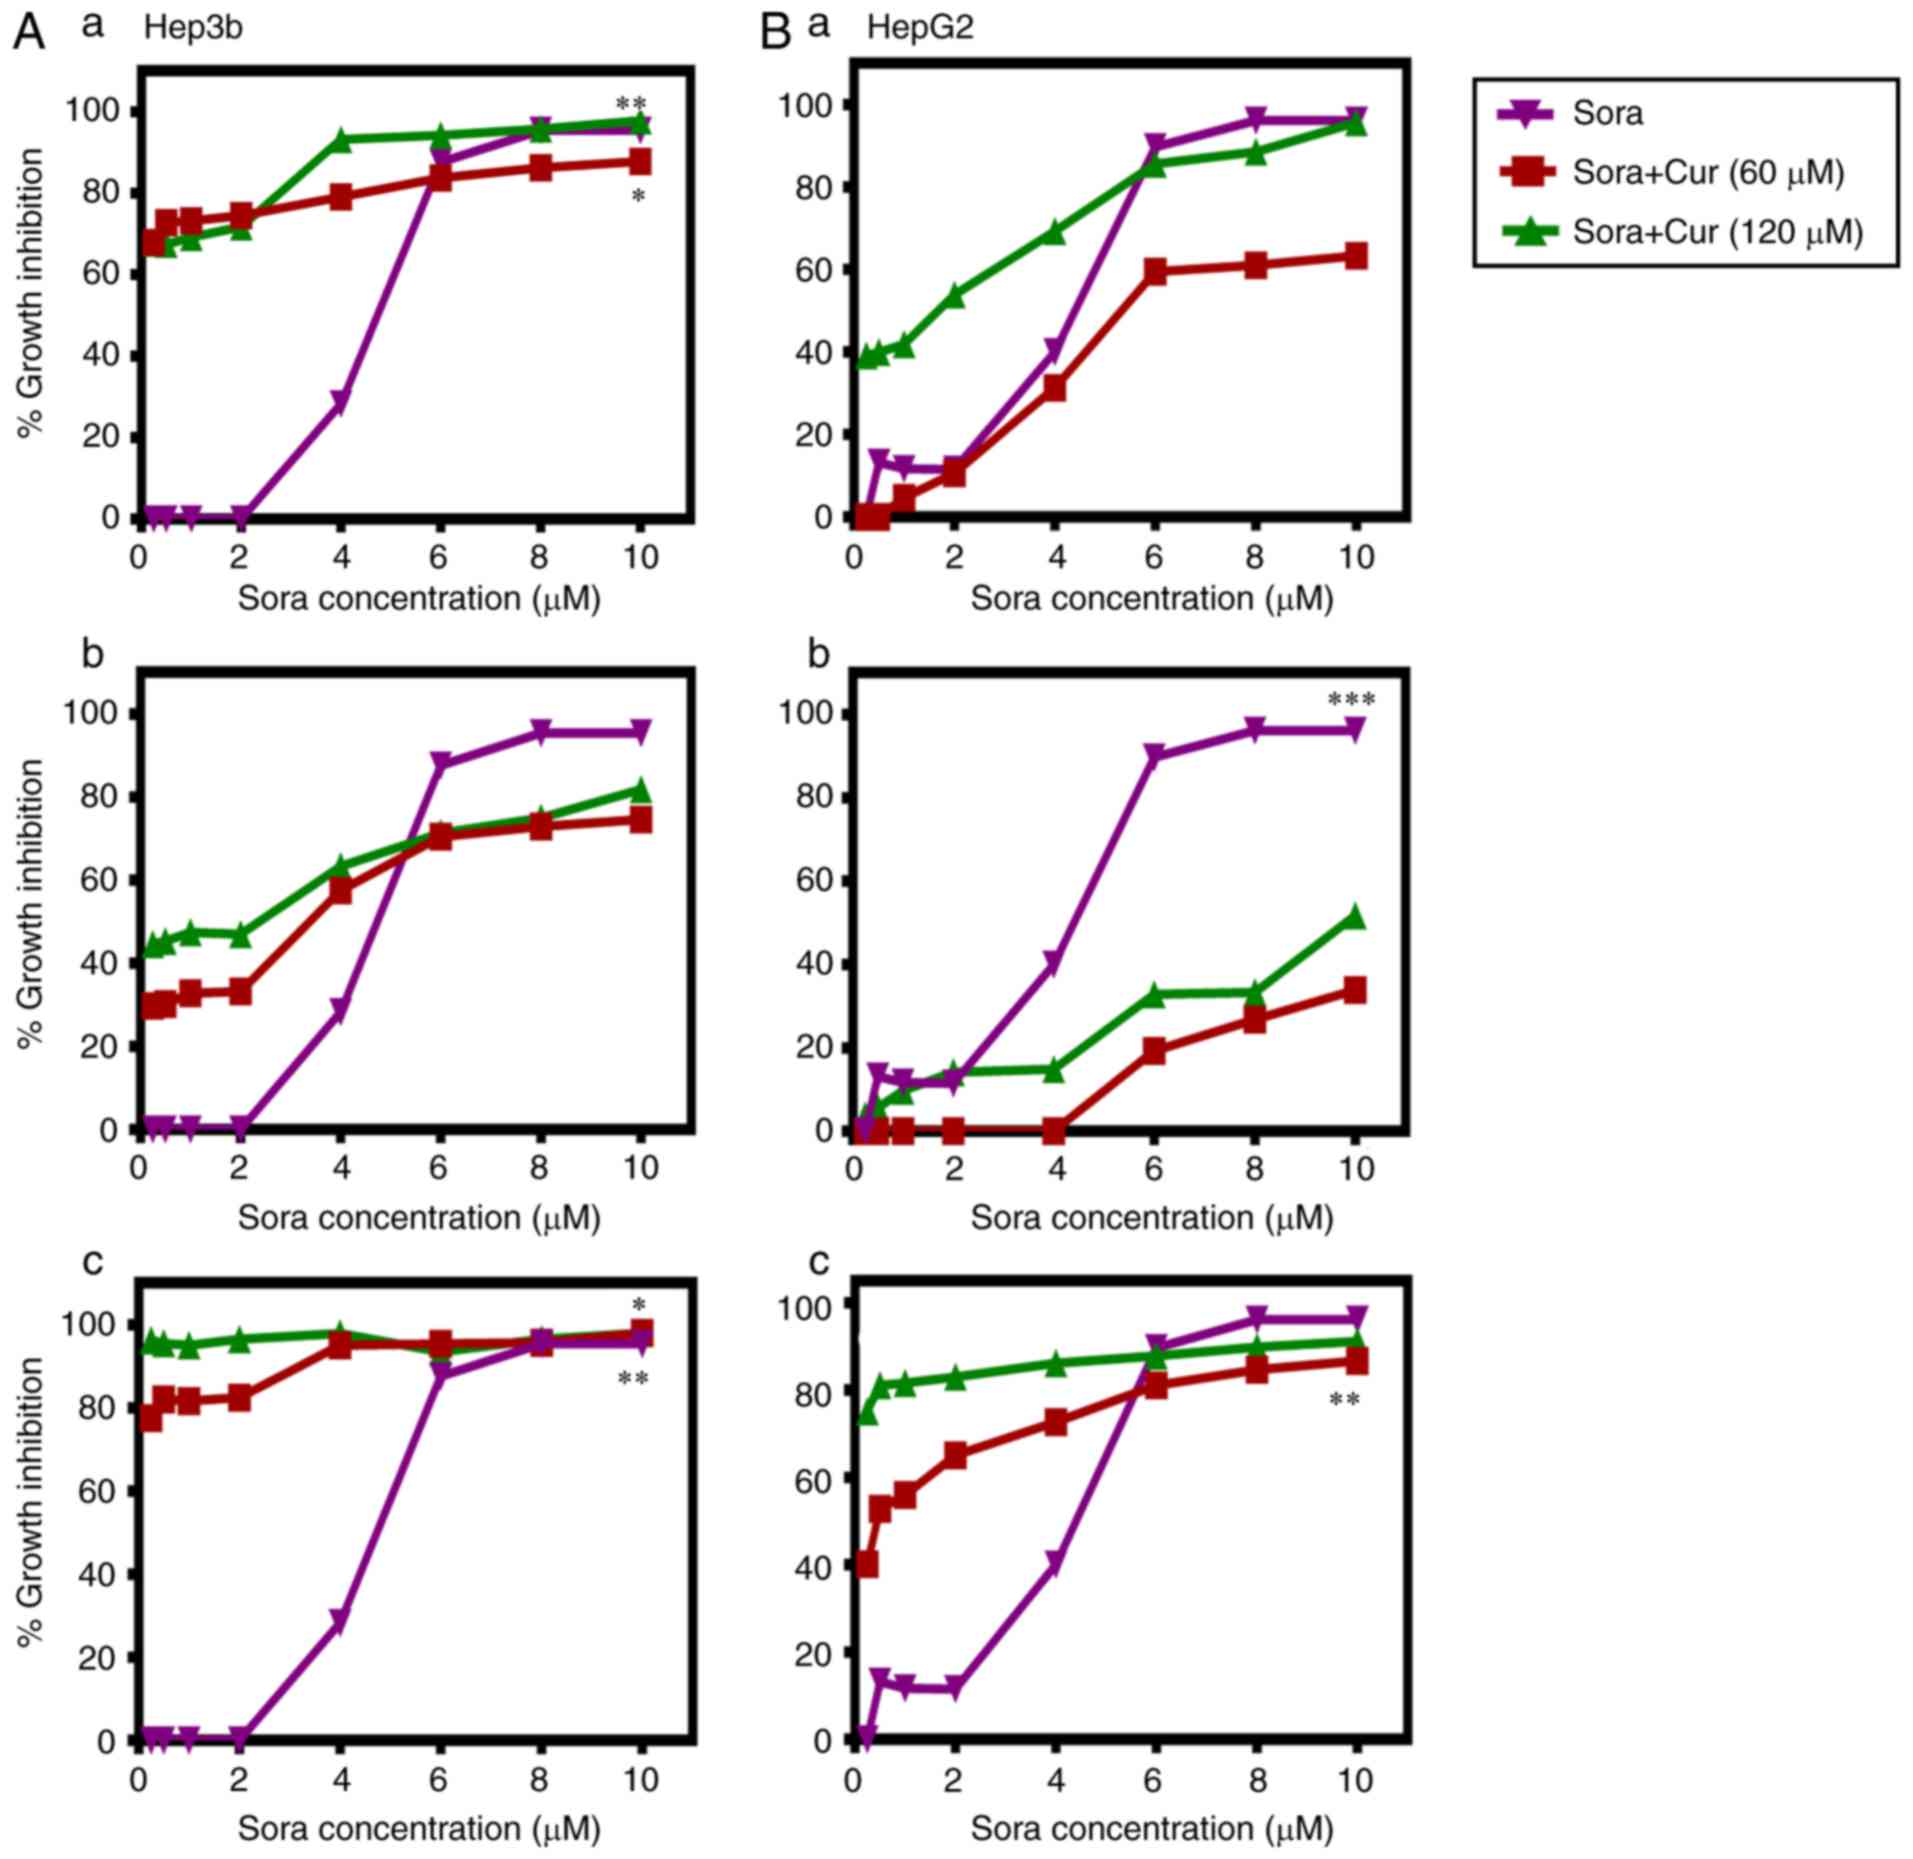
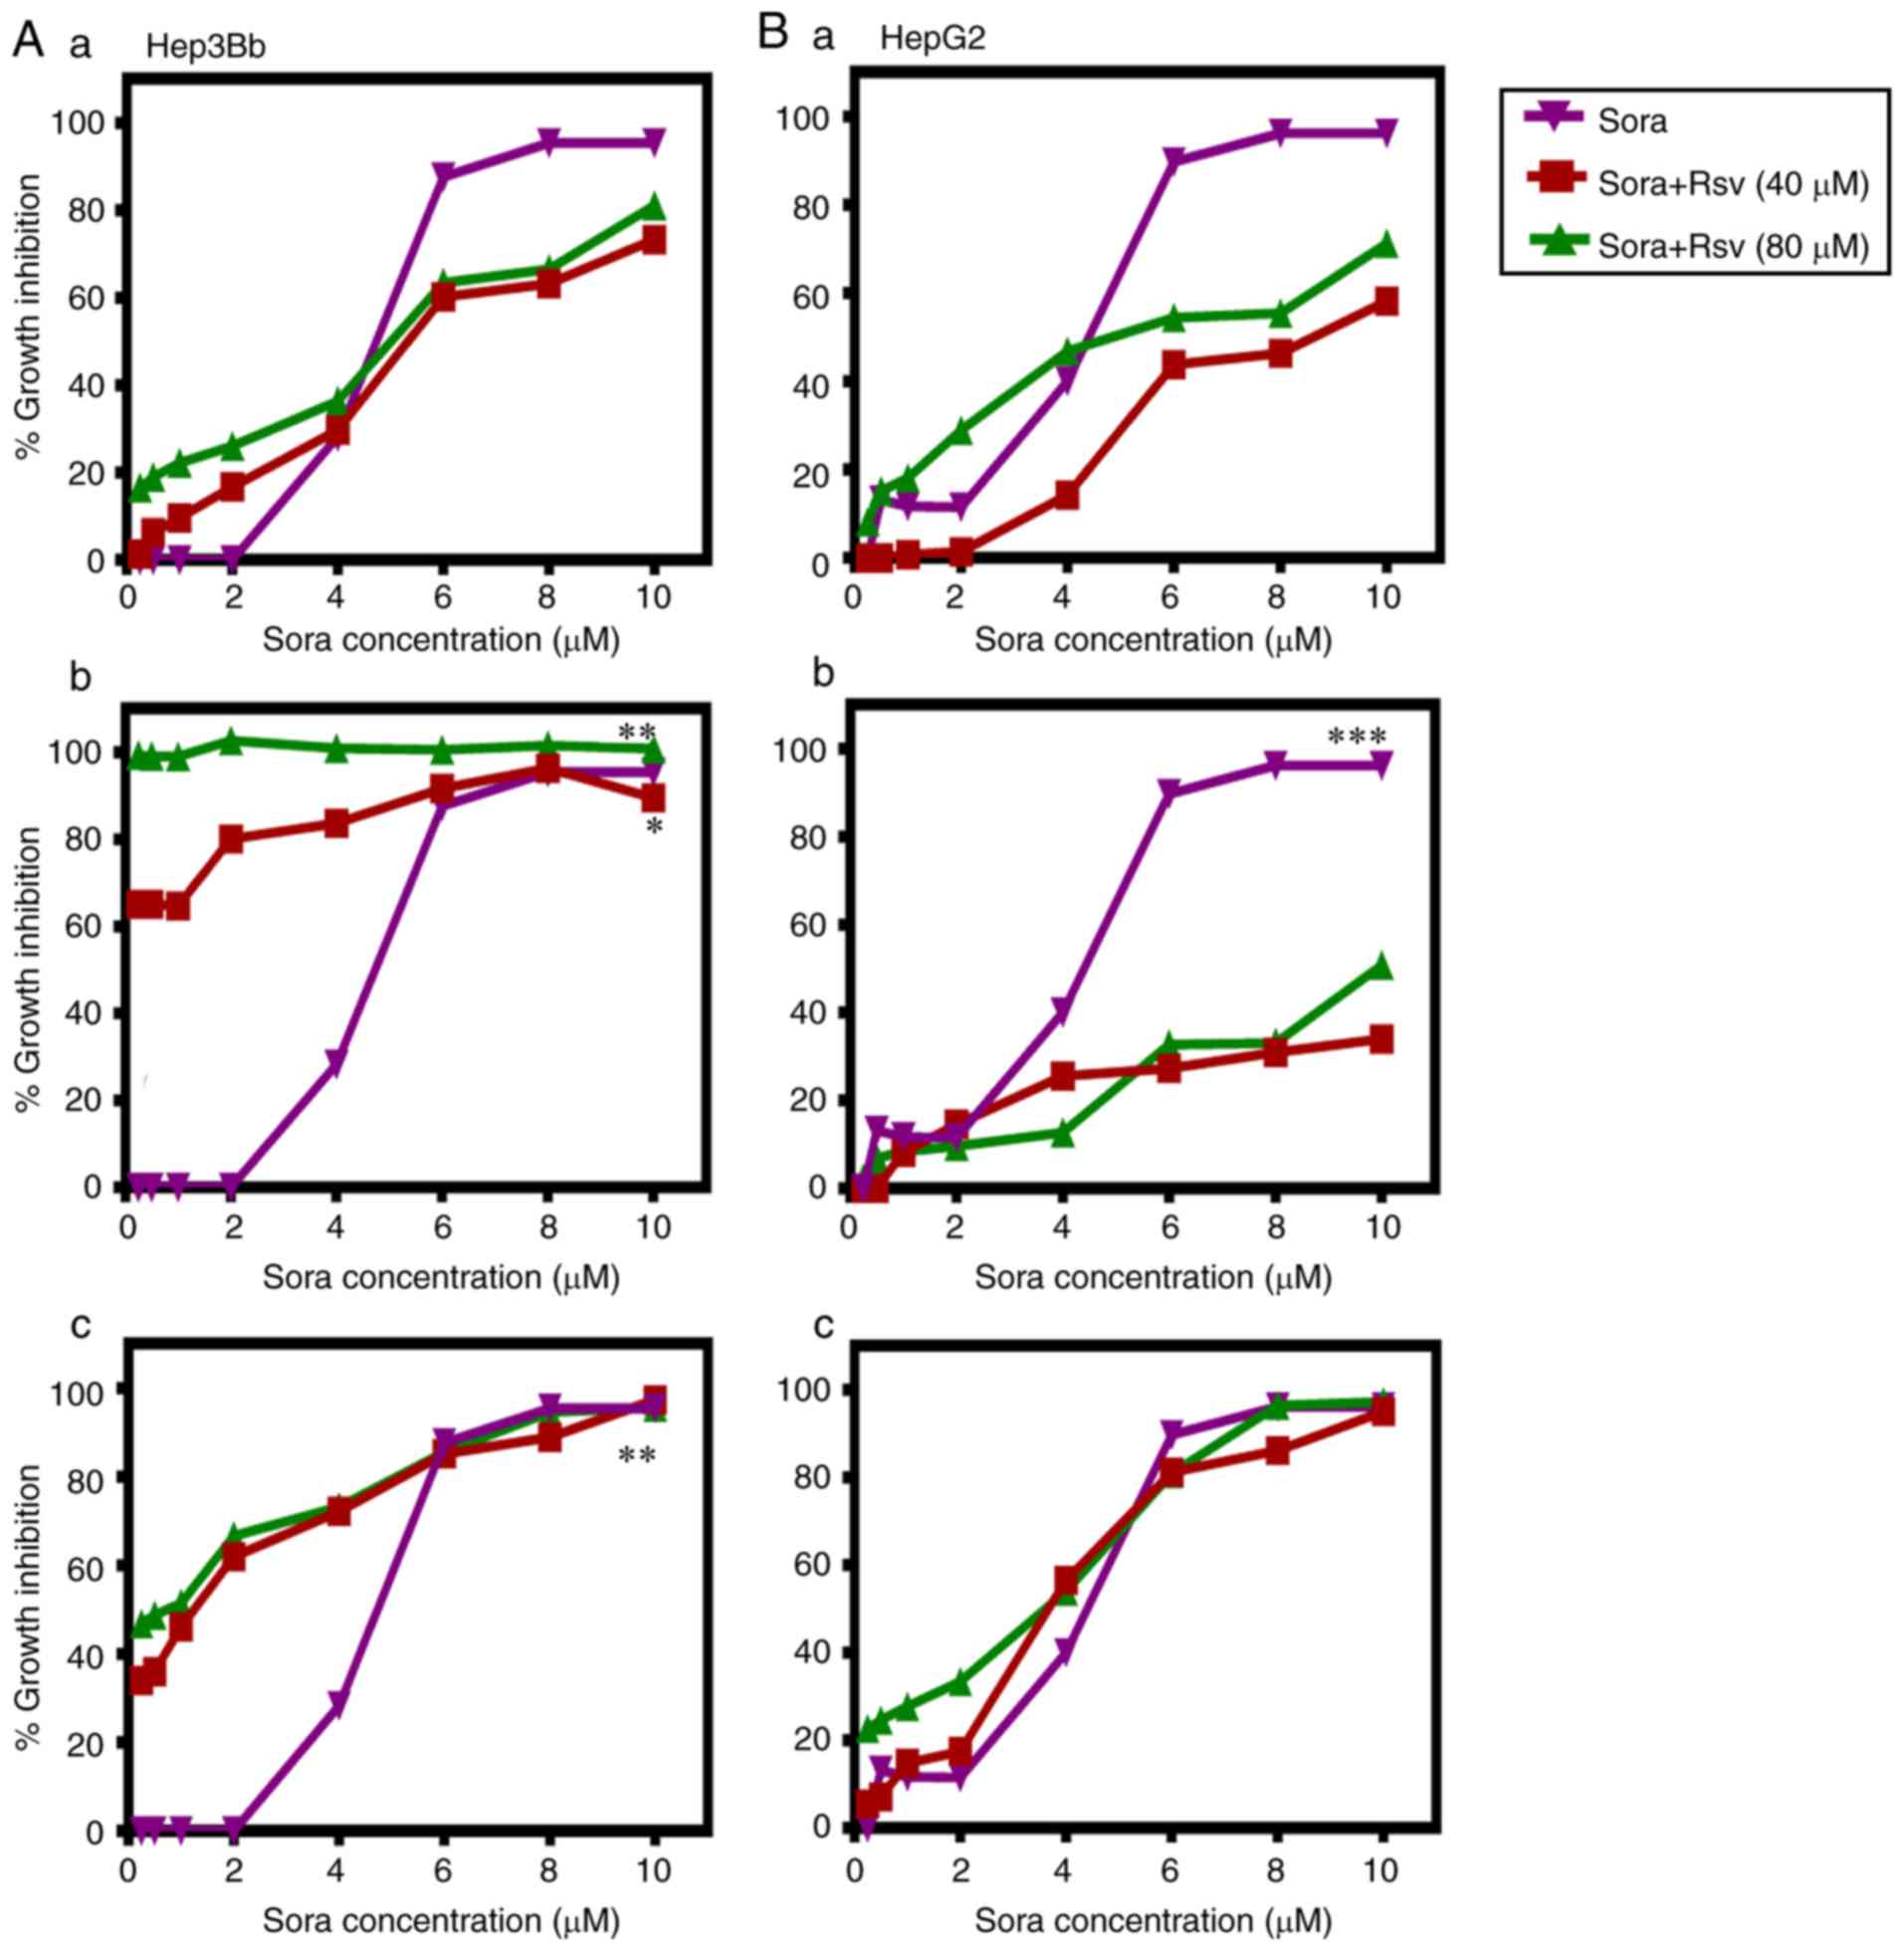
The aim was to test the ability of the NPCs (Cur,
Kmf, Que and Rsv) to synergize with Sora in order to enhance its
anticancer activity against human hepatic cancer cell lines Hep3b
and HepG2. Three different administration schedules: Sequential,
inverted sequential and simultaneous were tested. The obtained
results are summarized in Figs.
2–5 and Tables I and II. The tested NPCs potentiated the
lethality of Sora in the following order: Cur > Kmf > Rsv
> Que, in a dose-, hepatic cancer cell type-, NPC type- and
administration schedule-dependent manner.
 | Table IIC50, 60, 70, SR, P-values of single
and combined treatment with Sora and Cur or Kmf in human hepatic
cancer cell lines. |
Table I
IC50, 60, 70, SR, P-values of single
and combined treatment with Sora and Cur or Kmf in human hepatic
cancer cell lines.
| Single and combined
treatment with Sora and Cur | Hep3b
| HepG2
|
|---|
IC50, 60,
etc.
(μM) | SR | P-value | IC50, 60,
etc.
(μM) | SR | P-value |
|---|
| 1. Sequential
treatment with Sora and Cur: Sora (24 h) followed by Cur (48
h) |
| a. Sora (0.25-10
μM) |
IC70=5.71 | N.D | N.A |
IC50=5.43 | N.A | N.A |
| b. Sora (0.25-10
μM) + Cur (60 μM) |
IC70=0.29 | 19.70 | 0.0060 |
IC50=4.25 | 1.27 | 0.3160 |
| c. Sora (0.25-10
μM) + Cur (120 μM) |
IC70=0.29 | 19.70 | 0.0030 |
IC50=1.40 | 3.88 | 0.2250 |
| 2. Inverted
sequential treatment with Sora and Cur: Cur (24 h) followed by Sora
(48 h) |
| a. Sora (0.25-10
μM) |
IC50=4.86 | N.A | N.A | 4.44 | N.A | 0.0040 vs.
b
0.0410 vs. c |
| b. Sora (0.25-10
μM) + Cur (60 μM) |
IC50=3.14 | 1.55 | 0.3580 | N.D | N.D | b |
| c. Sora (0.25-10
μM) + Cur (120 μM) |
IC50=0.29 | 16.76 | 0.1060 | 9.33 | 0.48 | c |
| 3. Simultaneous
treatment with Sora and Cur (72 h) |
| a. Sora (0.25-10
μM) (72 h) |
IC90=8.00 | N.A | N.A |
IC80=5.71 | N.A | N.A |
| b. Sora (0.25-10
μM) + Cur (60 μM) |
IC90=4.00 | 2.00 | 0.0001 |
IC80=6.00 | 0.95 | 0.0710 |
| c. Sora (0.25-10
μM) + Cur (120 μM) |
IC90=0.29 | 27.59 | 0.0001 |
IC80=0.57 | 10.00 | 0.0020 |
|
| Single and combined
treatment with Sora and Kmf | IC50, 60,
etc.
(μM) | SR | P-value | IC50, 60,
etc.
(μM) | SR | P-value |
|
| 1. Sequential
treatment with Sora and Kmf: Sora (24 h) followed by Kmf (48
h) |
| a. Sora (0.25-10
μM) |
IC50=4.67 | N.A | N.A |
IC50=4.22 | N.A | 0.1240 vs.
b
0.2920 vs. c |
| b. Sora (0.25-10
μM) + Kmf (60 μM) |
IC50=5.11 | 0.91 | 0.8690 |
IC50=7.56 | 0.56 | b |
| c. Sora (0.25-10
μM) + Kmf (120 μM) |
IC50=4.00 | 1.17 | 0.4000 |
IC50=5.11 | 0.83 | c |
| 2. Inverted
sequential treatment with Sora and Kmf: Kmf (24 h) followed by Sora
(48 h) |
| a. Sora (0.25-10
μM) |
IC60=5.11 | N.A | N.A |
IC50=4.44 | N.A | 0.0240 vs.
b
0.8660 vs. c |
| b. Sora (0.25-10
μM) + Kmf (60 μM) |
IC60=3.56 | 1.44 | 0.1810 | N.D | N.D | b |
| c. Sora (0.25-10
μM) + Kmf (120 μM) |
IC60=2.44 | 2.10 | 0.0400 | 5.33 | 0.83 | c |
| 3. Simultaneous
treatment with Sora and Kmf (72 h) |
| a. Sora (0.25-10
μM) |
IC50=4.86 | N.A | N.A |
IC50=4.44 | N.A | N.A |
| b. Sora (0.25-10
μM) + Kmf (60 μM) |
IC50=1.43 | 3.39 | 0.0570 |
IC50=1.56 | 2.85 | 0.2280 |
| c. Sora (0.25-10
μM) + Kmf (120 μM) |
IC50=0.29 | 16.76 | 0.0240 |
IC50=1.56 | 2.85 | 0.2580 |
| Table IIIC50,60,70, SR, P-values
of single and combined treatment with Sora and Que or Rsv in human
hepatic cancer cell lines |
Table II
IC50,60,70, SR, P-values
of single and combined treatment with Sora and Que or Rsv in human
hepatic cancer cell lines
| Single and combined
treatment with Sora and Cur | Hep3b
| HepG2
|
|---|
IC50, 60,
etc.
(μM) | SR | P-value | IC50, 60,
etc.
(μM) | SR | P-value |
|---|
| 1. Sequential
treatment with Sora and Que: Sora (24 h) followed by Que (48
h) | | | | | | |
| a. Sora (0.25-10
μM) |
IC50=4.86 | N.A | N.A |
IC50=4.29 | N.A | N.A |
| b. Sora (0.25-10
μM) + Que (60 μM) |
IC50=4.00 | 1.21 | 0.9350 |
IC50=3.71 | 1.16 | 0.5660 |
| c. Sora (0.25-10
μM) + Que (120 μM) | IC50=
4.00 | 1.21 | 0.5830 |
IC50=3.71 | 1.16 | 0.7110 |
| 2. Inverted
sequential treatment with Sora and Que: Que (24 h) followed by Sora
(48 h) | | | | | | |
| a. Sora (0.25-10
μM) |
IC60=4.86 | N.A | N.A |
IC50=4.44 | N.A | 0.0200 vs.
b
0.7290 vs. c |
| b. Sora (0.25-10
μM) + Que (60 μM) | IC60=
3.43 | 1.42 | 0.1930 | N.D | N.D | b |
| c. Sora (0.25-10
μM) + Que (120 μM) |
IC60=0.58 | 8.38 | 0.0130 | N.D | 0.63 | c |
| 3. Simultaneous
treatment with Sora and Que (72 h) | | | | | | |
| a. Sora (0.25-10
μM) (72 h) |
IC50=4.58 | N.A | N.A |
IC50=4.44 | N.A | 0.8880 vs. b |
| b. Sora (0.25-10
μM) + Que (60 μM) |
IC50=1.14 | 4.02 | 0.0680 |
IC50=3.78 | 1.18 | b |
| c. Sora (0.25-10
μM) + Que (120 μM) |
IC50=0.58 | 7.90 | 0.0620 |
IC50=3.11 | 1.43 | 0.7090 |
|
| Single and combined
treatment with Sora and Rsv | IC50, 60,etc.
(μM) | SR | P-value | IC50, 60,etc.
(μM) | SR | P-value |
|
| 1. Sequential
treatment with Sora and Rsv: Sora (24 h) followed by Rsv (48
h) | | | | | | |
| a. Sora (0.25-10
μM) |
IC50=4.67 | N.A | 0.712 vs. b |
IC50=4.44 | N.A | 0.1050 vs.
b
0.6080 vs. c |
| b. Sora (0.25-10
μM) + Rsv (40 μM) |
IC50=5.33 | 0.88 | b | N.D | N.D | b |
| c. Sora (0.25-10
μM) + Rsv (80 μM) |
IC50=5.11 | 0.91 | 0.8450 |
IC50=9.80 | 0.45 | c |
| 2. Inverted
sequential treatment with Sora and Rsv: Rsv (24 h) followed by Sora
(48 h) | | | | | | |
| a. Sora (0.25-10
μM) |
IC70=5.60 | N.A | N.A |
IC50=4.44 | N.A | 0.0220 vs.
b
0.0330 vs. c |
| b. Sora (0.25-10
μM) + Rsv (40 μM) |
IC70=1.11 | 5.10 | 0.0010 | N.D | N.D | b |
| c. Sora (0.25-10
μM) + Rsv (80 μM) | N.D | N.D | 0.0001 |
IC50=9.80 | 0.45 | c |
| 3. Simultaneous
treatment with Sora and Rsv (72 h) | | | | | | |
| a. Sora (0.25-10
μM) |
IC50=4.67 | N.A | N.A |
IC50=4.44 | N.A | N.A |
| b. Sora (0.25-10
μM) + Rsv (40 μM) |
IC50=1.33 | 3.51 | 0.0660 |
IC50=3.56 | 1.25 | 0.9720 |
| c. Sora (0.25-10
μM) + Rsv (80 μM) |
IC50=0.44 | 10.60 | 0.0300 |
IC50=3.56 | 1.25 | 0.5930 |
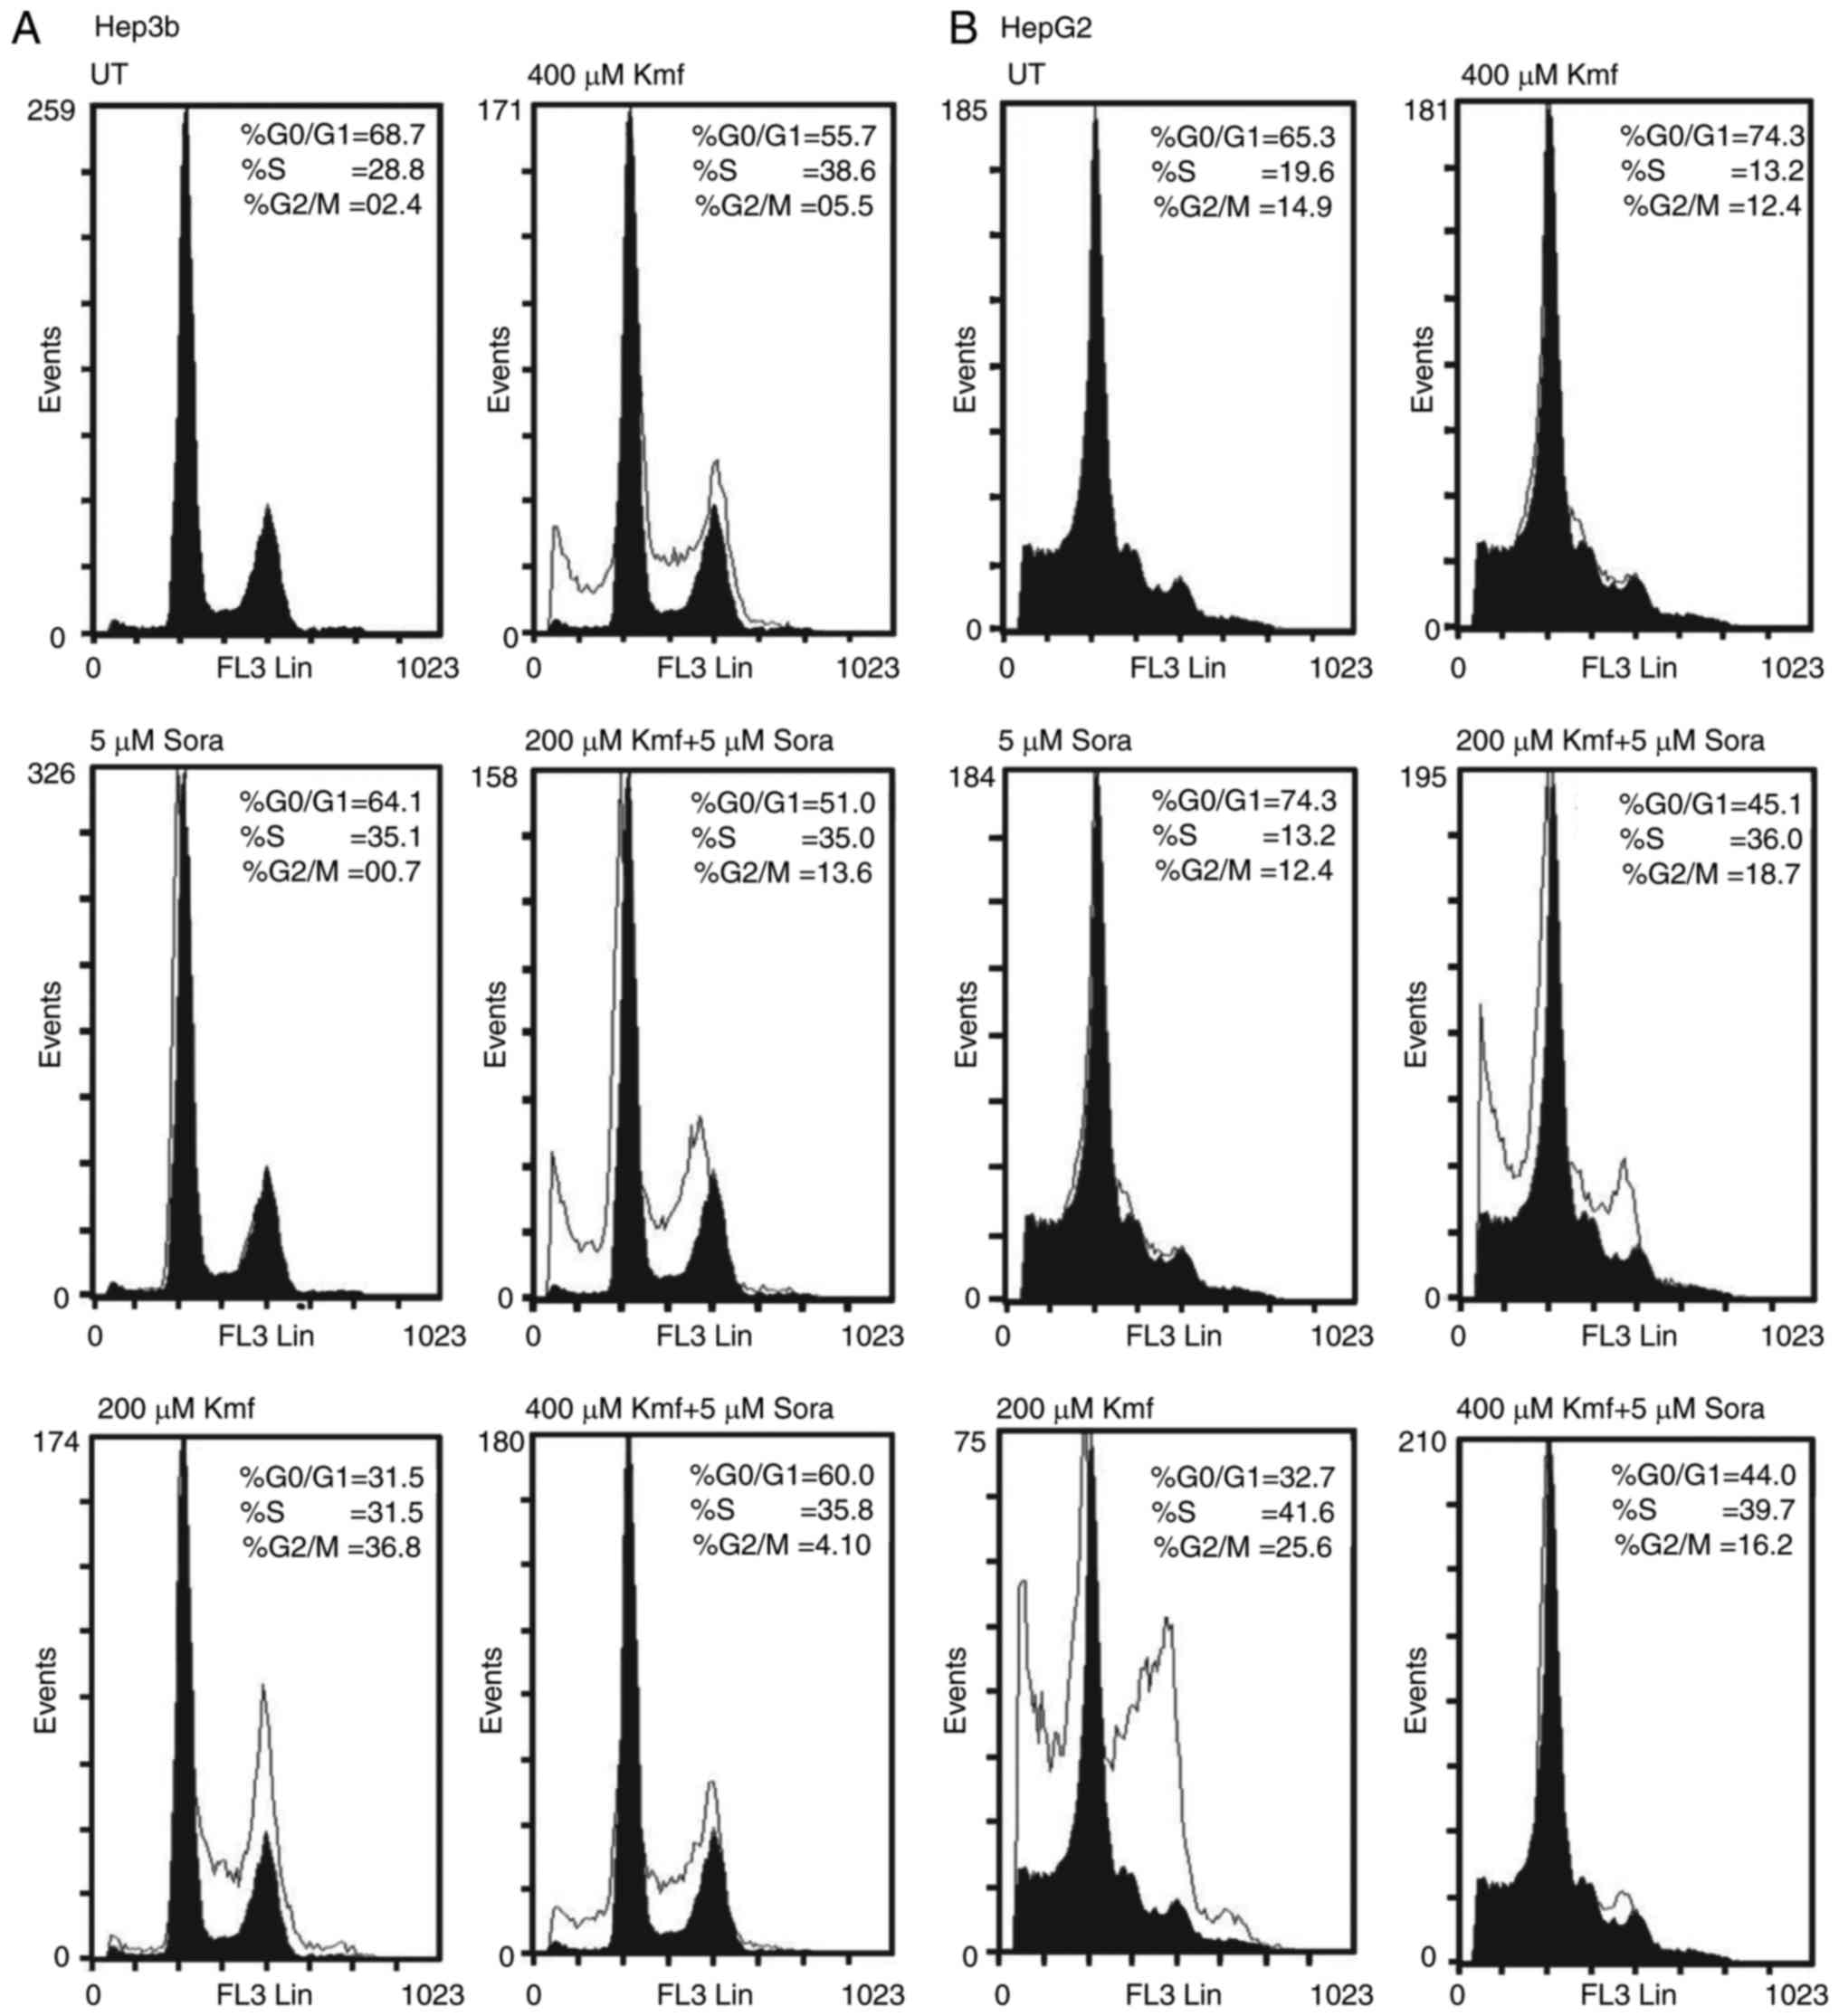
Flow cytometric analysis of the cell
cycle in hepatic cancer cell lines following single and combined
treatment with Sora and Cur or Kmf
Single and combined treatment with
Sora and Cur
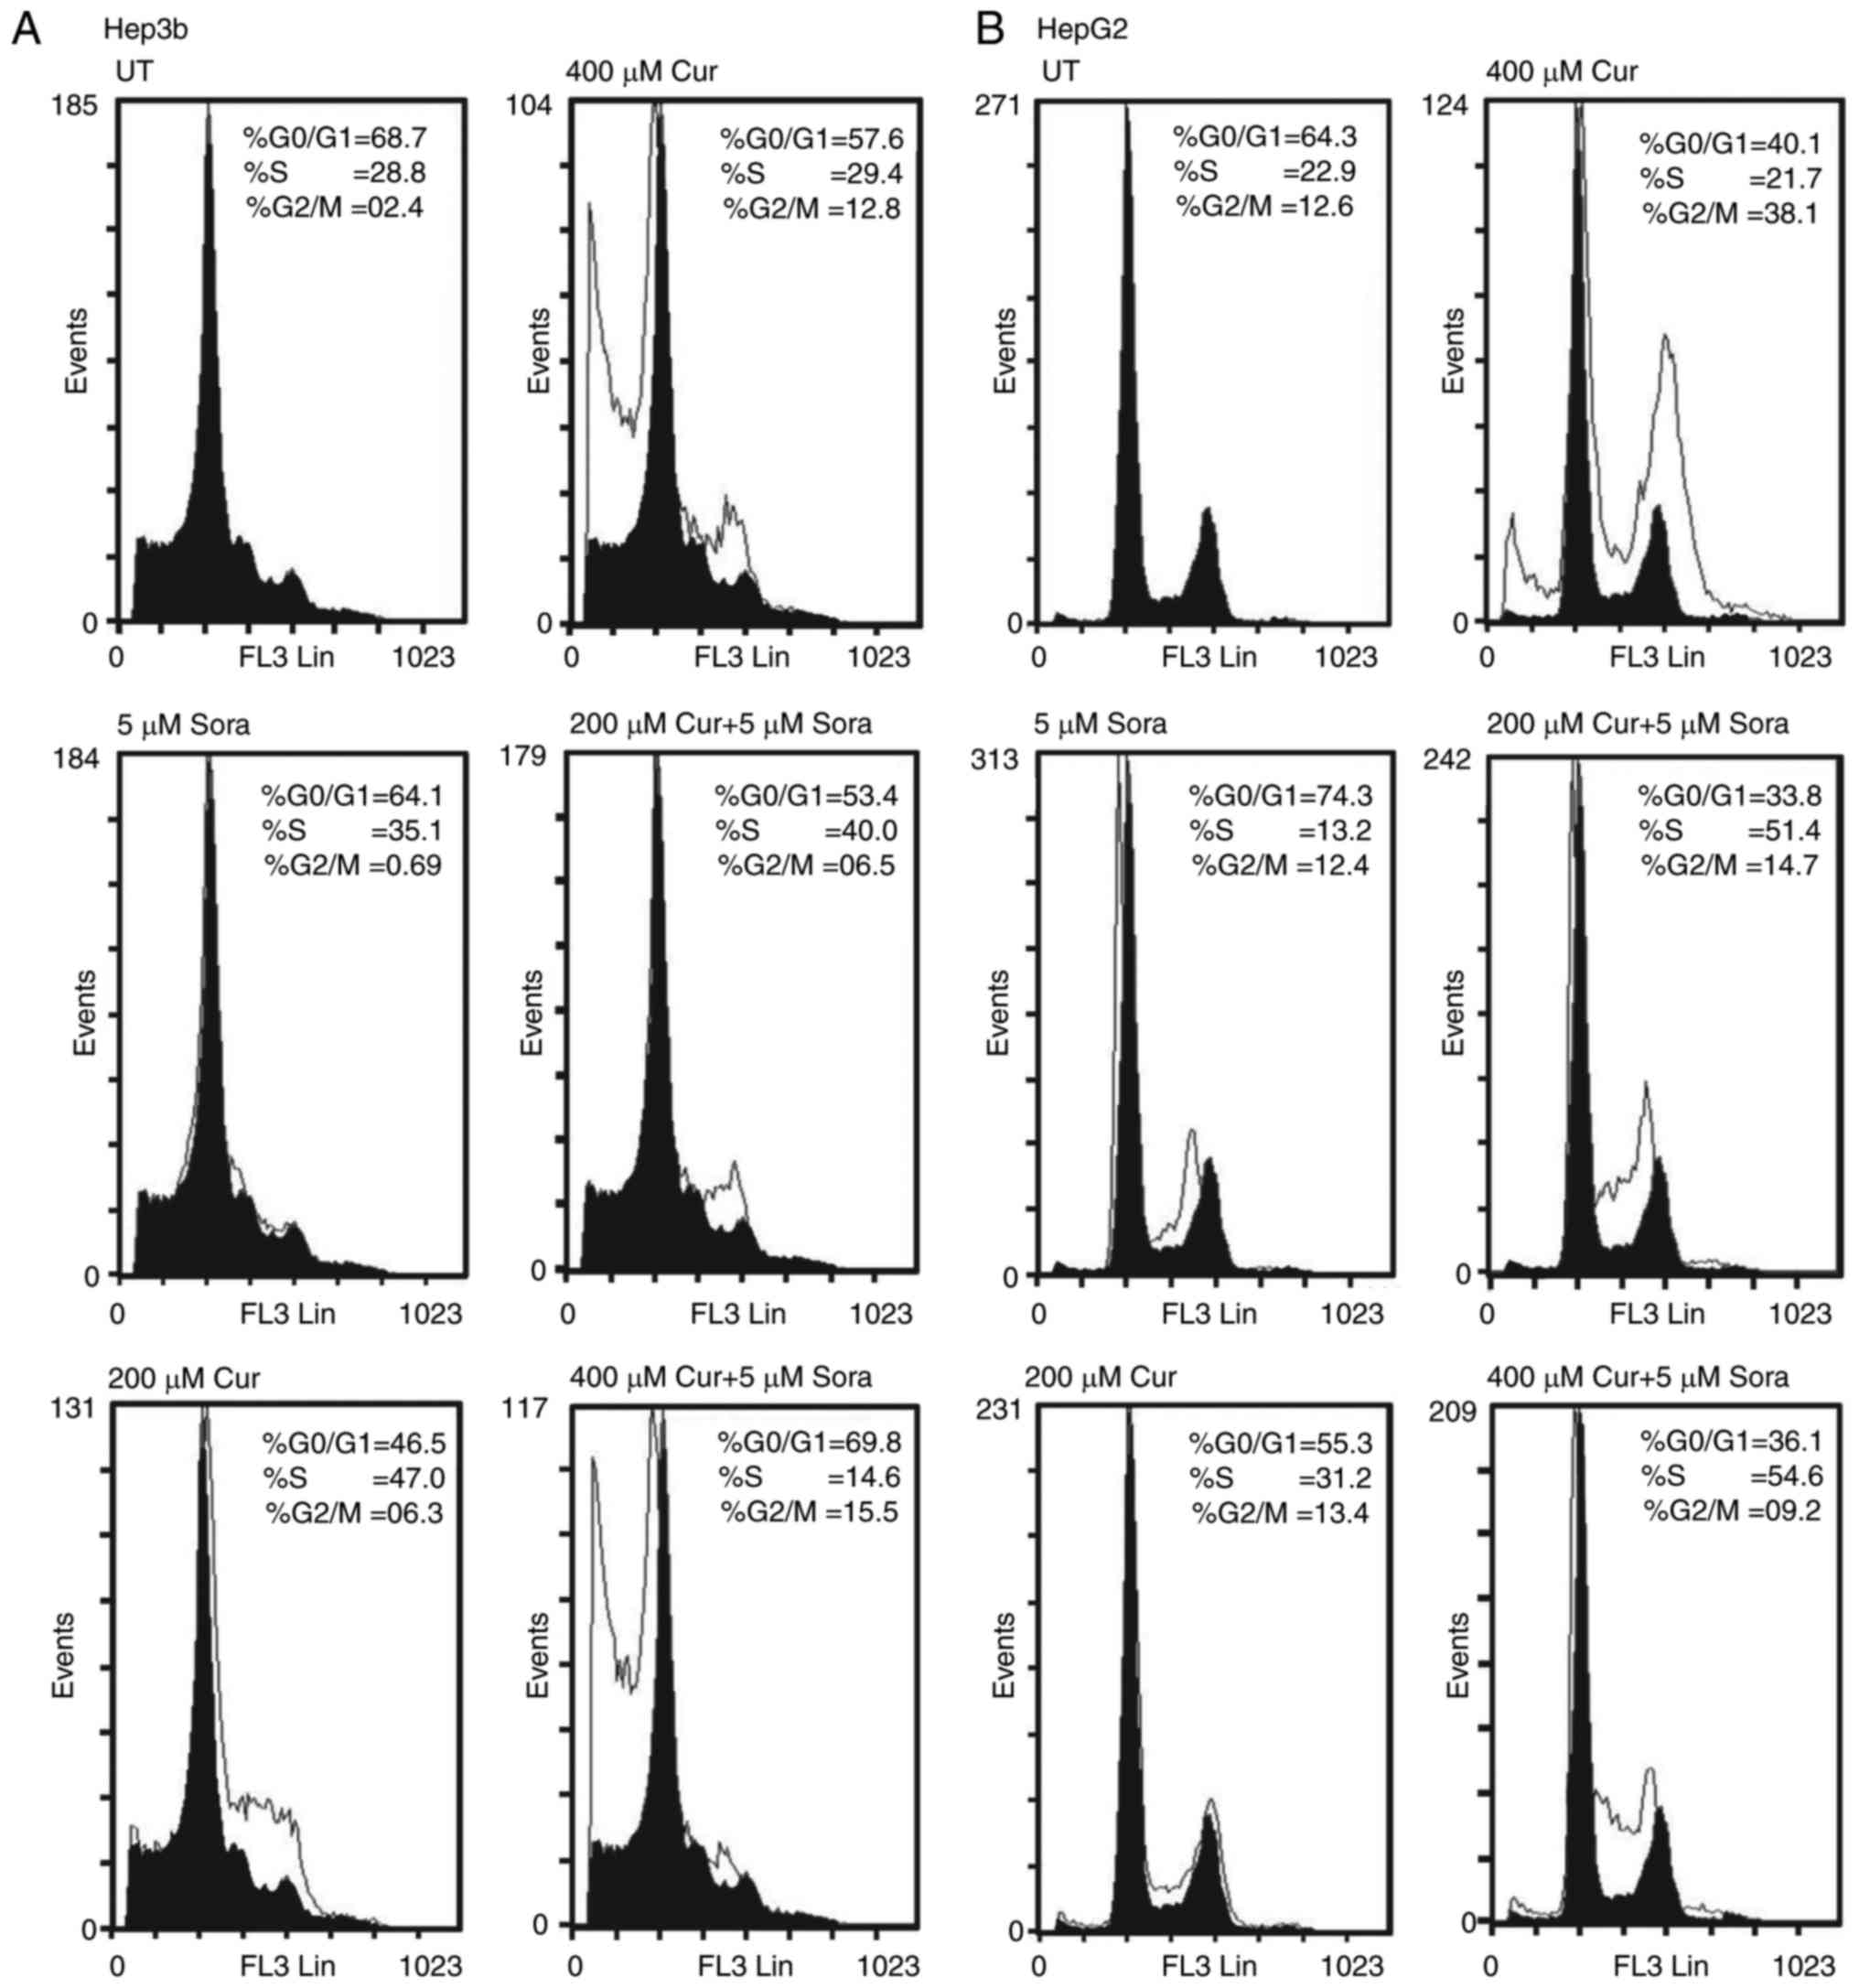
Treatment with Sora (5 μM) increased the
population of Hep3b cells in the S-phase (P=0.151) accompanied with
a decrease in the population of cells in the
G0/G1 (P=0.145) and the G2/M-phase
(P=0.001) compared to untreated (UT) (Fig. 6A). By contrast, Cur (200
μM) increased the population of Hep3b cells in the S-phase
(P=0.003) and the G2/M-phase (P=0.001) with a
concomitant decrease in the G0/G1-phase
population (P=0.003) compared to UT (Fig. 6A). In addition, Cur (400
μM) markedly increased the population of Hep3b cells in the
G2/M-phase (P=0.001) but only slightly reduced the
S-phase population (P=0.776) with a corresponding decrease in the
number of cells in G0/G1-phase (P=0.098)
compared to UT. Cur (400 μM) induced apoptosis in Hep3b
cells (% subG1=32.6 vs. 6.7 for UT) (Fig. 6A). Furthermore, simultaneous
combined treatment with Sora (5 μM) and Cur (200 μM)
increased the population of Hep3b cells in the S-phase (P=0.041)
and the G2/M-phase (P=0.049) with a corresponding
decrease in the G0/G1-phase population
(P=0.007) compared to UT (Fig.
6A). Simultaneous combined treatment with Sora (5 μM)
and Cur (400 μM) greatly increased the population of Hep3b
cells in the G2/M-phase (P=0.003) and slightly increased
the population of cells in the G0/G1-phase
(P=0.835), with a concomitant decrease in the cell population in
S-phase (P=0.001) compared to UT. This drug combination induced
apoptosis in Hep3b cells (% subG1=26.4 vs. 6.7% for UT; Fig. 6A).
Simultaneous combined treatment of Hep3b with Sora
(5 μM) and Cur (200 μM) growth arrested the cells in
both S-phase (P=0.365) and G2/M-phase (P=0.01) compared
with the cells treated with Sora. On the other hand, cells treated
with Sora alone (5 μM) were significantly growth arrested in
G0/G1-phase (P= 0.009) compared to cells
treated with simultaneous combined treatment of Sora (5 μM)
and Sora (200 μM; Fig.
6A).
Simultaneous combined treatment of Hep3b with Sora
(5 μM) and Cur (200 μM) resulted in an increase in
the number of cells in the G0/G1-phase
(P=0.024) and G2/M-phase (P=0.816) compared to cells
treated with Cur (200 μM). On the other hand, Cur (200
μM) growth arrested Hep3b in S-phase (P=0.051) compared with
the combined treatment (Fig.
6A).
Simultaneous combined treatment of Hepb3 with Sora
(5 μM) and Cur (400 μM) significantly increased cell
population in the G2/M-phase (P=0.0001), but slightly
increased the number of cells in G0/G1-phase
(P=0.248) compared to single treatment with Sora (5 μM). On
the other hand, Sora (5 μM) significantly increased number
of cells in the S-phase (P=0.0001) compared to the combined
treatment (Fig. 6A). Furthermore,
this combined treatment significantly increased the number of
arrested cells in the G0/G1-phase (P=0.045)
and slightly increased the cell population in the
G2/M-phase (P=0.389) compared to cells treated with Cur
(400 μM). On the other hand, cells treated with Cur (400
μM) demonstrated a significant increase in the number of
cells in S-phase (P=0.0001) compared to the combined treatment
(Fig. 6A).
Treatment of HepG2 cells with Sora (5 μM)
resulted in an increase in the G0/G1-phase
population (P=0.054), accompanied with a significant decrease in
the population of cells in the S-phase (P=0.025) and the
G2/M-phase (P=0.79) compared to UT. Sora only slightly
increased the amount of apoptosis in HepG2 cells (% subG1=0.69 vs.
0.02% for UT; Fig. 6B). By
contrast, Cur (200 μM) inhibited the growth of HepG2 cells
by increasing the population in the S-phase (P=0.038) and the
G2/M-phase (P=0.728) with a corresponding decrease in
the population of cells in G0/G1-phase
(P=0.004) compared to UT. Cur (200 μM) also only induced
apoptosis in HepG2 cells to a minimal extent (% subG1=0.75 vs.
0.02% for UT; Fig. 6B).
Furthermore, Cur (400 μM) markedly inhibited the growth of
HepG2 cells by increasing the population in G2/M phase
(P=0.0001) with a corresponding decrease in the number of cells in
the G0/G1-phase (P=0.0001) and the S-phase
(P=0.473). Cur (400 μM) induced apoptosis in HepG2 cells (%
subG1=5.0 vs. 0.02 for UT; Fig.
6B).
Simultaneous combined treatment with Sora (5
μM) and Cur (200 μM) greatly inhibited the growth of
HepG2 cells by increasing the population in the S-phase (P=0.0001)
but only slightly in the G2/M-phase (P=0.468) with a
corresponding decrease in the cell population in
G0/G1-phase (P=0.0001) compared to UT. This
combination induced a small amount of apoptosis in HepG2 cells (%
subG1=0.25 vs. 0.02% for UT; Fig.
6B). In addition, simultaneous combined treatment with Sora (5
μM) and Cur (400 μM) greatly inhibited the growth of
HepG2 cells by increasing the S-phase population (P=0.0001) with a
concomitant decrease in cell populations in the G0/G1-phase
(P=0.0001) and the G2/M-phase (P=0.176) compared to UT.
This combination induced a small amount of apoptosis in HepG2 cells
(% subG1=0.974 vs. 0.02% for UT; Fig.
6B).
Simultaneous combined treatment of HepG2 cells with
Sora (5 μM) and Cur (200 μM) significantly increased
the number of cells in S-phase compared to single treatment with 5
μM Sora (P=0.0001) and 200 μM Cur (P=0.005). Also,
this combination slightly increased the cell population in
G2/M-phase compared to single treatment with Sora
(P=0.242) and Cur (P=0.42). On the other hand, single treatment of
HepG2 cells with Sora and Cur significantly increased the cell
population in G0/G1-phase (P=0.0001) compared
to the combined treatment (Fig.
6B).
Simultaneous combined treatment of HepG2 cells with
Sora (5 μM) and Cur (400 μM) significantly increased
the number of cells in both the S-phase (P=0.0001) and
G0/G1-phase (P=0.0001) compared to single
treatment with Sora (5 μM) and Cur (400 μM). In
addition, treatment of HepG2 with Sora (5 μM) slightly
increased the cell population in G2/M-phase (P=0.174).
Furthermore, HepG2 cells-treated with Cur (400 μM) were
significantly arrested in G2/M-phase (P=0.0001) compared
to the combined treatment (Fig.
6B).
Single and combined treatment with
Sora and Kmf
Treatment of Hep3b cells with Sora (5 μM)
inhibited their growth by increasing the population in the S-phase
(P= 0.151) with a corresponding decrease in the percentage of cells
in the G0/G1-phase (P=0.145) and the
G2/M-phase (P=0.001) compared to UT (Fig. 7A). Treatment with Kmf (200
μM) resulted in a marked inhibition of Hep3b cell growth by
increasing the S-phase population (P= 0.151) and the
G2/M-phase population (P=0.0001) with a corresponding
decrease in the number of cells in the
G0/G1-phase (p=0.0001) compared to UT. Kmf
(200 μM) markedly induced apoptosis in Hep3b cells (%
subG1=21.8 vs. 6.7% for UT; Fig.
7A). Furthermore, Kmf (400 μM) inhibited the growth of
cancer cells by increasing the population in the S-phase (P=0.003)
and G2/M-phase (P=0.001) with a concomitant decrease in
the number of cells in the G0/G1-phase
(P=0.002) compared to UT. Kmf (400 μM) slightly induced
apoptosis in Hep3b cells (7.8 vs. 6.7% for UT; Fig. 7A). Simultaneous combined treatment
with Sora (5 μM) and Kmf (200 μM) also markedly
increased the population of Hep3b cells in the S-phase (P=0.214)
and the G2/M-phase (P=0.0001) with a corresponding
reduction in the percentage of cells in the
G0/G1-phase (P=0.0001) compared to UT. This
combined treatment markedly induced apoptosis in Hep3b cells (%
subG1=23.2 vs. 6.7% for UT; Fig.
7A). In addition, simultaneous combined treatment with Sora (5
μM) and Kmf (400 μM) inhibited the growth of Hep3b
cells by increasing the population in the S-phase (P=0.186) and
G2/M-phase (P=0.231) with a concomitant decrease in the
population of cells in the G0/G1 phase (P=
0.013) compared to UT (Fig.
7A).
Simultaneous combined treatment of Hep3b with Sora
(5 μM) and Kmf (200 μM) significantly increased the
number of cells in the G2/M-phase (P=0.0001) with a
corresponding decrease in the cell population in
G0/G1-phase (P=0.002) and no alteration in
cell population in S-phase compared with the single treatment with
Sora (5 μM; Fig. 7A). On
the other hand, this combination caused a significant increase in
the number of cells in the G0/G1-phase
(P=0.0001) and a slight increase in cell population in S-phase
(P=0.224) with corresponding decrease in the cell number in
G2/M-phase (P= 0.0001) compared to single treatment with
Kmf (200 μM; Fig. 7A).
Simultaneous combined treatment of Hep3b with Sora
(5 μM) and Kmf (400 μM) significantly increased the
number of cells in G2/M-phase (P=0.001) and S-phase
(P=0.697) with corresponding decrease in the number of cells in
G0/G1-phase (P=0.134) compared to single
treatment with Sora (5 μM; Fig. 7A). Furthermore, this combination
increased the cell population in G0/G1-phase
(P= 0.134) with concomitant decrease in the number of cells in both
G2/M-phase (P=0.047) and S-phase (P=0.267) compared to
single treatment with Kmf (400 μM; Fig. 7A).
Treatment of HepG2 cells with Sora (5 μM)
inhibited their growth by increasing the population of cells in
G0/G1-phase (P=0.005) with a corresponding
decrease in the number of cells in S-phase (P=0.004) and
G2/M-phase (P= 0.876) compared to UT (Fig. 7B). Treatment of HepG2 cells with
Kmf (200 μM) resulted in a marked inhibition of cell growth
by increasing the population in the S-phase (P=0.0001) and
G2/M-phase (P=0.0001) with a corresponding decrease in
the number of cells in the G0/G1-phase
(P=0.0001) compared to UT. Kmf (200 μM) induced a small
amount of apoptosis in HepG2 cells (% subG1=0.63 vs. 0.02% for UT)
(Fig. 7B). In addition, Kmf (400
μM) clearly inhibited the growth of cancer cells by
increasing the population in S-phase (P=0.0001) and
G2/M-phase (P=0.116) with a concomitant decrease in the
number of cells in the G0/G1 phase (P=0.001)
compared to UT. Kmf (400 μM) evidently induced apoptosis in
HepG2 cells (% subG1=6.20 vs. 0.02%; Fig. 7B). Simultaneous combined treatment
with Sora (5 μM) and Kmf (200 μM) also increased the
population of HepG2 cells in the S-phase (P=0.0001) and
G2/M-phase (P=0.05) with a corresponding reduction in
the percentage of cells in the G0/G1 phase
(P=0.0001) compared to UT. This combined treatment induced
apoptosis in HepG2 cells (% subG1=8.4 vs. 0.02% for UT; Fig. 7B). Furthermore, simultaneous
combined treatment with Sora (5 μM) and Kmf (400 μM)
increased the population of HepG2 cells in S-phase (P=0.0001) and
G2/M-phase (P=0.563) with corresponding decrease in the
number of cells in G0/G1-phase (P=0.0001) compared to UT. This
combination also induced apoptosis in HepG2 cells (% subG1=3.3 vs.
0.02% for UT; Fig. 7B).
Simultaneous combined treatment of HepG2 with Sora
(5 μM) and Kmf (200 μM) significantly increased the
number of cells in both the S-phase (P= 0.0001) and
G2/M-phase (P=0.013) with corresponding significant
decrease in the cell number in G0/G1-phase
(P= 0.0001) compared to single treatment with Sora (5 μM;
Fig. 7B). Furthermore, this
combination significantly increased the accumulation of HepG2 cells
in G0/G1-phase (P=0.002) with corresponding
decrease in the number of cells in both S-phase (P=0.01) and
G2/M-phase (P=0.02) compared with the single treatment
with Kmf (200 μM; Fig.
7B). Simultaneous combined treatment of HepG2 with Sora (5
μM) and Kmf (400 μM) significantly increased the
number of cells in both S-phase (P=0.0001) and
G2/M-phase (P=0.05) with corresponding decrease in the
cell population in G0/G1-phase (P=0.0001)
compared to single treatment with Sora (5 μM; Fig. 7B). Also, this combined treatment
significantly increased the accumulation of cells in both S-phase
(P=0.0001) and G2/M-phase (P=0.05) with concomitant
significant decrease in population of cells in
G0/G1-phase (P=0.0001) compared to treatment
with Kmf (400 μM; Fig.
7B).
Assessment of apoptosis in hepatic
cancer cell lines after mono- and simultaneous combined treatment
with Sora and Cur or Kmf
DNA fragmentation, one of the hallmarks of
apoptosis, is chromosomal DNA fragmentation into 180-200 bp
segments in numerous cell types. DNA fragmentation was identified
to be dependent on the type and dose of treatment regimen as well
as type of hepatic cancer cell line (Fig. 8A–D). Hep3b treated with Sora, Cur
alone and combined exhibited increased DNA fragmentation profile
compared with HepG2 (Fig. 8A and
B). On the other hand, HepG2 treated with Sora, Kmf alone and
combined demonstrated increased DNA fragmentation than that
observed in Hepb3 (Fig. 8C and
D). Simultaneous combined treatment with Sora and Cur or Kmf
demonstrated higher DNA fragmentation patterns than that produced
by single treatment with Sora, Cur or Kmf.
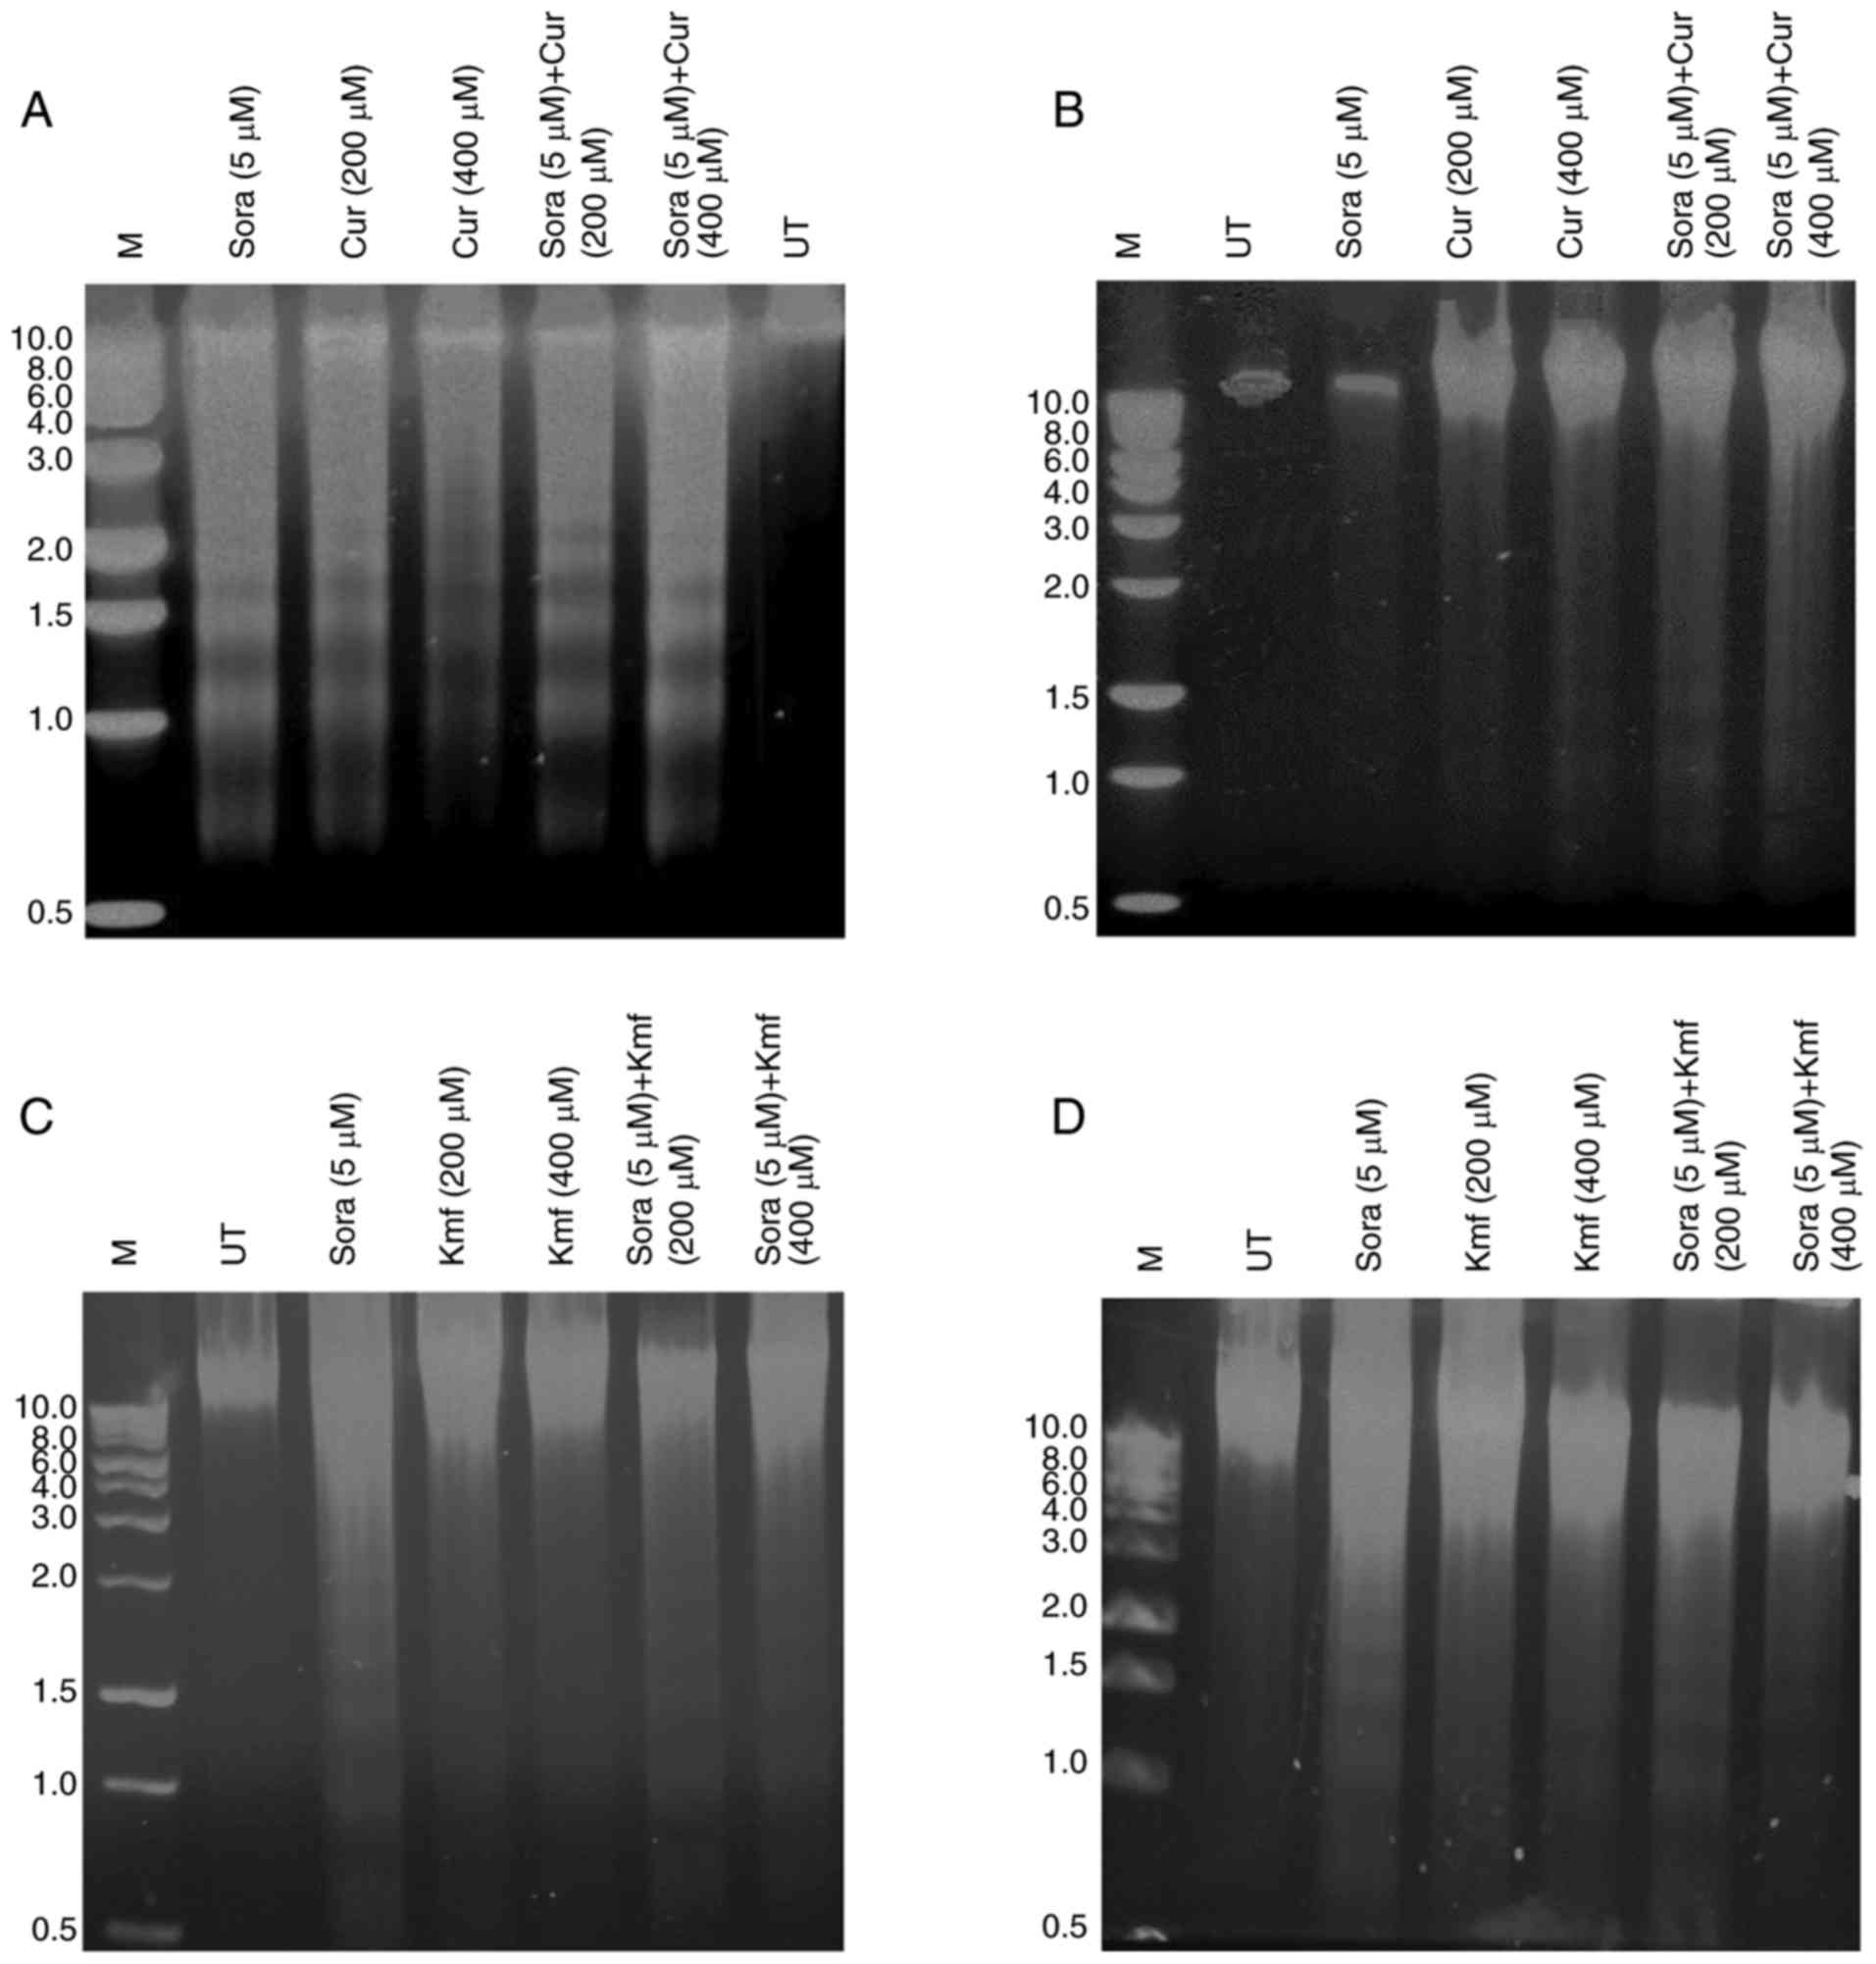 | Figure 8Analysis of DNA fragmentation in
human hepatic cancer cell lines treated with Sora, Cur, Kmf and
their simultaneous combinations. (A and B) Hep3b and HepG2 hepatic
cancer cell lines treated with Sora (5 μM), Cur (200 or 400
μM), or their simultaneous combinations or (C and D) Sora (5
μM), Kmf (200 or 400 μM) and their simultaneous
combinations for 48 h. DNA fragments were extracted and analyzed on
1% agarose. M, 1,000 bp DNA marker. Sora, sorafenib; Kmf,
kaempferol; UT, untreated; Cur, curcumin. |
Annexin V/PI double staining
In the early stages of apoptosis,
phosphatidylserine (PS) translocates from the inner side of the
plasma membrane to the outer layer, therefore exposing PS at the
external surface of the cell. Annexin-V, a calcium-dependent
phospholipid-binding protein, has a high affinity for PS and can be
used as a sensitive probe to measure the exposure of this
phospholipid on the cell membrane (16). During the initial stages of
apoptosis, the cell membrane remains intact. However, during later
stages, the cell membrane loses its integrity and becomes leaky.
Therefore, the measurement of Annexin-V binding to the cell surface
can be performed in conjunction with a dye-exclusion test, to
establish the integrity of the cell membrane and determine the
stage of apoptosis (16). A
common dye for this application is propidium iodide (PI).
UT Hep3b cells displayed low levels of apoptosis,
with only 1.7% of cells in early apoptosis, 2.2% in late apoptosis
and 2.0% being necrotic (Fig.
9A-a). Sora (5 μM) markedly induced apoptosis with 59.7%
of cells in early apoptosis, 20.3% in late apoptosis and 1.8% being
necrotic (Fig. 9A-b). However,
Cur (200 μM) caused a lower level of apoptosis than Sora,
with 5.3% of cells in early apoptosis, 12.8% in late apoptosis and
7.7% being necrotic (Fig. 9A-c).
By contrast, Cur (400 μM) induced a higher amount of
apoptosis than Sora, with 0.3% of cells in early apoptosis, 77.5%
in late apoptosis and 21.6% being necrotic (Fig. 9A-d). Simultaneous combined
treatment of Hep3b cells with Sora (5 μM) and Cur (200
μM) resulted in higher levels of apoptosis than those
produced by monotreatment with either Sora or Cur (200 μM),
with 24.9% cells in early apoptosis, 38.5% in late apoptosis and
4.3% being necrotic (Fig. 9A-e).
Simultaneous treatment with Sora (5 μM) and Cur (400
μM) also produced a higher level of apoptosis than treatment
with Sora or Cur (400 μM) alone, with 0.0% cells in early
apoptosis, 90.4% in late apoptosis and 9.4% being necrotic
(Fig. 9A-f).
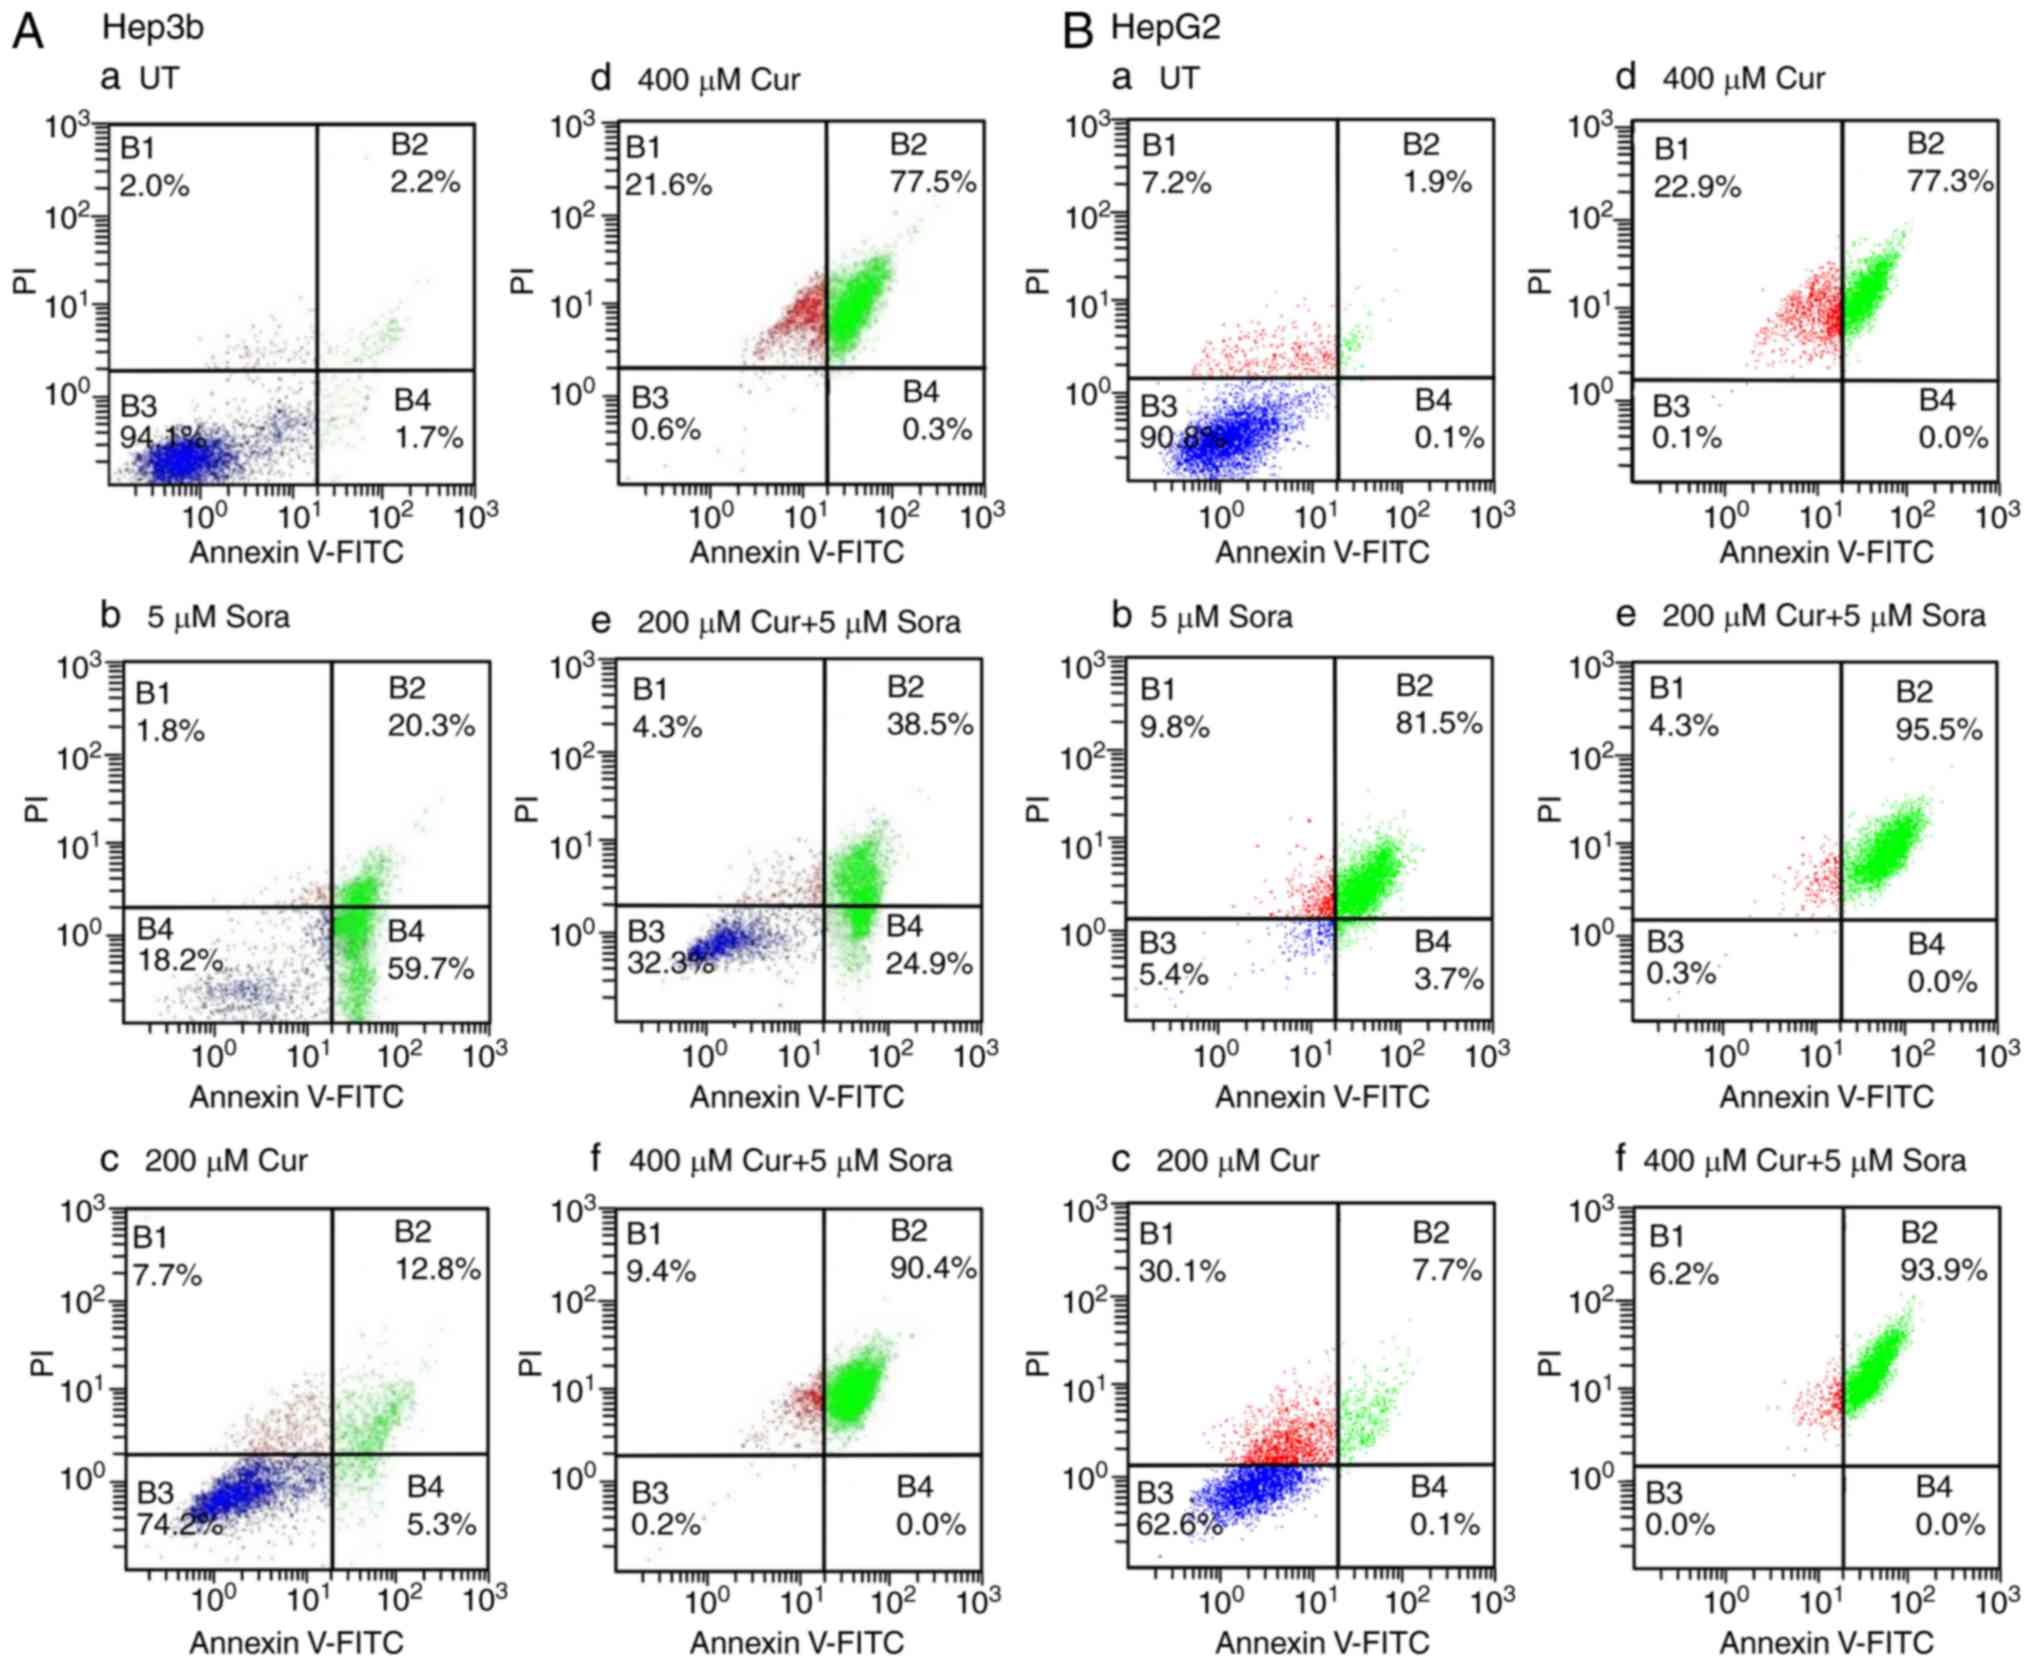 | Figure 9Flow cytometric analysis of apoptosis
of human hepatic cancer cell lines treated with Sora, Cur and their
simultaneous combinations. (A) Hep3b and (B) HepG2 hepatic cancer
cell lines were (a) left untreated or treated with (b) Sora (5
μM), (c) Cur (200 μM), (d) Cur (400 μM), or (e
and f) simultaneous combinations of Sora and Cur (5 μM + 200
μM, respectively) or (5 μM + 400 μM,
respectively) for 48 h. The cells were analyzed by flow cytometry
after processing and staining with Annexin V-FITC/PI. B1,
percentage of necrotic cells; B2, percentage of late apoptotic
cells; B3, percentage of viable cells; and B4, percentage of early
apoptotic cells. Sora, sorafenib; Cur, curcumin; UT, untreated; PI,
propidium iodide; FITC, fluorescein isothiocyanate. |
UT HepG2 cells exhibited only low levels of
apoptosis with 0.1% cells in early apoptosis, 1.9% in late
apoptosis and 7.2% being necrotic (Fig. 9B-a). Sora (5 μM) induced a
high level of apoptosis with 3.7% of cells in early apoptosis,
81.5% in late apoptosis and 9.8% being necrotic (Fig. 9B-b). By contrast, Cur (200
μM) induced a lower amount of apoptosis than Sora, with 0.1%
cells in early apoptosis, 7.7% in late apoptosis and 30.1% being
necrotic (Fig. 9B-c). However,
Cur (400 μM) markedly induced apoptosis, with 0.0% cells in
early apoptosis, 77.3% in late apoptosis and 22.9% being necrotic
(Fig. 9B-d). In addition,
compared with monotreatment with Sora or Cur (200 μM),
simultaneous combined treatment of HepG2 cells with Sora (5
μM) and Cur (200 μM) triggered massive apoptosis,
with 0.0% cells in early apoptosis, 95.5% in late apoptosis and
4.3% being necrotic (Fig. 9B-e).
Similarly, simultaneous combined treatment with Sora (5 μM)
and Cur (400 μM) produced markedly elevated levels of
apoptosis, with 0.0% of cells in early apoptosis, 93.9% in late
apoptosis and 6.2% being necrotic (Fig. 9B-f).
Treatment of Hep3b cells with Kmf (200 μM)
resulted in high levels of apoptosis with 23.5% of cells in early
apoptosis, 12.8% in late apoptosis and 7.7% being necrotic
(Fig. 10A-c). In addition, Kmf
at 400 μM produced higher levels of apoptosis than Kmf at
200 μM, with 49.5% of cells in early apoptosis, 23.7% in
late apoptosis and 3.0% being necrotic (Fig. 10A-d). Compared with monotreatment
with Sora (5 μM) or Kmf (200 μM), their simultaneous
combined treatment induced larger amounts of apoptosis with 50.9%
cells in early apoptosis, 18.1% in late apoptosis and 5.4% being
necrotic (Fig. 10A-e).
Simultaneous combined treatment with Sora (5 μM) and Kmf
(400 μM) induced a higher level of apoptosis compared with
the respective monotreatments, with 63.6% of cells in early
apoptosis, 16.0% in late apoptosis, and 3.5% exhibiting necrosis
(Fig. 10A-f).
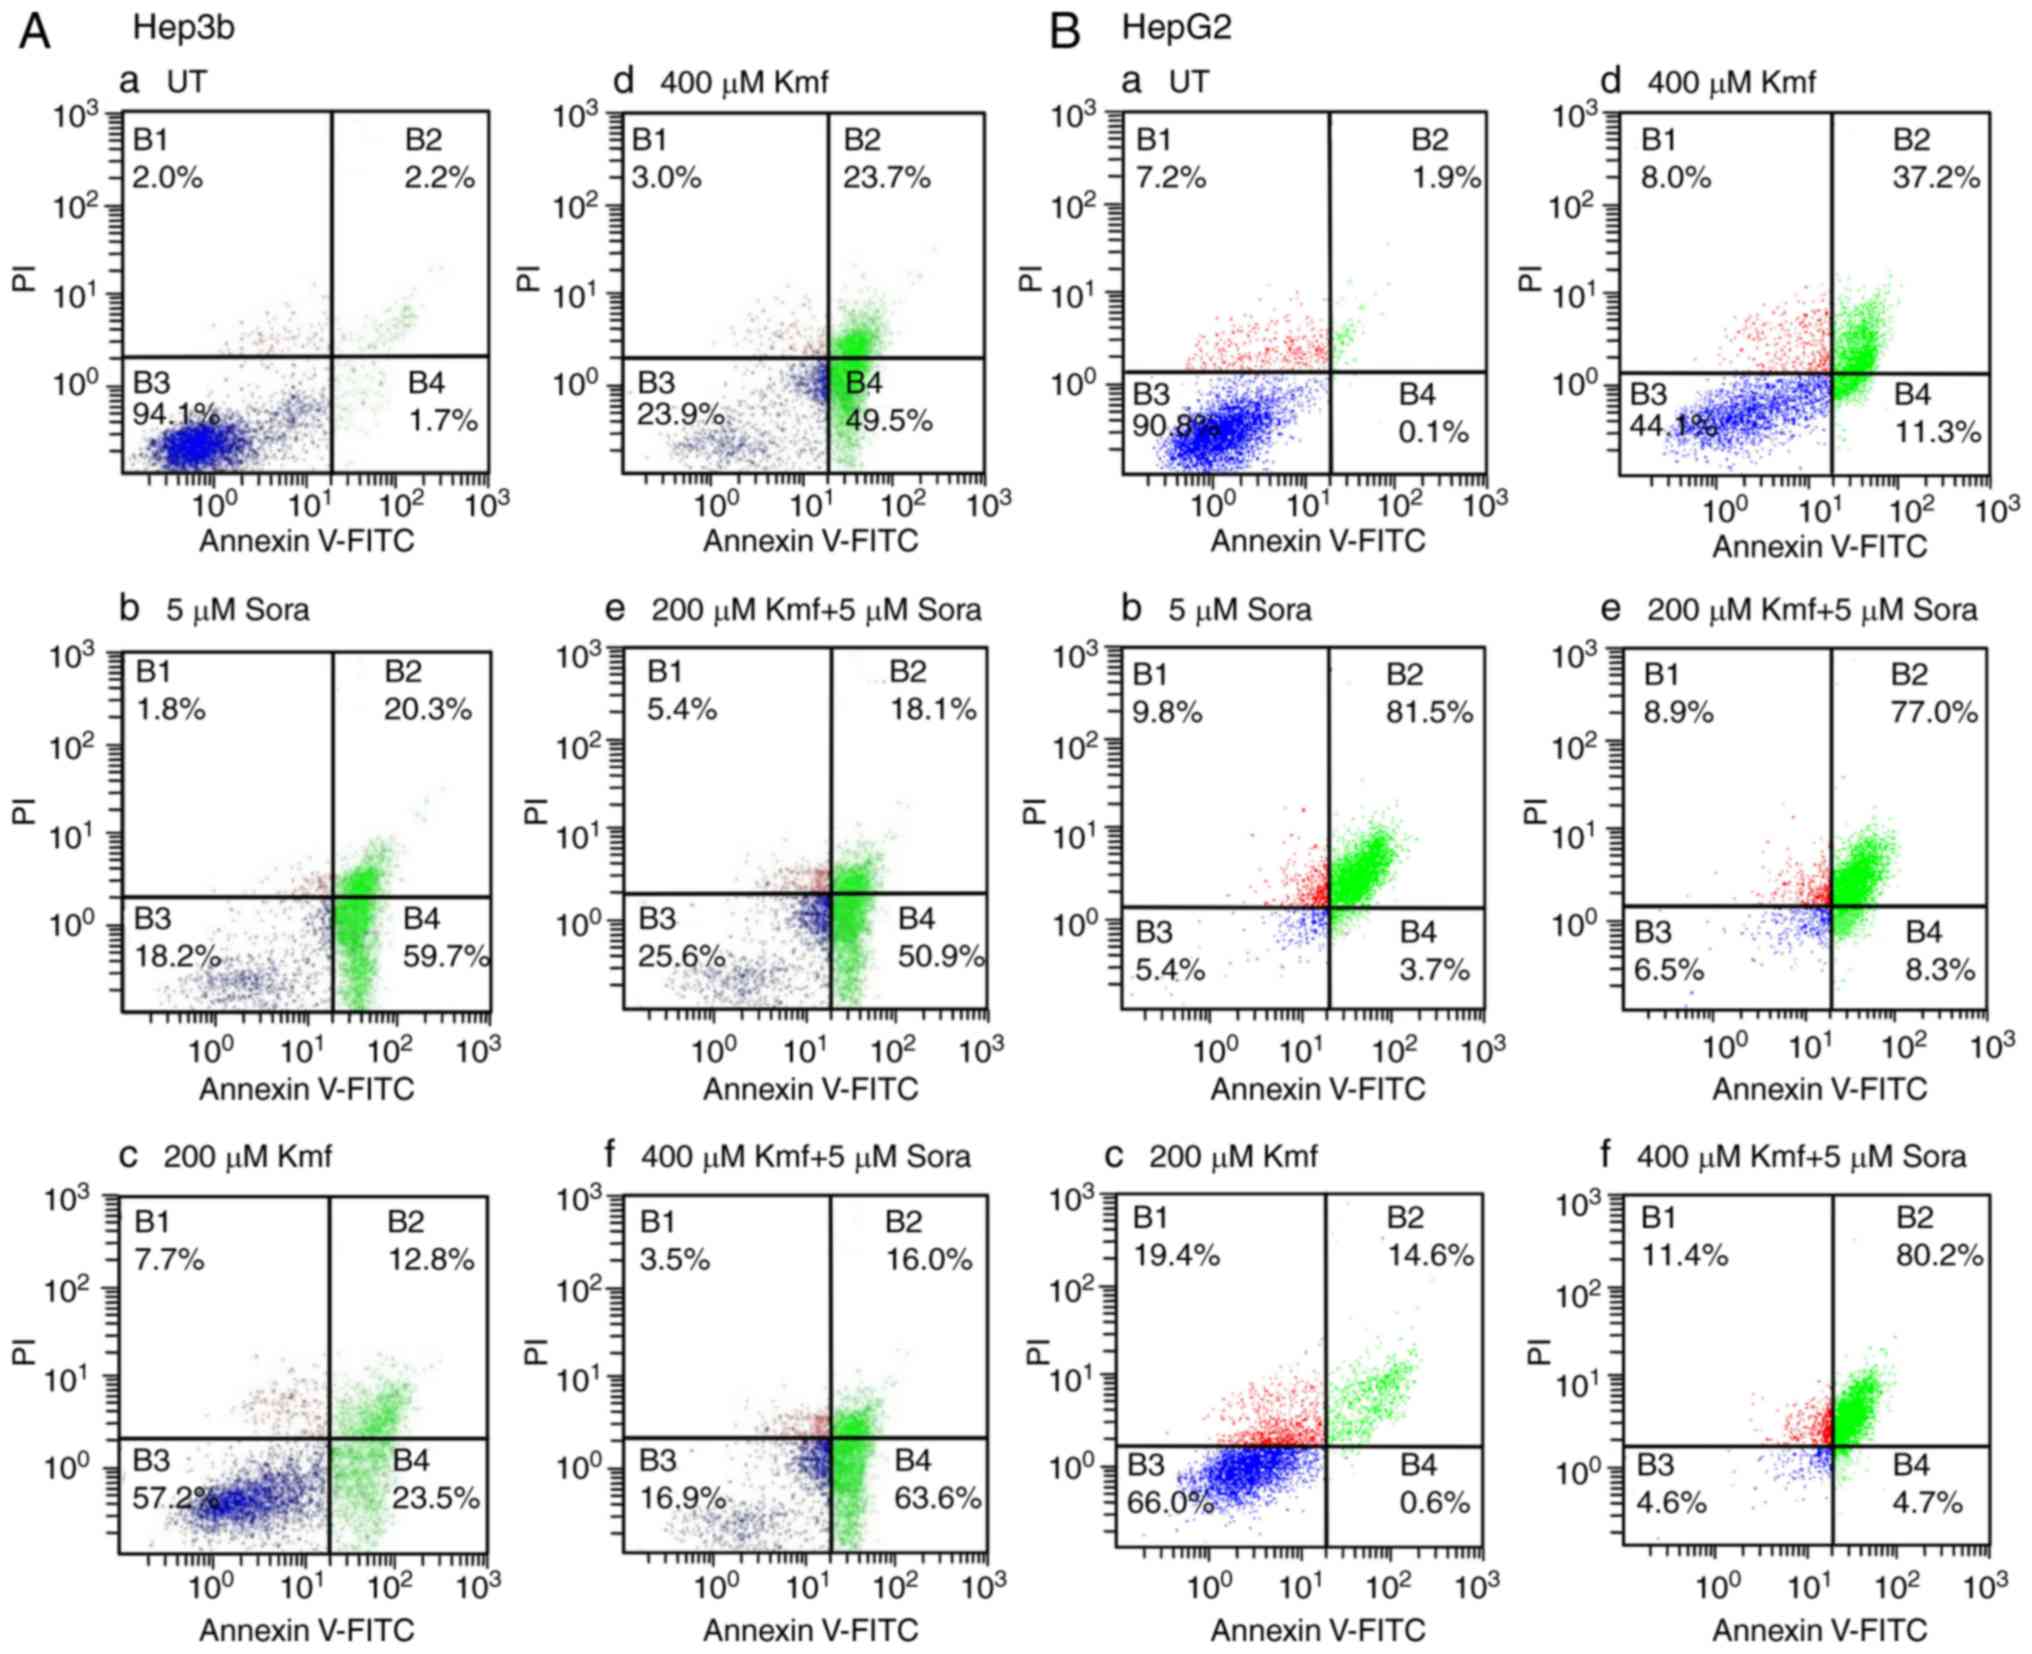 | Figure 10Flow cytometric analysis of apoptosis
in human hepatic cancer cell lines treated with Sora, Kmf and their
simultaneous combinations. (A) Hep3b and (B) HepG2 hepatic cancer
cell lines were (a) left untreated or treated with (b) Sora (5
μM), (c) Kmf (200 μM), (d) Kmf (400 μM), or (e
and f) simultaneous combinations of Sora and Kmf (5 μM + 200
μM, respectively) or (5 μM + 400 μM,
respectively) for 48 h. The cells were analyzed by flow cytometry
after processing and staining with Annexin V-FITC/PI. B1,
percentage of necrotic cells; B2, percentage of late apoptotic
cells; B3, percentage of viable cells; and B4, percentage of early
apoptotic cells. Sora, sorafenib; Kmf, kaempferol; UT, untreated;
PI, propidium iodide; FITC, fluorescein isothiocyanate. |
Treatment of HepG2 cells with Kmf (200 μM)
induced lower levels of apoptosis compared with those produced by
Sora (5 μM; Fig. 10B-b),
with 0.6% cells in early apoptosis, 14.6% in late apoptosis and
19.4% exhibiting necrosis (Fig.
10B-c). Kmf (400 μM) induced higher levels of apoptosis
than Kmf (200 μM) with 11.3% of cells in early apoptosis,
37.2% in late apoptosis and 8.0% exhibiting necrosis; however, the
extent of apoptosis induced by Kmf (400 μM) was still lower
than that produced by Sora (Fig.
10B-d). Furthermore, simultaneous combined treatment with Sora
(5 μM) and Kmf (200 μM) triggered a higher amount of
apoptosis compared with monotreatment with Kmf (200 μM),
with 8.3% of cells in early apoptosis, 77.0% in late apoptosis and
8.9% exhibiting necrosis (Fig.
10B-e). Simultaneous combined treatment with Sora (5 μM)
and Kmf (400 μM) also induced a higher level of apoptosis
compared with monotreatment with Kmf (400 μM) and Sora, with
4.7% in early apoptosis, 80.2% in late apoptosis and 11.4%
exhibiting necrosis (Fig.
10B-f).
MMP
Alterations in the MMP of the cancer cell lines
were measured following mono- and combined treatments with Sora and
Cur or Kmf. UT cells accumulated the MitoNIR dye in the
mitochondria, resulting in increased red fluorescence intensity;
however, in apoptotic cells, the NIR staining intensity decreased
due to the decline in MMP. The MMP was monitored in Hep3b and HepG2
cells following monotreatment with Sora, Cur and Kmf as well as
simultaneous combined treatment with Sora/Cur and Sora/Kmf. The
obtained results (Figs. 11A, B
and 12A, B) demonstrated that
the red fluorescence of the MitoNIR dye shifted more to the left
with combined treatments compared to that observed with
monotreatment with Sora, Cur or Kmf. This suggests a decrease in
fluorescence intensity of the MitoNIR dye and thus more extensive
mitochondrial membrane damage due to the larger amount of apoptosis
following combined treatment. One exception was Cur (400
μM), which caused a right shift of the red fluorescence of
the MitoNIR dye with HepG2, indicating no change in MMP (Fig. 11B-f). A previous study has
reported that Cur inhibited UV irradiation-induced loss of MMP and
cytochrome C release in human epidermoid carcinoma A431 cells
(17). Additionally, in a recent
study, pretreatment of HeLa cervical cancer cells with Cur reduced
vinblastine-induced ROS production, microtubule depolymerization
and the collapse of MMP (18).
The inhibitory effect of Cur on apoptotic biochemical alterations
triggered by several stimuli has been attributed to its
anti-oxidant properties (19).
Perturbation of the MMP in the HCC cells was dependent on the type
of hepatic cancer cell line, the tested NPC and the combined
treatment (Figs. 11A, B and
12A, B).
 | Figure 11Flow cytometric analysis of MMP in
human hepatic cancer cell lines treated with Sora, Cur and their
simultaneous combinations. (A) Hep3b and (B) HepG2 hepatic cancer
cell lines were (a) left untreated or treated with (b) Sora (5
μM), (c) Cur (200 μM), (d) Cur (400 μM), or (e
and f) simultaneous combinations of Sora and Cur (5 μM + 200
μM, respectively) or (5 μM + 400 μM,
respectively) for 48 h. Alterations in MMP were monitored by
staining with the MitoNIR dye and flow cytometric analysis with
excitation/emission wavelengths of 635 and 660 nm, respectively.
The red and white curves are the control and experimental groups,
respectively. MMP, mitochondrial membrane potential; Sora,
sorafenib; Cur, curcumin. |
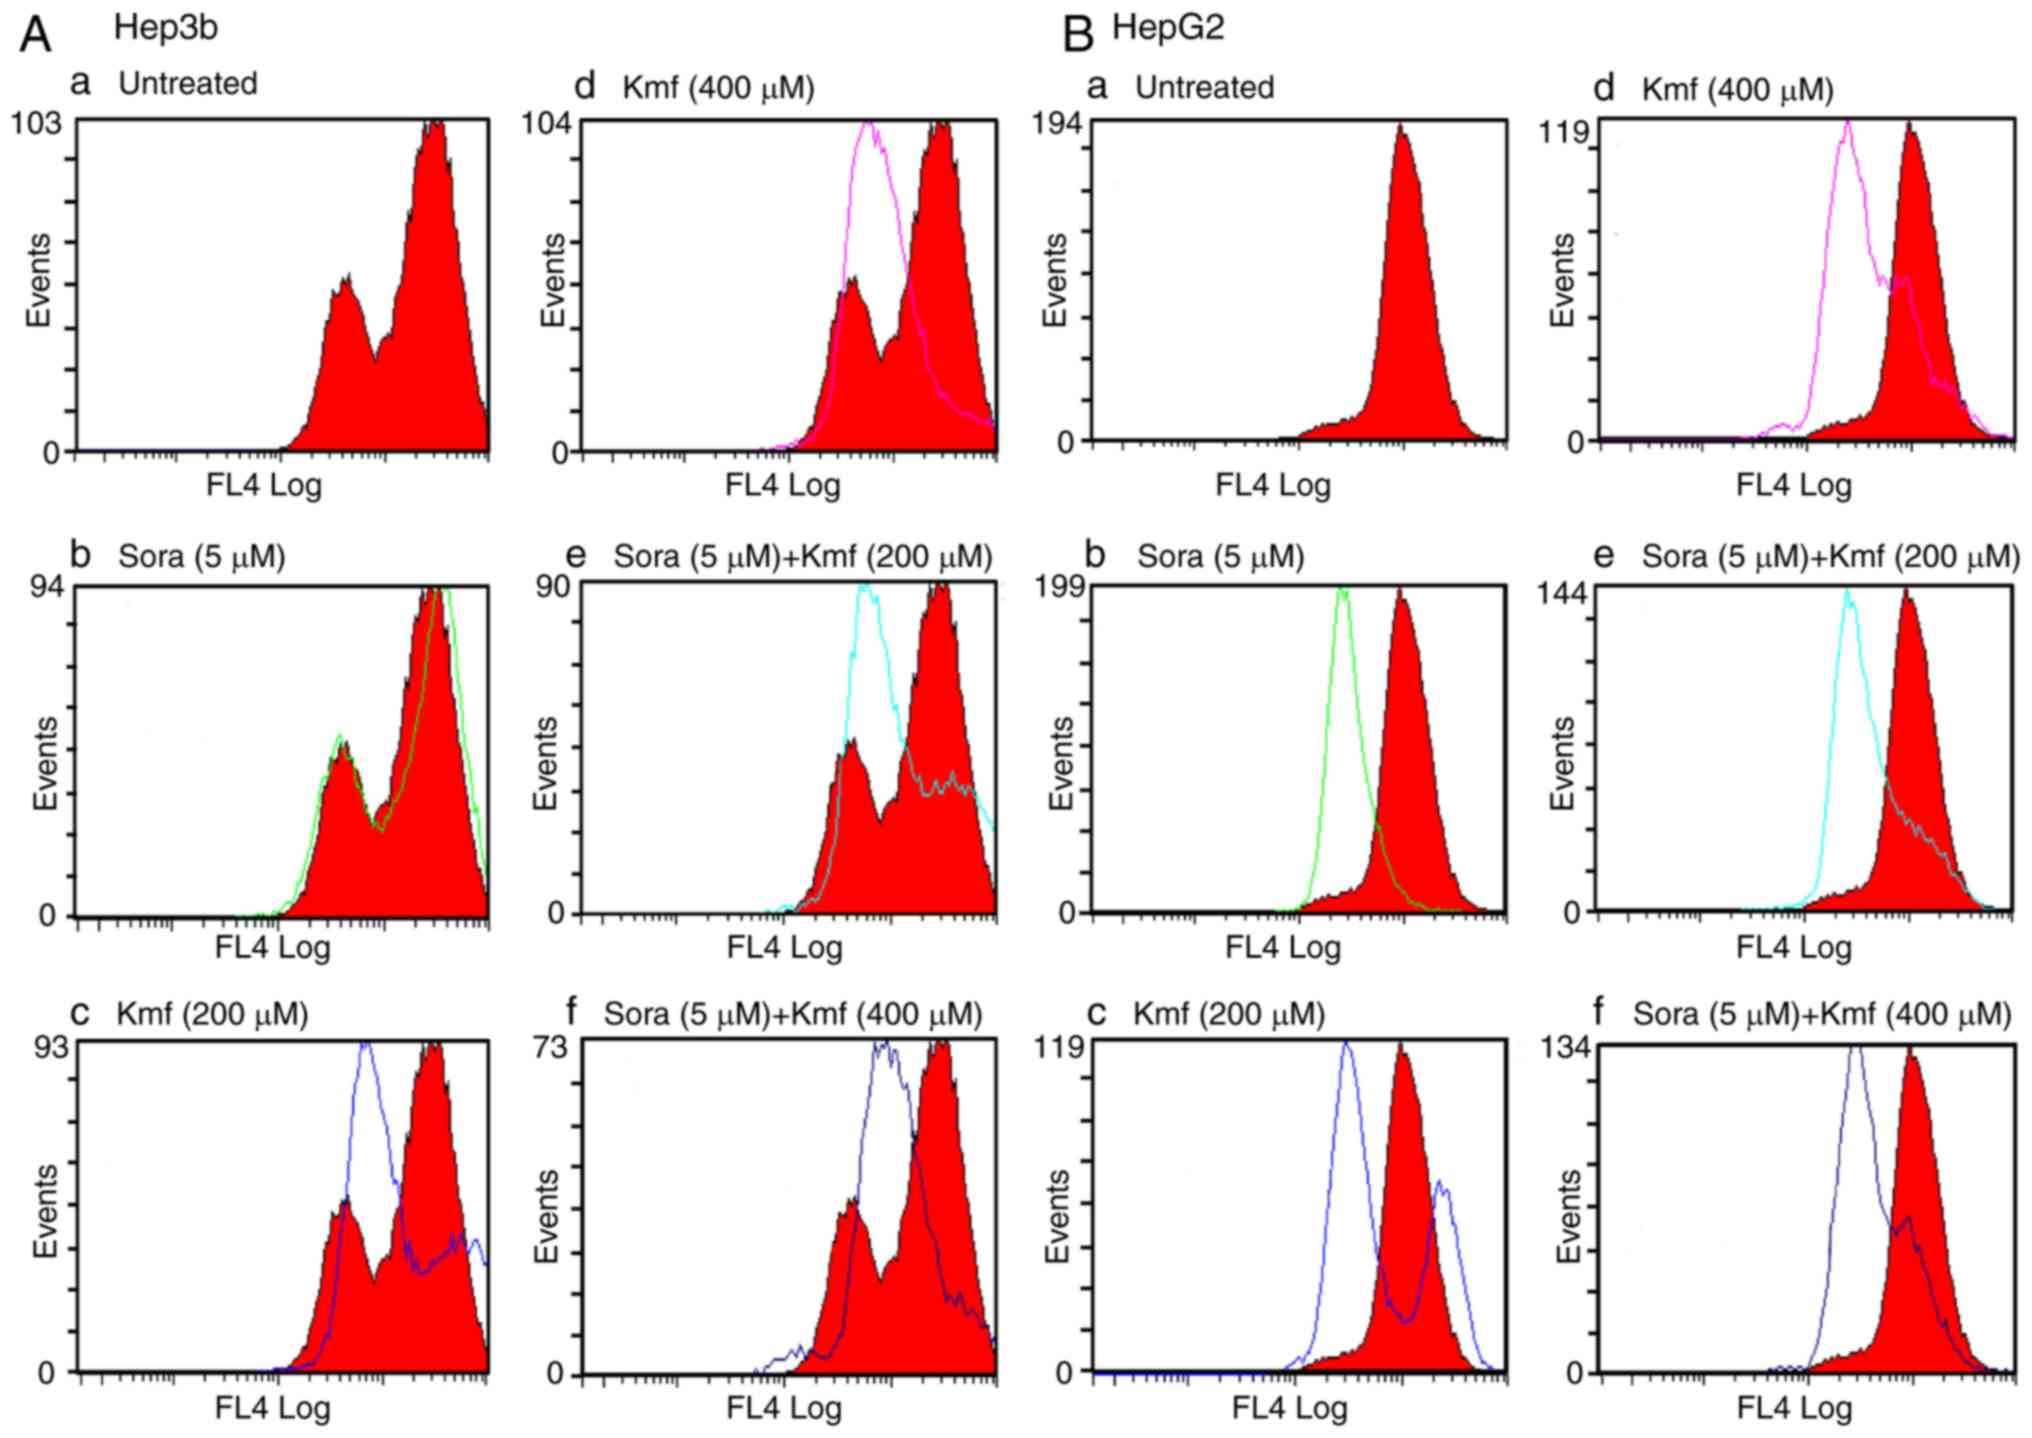 | Figure 12Flow cytometric analysis of MMP in
human hepatic cancer cell lines treated with Sora, Kmf and their
simultaneous combinations. (A) Hep3b and (B) HepG2 hepatic cancer
cell lines were (a) left untreated or treated with (b) Sora (5
μM), (c) Kmf (200 μM), (d) Kmf (400 μM), or (e
and f) simultaneous combinations of Sora and Kmf (5 μM + 200
μM, respectively) or (5 μM + 400 μM,
respectively) for 48 h. Alterations in MMP were monitored by
staining with the MitoNIR dye and flow cytometric analysis with
excitation/emission wavelengths of 635 and 660 nm, respectively.
Alterations in MMP were monitored by staining with the MitoNIR dye
and flow cytometric analysis with excitation/emission wavelengths
of 635 and 660 nm, respectively. The red and white curves are the
control and experimental groups, respectively. MMP, mitochondrial
membrane potential; Sora, sorafenib; Kmf, kaempferol. |
Effect of Sora, Cur and their
simultaneous combined treatment on the expression of cell cycle-
and apoptosis-associated proteins in Hep3b cells
To explore the mechanisms underlying the anticancer
effects of Sora, Cur and their combination in HCC cells, the
expression of cell cycle- and apoptosis-associated proteins was
investigated by western blot analysis. The focus was on studying
the effects of Sora, Cur and their simultaneous combinations, while
the combinations of Sora and other NPCs are currently under
investigation and will be reported in a separate publication. The
expression levels of p27 decreased in Hep3b cells after
monotreatment with Cur (400 μM) and simultaneous combined
treatment with Sora (5 μM) and Cur (400 μM) compared
with those in vehicle-treated controls (Fig. 13A-a). On the other hand, a slight
increase in the level of p27 was identified with a single treatment
with Cur (200 μM) compared with the vehicle-treated control.
Furthermore, the levels of cyclin A2, cyclin B, cyclin D1 and pRb
proteins were markedly decreased in Hep3b cells following
simultaneous treatment with Sora/Cur (400 μM) and
monotreatment with Cur (400 μM). On the other hand, pRb and
cyclin B levels slightly increased following treatment with Cur
(200 μM) compared with the UT group. (Fig. 13A-b-e). The levels of the
pro-apoptotic proteins Bax (Fig.
13B-a), cleaved-caspase-3 (Fig.
13B-b) and cleaved-caspase-9 (Fig. 13B-c) were markedly increased. On
the other hand, the expression of the anti-apoptotic protein Bcl-xL
was decreased following mono- and simultaneous combined treatment
with Sora (5 μM) and Cur (400 μM) and slightly
decreased following single treatment with Cur (200 μM) and
simultaneous combined treatment with Sora (5 μM) and Cur
(200 μM; Fig. 13B-d).
β-actin expression was used as an internal control to monitor the
protein loaded onto the gel (Fig.
13A-f and B-e).
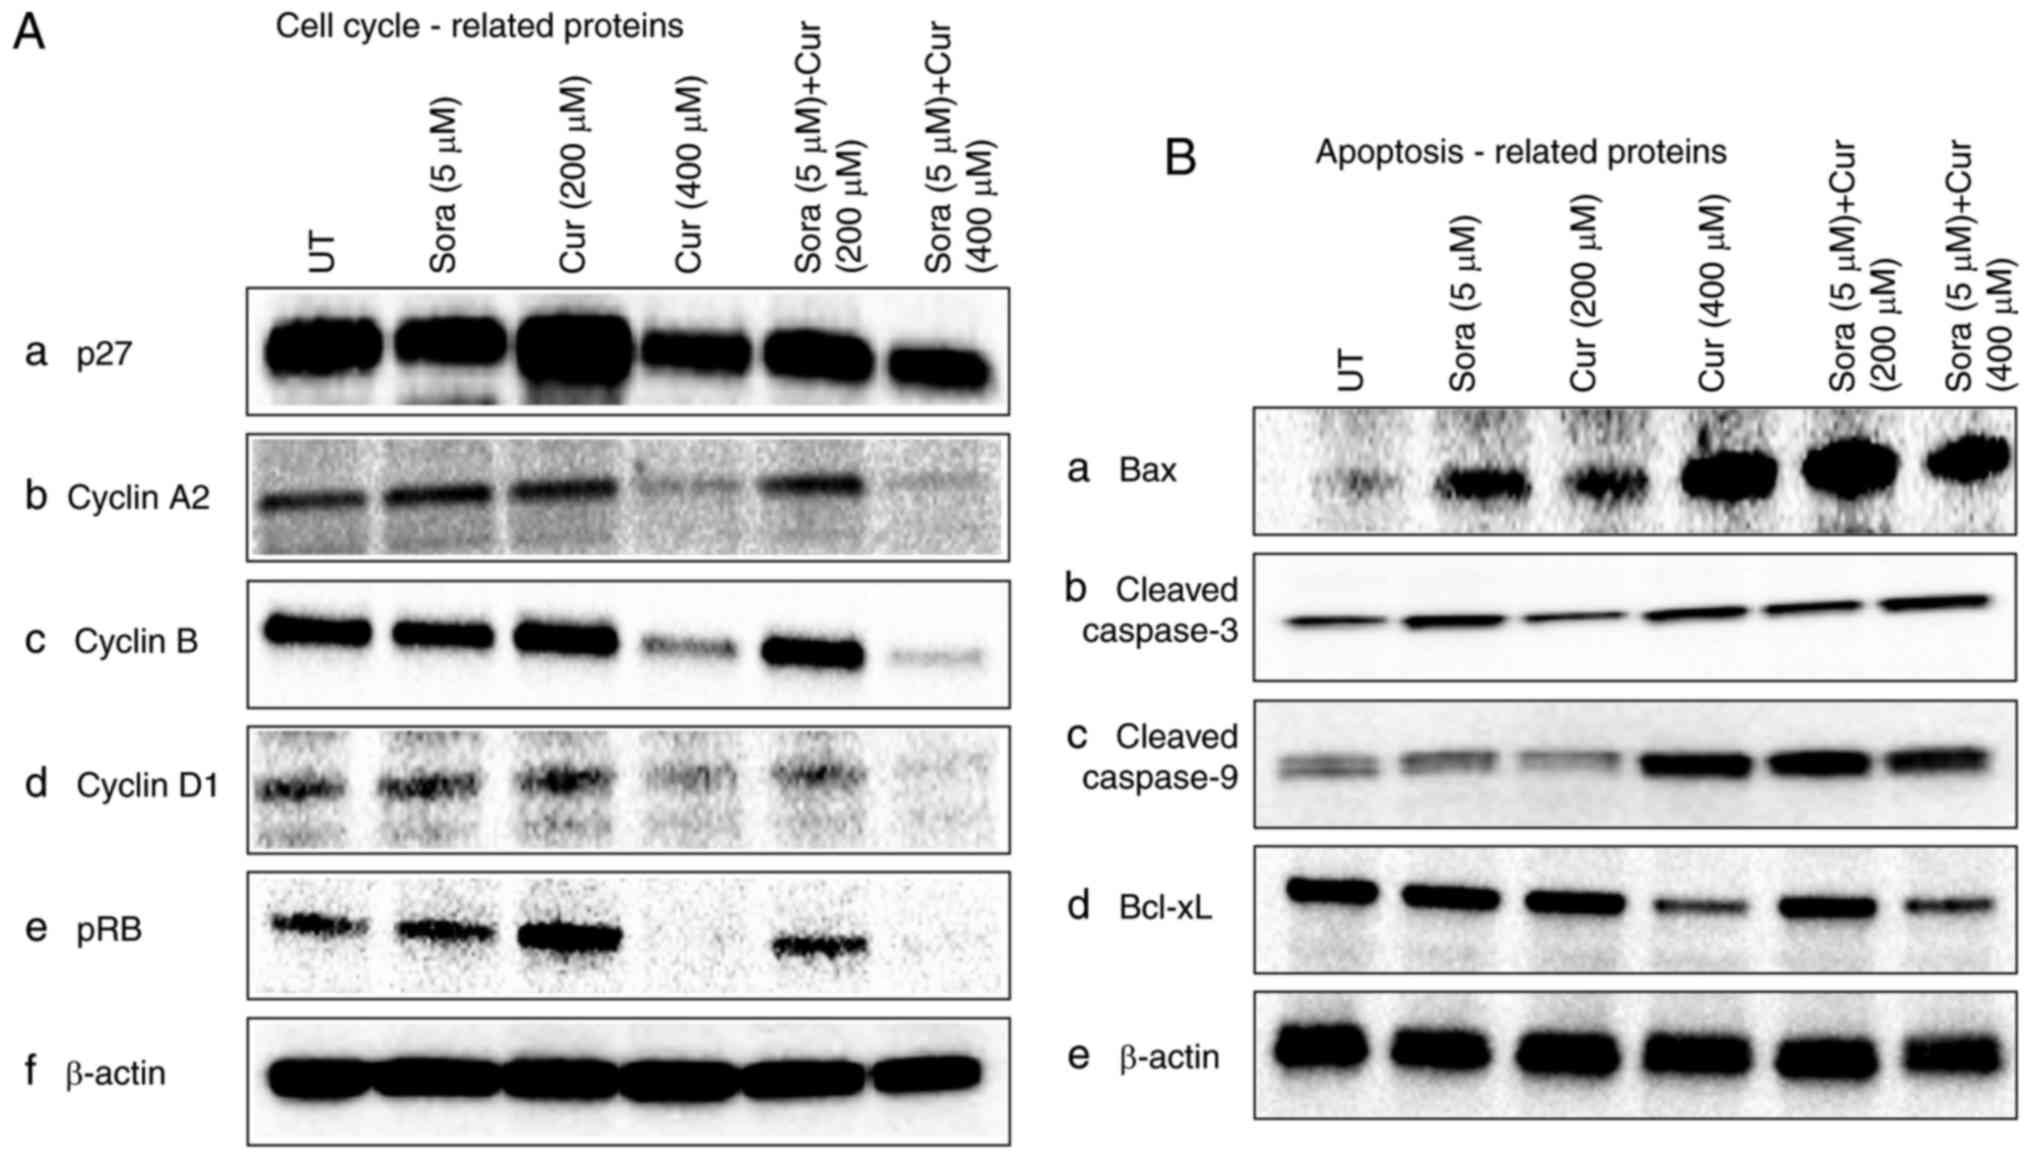 | Figure 13Western blot analysis of the levels
of cell cycle and apoptosis-associated proteins in the extract of
human hepatic cancer cell lines Hep3b and HepG2 treated with Sora,
Cur, and their combinations. The cells were treated with Sora (5
μM), Cur (200 μM), Cur (400 μM) or a
simultaneous combination of Sora and Cur (5 μM + 200 or 400
μM) for 48 h. The levels of proteins associated with the
control of cell cycle and apoptosis were analyzed by western blot
analysis. Signal intensities of the respective bands were
densitometrically quantified. (A) Cell cycle-associated proteins
and (B) apoptosis-associated proteins. Sora, sorafenib; Cur,
curcumin; UT, untreated; pRb, retinoblastoma protein; Bcl-xL,
B-cell lymphoma extra-large protein; Bax, B-cell lymphoma
2-associated X protein. |
Discussion
Sora has been approved by the FDA for the clinical
treatment of HCC and renal cell carcinomas (20). However, up to 80% of Sora-treated
patients experience toxic side effects, including hand-foot
syndrome, diarrhea, fatigue, rash and weight loss (21). Due to these adverse side effects,
a dose reduction was necessary in >60% of the patients and in
6-25% of patients, treatment was discontinued according to a
previous study (21).
Sora has several properties that suggest it may be
useful as part of a combination treatment for patients with
advanced cancer. Sora's multiple targets include Raf-1 (22), wild-type B-Raf, oncogenic b-raf
V600E and pro-angiogenic receptor tyrosine kinases (23), enabling it to act on the tumor and
tumor vasculature to induce apoptosis, inhibit proliferation and
angiogenesis, and providing Sora with the potential for activity
against a wide variety of tumor types (24).
Considerable efforts have been made to improve the
therapeutic efficacy and reduce the side effects of Sora, as well
as to overcome resistance against it. Combination therapy that
allows for a dose reduction of Sora without decreasing its efficacy
may be an option to minimize its adverse effects and overcome drug
resistance (25).
Investigation of the efficacy of plant-derived
drugs has received increasing attention owing to their excellent
chemotherapeutic and chemopreventive activities, besides the fact
that they are thought to be well-tolerated, non-toxic, easily
available and inexpensive (11);
furthermore, bioactive natural products may act in synergy with
drugs used in cancer therapy (26,27).
Combination therapy of Sora with another
chemotherapeutic agent is currently not utilized in clinical
practice. However, combining drugs with different mechanisms of
action is theoretically a rational approach in the treatment of
hepatocellular carcinoma (3,28).
Therefore, the development of an effective cancer chemotherapeutic
approach and/or combination with an agent with fewer side effects
is urgently required for improving the management of cancer
patients treated with Sora.
The goal of the present study was to investigate
the ability of a panel of NPCs to potentiate the anticancer effects
of Sora in hepatic cancer cells, i.e. whether combined therapy with
NPCs allows for a dose reduction of Sora without the concomitant
loss of effectiveness. The present study aimed to identify the best
drug combinations and the best combined administration strategies
as well as the potential underlying molecular mechanisms of
action.
The cytotoxic effect of Sora and the panel of 14
NPCs, including Kmf, Que, Rsv, Cur, Irt, Snn, Sil, Sul, Lyp, Hsp,
BetA, Cmr, I3C and HHG, was initially examined in the CRL1554
normal human fibroblast cell line. Sora exhibited a marked growth
inhibitory effect (% cytotoxicity=4.76-100). However, the tested
NPCs demonstrated variable cytotoxic effects ranging from 0 to
100%; only those with little (<20%, Que) or no cytotoxic effects
(Cur, Rsv, and Kmf) on the normal fibroblast cell line were
selected for further testing in combination studies. Based on the
dose-dependent anticancer activity on hepatic cancer cell lines,
the concentrations of 60 or 120 μM for Cur, Que and Kmf, as
well as 40 or 80 μM for Rsv were selected for testing the
various combination approaches. Sora was used at a concentration
range of 2.5-10 μM, as this falls within the clinically
relevant range achievable in plasma (5-15 μM) (29).
In the present study, various schedules of
administration of Sora and NPCs (Cur, Kmf, Que and Rsv) were tested
in the human hepatic cancer cell lines Hep3b and HepG2. NPCs
potentiate the lethality of Sora in the following order: Cur >
Kmf > Rsv > Que, in a dose-, hepatic cancer cell type-, NPC
type- and administration schedule-dependent manner. The present
results are in agreement with the results reported in a series of
combination studies with Sora and different anticancer agents used
in the treatment of various solid tumor types. For instance,
combination treatment with fisetin and Sora reduced the growth of
human melanoma cells harboring b-Raf mutation more effectively and
at lower doses compared with treatment with individual agents
(30). Fisetin also potentiated
the Sora-mediated reduction of colony formation by melanoma cells
harboring a b-Raf mutation and enhanced apoptosis. In athymic nude
mice subcutaneously implanted with melanoma cells (A375 and
SK-MEL-28), combined treatment with fisetin and Sora resulted in a
greater reduction of tumor growth when compared to the individual
agents (30).
Recently, sulforaphane (SF), a naturally occurring
isothiocyanate that is highly concentrated in broccoli sprouts, was
reported to eliminate pancreatic cancer stem cells via
down-regulation of nuclear factor-κB activity, without inducing
toxic side effects (31). Sora
and SF synergistically inhibited pancreatic cancer stem cells in
vitro. This combination therapy resulted in a more pronounced
induction of cell death than monotreatment with either substance
alone, as indicated by analysis of cell morphology, as well as
colony and spheroid formation (31). In vivo, monotreatment with
Sora or SF alone retarded tumor growth; however, combined treatment
with SF and Sora was more potent and significantly reduced tumor
growth (31).
In addition, combined treatment with Que and Sora
produced a synergistic anti-proliferative effect on the human
hepatic cancer cell lines HepG2, HuH7 and Hep4B2.1 (31). Combination of Sora with Que also
resulted in an effective cell type-specific apoptosis in anaplastic
astrocytoma cells; the percentage of dead cells was higher than
that observed after monotreatment with Sora (32). Furthermore, the combination of
nanocurcumin and Sora produced stronger antitumor effects in HCC
cells than either nanocurcumin or Sora alone; it also inhibited HCC
cell migration and invasion. The combination of nanocurcumin and
Sora also increased the apoptosis of HCC cells in vitro and
in vivo (33).
Furthermore, Sora curcumin nanoparticles (SCN)
exerted superior in vitro cytotoxic effects over those of
Sora, Cur and their physical mixture (Sora + Cur) on the hepatic
cancer cell lines BEL-7402 and HepG2 (34). In xenografts derived from BEL7402
cells, SCN treatment exhibited an obviously enhanced inhibitory
effect on tumor progression compared with monotherapy or the
physical mixture of Sora and Cur, with significantly increased
anti-proliferative and anti-angiogenic capabilities (34).
In vitro, the combination of Sora and YC-1,
a soluble guanylyl cyclase activator, synergistically inhibited the
proliferation and colony formation of the hepatic cancer cell lines
HepG2, BEL-7402 and HCCLM3 (35).
In vivo, combined treatment with Sora and YC-1 significantly
suppressed the growth of HepG2 cell-derived xenograft tumors with
decreased cell proliferation and increased apoptosis (35).
In vitro, sequential radiation treatment
(RT) followed by Sora treatment of the hepatic cancer cell lines
HuH7, Hep3b, HCC-4-4 and HepG2 increased apoptosis compared with RT
alone, while concurrent treatment produced apoptotic rates similar
to those obtained with RT alone and led to decreased colony
formation in all of the 4 cell lines (36). In vivo, sequential RT/Sora
treatment produced the greatest tumor growth delay, while the
effect of simultaneous RT/Sora treatment was identical to that of
RT alone (36). Sequential
RT/Sora treatment also produced a greater reduction in xenograft
tumor vascularity and mitotic index than either simultaneous
RT/Sora or RT alone. Thus, sequential RT/Sora demonstrated greater
efficacy against hepatic cancer than simultaneous RT/Sora treatment
in vitro and in vivo.
Finally, Sora and metformin synergistically
inhibited the growth of the anaplastic thyroid carcinoma cell line
HTh-74 and its derivative, the doxorubicin-resistant HTh74Rdox cell
line, with a more pronounced effect on HTh74Rdox cells. The two
drugs also synergistically decreased sphere formation, which
suggested a specific effect on thyroid cancer stem cells. The
addition of metformin allowed for a 25% dose reduction of Sora
without the loss of its growth-inhibitory efficacy (37). A potentiating effect of metformin
as chemosensitizer to Sora has recently been reported in
cholangiocarcinoma cells (38).
In the present study, the growth inhibition assay indicated that
simultaneous combined treatment with Sora/Cur and Sora/Kmf was
effective against Hep3b and HepG2 cells, with HepG2 being more
sensitive than Hep3b cells. Thus, it may be concluded that the
effectiveness of combined treatment of cancer cells with Sora and
NPCs depends on the type of cancer cell, the type and dose of the
NPCs, and the mode of administration. Exploration of the potential
mechanism of the combined treatment with Sora and NPCs was focused
on the most effective schedule of administration, namely the
simultaneous treatment with Sora and Cur or Kmf.
Cell growth and proliferation are controlled by the
cell cycle, and its disruption causes an imbalance between
proliferation and cell death, leading to cancer growth. Thus,
anticancer agents targeting the cell cycle may halt the
uncontrolled proliferation of cancer cells and initiate apoptosis
(39). Cell growth is normally
controlled by several genetically defined checkpoints that ensure
its coordinated progression through the different stages of the
cell cycle and monitor DNA integrity (40). In the present study, analysis of
the cell cycle and apoptosis was used to elucidate the mechanisms
involved in the synergistic effects of Cur or Kmf with Sora in the
treatment of Hep3b and HepG2 cells. The results indicated that
combined treatment of the hepatic cancer cell lines with Sora/Cur
and Sora/Kmf resulted in cell growth inhibition in the S-phase
and/or G2/M-phase, depending on the type of cancer cell
and schedule of treatment. The subG1 phase, which is comprised of
apoptotic cell bodies, is increased due to induction of apoptosis
by these combined treatments (41) and also by the majority of cancer
drugs (42).
Disruption of the cell cycle progression at the
S-phase implies that the tested combinations interfere with DNA
synthesis and disrupt the progression of the cell cycle past the
S-phase, leading to apoptosis; furthermore, blocking damaged cells
in the G2/M-phase allows ample time for DNA damage
repair or permanent obstruction of the damaged cells (43). Numerous anticancer agents have
been reported to induce apoptotic cell death by arresting the cell
cycle at the G2/M-phase (44). Cell cycle arrest in
G2/M-phase involves disruption of the
tubulin-microtubule equilibrium (45), suggesting that G2/M
arrest may have a role in the inhibition of microtubule
dynamics.
Induction of apoptosis of tumor cells is considered
expedient in the treatment of cancer (46). However, one of the challenges in
cancer treatment is the ability of cancer cells to evade apoptosis.
As a safeguard mechanism against tumori-genesis and due to genetic
and epigenetic alterations (47),
neoplastic cells become resistant to apoptosis, rendering cytotoxic
drugs ineffective.
In the present study, induction of apoptosis by
Sora, NPCs (Cur and Kmf) and their combinations was monitored in
hepatic cancer cell lines by assaying DNA fragmentation,
Annexin-V/PI double staining and MMP. The results clearly indicate
that the apoptotic effect of mono- and combined treatments was
dependent on the type of NPC, type of Sora/NPC combination and
schedule of treatment. These results are consistent with those
reported for various combinations of Sora in different types of
tumor (30,33,34,37). Combined treatment of Hodgkin
lymphoma cell lines with perifosine/Sora significantly induced
severe mitochondrial dysfunction and necrotic cell death in a
synergistic manner compared with treatment with single agents
(48). In vivo xenograft
studies demonstrated a significant induction of apoptosis and
necrosis in perifosine/Sora-treated mice compared with that in mice
receiving single agents (48).
Furthermore, combination treatment with Rsv and Sora promoted
apoptosis in HCC-bearing mice (49).
The expression of genes associated with cell cycle
and apoptosis after treatment with Sora, Cur and their simultaneous
combined treatments, the most effective regimen among the tested
combinations and administration schedules, was monitored at the
translation level using western blot analysis. The results
indicated that the expression levels of the Cdk inhibitor
p27KIP1 decreased in Hep3b cells following monotreatment
with Cur (400 μM) and simultaneous treatment with Sora (5
μM)/Cur (200 or 400 μM) compared with those in
vehicle-treated controls. The expression levels of cyclin A2,
cyclin B, cyclin D1 and p-pRb were decreased in Hep3b cells
following simultaneous treatment with Sora/Cur (400 μM) and
monotreatment with Cur (400 μM). However, the levels of
these proteins were slightly decreased following simultaneous
combined treatment with Sora and Cur (200 μM). Cyclin D1 is
required for cell cycle progression in G1 phase and inhibition of
its expression causes a block of the G1/S checkpoint
(50).
Sora has been reported to induce growth suppression
in a renal cell carcinoma (RCC) cell line and RCC-induced
xenografts and inhibit the expression of cyclin D1 and cyclin B1
(50). A study on the HCC cell
lines HLE, HLF, PLC/PRF/5, Huh-7 and Hep3b and the hepatoblastoma
cell line Huh6 treated with Sora demonstrated a decrease in the
expression levels of cyclin D1 and an increase in the levels of
cleaved caspase-3. It also inhibited cell cycle progression and
induced apoptosis (51). Combined
treatment of the colorectal cancer cell line HT-29 with Sora and RT
was reported to enhance the cytotoxicity of Sora; however, Sora
alone induced the accumulation of tumor cells in the
G2/M phase and decreased the expression of cyclin B1
(52).
In the present study, the expression of the
pro-apoptotic proteins Bax, cleaved-caspase-3 and cleaved-caspase-9
was markedly increased, while the expression of the anti-apoptotic
protein Bcl-xL was suppressed by simultaneous combined treatment of
Hep3b cells with Sora/Cur. An increased Bax/Bcl-xL ratio leads to
apoptosis via a collapse of the MMP, cytochrome c release
and caspase-3 activation (53).
In addition, the pro-apoptotic protein Bax is closely associated
with the control of mitochondrial membrane permeability and release
of cytochrome c (54). A
study on HCC cell lines and xenografts treated with Sora revealed
proteolytic activation of caspase-3 and -9, indicating that Sora
may trigger mitochondrial-mediated apoptosis (55). A recent study indicated that Sora
triggered caspase-dependent Bcl-xL protein degradation,
destabilized the mitochondria and induced rapid apoptosis in
myeloma cells (56). The results
of the present study demonstrated that simultaneous combined
treatment of hepatic cancer cells with Sora and Cur caused
G2/M- and S-phase arrest and markedly induced their
apoptosis. Cur induced apoptosis through activation of multiple
signaling pathways. Cur induced the expression of pro-apoptotic
proteins (Bax, cleaved caspase-3 and cleaved caspase-9) and
inhibited the expression of the anti-apoptotic protein Bcl-xL.
Based on these observations, treatment with Cur is likely to result
in translocation of Bax to the mitochondria, production of reactive
oxygen species, a drop in MMP, release of mitochondrial proteins
and induction of apoptosis.
A growing body of evidence has demonstrated that
Sora reduced the expression of the oncoprotein β-catenin,
particularly in HepG2 cells. In addition, exposure of HepG2 cells
to Sora activated c-Jun N-terminal kinase (JNK) and p38 MAPK
stress-associated pathways, with the two signaling pathways having
opposite roles in Sora-induced cell growth inhibition, from
cytoprotective in the case of JNK/c-Jun activation to cytotoxic in
the case of p38 MAPK activation (57). In addition, a number of genes
involved in DNA repair and recombination, as well as cell cycle
regulation, were previously reported to be downregulated by Sora
(57).
When Cur was combined with Sora, Cur augmented the
apoptosis-inducing potential of Sora. The synergistic inhibition of
cancer cell growth observed in the present study may be explained
by considering the target pathways of Sora and the various NPCs. It
appears that the MAPK pathway is a common target for Sora and
certain NPCs. In addition, Sora and certain NPCs inhibit other
growth-regulatory signaling pathways and exert anti-mitogenic
effects on hepatic cancer cell lines. The synergistic effects of
certain NPCs suggest that these agents may be utilized as
chemosensitizers to Sora treatment, and may reduce the
dose-dependent side effects of Sora by allowing for its dose
reduction. However, additional, detailed in vivo studies are
necessary to evaluate whether the combination of Sora with
bioactive natural products is effective in the treatment of hepatic
cancer and possibly other types of human cancer. Future issues,
including the optimal combinations, treatment schedules and dosages
of Sora combinations for a variety of tumor types should be
investigated to determine whether combinations of Sora with certain
NPCs offer survival benefits in patients with advanced cancer.
Acknowledgments
The authors would like to thank the Biotechnology
Center (BTC) at Kuwait University for their technical support.
Funding
This study was supported by Kuwait University
(research grant no. YS01/15).
Availability of data and materials
All data generated or analyzed during this study
are included in this published article.
Authors' contributions
AAB and MSIA equally contributed to the design of
the current study and writing the manuscript. AAB, MSIA, SIK and
RJA equally contributed in executing the analysis of the cell
cycle, MMP and apoptosis. AAB, MSIA and SIK equally contributed in
executing all the other experiments.
Ethics approval and consent to
participate
Not applicable.
Patient consent for publication
Not applicable.
Competing interests
The authors declare they have no competing
interests.
References
|
1
|
Yu MC and Yuan JM: Environmental factors
and risk for hepatocellular carcinoma. Gastroenterology.
127:S72–S78. 2004. View Article : Google Scholar : PubMed/NCBI
|
|
2
|
Bosch FX, Ribes J, Diaz M and Cléries R:
Primary liver cancer: Worldwide incidence and trends.
Gastroenterology. 127:S5–S16. 2004. View Article : Google Scholar : PubMed/NCBI
|
|
3
|
LIovet JM and Bruix J: Molecular targeted
therapies in hepatocellular carcinoma. Hepatology. 48:1312–1327.
2008. View Article : Google Scholar
|
|
4
|
LIovet JM, Ricci S, Mazzaferro V, Hilgard
P, Gane E, Blanc JF, de Oliveira AC, Santoro A, Raoul JL, Forner A,
et al: Sorafenib in advanced hepatocellular carcinoma. N Engl J
Med. 359:378–390. 2008. View Article : Google Scholar
|
|
5
|
Wilhelim SM, Adnane L, Newell P,
Villanueva A, LIovet JM and Lynch M: Preclinical overview of
sorafenib, a multikinase inhibitor that targets both Raf and VEGF
and PDGF receptor tyrosine kinase signaling. Mol Cancer Ther.
7:3129–3140. 2008. View Article : Google Scholar
|
|
6
|
Furuse J: Sorafenib for the treatment of
unresectable hepatocellular carcinoma. Biologics. 2:779–788.
2008.
|
|
7
|
Hartmann JT, Haap M, Kopp HG and Lipp HP:
Tyrosine kinase inhibitors-a review on pharmacology, metabolism and
side effects. Curr Drug Metab. 10:470–481. 2009. View Article : Google Scholar : PubMed/NCBI
|
|
8
|
Shen YC, Ou DL, Hsu C, Lin KL, Chang CY,
Lin C, Liu SH and Cheng AL: Activating oxidative phosphorylation by
a pyruvate dehydrogenase kinase inhibitor overcomes sorafenib
resistance of hepatocellular carcinoma. Br J Cancer. 108:72–81.
2013. View Article : Google Scholar :
|
|
9
|
Pezzuto JM: Plant-derived anticancer
agents. Biochem Pharmacol. 53:121–133. 1997. View Article : Google Scholar : PubMed/NCBI
|
|
10
|
Newman DJ, Cragg GM, Holbeck S and
Sausville EA: Natural products and derivatives as leads to cell
cycle pathway targets in cancer chemotherapy. Curr Cancer Drug
Targets. 2:279–308. 2002. View Article : Google Scholar : PubMed/NCBI
|
|
11
|
Sak K: Chemotherapy and dietary
phytochemical agents. Chemother Res Pract. 2012:2825702012.
|
|
12
|
Granado-Serrano AB, Martín MA, Bravo L,
Goya L and Ramos S: Quercetin induces apoptosis via caspase
activation, regulation of Bcl-2, and inhibition of PI-3-kinase/Akt
and ERK pathways in a human hepatoma cell line (HepG2). J Nutr.
136:2715–2721. 2006. View Article : Google Scholar : PubMed/NCBI
|
|
13
|
Qiu GH, Xie X, Xu F, Shi X, Wang Y and
Deng L: Distinctive pharmacological differences between liver
cancer cell lines HepG2 and Hep3B. Cytotechnology. 67:1–12. 2015.
View Article : Google Scholar :
|
|
14
|
López-Terrada D, Cheung SW, Finegold MJ
and Knowles BB: HepG2 is a hepatoblastoma-derived cell line. Hum
Pathol. 40:1512–1515. 2009. View Article : Google Scholar
|
|
15
|
Abaza MS, Al-Saffar A, Al-Sawan S and
Al-Attiyah R: c-myc antisense oligonucleotides sensitize human
colorectal cancer cells to chemotherapeutic drugs. Tumor Biol.
29:287–303. 2008. View Article : Google Scholar
|
|
16
|
Hassan M, Watari H, AbuAlmaaty A, Ohba Y
and Sakuragi N: Apoptosis and molecular targeting therapy in
cancer. Biomed Res Int. 2014:1508452014. View Article : Google Scholar : PubMed/NCBI
|
|
17
|
Chan W, Wu C and Yu J: Curcumin inhibits
UV irradiation-induced oxidative stress and apoptotic biochemical
changes in human epidermoid carcinoma A431 cells. J Cell Biochem.
90:327–338. 2003. View Article : Google Scholar : PubMed/NCBI
|
|
18
|
Lee J, Park S, Kim S, Um S and Moon E:
Curcumin hampers the antitumor effect of vinblastine via the
inhibition of microtubule dynamics and mitochondrial membrane
potential in Hela cervical cancer cells. Phytomedicine. 23:705–713.
2016. View Article : Google Scholar : PubMed/NCBI
|
|
19
|
Ruby AJ, Kuttan G, Babu KD, Rajasekharan
KN and Kuttan R: Antitumor and antioxidant activity of natural
curcuminoids. Cancer Lett. 94:79–83. 1995. View Article : Google Scholar : PubMed/NCBI
|
|
20
|
Strumberg D: Preclinical and clinical
development of the oral multikinase inhibitor sorafenib in cancer
treatment. Drugs Today (Barc). 41:773–784. 2005. View Article : Google Scholar
|
|
21
|
Shen C, Qiu Z and Luo Q: Sorafenib in the
treatment of radioiodine-refractory differentiated thyroid cancer:
A meta-analysis. Endocr Relat Cancer. 21:253–261. 2014. View Article : Google Scholar
|
|
22
|
Wilhelm S and Chien DS: Bay 43-9006:
Preclinical data. Curr Pharm Des. 8:2255–2257. 2002. View Article : Google Scholar : PubMed/NCBI
|
|
23
|
Wilhelm SM, Carter C, Tang L, Wilkie D,
McNabola A, Rong H, Chen C, Zhang X, Vincent P, McHugh M, et al:
Bay 43-9006 exhibits broad spectrum oral antitumor activity and
targets the RAF/MEK/ERK/pathway and receptor kinases involved in
tumor progression and angiogenesis. Cancer Res. 64:7099–7109. 2004.
View Article : Google Scholar : PubMed/NCBI
|
|
24
|
Panka DJ, Wang W, Atkins MB and Mier JW:
The Raf inhibitor Bay 43-9006 (Sorafenib) induces
caspase-independent apoptosis in melanoma cells. Cancer Res.
66:1611–1619. 2006. View Article : Google Scholar : PubMed/NCBI
|
|
25
|
Wilhelm S, Carter C, Lynch M, Lowinger T,
Dumas J, Smith RA, Schwartz B, Simantov R and Kelley S: Discovery
and development of sorafenib: A multikinase inhibitor for treating
cancer. Nat Rev Drug Discov. 5:835–844. 2006. View Article : Google Scholar : PubMed/NCBI
|
|
26
|
Jakubowicz-Gil J, Langner E and Rzeski W:
Kinetic studies of the effects of Temodal and quercetin on
astrocytoma cells. Pharmacol Rep. 63:403–416. 2011. View Article : Google Scholar : PubMed/NCBI
|
|
27
|
Jakubowicz-Gil J, Langner E, Bądziul D,
Wertel I and Rzeski W: Apoptosis induction in human glioblastoma
multiform T98G cells upon temozolomide and quercetin treatment.
Tumour Biol. 34:2367–2378. 2013. View Article : Google Scholar : PubMed/NCBI
|
|
28
|
Wang Z, Zhou J, Fan J, Qiu SJ, Yu Y, Huang
XW and Tang ZY: Effect of rapamycin alone and in combination with
sorafenib in an orthotopic model of human hepatocellular carcinoma.
Clin Cancer Res. 14:5124–5130. 2008. View Article : Google Scholar : PubMed/NCBI
|
|
29
|
Clark JW, Eder JP, Ryan D, Lathia C and
Lenz HJ: Safety and pharmacokinetics of the dual action Raf kinase
and vascular endothelial growth factor receptor inhibitor, BAY
43-9006, in patients with advanced, refractory solid tumors. Clin
Cancer Res. 11:5472–5480. 2005. View Article : Google Scholar : PubMed/NCBI
|
|
30
|
Pal HC, Baxter RD, Hunt KM, Agarwal J,
Elmets CA, Athar M and Afaq F: Fisetin, a phytochemical,
potentiates sorafenib-induced apoptosis and abrogates tumor growth
in athymic nude mice implanted with BRAF-mutated melanoma cells.
Oncotarget. 6:28296–28311. 2015. View Article : Google Scholar : PubMed/NCBI
|
|
31
|
Rausch V, Liu L, Kallifatidis G, Baumann
B, Mattern J, Gladkich J, Wirth T, Schemmer P, Büchler MW, Zöller
M, et al: Synergistic activity of sorafenib and sulforaphane
abolishes pancreatic cancer stem cell characteristics. Cancer Res.
70:5004–5013. 2010. View Article : Google Scholar : PubMed/NCBI
|
|
32
|
Jakubowicz-Gil J, Langner E, Bądziul D,
Wertel I and Rzeski W: Quercetin and sorafenib as a novel and
effective couple in programmed cell death induction in human
gliomas. Neurotox Res. 26:64–77. 2014. View Article : Google Scholar :
|
|
33
|
Hu B, Sun D, Sun C, Sun YF, Sun HX, Zhu
QF, Yang XR, Gao YB, Tang WG, Fan J, et al: A polymeric
nanoparticle formulation of curcumin in combination with sorafenib
synergistically inhibits tumor growth and metastasis in an
orthotopic model of human hepatocellular carcinoma. Biochem Biophys
Res Commun. 468:525–532. 2015. View Article : Google Scholar : PubMed/NCBI
|
|
34
|
Cao H, Wang Y, He X, Zhang Z, Yin Q, Chen
Y, Yu H, Huang Y, Chen L, Xu M, et al: Codelivery of sorafenib and
curcumin by directed self-assembled nanoparticles enhances
therapeutic effect on hepatocellular carcinoma. Mol Pharm.
12:922–931. 2015. View Article : Google Scholar : PubMed/NCBI
|
|
35
|
Kong J, Kong F, Gao J, Zhang Q, Dong S, Gu
F, Ke S, Pan B, Shen Q, Sun H, et al: YC-1 enhances the anti-tumor
activity of sorafenib through inhibition of signal transducer and
activator of transcription 3 (STAT3) in hepatocellular carcinoma.
Mol Cancer. 13:7–13. 2014. View Article : Google Scholar : PubMed/NCBI
|
|
36
|
Wild AT, Gandhi N, Chettiar ST, Aziz K,
Gajula RP, Williams RD, Kumar R, Taparra K, Zeng J, Cades JA, et
al: Concurrent versus sequential sorafenib therapy in combination
with radiation for hepatocellular carcinoma. PLoS One.
8:e657262013. View Article : Google Scholar : PubMed/NCBI
|
|
37
|
Chen G, Nicula D, Renko K and Derwahl M:
Synergistic anti-proliferative effect of metformin and sorafenib on
growth of anaplastic thyroid cancer cells and their stem cells.
Oncol Rep. 33:1994–2000. 2015. View Article : Google Scholar : PubMed/NCBI
|
|
38
|
Ling S, Feng T, Ke Q, Fan N, Li L, Li Z,
Dong C, Wang C, Xu F, Li Y and Wang L: Metformin inhibits
proliferation and enhances chemosensitivity of intrahepatic
cholangiocarcinoma cell lines. Oncol Rep. 31:2611–2618. 2014.
View Article : Google Scholar : PubMed/NCBI
|
|
39
|
Kastan MB and Bartek J: Cell-cycle
checkpoints and cancer. Nature. 432:316–323. 2004. View Article : Google Scholar : PubMed/NCBI
|
|
40
|
Brooks G and La Thangue NB: The cell cycle
and drug discovery: The promise and the hope. Drug Discov Today.
4:455–464. 1999. View Article : Google Scholar : PubMed/NCBI
|
|
41
|
Chiruvella KK and Raghavan SC: A natural
compound, methyl angolensate, induces mitochondrial pathway of
apoptosis in Daudi cells. Invest New Drugs. 29:583–592. 2011.
View Article : Google Scholar
|
|
42
|
Sung WK, Zheng H, Li S, Chen R, Liu X, Li
Y, Lee NP, Lee WH, Ariyaratne PN, Tennakoon C, et al: Genome-wide
survey of recurrent HBV integration in hepatocellular carcinoma.
Nat Genet. 44:765–769. 2012. View Article : Google Scholar : PubMed/NCBI
|
|
43
|
Taylor WR and Stark GR: Regulation of the
G2/M transition by p53. Oncogene. 20:1803–1815. 2001. View Article : Google Scholar : PubMed/NCBI
|
|
44
|
Li J, Cheung HY, Zhang Z, Chan GK and Fong
W: Andrographolide induces cell cycle arrest at G2/M phase and cell
death in HepG2 cells via alteration of reactive oxygen species. Eur
J Pharmacol. 568:31–44. 2007. View Article : Google Scholar : PubMed/NCBI
|
|
45
|
Hadfield JA, Ducki S, Hirst N and McGown
AT: Tubulin and microtubules as targets for anticancer drugs. Prog
Cell Cycle Res. 5:309–325. 2003.PubMed/NCBI
|
|
46
|
Kasibhatla S and Tseng B: Why target
apoptosis in cancer treatment. Mol Cancer Ther. 2:573–580.
2003.PubMed/NCBI
|
|
47
|
Hanahan D and Weinberg RA: Hallmarks of
cancer: The next generation. Cell. 144:646–674. 2011. View Article : Google Scholar : PubMed/NCBI
|
|
48
|
Locatelli SL, Giacomini A, Guidetti A,
Cleris L, Mortarini R, Anichini A, Gianni AM and Carlo-Stella C:
Perifosine and sorafenib combination induces mitochondrial cell
death and antitumor effects in NOD/SCID mice with Hodgkin lymphoma
cell line xenografts. Leukemia. 27:1677–1687. 2013. View Article : Google Scholar : PubMed/NCBI
|
|
49
|
Dai W, Wang F, Lu J, Xia Y, He L, Chen K,
Li J, Li S, Liu T, Zheng Y, et al: By reducing hexokinase 2,
resveratrol induces apoptosis in HCC cells addicted to aerobic
glycolysis and inhibits tumor growth in mice. Oncotarget.
6:13703–13717. 2015. View Article : Google Scholar : PubMed/NCBI
|
|
50
|
Yuen JS, Sim MY, Sim HG, Chong TW, Lau WK,
Cheng CW and Huynh H: Inhibition of angiogenic and non-angiogenic
targets by sorafenib in renal cell carcinoma (RCC) in a RCC
xenograft model. Br J Cancer. 104:941–947. 2011. View Article : Google Scholar : PubMed/NCBI
|
|
51
|
Tomizawa M, Shinozaki F, Sugiyama T,
Yamamoto S, Sueishi M and Yoshida T: Sorafenib suppresses the cell
cycle and induces the apoptosis of hepatocellular carcinoma cell
lines in serum-free media. Exp Ther Med. 1:863–866. 2010.
View Article : Google Scholar : PubMed/NCBI
|
|
52
|
Kim YB, Jeung HC, Jeong I, Lee K, Rha SY,
Chung HC and Kim GE: Mechanism of enhancement of radiation-induced
cytotoxicity by sorafenib in colorectal cancer. J Radiat Res.
54:52–60. 2012. View Article : Google Scholar : PubMed/NCBI
|
|
53
|
Chipuk JE and Green DR: How do BCL-2
proteins induce mitochondrial outer membrane permeabilization?
Trends Cell Biol. 18:157–164. 2008. View Article : Google Scholar : PubMed/NCBI
|
|
54
|
Ola MS, Nawaz M and Ahsan H: Role of Bcl-2
family proteins and caspases in the regulation of apoptosis. Mol
Cell Biochem. 351:41–58. 2011. View Article : Google Scholar : PubMed/NCBI
|
|
55
|
Zhao X, Tian C, Puszyk WM, Ogunwobi OO,
Cao M, Wang T, Cabrera R, Nelson DR and Liu C: OPA1 downregulation
is involved in sorafenib-induced apoptosis in hepatocellular
carcinoma. Lab Invest. 93:8–19. 2012. View Article : Google Scholar : PubMed/NCBI
|
|
56
|
Ramirez-Labrada A, López-Royuela N,
Jarauta V, Galán-Malo P, Azaceta G, Palomera L, Pardo J, Anel A,
Marzo I and Naval J: Two death pathways induced by sorafenib in
myeloma cells: Puma-mediated apoptosis and necroptosis. Clin Trans
Oncol. 17:121–132. 2015. View Article : Google Scholar
|
|
57
|
Cervello M, Bachvarov D, Lampiasi N,
Cusimano A, Azzolina A, McCubrey JA and Montalto G: Molecular
mechanisms of sorafenib action in liver cancer cells. Cell Cycle.
11:2843–2855. 2012. View Article : Google Scholar : PubMed/NCBI
|