Introduction
Patients with chronic kidney disease (CKD) exhibit
major proatherogenic lipid abnormalities that are associated with
their prognosis (1). The severe
disorder of lipoprotein metabolism in patients with CKD typically
manifests as higher triglyceride (TG) levels and lower levels of
high-density lipoprotein cholesterol (HDL-C) (1). Dyslipidemia also increases the
incidence of coronary atherosclerosis and cardiovascular events.
Notably, improving hyperlipidemia may reduce dialysis morbidity and
mortality in patients with end-stage renal disease.
Notably, the mechanisms of dyslipidemia in nephrotic
syndrome (NS) are associated with hepatic biology, including liver
lipid regulatory enzymes, activity of low-density lipoprotein (LDL)
receptors and compensatory synthesis in the liver (2). Liver-associated physiological
processes exhibit rhythmicity, and the circadian rhythm activities
are regulated by central and hepatic-specific clock systems
(3).
Diurnal oscillations are regulated by conserved
clock genes in the organism, which act as a hierarchical,
collaborative, large-scale 'circadian time' (4). The majority of biological processes,
including the maintenance of blood pressure, sleeping and
respiratory rhythm, exhibit circadian rhythmicity, and are also
regulated by clock genes (5).
These genes are expressed in all cell types, including the 'master
clock' located in the suprachiasmatic nucleus and the peripheral
clock in locations, such as the kidney and liver (4). A previous study indicated that
genomic transcription was highly rhythmic, with ≤81.7% of
protein-coding genes exhibiting daily rhythms in expression
(6). These oscillators dominate
the rhythmic expression of downstream clock-regulated genes,
accounting for 10–15% of the genes that regulate the circadian
characteristics of the physiological functions of peripheral organs
(7).
The cell-autonomous molecular clock in mammals is
generated by two interlocking transcription/translation feedback
loops (TTFLs) that cooperate to produce robust rhythms of gene
expression. The core TTFL is driven by two activators, circadian
locomoter output cycles kaput (CLOCK) and brain and muscle
ARNT-like protein 1 (BMAL1), and two repressors cryptochrome
(CRY) and period homologue (PER) (8), which aid the organism to drive
circadian rhythms of behavioral activity and hormones (9). Previous studies have confirmed that
the hepatic clock maintains normal glucose (GLU) levels, fatty
acids, fat mobilization and the rhythm of other biochemical
reactions in a steady state through the liver X receptor (LXR),
peroxisome proliferator-activated receptor (PPAR) γ coactivator and
PPAR signaling pathways to regulate TG, cholesterol and fat
metabolism under physiological conditions (3,10).
The clock system serves an essential role in
homeostasis. Notably, dyslipidemia is considered a homeostasis
disorder event in NS. However, the effects of the circadian
rhythmicity on blood lipids and the hepatic clock system in this
context are unclear. Therefore, the present study was performed to
observe the circadian rhythm of lipids and clock genes associated
with lipid metabolism in Adriamycin (ADR)-induced nephropathy in
rats to explore the potential effects of the clock system on lipid
metabolism abnormalities.
Materials and methods
Experimental animals and treatment
protocol
A total of 36 adult male Sprague Dawley rats
(8-weeks old; 245–265 g) were purchased from Beijing HFK Bioscience
Co., Ltd. (Beijing, China). The animal experimental procedures were
approved by the Animal Ethics Committee of Peking Union Medical
College Hospital (PUMCH; Beijing, China). Furthermore, all
experiments were performed according to international and
institutional guidelines for animal care (11), and approved by the PUMC Committee
on Animal Care and Use. All rats had access to standard food and
tap water ad libitum. Rats were housed at 23±2°C (12,13), under a strict 12-h light/dark
regimen whereby zeitgeber time ZT0-ZT12 with the lights on
represented the resting phase of the day and ZT12-ZT0 with the
lights off represented the active phase of the day. Following 2
weeks of adaptation, rats were randomly divided into two groups:
ADR group (ADR-induced nephropathy rats) and control group
(saline-treated rats). The NS model was established 14 days from
the single intravenous tail injection of 6.5 mg/kg ADR (dissolved
in saline; Pfizer, Inc., New York, NY, USA) according to the
protocol by Bertani et al (14). Rats in the control group were
injected with an equal volume of saline only. The experimental
animals were fasted in a metabolic cage to assess 24-h urine
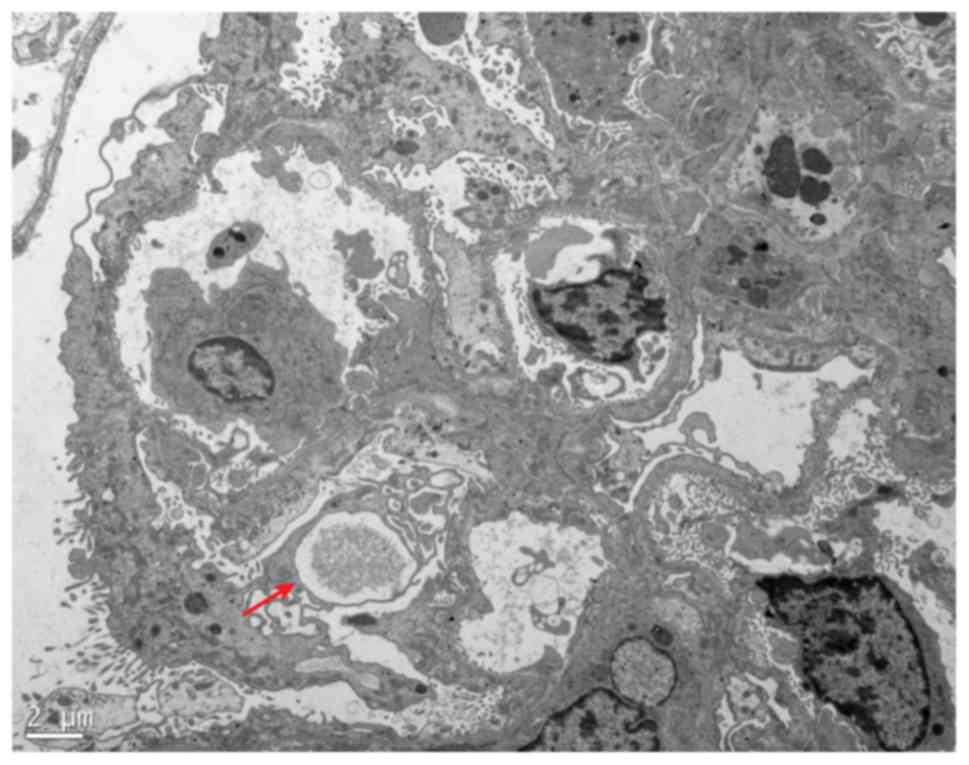
excretion. A 24-h urine excretion value of >100 mg (15) and foot process effacement of renal
tissues detected by electron microscopy (16) indicated the successful
establishment of the NS model. After 2 weeks, the rats from the two
groups were sampled every 4 h over 24 h (3 rats/group at each time
point, with a total of 18 normal rats and 18 NS rats). During the
sacrificed day, standard food and water was provided ad
libitum and treatments were quickly finished to minimize the
impact on the timer giver and animal, consistent with other
literature methodologies (12,13). The handling of rats during the
dark time period was performed under a dim red light, which does
not influence endogenous melatonin production (17).
Blood samples and liver tissue
Rats from each group were sacrificed at ZT 2:00,
6:00, 10:00, 14:00, 18:00 and 22:00 h. The liver tissues were
immediately frozen in liquid nitrogen and stored in RNAlater (cat.
no. AM7020; Ambion; Thermo Fisher Scientific, Inc., Waltham, MA,
USA) at −80°C. Blood samples were centrifuged at 6,391 × g for 10
min at 4°C. Samples were sent to the Department of Laboratory
Medicine, PUMCH (Beijing, China). The following measurements were
performed with a Hitachi Modular P800 analyzer (Hitachi, Ltd.,
Tokyo, Japan): Serum total cholesterol (TC) (CHOD-PAP method; Roche
Diagnostics GmbH, Mannheim, Germany) (18), serum TGs (GP0-PAP method; Roche
Diagnostics GmbH), and HDL-C (Roche HDL-C Plus 2nd generation kit;
Roche Diagnostics GmbH). LDL-C was calculated using the Friedewald
formula (19). Albumin was
measured using the bromopotassium phenol green method (20) and serum creatinine was measured
using a sarcosine oxidase method (21). Aspartate aminotransferase (AST)
and alanine aminotransferase (ALT) activity was assessed with an
automatic biochemical analyzer. Furthermore, GLU levels were
measured using the hexokinase method (22).
Transmission electron microscopy
analyses
Fresh rat renal tissues were removed in sections of
~2.0 mm3 and fixed with 2.5% glutaraldehyde in 0.1 M
Sorenson's phosphate buffer (pH=7.41) for 2 h at 4°C. Following
this, the samples were washed three times with 0.1 M Sorenson's
phosphate buffer. The tissues were subsequently post-fixed for
1–1.5 h in 1% OsO4 in 0.l M Sorenson's phosphate buffer,
washed with distilled water, then stained en bloc with 3%
uranyl acetate for 30 min at 25°C. Dehydration was performed using
a 50–95% graded ethanol series, followed by two changes in
propylene oxide. Sections of 70–80 nm were cut, and collected on a
200 copper/rhodium grid stained with uranyl acetate and lead
citrate. Following this, samples were observed under a transmission
electron microscope (magnification, ×5,000).
Reverse transcription-quantitative
polymerase chain reaction (RT-qPCR) analysis
Total RNA was extracted from frozen heart tissues
using RNAiso Plus reagents (cat. no. 9109; Takara Bio, Inc., Otsu,
Japan) according to the manufacturer's protocol. RNA was reverse
transcribed using the PrimeScript® RT Master Perfect
Real-time kit (cat. no. DRR036A; Takara Bio, Inc.). The resulting
cDNA was amplified using a SYBR-Green PCR kit (cat. no. DRR082A;
Takara Bio, Inc.) and detected with a 7500 Fast Real-time PCR
system (Applied Biosystems; Thermo Fisher Scientific, Inc.). All
experiments were performed at least three times according to the
manufacturer's protocol. The conditions for the two-step
amplification PCR reaction were pre-denaturation (95°C, 30 sec, 1
cycle) and PCR amplification (95°C, 5 sec and 60°C, 30 sec, 40
cycles). Gene expression was calculated relative to the
housekeeping gene GAPDH using the 2−ΔΔCq method
(23). The primers used for PCR
are presented in Table I.
 | Table IPrimers for reverse
transcription-quantitative polymerase chain reaction. |
Table I
Primers for reverse
transcription-quantitative polymerase chain reaction.
| Gene | Forward
(5′–3′) | Reverse
(5′–3′) |
|---|
| GAPDH |
GACAACTTTGGCATCGTGGA |
ATGCAGGGATGATGTTCTGG |
| CLOCK |
CATCGGCAGCAAGAAGAACT |
CAAGATTCAGTCCAGGGTTTG |
| BMAL1 |
CAACCCATACACAGAAGCAAAC |
ACAGATTCGGAGACAAAGAGGA |
| PER1 |
GAGGAGCCAGAGAGGAAAGAGT |
TTGGTTGTGTTAGGAATGTTGC |
| PER2 |
CTGGAAAGAACAGGAAACTGAA |
GGGAACACAGGTAGTGGGTAAG |
| CRY1 |
ATCTAGCCCGACATGCAGTT |
TCGGCGTCAAGCAGTAATTC |
| CRY2 |
ATTGAGCGGATGAAGCAGAT |
TCTACACAGGAAGGGACAGATG |
| LXR |
CCTGATGTTTCTCCTGACTC |
TGACTCCAACCCTATCCTTA |
| DEC1 |
CCACCAAAAAGAGCCGAAT |
ATAGAAGGGCAGGCAAAAGG |
| DEC2 |
GAAGCGAGACGACACCAAG |
TTTCAGATGTTCAGGCAGTAAGTC |
| SREBP-1 |
GGAGCCATGGATTGCACATT |
GGCCCGGGAAGTCACTGT |
| ABCA1 |
CTTGCTTCCGTTATCCAACTCCAG |
GCTGTAATGTTCTCAGGACCTTGTG |
| CYP7A1 |
CCAAGTCAAGTGTCCCCCTCTA |
GACTCTCAGCCGCCAAGTG |
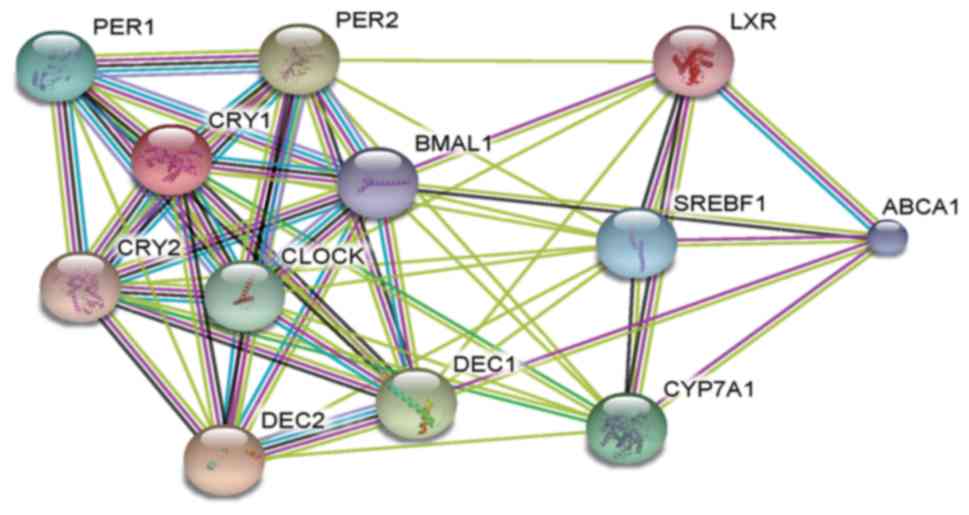
Protein-protein interaction (PPI) network
and functional enrichment of protein-coding genes
Due to the difficulties of obtaining human tissues
to explore the rhythmic characteristics of clock gene expression
levels every 4 h, correlation analyses of the expression levels of
human proteins were performed using the STRING database (http://www.string-db.org/) (24) as a complementary platform to
assessed the association between core clock and clock-controlled
genes in patients with renal disease. Furthermore, the DAVID
Bioinformatics Tool (25) was
used to identify functional enrichment of target protein-coding
genes. Notably, this tool may be used to identify Gene Ontology
(GO) biological processes associated with protein-coding genes.
Furthermore, KEGG pathway enrichment analysis was performed using
KOBAS 3.0 (http://kobas.cbi.pku.edu.cn/). Cytoscape (www.cytoscape.org/) (26) was also used to visualize the above
biological process organization and GOplot (http://wencke.github.io/) (27) was used to illustrate the
functional analysis data.
Statistical analysis
The results are presented as the mean ± standard
deviation, and the data were analyzed using unpaired t-tests with
SPSS 20.0 software (IBM Corp., Armonk, NY, USA) for comparisons
between groups. P<0.05 was considered to indicate a
statistically significant difference. Gene expression data and
blood parameters were analyzed to assess the circadian rhythmicity
of data using a Fourier transform method and Chronos-Fit software
(http://chronos-fit.software.informer.com/). Following
the Chronos-Fit software formula: F(t)=mesor+Σ
(amplitudei × cos (t-acrophasei) × 2π/pi).
The parameters included the mean, midline estimating statistic of
rhythm (mesor), amplitude of the sine wave (amplitude) and the
acrophase or time of maximum of the sine wave (acrophase). The
chart indicated the curve fitted to the circadian analysis of all
clock genes. Significance (P<0.05) was evaluated using the
F-test as described previously (28,29).
Results
Rats with nephropathy exhibit
hyperglycemia and disordered rhythms in serum TC, TG, AST and ALT
levels
The ADR-induced nephropathy model is a classical
nephropathy animal model (16,30). In the present study, 2 weeks
following ADR injection, the ADR group presented with minimal
change in disease according to the electron microscopy results
(Fig. 1). The levels of blood TC,
TG, HDL-C, LDL cholesterol (LDL-C) and GLU over 24 h were
significantly increased in the ADR group compared with the control
group (all P<0.05, Table II).
AST and ALT activity was also significantly increased in the ADR
group compared with the control group (P<0.05, Table II). In the control group, the
serum levels of TC, TG, AST and ALT were significantly cycled every
12, 24, 24 or 24 h, respectively (all P<0.05), and the double
amplitudes (2A) of the TC and TG levels were similar (2A=0.78).
However, in the ADR group, the rhythm of the TG levels changed from
the baseline of 24 to 12 h, and no oscillations were observed with
regards to TC, AST and ALT levels (all P>0.05; Fig. 2). The HDL-C, LDL-C and GLU levels
in the two groups did not indicate a circadian rhythm (F-test,
P>0.05; data not shown).
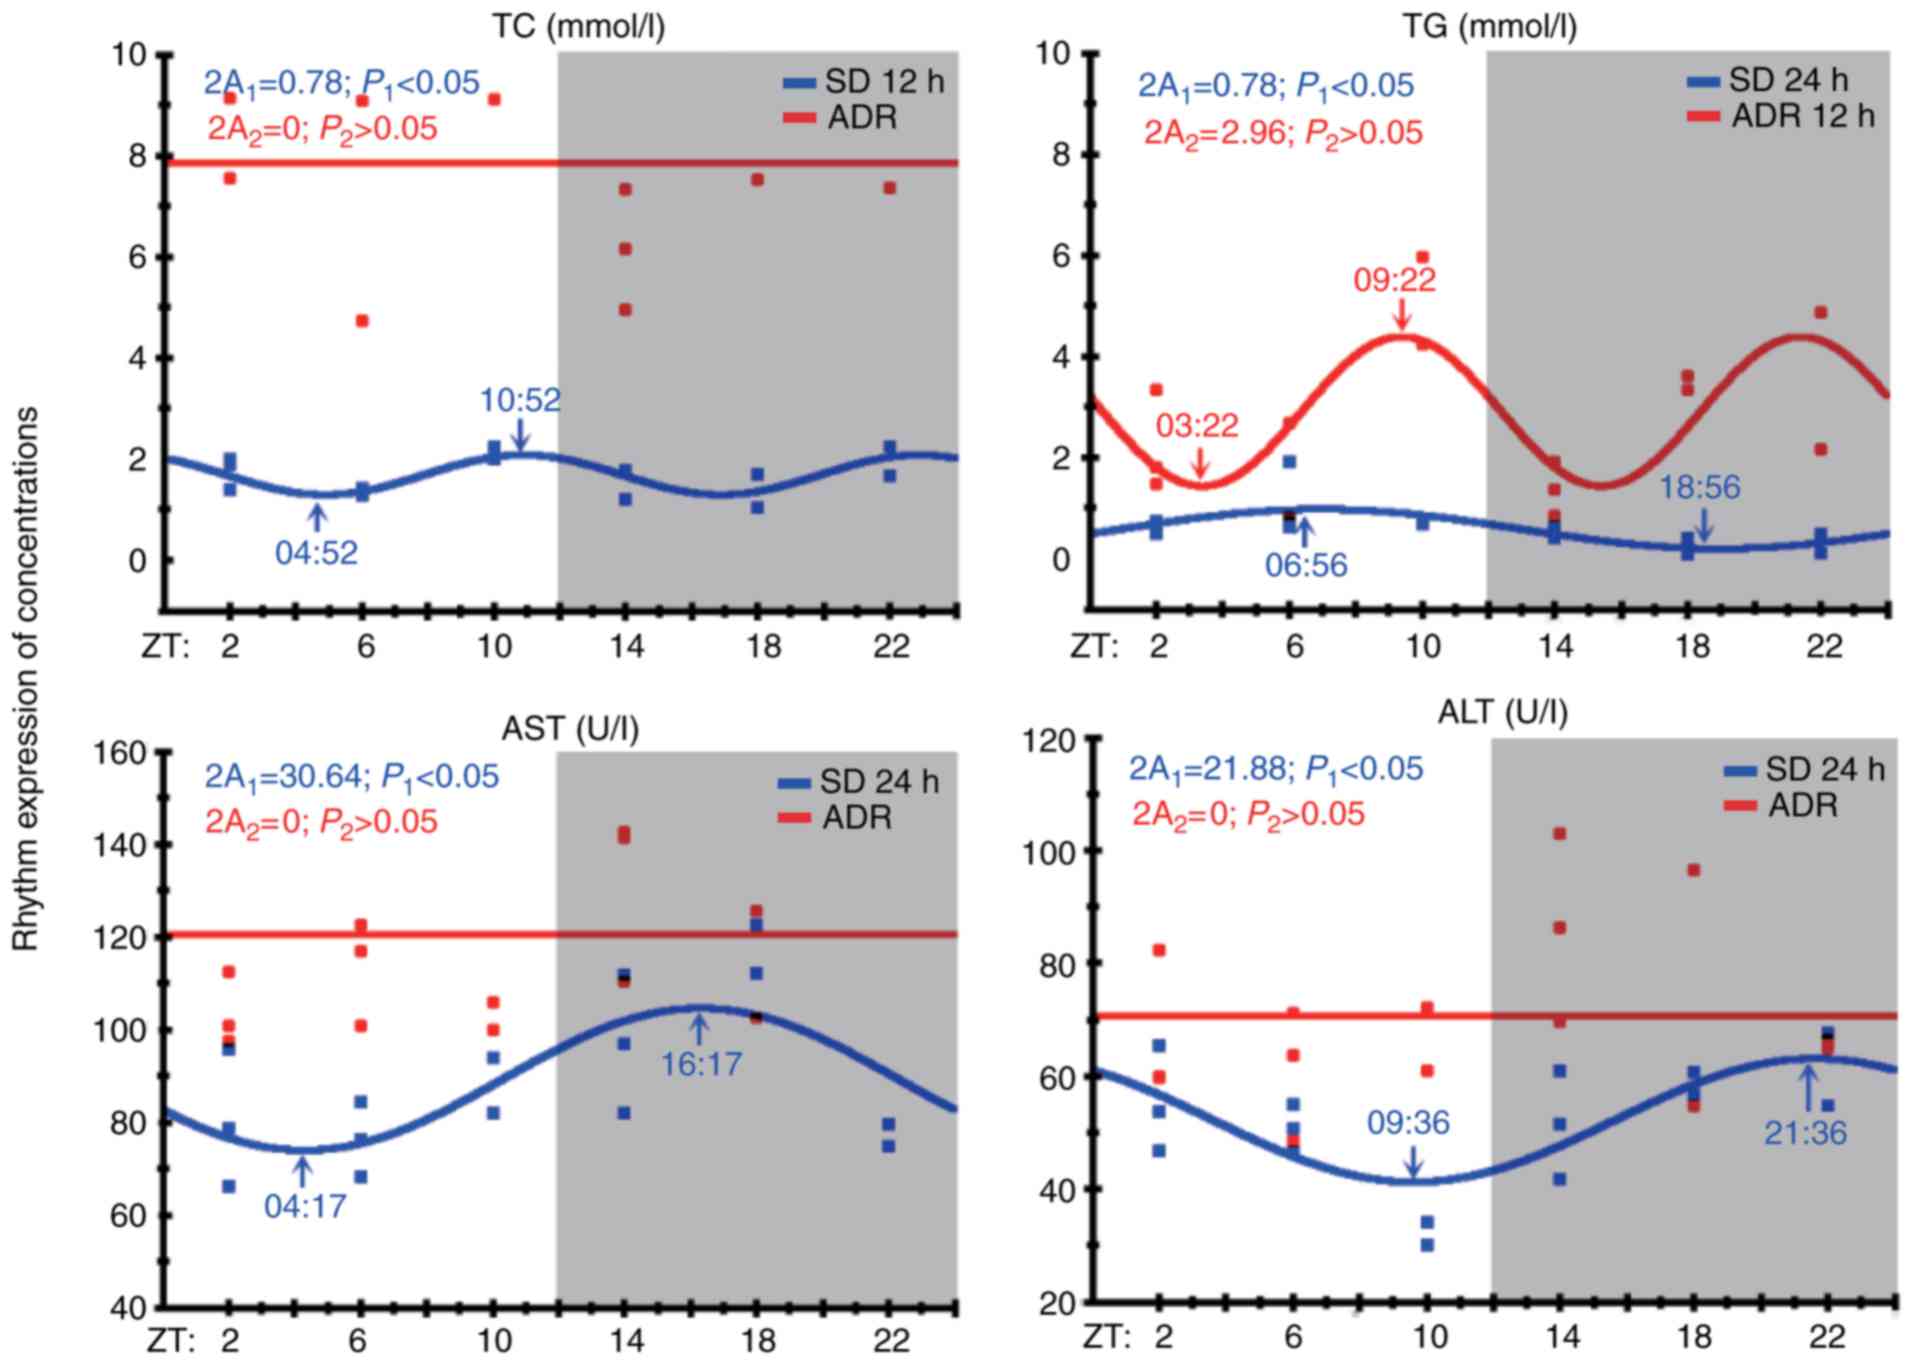 | Figure 2TC, TG, AST and ALT levels are
associated with a circadian pattern. Arrows in each figure indicate
the ZT was associated with the peak value and off-peak value of the
fitted curve (acrophase). The chart shows the fitted curve
generated by circadian analysis of all clock genes; this curve was
checked for significance using the F-test (P<0.05). 2A1 is the
double amplitude of the control group, and 2A2 is the double
amplitude of the ADR group. Gray area, dark period
(ZT=12:00-24:00); white area, light period (ZT=00:00–12:00). The
blue and red dots indicate the measured TC, TG, AST and ALT levels
in the control and ADR groups during the light and dark periods,
respectively. Partial Fourier analysis, n=36, three rats/group
every 4 h in 24 h. ADR, Adriamycin-induced nephropathy; TC, total
cholesterol; TG, triglyceride; AST, aspartate aminotransferase;
ALT, alanine aminotransferase; ZT, Zeitgeber time. |
| Table IILaboratory parameters in the two
groups. |
Table II
Laboratory parameters in the two
groups.
| Measure | SD rats (n=18) | ADR rats
(n=18) | P-value |
|---|
| ALB (g/l) | 29.78±2.13 | 22.14±2.75a | <0.05 |
| SCr
(µmol/l) | 34.05±13.94 | 39.06±7.59 | 0.231 |
| BUN (mmol/l) | 7.01±1.34 | 7.00±1.50 | 0.968 |
| TC (mmol/l) | 1.80±0.29 | 4.45±1.47a | <0.05 |
| TG (mmol/l) | 0.71±0.56 | 3.97±2.87a | <0.05 |
| HDL-C (mmol/l) | 0.59±0.09 | 1.27±0.38a | <0.05 |
| LDL-C (mmol/l) | 0.25±0.05 | 0.68±0.23a | <0.05 |
| GLU (mg/dl) | 176.64±21.55 |
336.89±102.65a | <0.05 |
| AST (U/l) | 88.30±16.73 |
120.51±22.85a | <0.05 |
| ALT (U/l) | 51.73±10.66 | 70.59±15.30a | <0.05 |
| 24 h UP
(mg/day) | 21.70±7.53 |
178.30±68.53a | <0.05 |
Hepatic core clock and clock-controlled
genes that regulate TG, cholesterol and fat metabolism are
associated with disordered rhythms in NS rats
The circadian rhythm of six hepatic core clock genes
and six clock-controlled genes associated with metabolism were
evaluated. The data revealed the CRY1 and PER2 genes
exhibited 24-h rhythmicity, and their peak times advanced by 0.5
and 2.5 h compared with those in the control group; however, the
rhythm of PER1 mRNA expression was wholly absent in the ADR
group (P<0.05). Other core clock genes, including CLOCK and
CRY2, exhibited a change in periodicity from 24 to 12 h, and
their peak times significantly shifted to the rest period (daytime;
P<0.05). Furthermore, the rhythm of BMAL1 mRNA expression
changed from 24 h to a period of 4.8+6 h (P<0.05; Fig. 3A).
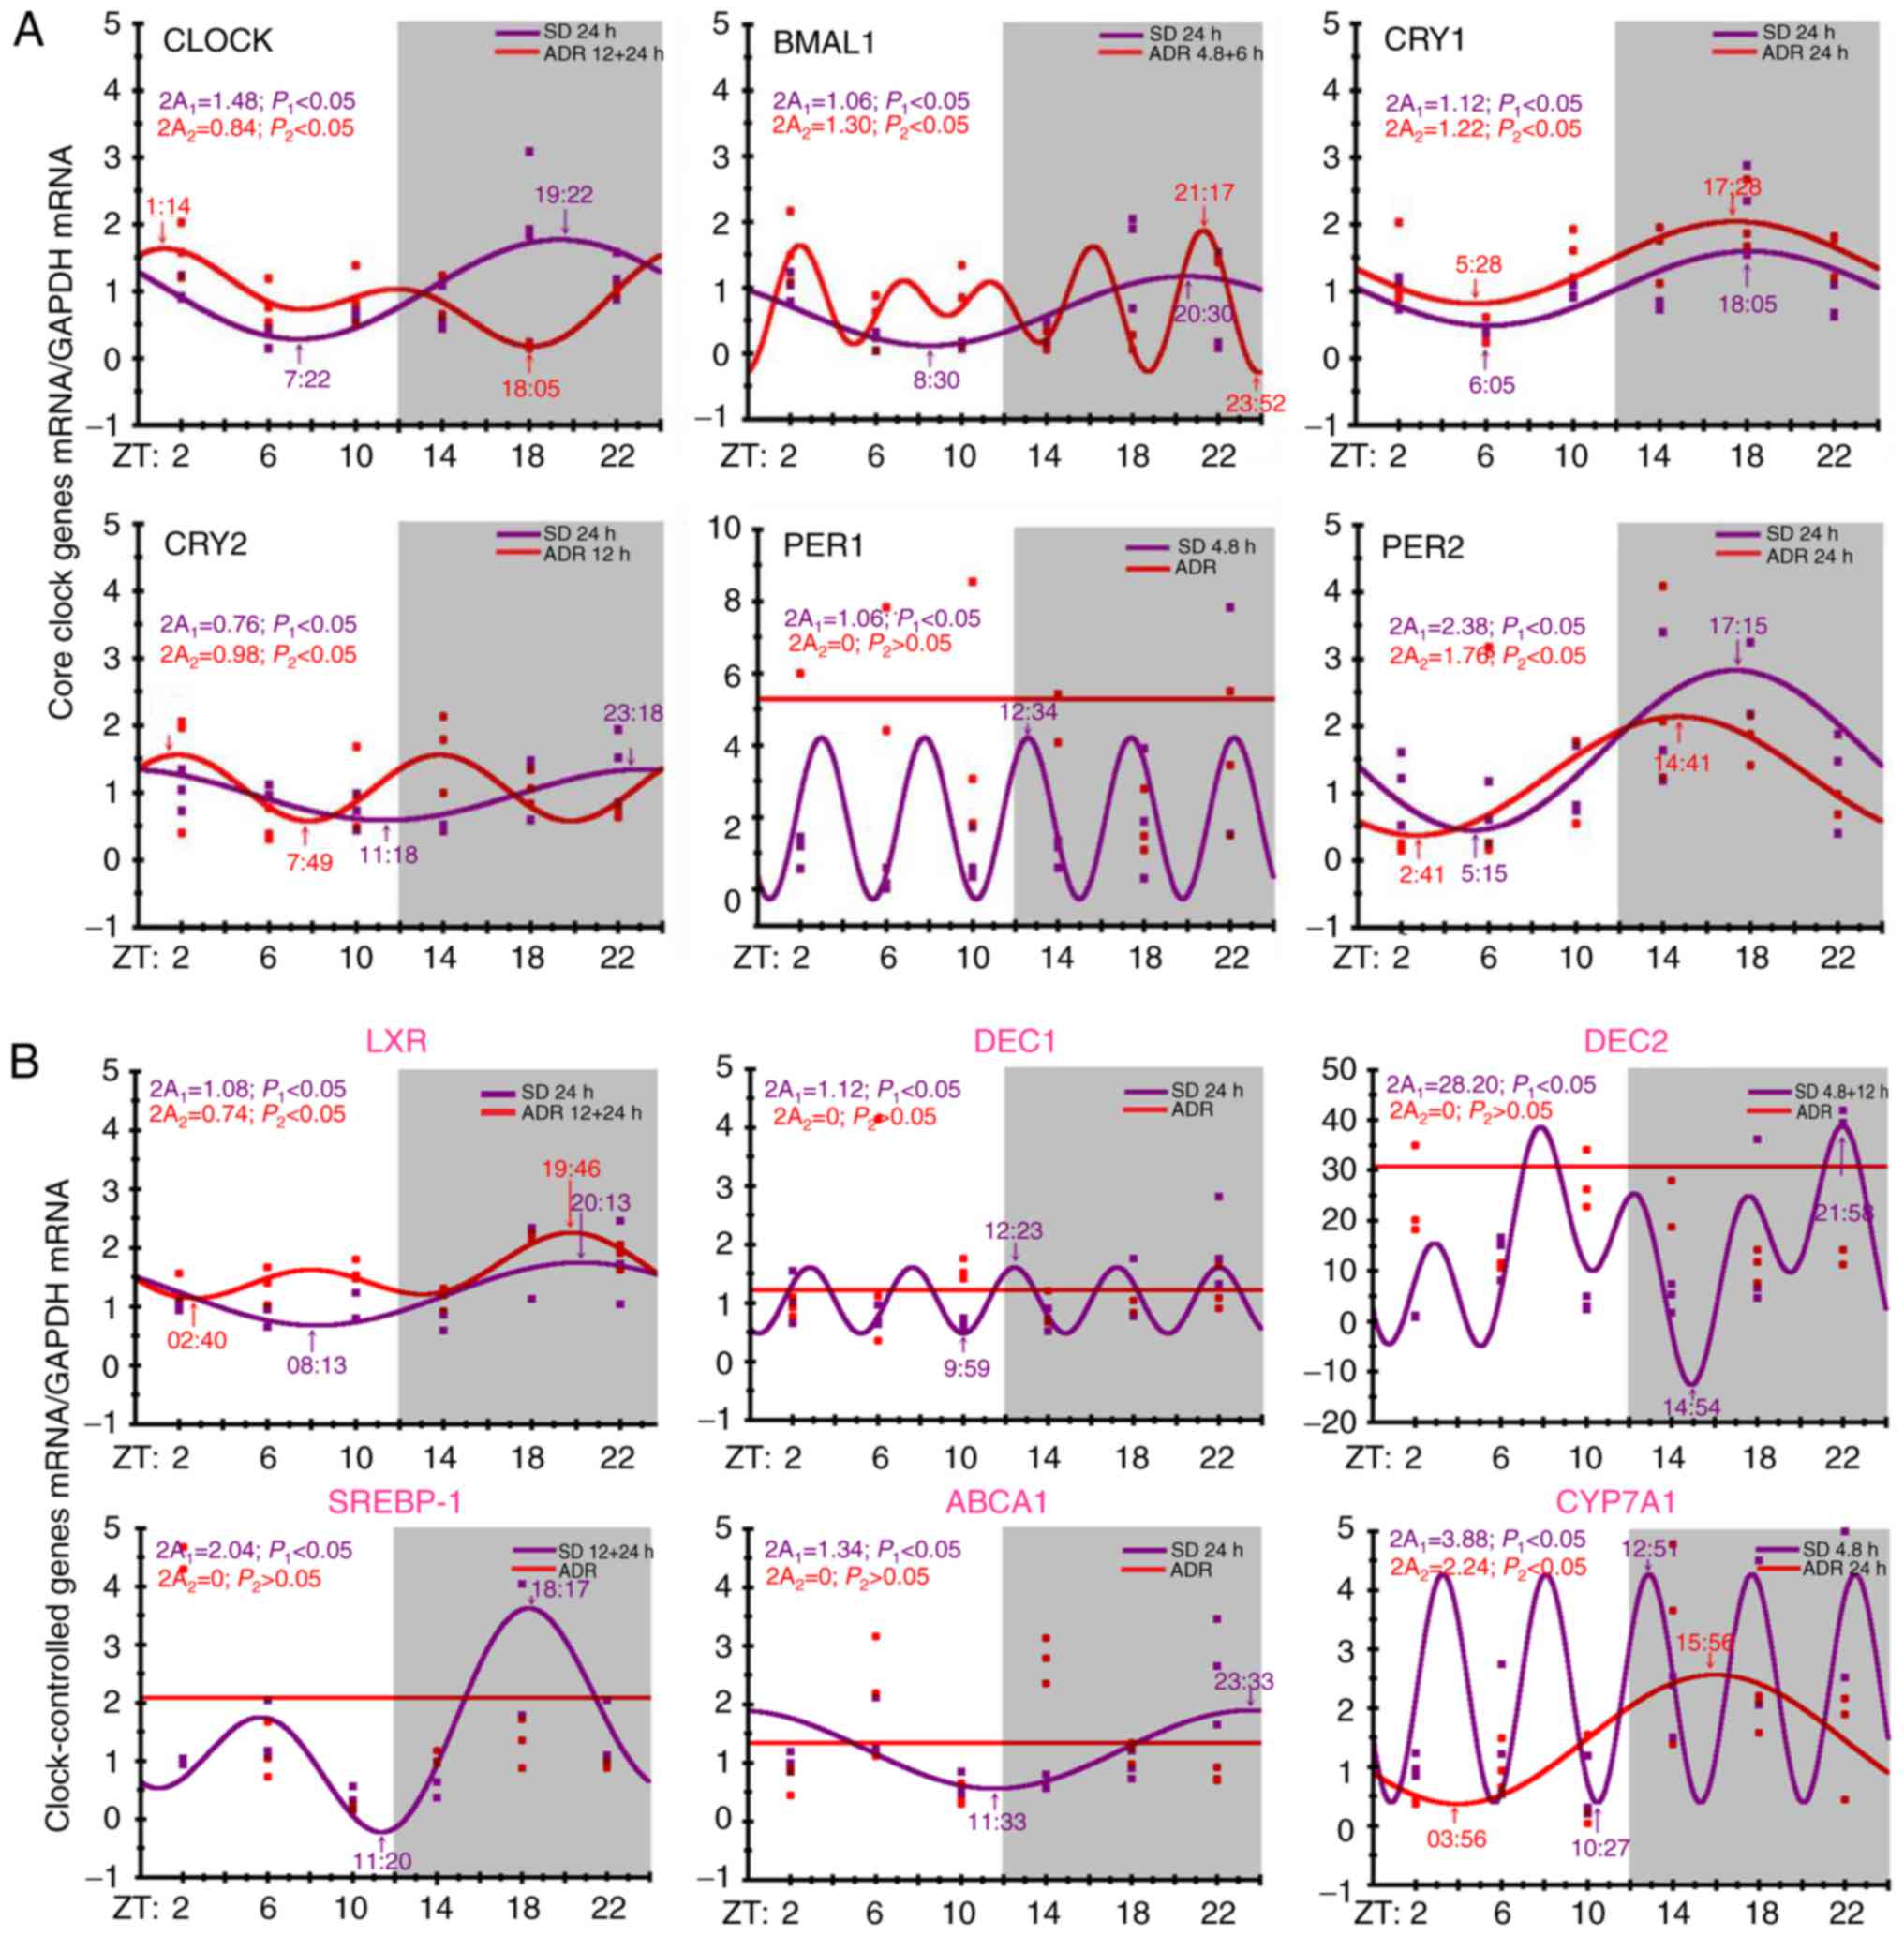 | Figure 3Circadian pattern expressions. (A)
Circadian pattern expression of hepatic core clock genes:
CLOCK and BMAL; and two repressors CRY and
PER. (B) Circadian pattern expression of clock-controlled
genes: LXR, CYP7A1, SREBP-1 and ABCA1; and the basic
helix-loop-helix transcription factors, DEC1 and
DEC2. The purple and red dots indicate the measured gene
expression values in the control and ADR groups, respectively. ADR,
Adriamycin-induced nephropathy; CLOCK, circadian locomoter
output cycles kaput; BMAL1, brain and muscle ARNT-like
protein 1; CRY, cryptochrome; PER, period homologue;
LXR, liver X receptor; CYP7A1, cholesterol
7α-hydroxylase; SREBP-1, sterol regulatory element binding
protein-1c; ABCA1, ATP binding cassette transporter A1;
DEC, differentiated embryo chondrocyte. |
The liver-specific clock-controlled genes, including
LXR, cholesterol 7α-hydroxylase (CYP7A1), sterol
regulatory element binding protein-1c (SREBP-1), ATP binding
cassette transporter A1 (ABCA1) and the basic
helix-loop-helix transcription factors, differentiated embryo
chondrocyte1 (DEC1) and DEC2. The rhythms of the mRNA
expression levels of DEC1, DEC2, SREBP-1 and ABCA1 were
completely absent in the livers in the ADR group (P<0.05).
Although LXR and CYP7A1 maintained circadian rhythm
characteristics, the time periods in the ADR group compared with
the control rats changed for LXR (from 24 h to 12+24 h) and
CYP7A1 (from 4.8 to 24 h; all P<0.05; Fig. 3B).
Functional annotation and PPI network
construction
Highly associated genes in a given genetic module
serve important roles in biological processes (31). Therefore, the six aforementioned
hepatic core clock genes and six clock-controlled genes that were
highly associated with the hepatic circadian rhythms of blood lipid
metabolism were selected, and PPI networks were constructed using
STRING (32). These genes in the
PPI network were identified to have stronger interactions among
themselves (average local clustering coefficient, 0.849; Fig. 4 and Table IIITable IV). Notably, the PPI network
of STRING v10 makes use of all microarray gene expression
experiments deposited in the NCBI Gene Expression Omnibus to
provide co-expression analysis, which is a reliable indicator of
functional associations (33).
| Table IIIData of String interactions. |
Table III
Data of String interactions.
| #node1 | node2 |
node1_string_internal_id |
node2_string_internal_id |
node1_external_id |
node2_external_id |
neighborhood_on_chromosome | gene_fusion |
phylogenetic_cooccurrence | Homology | Coexpression |
experimentally_determined_Coexpression
interaction |
database_automated_annotated |
combined_textmining | score |
|---|
| CRY2 | ARNTL | 1860621 | 1857849 |
9606.ENSP00000406751 |
9606.ENSP00000374357 | 0 | 0 | 0 | 0 | 0.093 | 0.98 | 0.9 | 0.959 | 0.999 |
| ARNTL | CRY1 | 1857849 | 1842155 |
9606.ENSP00000374357 |
9606.ENSP00000008527 | 0 | 0 | 0 | 0 | 0.093 | 0.986 | 0.9 | 0.955 | 0.999 |
| CRY2 | PER2 | 1860621 | 1844310 |
9606.ENSP00000406751 |
9606.ENSP00000254657 | 0 | 0 | 0 | 0 | 0.154 | 0.995 | 0.9 | 0.829 | 0.999 |
| CRY2 | PER1 | 1860621 | 1849704 |
9606.ENSP00000406751 |
9606.ENSP00000314420 | 0 | 0 | 0 | 0 | 0.054 | 0.98 | 0.9 | 0.824 | 0.999 |
| PER1 | CRY1 | 1849704 | 1842155 |
9606.ENSP00000314420 |
9606.ENSP00000008527 | 0 | 0 | 0 | 0 | 0.053 | 0.985 | 0.9 | 0.781 | 0.999 |
| PER2 | CRY1 | 1844310 | 1842155 |
9606.ENSP00000254657 |
9606.ENSP00000008527 | 0 | 0 | 0 | 0 | 0.161 | 0.995 | 0.9 | 0.926 | 0.999 |
| ARNTL | PER1 | 1857849 | 1849704 |
9606.ENSP00000374357 |
9606.ENSP00000314420 | 0 | 0 | 0 | 0.626 | 0 | 0.967 | 0.9 | 0.789 | 0.997 |
| ARNTL | PER2 | 1857849 | 1844310 |
9606.ENSP00000374357 |
9606.ENSP00000254657 | 0 | 0 | 0 | 0.63 | 0 | 0.967 | 0.9 | 0.968 | 0.997 |
| PER1 | PER2 | 1849704 | 1844310 |
9606.ENSP00000314420 |
9606.ENSP00000254657 | 0 | 0 | 0 | 0.844 | 0.073 | 0.97 | 0.9 | 0.661 | 0.997 |
| CRY2 | CLOCK | 1860621 | 1849105 |
9606.ENSP00000406751 |
9606.ENSP00000308741 | 0 | 0 | 0 | 0 | 0.053 | 0.824 | 0.9 | 0.835 | 0.996 |
| CRY2 | CRY1 | 1860621 | 1842155 |
9606.ENSP00000406751 |
9606.ENSP00000008527 | 0 | 0 | 0.527 | 0.981 | 0.072 | 0.967 | 0.9 | 0.953 | 0.996 |
| CLOCK | CRY1 | 1849105 | 1842155 |
9606.ENSP00000308741 |
9606.ENSP00000008527 | 0 | 0 | 0 | 0 | 0.053 | 0.697 | 0.9 | 0.885 | 0.996 |
| PER2 | BHLHE41 | 1844310 | 1843637 |
9606.ENSP00000254657 |
9606.ENSP00000242728 | 0 | 0 | 0 | 0 | 0.053 | 0.981 | 0 | 0.759 | 0.995 |
| BHLHE41 | CRY1 | 1843637 | 1842155 |
9606.ENSP00000242728 |
9606.ENSP00000008527 | 0 | 0 | 0 | 0 | 0.052 | 0.973 | 0 | 0.782 | 0.993 |
| ARNTL | CLOCK | 1857849 | 1849105 |
9606.ENSP00000374357 |
9606.ENSP00000308741 | 0 | 0 | 0 | 0.687 | 0.094 | 0.873 | 0.9 | 0.985 | 0.991 |
| CLOCK | PER2 | 1849105 | 1844310 |
9606.ENSP00000308741 |
9606.ENSP00000254657 | 0 | 0 | 0 | 0.61 | 0.054 | 0.862 | 0.9 | 0.833 | 0.99 |
| CRY2 | BHLHE41 | 1860621 | 1843637 |
9606.ENSP00000406751 |
9606.ENSP00000242728 | 0 | 0 | 0 | 0 | 0.052 | 0.968 | 0 | 0.595 | 0.987 |
| ARNTL | BHLHE40 | 1857849 | 1844442 |
9606.ENSP00000374357 |
9606.ENSP00000256495 | 0 | 0 | 0 | 0 | 0 | 0.436 | 0.9 | 0.734 | 0.983 |
| ARNTL | BHLHE41 | 1857849 | 1843637 |
9606.ENSP00000374357 |
9606.ENSP00000242728 | 0 | 0 | 0 | 0 | 0 | 0.156 | 0.9 | 0.764 | 0.978 |
| NR1H3 | ABCA1 | 1859317 | 1856172 |
9606.ENSP00000387946 |
9606.ENSP00000363868 | 0 | 0 | 0 | 0 | 0 | 0.101 | 0.9 | 0.777 | 0.978 |
| CLOCK | BHLHE41 | 1849105 | 1843637 |
9606.ENSP00000308741 |
9606.ENSP00000242728 | 0 | 0 | 0 | 0 | 0 | 0.42 | 0.9 | 0.621 | 0.976 |
| PER1 | CLOCK | 1849704 | 1849105 |
9606.ENSP00000314420 |
9606.ENSP00000308741 | 0 | 0 | 0 | 0.611 | 0.051 | 0.674 | 0.9 | 0.591 | 0.973 |
| CLOCK | BHLHE40 | 1849105 | 1844442 |
9606.ENSP00000308741 |
9606.ENSP00000256495 | 0 | 0 | 0 | 0 | 0 | 0.178 | 0.9 | 0.527 | 0.957 |
| BHLHE40 | BHLHE41 | 1844442 | 1843637 |
9606.ENSP00000256495 |
9606.ENSP00000242728 | 0 | 0 | 0 | 0.858 | 0.181 | 0.36 | 0.8 | 0.759 | 0.898 |
| NR1H3 | SREBF1 | 1859317 | 1853255 |
9606.ENSP00000387946 |
9606.ENSP00000348069 | 0 | 0 | 0 | 0 | 0.049 | 0.36 | 0 | 0.837 | 0.892 |
| ABCA1 | SREBF1 | 1856172 | 1853255 |
9606.ENSP00000363868 |
9606.ENSP00000348069 | 0 | 0 | 0 | 0 | 0 | 0.088 | 0 | 0.838 | 0.846 |
| BHLHE40 | CRY1 | 1844442 | 1842155 |
9606.ENSP00000256495 |
9606.ENSP00000008527 | 0 | 0 | 0 | 0 | 0.052 | 0.173 | 0 | 0.758 | 0.793 |
| BHLHE40 | PER2 | 1844442 | 1844310 |
9606.ENSP00000256495 |
9606.ENSP00000254657 | 0 | 0 | 0 | 0 | 0.053 | 0.163 | 0 | 0.733 | 0.769 |
| NR1H3 | CYP7A1 | 1859317 | 1848316 |
9606.ENSP00000387946 |
9606.ENSP00000301645 | 0 | 0 | 0 | 0 | 0.049 | 0.079 | 0 | 0.742 | 0.755 |
| ABCA1 | CYP7A1 | 1856172 | 1848316 |
9606.ENSP00000363868 |
9606.ENSP00000301645 | 0 | 0 | 0 | 0 | 0 | 0.046 | 0 | 0.694 | 0.695 |
| SREBF1 | CYP7A1 | 1853255 | 1848316 |
9606.ENSP00000348069 |
9606.ENSP00000301645 | 0 | 0 | 0 | 0 | 0.052 | 0 | 0 | 0.673 | 0.677 |
| NR1H3 | ARNTL | 1859317 | 1857849 |
9606.ENSP00000387946 |
9606.ENSP00000374357 | 0 | 0 | 0 | 0 | 0 | 0.545 | 0 | 0.193 | 0.617 |
| CRY2 | BHLHE40 | 1860621 | 1844442 |
9606.ENSP00000406751 |
9606.ENSP00000256495 | 0 | 0 | 0 | 0 | 0.052 | 0.173 | 0 | 0.52 | 0.59 |
| SREBF1 | BHLHE40 | 1853255 | 1844442 |
9606.ENSP00000348069 |
9606.ENSP00000256495 | 0 | 0 | 0 | 0 | 0 | 0 | 0 | 0.483 | 0.483 |
| PER1 | BHLHE41 | 1849704 | 1843637 |
9606.ENSP00000314420 |
9606.ENSP00000242728 | 0 | 0 | 0 | 0 | 0 | 0 | 0 | 0.422 | 0.422 |
| PER1 | BHLHE40 | 1849704 | 1844442 |
9606.ENSP00000314420 |
9606.ENSP00000256495 | 0 | 0 | 0 | 0 | 0.053 | 0 | 0 | 0.364 | 0.372 |
| ARNTL | SREBF1 | 1857849 | 1853255 |
9606.ENSP00000374357 |
9606.ENSP00000348069 | 0 | 0 | 0 | 0 | 0 | 0 | 0 | 0.34 | 0.34 |
| SREBF1 | CLOCK | 1853255 | 1849105 |
9606.ENSP00000348069 |
9606.ENSP00000308741 | 0 | 0 | 0 | 0 | 0 | 0 | 0 | 0.304 | 0.304 |
| ARNTL | CYP7A1 | 1857849 | 1848316 |
9606.ENSP00000374357 |
9606.ENSP00000301645 | 0 | 0 | 0 | 0 | 0 | 0 | 0 | 0.303 | 0.303 |
| CLOCK | CYP7A1 | 1849105 | 1848316 |
9606.ENSP00000308741 |
9606.ENSP00000301645 | 0 | 0 | 0 | 0 | 0 | 0 | 0 | 0.25 | 0.25 |
| CYP7A1 | CRY1 | 1848316 | 1842155 |
9606.ENSP00000301645 |
9606.ENSP00000008527 | 0.074 | 0 | 0 | 0 | 0 | 0 | 0 | 0.213 | 0.24 |
| SREBF1 | CRY1 | 1853255 | 1842155 |
9606.ENSP00000348069 |
9606.ENSP00000008527 | 0 | 0 | 0 | 0 | 0 | 0 | 0 | 0.233 | 0.232 |
| CRY2 | CYP7A1 | 1860621 | 1848316 |
9606.ENSP00000406751 |
9606.ENSP00000301645 | 0.074 | 0 | 0 | 0 | 0 | 0 | 0 | 0.202 | 0.229 |
| NR1H3 | CLOCK | 1859317 | 1849105 |
9606.ENSP00000387946 |
9606.ENSP00000308741 | 0 | 0 | 0 | 0 | 0 | 0 | 0 | 0.214 | 0.214 |
| SREBF1 | PER2 | 1853255 | 1844310 |
9606.ENSP00000348069 |
9606.ENSP00000254657 | 0 | 0 | 0 | 0 | 0 | 0 | 0 | 0.211 | 0.211 |
| CRY2 | SREBF1 | 1860621 | 1853255 |
9606.ENSP00000406751 |
9606.ENSP00000348069 | 0 | 0 | 0 | 0 | 0 | 0 | 0 | 0.204 | 0.204 |
| SREBF1 | BHLHE41 | 1853255 | 1843637 |
9606.ENSP00000348069 |
9606.ENSP00000242728 | 0 | 0 | 0 | 0 | 0 | 0 | 0 | 0.203 | 0.203 |
| NR1H3 | BHLHE40 | 1859317 | 1844442 |
9606.ENSP00000387946 |
9606.ENSP00000256495 | 0 | 0 | 0 | 0 | 0 | 0 | 0 | 0.194 | 0.194 |
| NR1H3 | PER2 | 1859317 | 1844310 |
9606.ENSP00000387946 |
9606.ENSP00000254657 | 0 | 0 | 0 | 0 | 0 | 0 | 0 | 0.194 | 0.194 |
| ABCA1 | BHLHE40 | 1856172 | 1844442 |
9606.ENSP00000363868 |
9606.ENSP00000256495 | 0 | 0 | 0 | 0 | 0 | 0.042 | 0 | 0.191 | 0.191 |
| CYP7A1 | BHLHE41 | 1848316 | 1843637 |
9606.ENSP00000301645 |
9606.ENSP00000242728 | 0 | 0 | 0 | 0 | 0 | 0 | 0 | 0.166 | 0.165 |
| ARNTL | ABCA1 | 1857849 | 1856172 |
9606.ENSP00000374357 |
9606.ENSP00000363868 | 0 | 0 | 0 | 0 | 0.09 | 0 | 0 | 0.111 | 0.157 |
| CYP7A1 | PER2 | 1848316 | 1844310 |
9606.ENSP00000301645 |
9606.ENSP00000254657 | 0 | 0 | 0 | 0 | 0 | 0 | 0 | 0.152 | 0.151 |
| Table IVData of GO biological processes. |
Table IV
Data of GO biological processes.
| Category | Term | Count | % | P-value | Genes | List total | Pop hits | Pop total | Fold
enrichment | Bonferroni | Benjamini | FDR |
|---|
|
GOTERM_BP_DIRECT |
GO:0032922~circadian regulation of gene
expression | 8 | 72.73 |
4.21×10⁻¹⁶ | CRY2, PER2, PER1,
BHLHE40, ARNTL, BHLHE41, CRY1, CLOCK | 11 | 57 | 16792 | 214.25 |
6.48×10⁻¹⁴ |
6.48×10⁻¹⁴ |
5.33×10⁻¹³ |
|
GOTERM_BP_DIRECT | GO:2000323~negative
regulation of glucocorticoid receptor signaling pathway | 5 | 45.45 |
9.51×10⁻¹³ | CRY2, PER1, ARNTL,
CRY1, CLOCK | 11 | 6 | 16792 | 1,272.12 |
1.39×10⁻¹⁰ |
6.94×10⁻¹¹ |
1.13×10−09 |
|
GOTERM_BP_DIRECT | GO:0045892~negative
regulation of transcription, DNA-templated | 8 | 72.73 |
2.18×10−09 | CRY2, PER2, PER1,
BHLHE40, ARNTL, BHLHE41, CRY1, CLOCK | 11 | 499 | 16792 | 24.47 |
3.18×10−07 |
1.06×10−07 |
2.59×10−06 |
|
GOTERM_MF_DIRECT | GO:0070888~E-box
binding | 5 | 45.45 |
2.85×10−09 | PER1, BHLHE40,
ARNTL, BHLHE41, CLOCK | 11 | 34 | 16881 | 225.68 |
2.08×10−07 |
2.08×10−07 |
2.98×10−06 |
|
GOTERM_BP_DIRECT |
GO:0042752~regulation of circadian
rhythm | 5 | 45.45 |
1.33×10−08 | CRY2, PER2, PER1,
CRY1, NR1H3 | 11 | 49 | 16792 | 155.77 |
1.94×10−06 |
4.84×10−07 |
1.58×10−05 |
|
GOTERM_MF_DIRECT |
GO:0000989~transcription factor activity,
transcription factor binding | 4 | 36.36 |
5.43×10−08 | CRY2, PER2, PER1,
CRY1 | 11 | 14 | 16881 | 438.47 |
3.96×10−06 |
1.98×10−06 |
5.67×10−05 |
|
GOTERM_BP_DIRECT |
GO:0007623~circadian rhythm | 5 | 45.45 |
7.55×10−08 | CRY2, PER2, PER1,
ARNTL, CLOCK | 11 | 75 | 16792 | 101.77 |
1.10×10−05 |
2.21×10−06 |
8.98×10−05 |
|
GOTERM_BP_DIRECT |
GO:0043153~entrainment of circadian clock
by photoperiod | 4 | 36.36 |
1.72×10−07 | CRY2, PER1,
BHLHE40, CRY1 | 11 | 20 | 16792 | 305.31 |
2.52×10−05 |
4.20×10−06 |
2.05×10−04 |
|
GOTERM_BP_DIRECT | GO:0000122~negative
regulation of transcription from RNA polymerase II promoter | 7 | 63.64 |
1.10×10−06 | CRY2, PER2, PER1,
BHLHE40, BHLHE41, CRY1, NR1H3 | 11 | 720 | 16792 | 14.84 |
1.61×10−04 |
2.30×10−05 |
1.31×10−03 |
|
GOTERM_BP_DIRECT |
GO:0006351~transcription,
DNA-templated | 9 | 81.82 |
1.21×10−06 | CRY2, PER2, PER1,
BHLHE40, ARNTL, BHLHE41, CRY1, CLOCK, NR1H3 | 11 | 1955 | 16792 | 7.03 |
1.76×10−04 |
2.20×10−05 |
1.43×10−03 |
|
GOTERM_BP_DIRECT |
GO:0042634~regulation of hair cycle | 3 | 27.27 |
3.19×10−06 | PER1, ARNTL,
CLOCK | 11 | 5 | 16792 | 915.92 |
4.65×10−04 |
5.17×10−05 |
3.79×10−03 |
|
GOTERM_BP_DIRECT | GO:0042754~negative
regulation of circadian rhythm | 3 | 27.27 |
1.15×10−05 | CRY2, PER2,
CRY1 | 11 | 9 | 16792 | 508.85 |
1.67×10−03 |
1.67×10−04 |
1.36×10−02 |
|
GOTERM_MF_DIRECT |
GO:0000976~transcription regulatory region
sequence- specific DNA binding | 3 | 27.27 |
5.13×10−04 | CRY2, PER2,
ARNTL | 11 | 58 | 16881 | 79.38 |
3.68×10−02 |
1.24×10−02 |
5.34×10−01 |
|
GOTERM_MF_DIRECT | GO:0001047~core
promoter binding | 3 | 27.27 |
6.24×10−04 | ARNTL, CRY1,
CLOCK | 11 | 64 | 16881 | 71.94 |
4.46×10−02 |
1.13×10−02 |
6.50×10−01 |
|
GOTERM_BP_DIRECT |
GO:0042632~cholesterol homeostasis | 3 | 27.27 |
6.31×10−04 | CYP7A1, ABCA1,
NR1H3 | 11 | 64 | 16792 | 71.56 |
8.80×10−02 |
8.34×10−03 |
7.47×10−01 |
|
GOTERM_BP_DIRECT |
GO:0050796~regulation of insulin
secretion | 3 | 27.27 |
6.91×10−04 | PER2, ARNTL,
CLOCK | 11 | 67 | 16792 | 68.35 |
9.60×10−02 |
8.38×10−03 |
8.19×10−01 |
|
GOTERM_MF_DIRECT |
GO:0043130~ubiquitin binding | 3 | 27.27 |
9.26×10−04 | CRY2, PER2,
CRY1 | 11 | 78 | 16881 | 59.02 |
6.54×10−02 |
1.34×10−02 |
9.62×10−01 |
|
GOTERM_MF_DIRECT | GO:0000978~RNA
polymerase II core promoter proximal region sequence-specific DNA
binding | 4 | 36.36 |
9.91×10−04 | PER1, BHLHE41,
CLOCK, NR1H3 | 11 | 355 | 16881 | 17.29 |
6.99×10−02 |
1.20×10−02 | 1.03 |
|
GOTERM_MF_DIRECT |
GO:0003904~deoxyribodipyrimidine
photo-lyase activity | 2 | 18.18 |
1.18×10−03 | CRY2, CRY1 | 11 | 2 | 16881 | 1,534.64 | 8.29
×10−02 |
1.23×10−02 | 1.23 |
|
GOTERM_MF_DIRECT | GO:0003914~DNA
(6-4) photolyase activity | 2 | 18.18 |
1.18×10−03 | CRY2, CRY1 | 11 | 2 | 16881 | 1,534.64 |
8.29×10−02 |
1.23×10−02 | 1.23 |
|
GOTERM_MF_DIRECT | GO:0009882~blue
light photoreceptor activity | 2 | 18.18 |
1.18×10−03 | CRY2, CRY1 | 11 | 2 | 16881 | 1,534.64 |
8.29×10−02 |
1.23×10−02 | 1.23 |
|
GOTERM_BP_DIRECT | GO:0009785~blue
light signaling pathway | 2 | 18.18 |
1.19×10−03 | CRY2, CRY1 | 11 | 2 | 16792 | 1,526.55 |
1.60×10−01 |
1.33×10−02 | 1.41 |
|
GOTERM_BP_DIRECT | GO:2000850~negative
regulation of glucocorticoid secretion | 2 | 18.18 |
1.19×10−03 | CRY2, CRY1 | 11 | 2 | 16792 | 1,526.55 |
1.60×10−01 |
1.33×10−02 | 1.41 |
|
GOTERM_CC_DIRECT |
GO:0005634~nucleus | 9 | 81.81 |
1.48×10−03 | CRY2, PER2, PER1,
BHLHE40, ARNTL, BHLHE41, CRY1, CLOCK, NR1H3 | 11 | 5415 | 18224 | 2.75 |
3.63×10−02 |
3.63×10−02 | 1.19 |
|
GOTERM_MF_DIRECT | GO:0003677~DNA
binding | 6 | 54.55 |
1.57×10−03 | CRY2, ARNTL,
BHLHE41, CRY1, CLOCK, NR1H3 | 11 | 1674 | 16881 | 5.50 |
1.08×10−01 |
1.42×10−02 | 1.62 |
|
GOTERM_BP_DIRECT |
GO:2000074~regulation of type B pancreatic
cell development | 2 | 18.18 |
1.79×10−03 | ARNTL, CLOCK | 11 | 3 | 16792 | 1,017.70 |
2.30×10−01 |
1.85×10−02 | 2.10 |
|
GOTERM_BP_DIRECT |
GO:0097167~circadian regulation of
translation | 2 | 18.18 |
2.39×10−03 | PER2, PER1 | 11 | 4 | 16792 | 763.27 |
2.94×10−01 |
2.29×10−02 | 2.79 |
|
GOTERM_MF_DIRECT | GO:0043426~MRF
binding | 2 | 18.18 |
2.96×10−03 | BHLHE40,
BHLHE41 | 11 | 5 | 16881 | 613.85 |
1.95×10−01 |
2.37×10−02 | 3.05 |
|
GOTERM_BP_DIRECT | GO:0010887~negative
regulation of cholesterol storage | 2 | 18.18 |
3.57×10−03 | ABCA1, NR1H3 | 11 | 6 | 16792 | 508.85 |
4.07×10−01 |
3.21×10−02 | 4.16 |
|
GOTERM_BP_DIRECT | GO:0051775~response
to redox state | 2 | 18.18 |
5.94×10−03 | ARNTL, CLOCK | 11 | 10 | 16792 | 305.31 |
5.81×10−01 |
4.99×10−02 | 6.84 |
|
GOTERM_CC_DIRECT |
GO:0033391~chromatoid body | 2 | 18.18 |
6.57×10−03 | ARNTL, CLOCK | 11 | 12 | 18224 | 276.12 |
1.52×10−01 |
7.91×10−02 | 5.21 |
|
GOTERM_MF_DIRECT |
GO:0001191~transcriptional repressor
activity, RNA polymerase II transcription factor binding | 2 | 18.18 |
7.09×10−03 | BHLHE40,
BHLHE41 | 11 | 12 | 16881 | 255.77 |
4.05×10−01 |
5.06×10−02 | 7.16 |
|
GOTERM_BP_DIRECT | GO:0071397~cellular
response to cholesterol | 2 | 18.18 |
7.13×10−03 | CYP7A1, ABCA1 | 11 | 12 | 16792 | 254.42 |
6.48×10−01 |
5.64×10−02 | 8.15 |
|
GOTERM_BP_DIRECT | GO:0010745~negative
regulation of macrophage derived foam cell differentiation | 2 | 18.18 |
7.72×10−03 | ABCA1, NR1H3 | 11 | 13 | 16792 | 234.85 |
6.77×10−01 |
5.78×10−02 | 8.80 |
|
GOTERM_BP_DIRECT | GO:0010875~positive
regulation of cholesterol efflux | 2 | 18.18 |
8.31×10−03 | ABCA1, NR1H3 | 11 | 14 | 16792 | 218.08 |
7.04×10−01 |
5.91×10−02 | 9.44 |
|
GOTERM_BP_DIRECT |
GO:0006355~regulation of transcription,
DNA-templated | 5 | 45.45 |
8.66×10−03 | BHLHE40, ARNTL,
BHLHE41, CLOCK, NR1H3 | 11 | 1504 | 16792 | 5.07 |
7.19×10−01 |
5.87×10−02 | 9.82 |
|
GOTERM_BP_DIRECT |
GO:0018298~protein-chromophore
linkage | 2 | 18.18 |
9.50×10−03 | CRY2, CRY1 | 11 | 16 | 16792 | 190.82 |
7.51×10−01 |
6.13×10−02 | 10.71 |
|
GOTERM_BP_DIRECT |
GO:0050767~regulation of neurogenesis | 2 | 18.18 |
1.13×10−02 | PER2, ARNTL | 11 | 19 | 16792 | 160.69 |
8.09×10−01 |
6.94×10−02 | 12.59 |
|
GOTERM_BP_DIRECT | GO:0070932~histone
H3 deacetylation | 2 | 18.18 |
1.24×10−02 | PER2, PER1 | 11 | 21 | 16792 | 145.39 |
8.39×10−01 |
7.33×10−02 | 13.82 |
|
GOTERM_MF_DIRECT |
GO:0000982~transcription factor activity,
RNA polymerase II core promoter proximal region sequence-specific
binding | 2 | 18.18 |
1.35×10−02 | ARNTL, CLOCK | 11 | 23 | 16881 | 133.45 |
6.30×10−01 |
8.65×10−02 | 13.27 |
|
GOTERM_MF_DIRECT | GO:0043425~bHLH
transcription factor binding | 2 | 18.18 |
1.35×10−02 | BHLHE40,
BHLHE41 | 11 | 23 | 16881 | 133.45 |
6.30×10−01 |
8.65×10−02 | 13.27 |
|
GOTERM_BP_DIRECT | GO:0019915~lipid
storage | 2 | 18.18 |
1.42×10−02 | CRY2, CRY1 | 11 | 24 | 16792 | 127.21 |
8.76×10−01 |
8.02×10−02 | 15.63 |
|
GOTERM_MF_DIRECT |
GO:0003700~transcription factor activity,
sequence-specific DNA binding | 4 | 36.36 |
1.63×10−02 | BHLHE40, ARNTL,
CLOCK, NR1H3 | 11 | 961 | 16881 | 6.39 |
6.99×10−01 |
9.53×10−02 | 15.78 |
|
GOTERM_BP_DIRECT | GO:0045944~positive
regulation of transcription from RNA polymerase II promoter | 4 | 36.36 |
1.75×10−02 | PER1, ARNTL, CLOCK,
NR1H3 | 11 | 981 | 16792 | 6.22 |
9.24×10−01 |
9.44×10−02 | 18.93 |
|
GOTERM_MF_DIRECT | GO:0016829~lyase
activity | 2 | 18.18 |
1.88×10−02 | CRY2, CRY1 | 11 | 32 | 16881 | 95.91 |
7.50×10−01 |
1.01×10−01 | 17.97 |
|
GOTERM_MF_DIRECT | GO:0001102~RNA
polymerase II activating transcription factor binding | 2 | 18.18 |
2.23×10−02 | BHLHE40,
BHLHE41 | 11 | 38 | 16881 | 80.77 |
8.07×10−01 |
1.11×10−01 | 20.97 |
|
GOTERM_MF_DIRECT |
GO:0015485~cholesterol binding | 2 | 18.18 |
2.40×10−02 | ABCA1, NR1H3 | 11 | 41 | 16881 | 74.86 |
8.31×10−01 |
1.12×10−01 | 22.42 |
|
GOTERM_BP_DIRECT | GO:0031397~negative
regulation of protein ubiquitination | 2 | 18.18 |
2.42×10−02 | PER2, CRY1 | 11 | 41 | 16792 | 74.47 |
9.72×10−01 |
1.24×10−01 | 25.22 |
|
GOTERM_MF_DIRECT | GO:0001046~core
promoter sequence-specific DNA binding | 2 | 18.18 |
2.52×10−02 | CRY1, CLOCK | 11 | 43 | 16881 | 71.38 |
8.45×10−01 |
1.10×10−01 | 23.38 |
|
GOTERM_BP_DIRECT |
GO:0006094~gluconeogenesis | 2 | 18.18 |
2.59×10−02 | PER2, CRY1 | 11 | 44 | 16792 | 69.39 |
9.78×10−01 |
1.28×10−01 | 26.80 |
|
GOTERM_MF_DIRECT |
GO:0019902~phosphatase binding | 2 | 18.18 |
2.63×10−02 | CRY2, CRY1 | 11 | 45 | 16881 | 68.21 |
8.58×10−01 |
1.08×10−01 | 24.32 |
|
GOTERM_MF_DIRECT |
GO:0031490~chromatin DNA binding | 2 | 18.18 |
3.38×10−02 | PER1, CLOCK | 11 | 58 | 16881 | 52.92 |
9.19×10−01 |
1.30×10−01 | 30.17 |
|
GOTERM_CC_DIRECT |
GO:0043231~intracellular membrane-bounded
organelle | 3 | 27.27 |
3.58×10−02 | CYP7A1, ARNTL,
CLOCK | 11 | 558 | 18224 | 8.91 |
5.98×10−01 |
2.62×10−01 | 25.59 |
|
GOTERM_BP_DIRECT | GO:0045893~positive
regulation of transcription, DNA-templated | 3 | 27.27 |
3.59×10−02 | ARNTL, CLOCK,
NR1H3 | 11 | 515 | 16792 | 8.89 |
9.95×10−01 |
1.68×10−01 | 35.24 |
|
GOTERM_MF_DIRECT |
GO:0043565~sequence-specific DNA
binding | 3 | 27.27 |
3.59×10−02 | ARNTL, CLOCK,
NR1H3 | 11 | 518 | 16881 | 8.89 |
9.31×10−01 |
1.31×10−01 | 31.74 |
|
GOTERM_MF_DIRECT |
GO:0003705~transcription factor activity,
RNA polymerase II distal enhancer sequence-specific binding | 2 | 18.18182 |
3.84×10−02 | BHLHE40,
BHLHE41 | 11 | 66 | 16881 | 46.50 |
9.43×10−01 |
1.33×10−01 | 33.57 |
|
GOTERM_BP_DIRECT | GO:0032868~response
to insulin | 2 | 18.18 |
3.92×10−02 | CRY2, CRY1 | 11 | 67 | 16792 | 45.57 |
9.97×10−01 |
1.77×10−01 | 37.83 |
|
GOTERM_BP_DIRECT | GO:0042593~glucose
homeostasis | 2 | 18.18 |
5.86×10−02 | CRY2, CRY1 | 11 | 101 | 16792 | 30.22 |
9.99×10−01 |
2.47×10−01 | 51.19 |
|
GOTERM_MF_DIRECT | GO:0042826~histone
deacetylase binding | 2 | 18.18 |
5.88×10−02 | BHLHE41, CRY1 | 11 | 102 | 16881 | 30.09 |
9.88×10−01 |
1.90×10−01 | 46.89 |
|
GOTERM_MF_DIRECT |
GO:0001078~transcriptional repressor
activity, RNA polymerase II core promoter proximal region
sequence-specific binding | 2 | 18.18 |
6.39×10−02 | BHLHE40,
BHLHE41 | 11 | 111 | 16881 | 27.65 |
9.92×10−01 |
1.97×10−01 | 49.78 |
|
GOTERM_BP_DIRECT | GO:0071222~cellular
response to lipopolysaccharide | 2 | 18.18 |
6.53×10−02 | ABCA1, NR1H3 | 11 | 113 | 16792 | 27.02 |
9.99×10−01 |
2.65×10−01 | 55.19 |
|
GOTERM_MF_DIRECT | GO:0005515~protein
binding | 9 | 81.82 |
7.05×10−02 | CRY2, PER2,
BHLHE40, ARNTL, ABCA1, BHLHE41, CRY1, CLOCK, NR1H3 | 11 | 8785 | 16881 | 1.57 |
9.95×10−01 |
2.07×10−01 | 53.38 |
|
GOTERM_BP_DIRECT |
GO:0051726~regulation of cell cycle | 2 | 18.18 |
7.15×10−02 | PER2, ARNTL | 11 | 124 | 16792 | 24.62 |
9.99×10−01 |
2.80×10−01 | 58.57 |
|
GOTERM_MF_DIRECT | GO:0046983~protein
dimerization activity | 2 | 18.18 |
8.55×10−02 | ARNTL, CLOCK | 11 | 150 | 16881 | 20.46 |
9.99×10−01 |
2.38×10−01 | 60.62 |
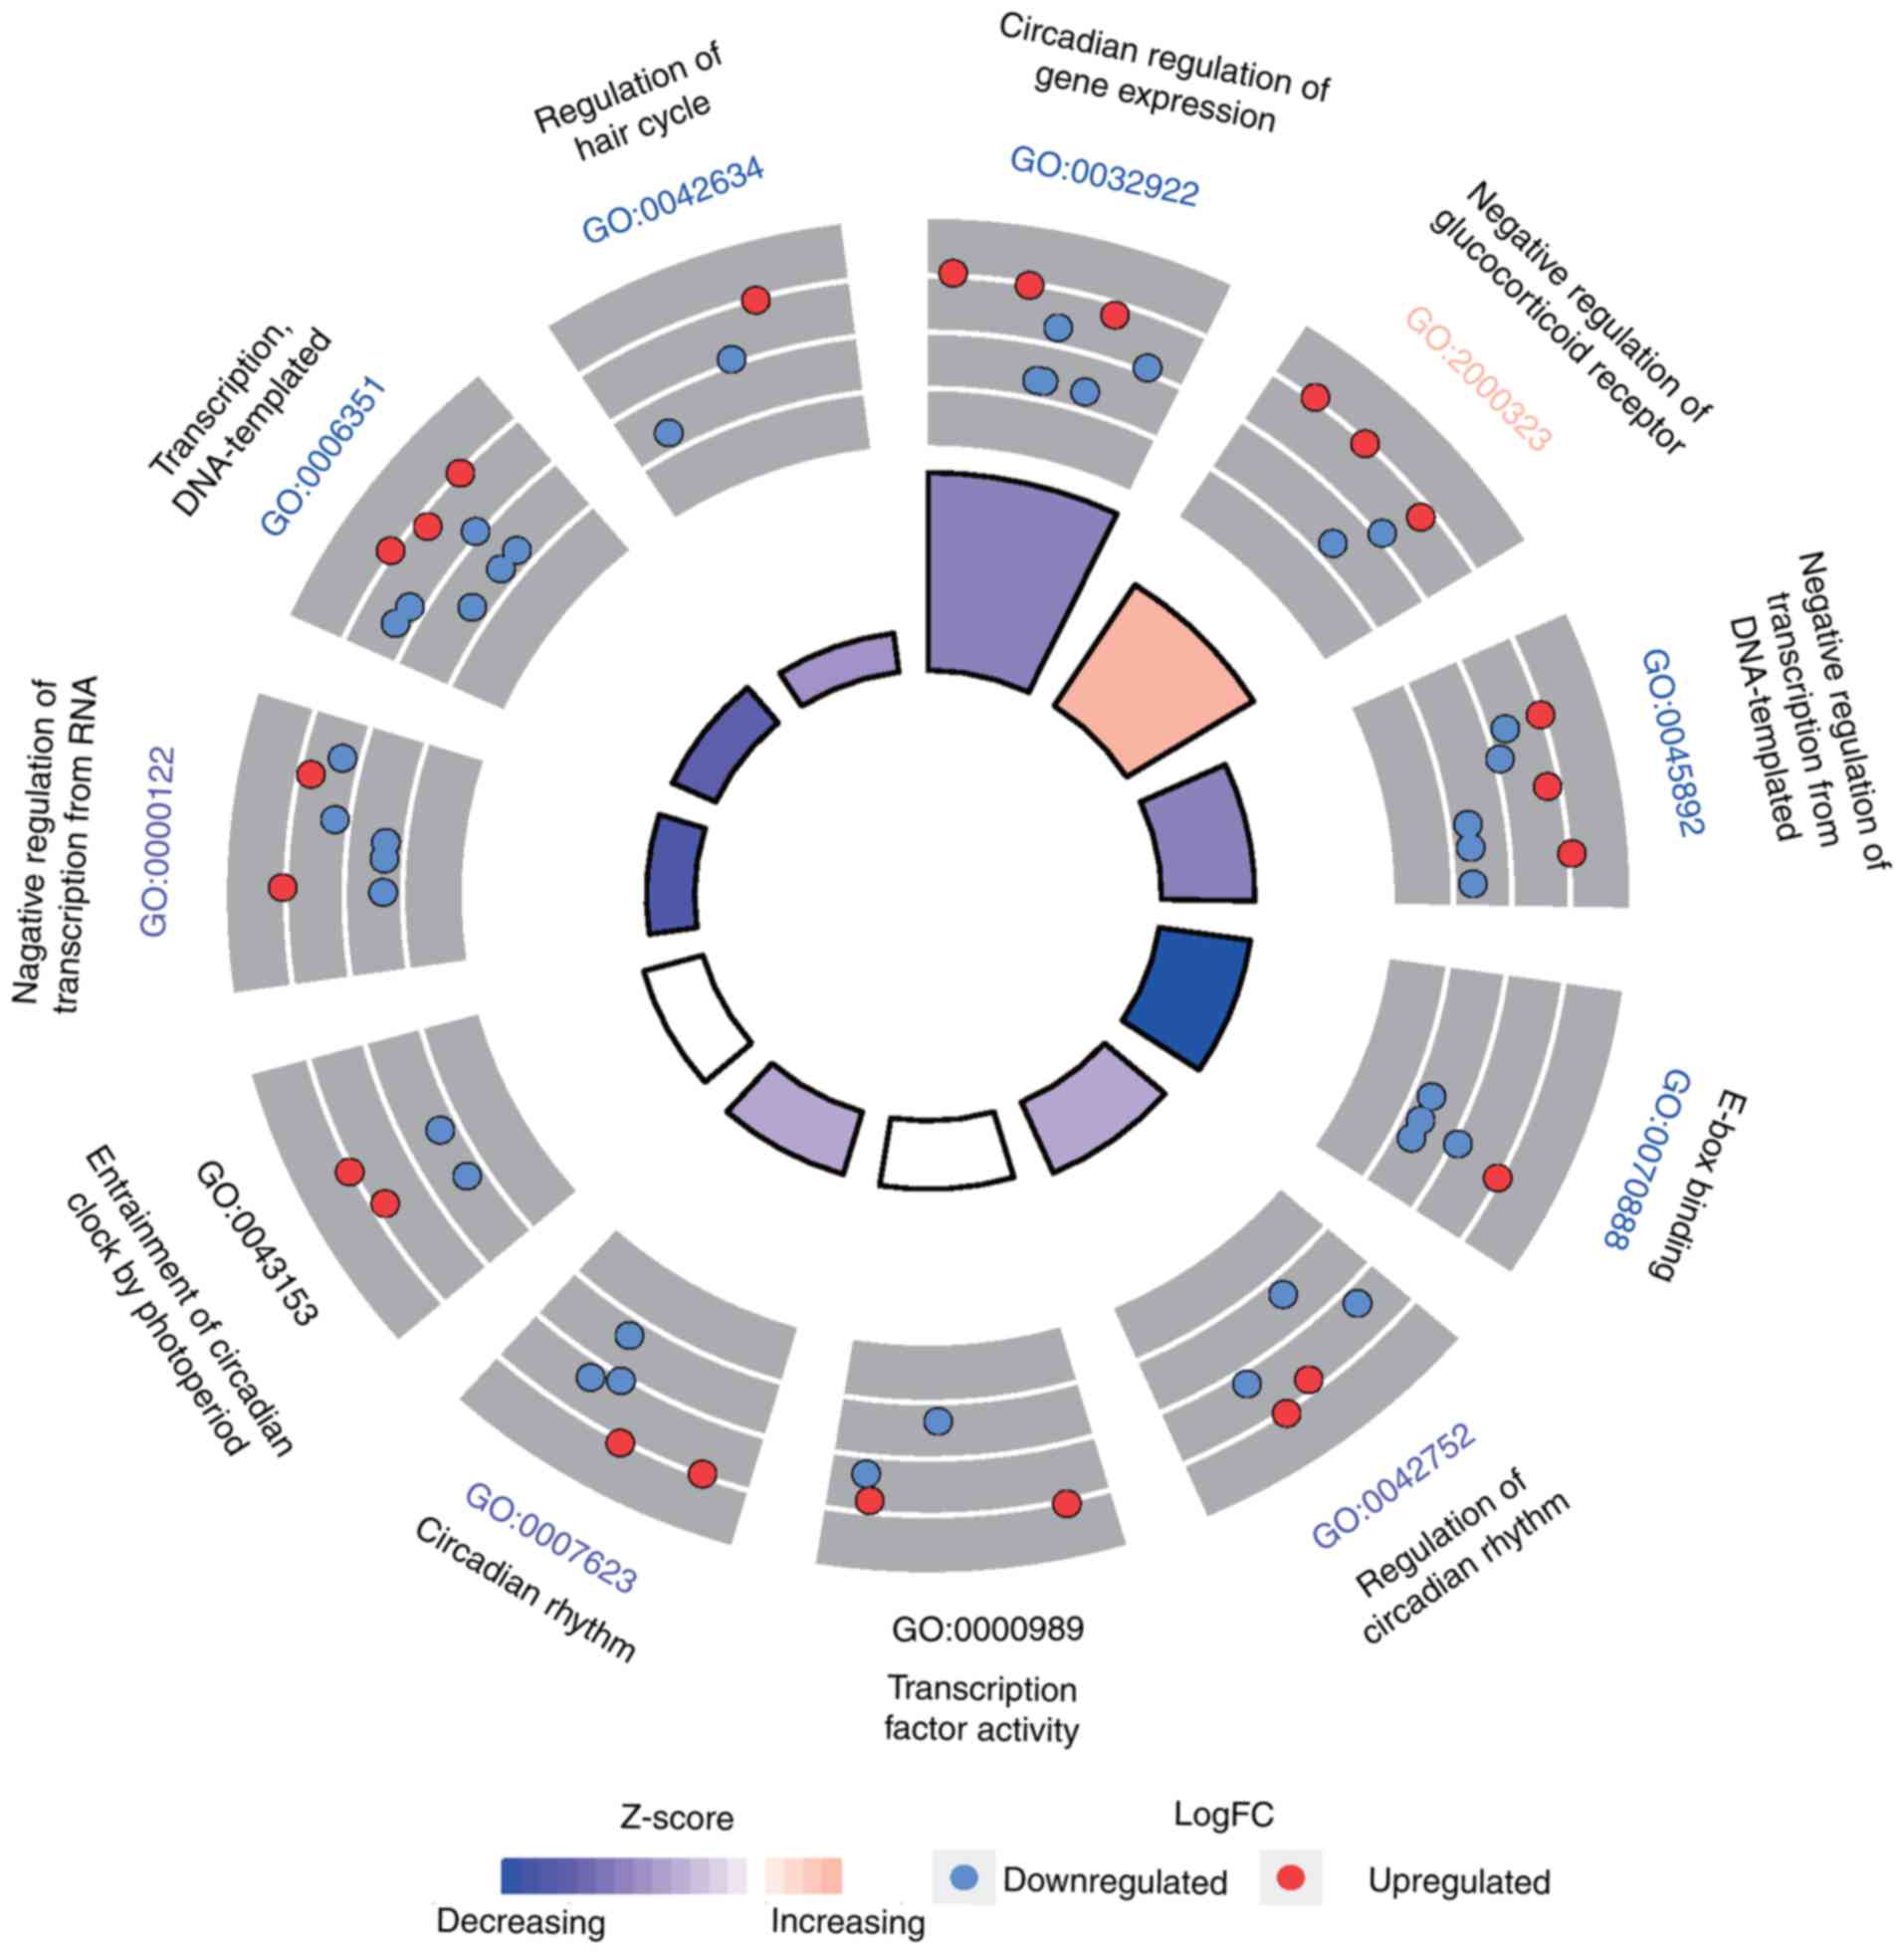
To gain insight into the functional characteristics
of the identified blood lipid metabolism-associated protein-coding
core clock and clock-controlled genes, GO and KEGG pathway
enrichment analyses were performed using DAVID (34). Molecular information was added to
GO terms of potential associated genes of circadian rhythms of
blood lipid metabolism (Fig. 5).
In terms of biological processes, the GO analysis indicated that
the clock system protein-coding genes were significantly (all
P<0.05) enriched in the circadian regulation of gene expression
(GO:0006351), the negative regulation of the glucocorticoid
receptor signaling pathway (GO:2000323) and DNA-templated
transcription (GO:0045892). In terms of molecular function (MF),
the genes were enriched in E-box binding (GO:0070888),
transcription factor activity and transcription factor binding
(GO:0000989), and transcription regulatory region sequence-specific
DNA binding (GO:0000976). Additionally, GO cellular component (CC)
analysis revealed that the genes were significantly enriched in the
nucleus, chromatoid body and intracellular membrane-bound
organelles.
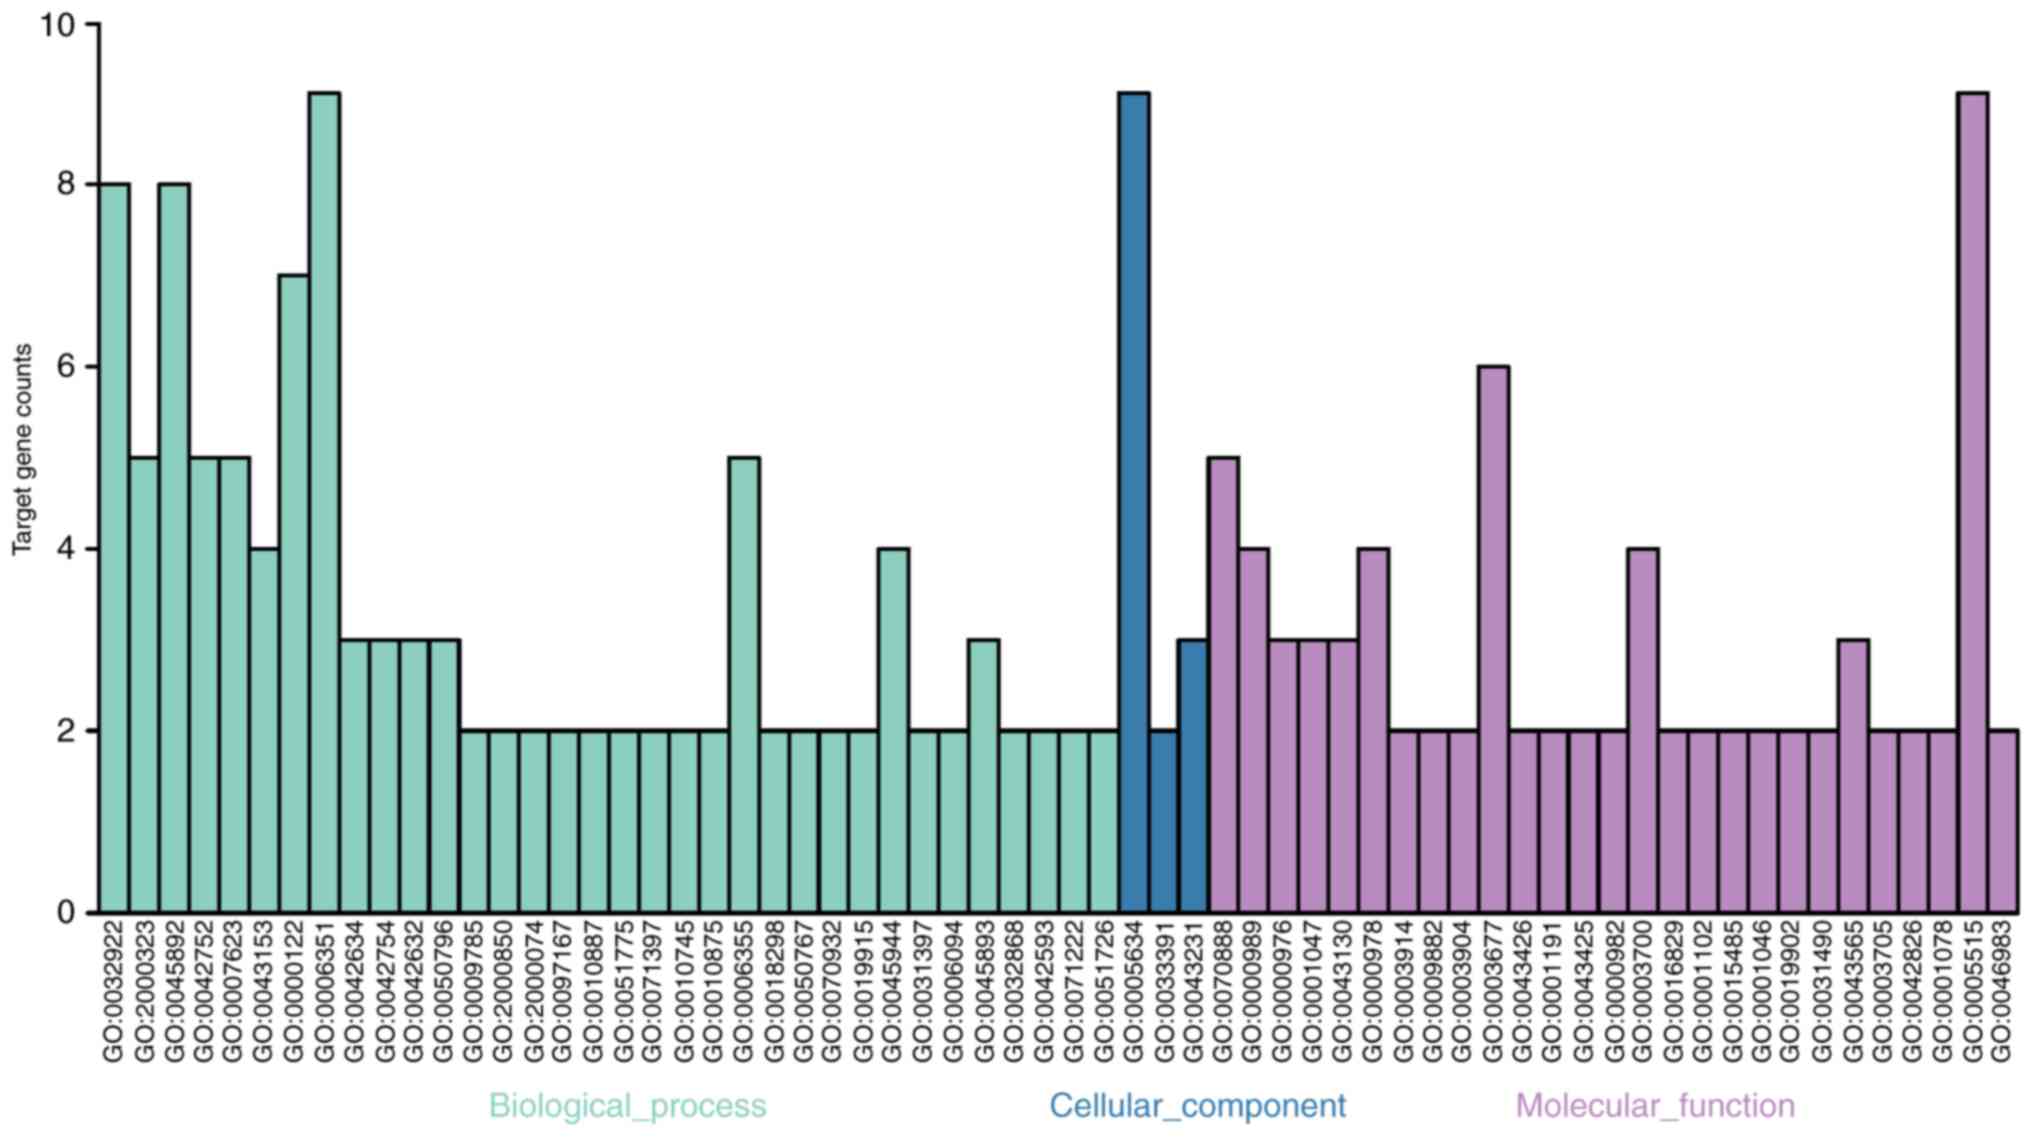 | Figure 5Target gene counts of GO biological
processes. The GO analysis results demonstrated that the clock
system protein-coding genes were significantly enriched in the
circadian regulation of gene expression (GO:0006351), negative
regulation of glucocorticoid receptor signaling pathway
(GO:2000323) and DNA-templated (GO:0045892) under BPs (light blue
bar). Under MF (purple), the genes were enriched in E-box binding
(GO:0070888), transcription factor activity, transcription factor
binding (GO:0000989) and transcription regulatory region
sequence-specific DNA binding (GO:0000976). Additionally, GO CC
(dark blue bar) analysis revealed genes significantly were enriched
in the nucleus, chromatoid body and the intracellular
membrane-bounded organelle. GO, Gene Ontology; BP, biological
process; CC, cellular component; MF, molecular function. |
Additionally, a graphic representation of the
complicated association between clock genes and the respective GO
terms, including a 'concept-and-gene network', was constructed
using the GeneAnswers R package (35). To add quantitative molecular data
to the GO terms of interest, the GOCircle plot, GOChord and
GOCluster plot functions of the GOplot R package were added
(27) (Figs. 6 and 7). These functions permit the
incorporation of data derived from expression level measurements
with those obtained from functional annotation enrichment analysis
(Table IV).
According to the interactions between the clock
genes and the intersecting pathway genes, a clock gene network was
constructed that illustrated the network pathway and the key
regulatory functions of the identified clock genes. Using KEGG
pathway enrichment analysis of Cytoscape and the KOBAS network, the
rhythmically expressed protein-coding genes were determined to be
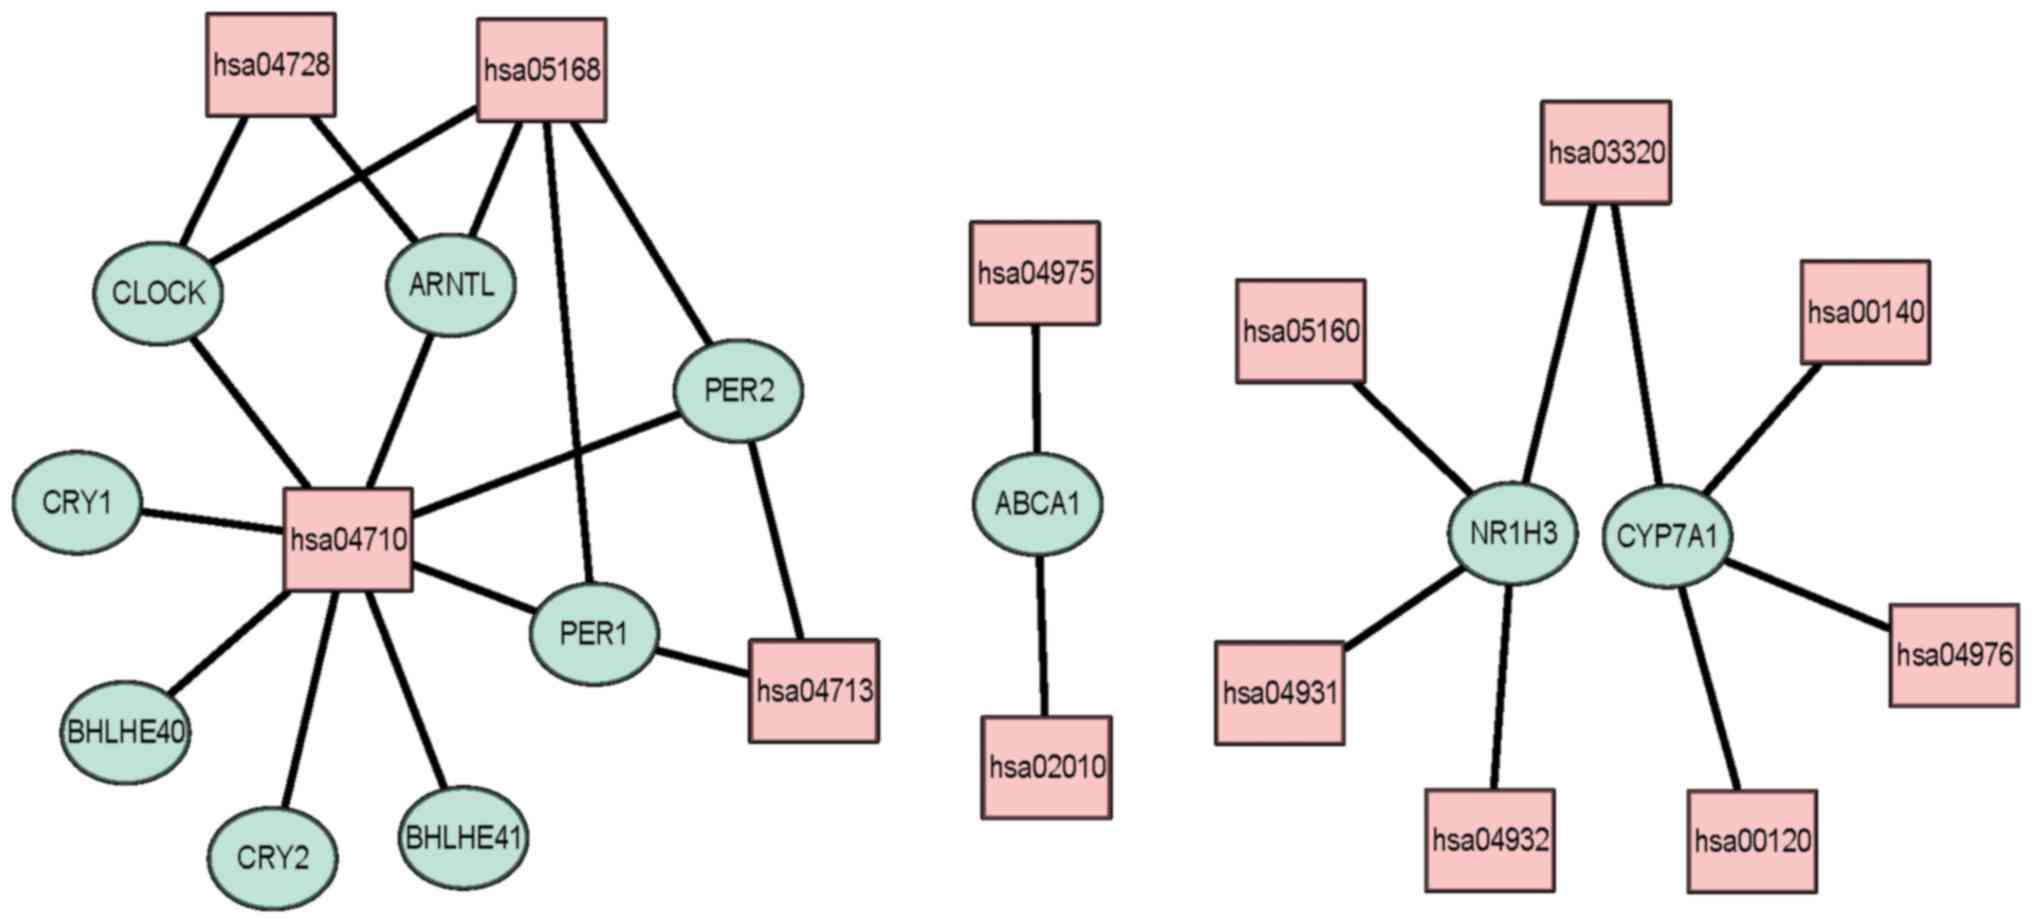
significantly enriched in circadian rhythm (hsa04710), PPAR
signaling pathways (hsa03320), circadian entrainment (hsa04713),
fat digestion and absorption (hsa04975) and ABC transporters
(hsa02010); Fig. 8 and Table V).
| Table VData of KEGG pathways analysis. |
Table V
Data of KEGG pathways analysis.
Discussion
The majority of studies suggest that the lipid
metabolism involved in kidney disease primarily affects local
tissue lipid deposition and local tissue energy barriers (36). However, serum cholesterol levels
of patients with CKD are determined by endogenous synthesis and
intestinal absorption of exogenous cholesterol (37). Although numerous tissues
(endocrine organs, the immune system, the endothelium) contribute
to the plasma protein pool, the bulk of plasma proteins is secreted
by the liver and are those lost to the highest extent in the NS
(38). Additionally,
three-quarters of the total cholesterol is synthesized in the liver
(39), thus, it was hypothesized
that renal injury affects peripheral blood lipid levels through the
liver. Therefore, the present study focused on the hepatic clock
system that affects circulating lipids.
Clinicians usually overlook the circadian rhythm of
blood lipids. Few primary research studies have explored the
circadian rhythm of blood lipids (40–42). However, previous studies have
suggested that the deletion or knockdown of mouse core clock genes
results in several circadian rhythm abnormalities concerning TGs,
gluconeogenesis and liver GLU metabolism (40,43). It is well acknowledged that
hyperlipidemia occurs in patients with NS and improves immediately
with the remission of NS. It is an excellent model of kidney
disease to explore the circadian rhythm of blood lipids, and the
underlying crosstalk between kidney and liver.
In the present study, nephropathy induced by ADR in
rats presented with the typical characteristics of normal renal
function, hypoalbuminemia and hyperlipidemia. Electron microscopy
indicated partial podocyte fusion, which is a major cause of
idiopathic NS. Multiple and large doses (total >10 mg/kg) of
Adriamycin are associated with the development of rat hepatic
lesions (44), whereby Adriamycin
causes significant abnormalities in liver function parameters. In
previous studies, the single dose of Adriamycin generally used in
rats to induce NS is between 5.0 and 7.5 mg/kg (16,45,46). Since complete absorption of the
drug may induce organ damage, intravenous injection provides direct
access to the drug and eliminates the absorption dependence on the
peritoneal membrane (46).
Therefore, the present study used a single tail vein injection dose
of 6.5 mg/kg the day after 2 weeks of adaptation and particular
caution was taken due to the risk of extravasation during
injection. The ADR-induced nephropathy rats exhibited significantly
higher blood lipid levels and a disturbed blood lipid circadian
rhythm (P<0.05). Notably, the activities of AST and ALT in the
ADR group were not pathologically increased, whereby the levels
were within the normal range of male rats aged 12–13 weeks (normal
ranges: AST, 87-144 U/l; ALT, 28-40 U/l) (23). The NS rats in the present study
may not have experienced deterioration in hepatic function, because
the levels of ALT and AST remained within the normal range compared
with the control group, and the total dose of Adriamycin was less
than the dose required to induce liver damage. Dyslipidemia may be
attributed to the compensatory liver dysfunction under the
nephritic state. However, the lack of histological staining of
liver tissue in the same set of experiments was a limitation of
this study.
Multiple regulators of lipid metabolism and
rate-limiting enzymes in TG accumulation exhibit circadian
rhythmicity during nutrient metabolism, and the clock system is
indispensable for these processes in the liver. Mice lacking the
liver-specific core clock gene BMAL1 exhibit abnormalities
in blood TGs, GLU and gluconeogenesis. Furthermore, a previous
study revealed the metabolism-associated clock-controlled genes
altered rhythms; however, the rhythm of GLU remained consistent in
the asynchronous dietary (47).
Human plasma lipid levels, including those of TGs and cholesterol,
are rhythmic over a 24-h period (48), independent of feeding and waking
conditions (42). Furthermore,
Chua et al (42) did not
detect a circadian rhythm in blood GLU and LDL-C; however, a trend
was observed for higher levels of LDL-C during the daytime, this
may be due to substantial individual differences in timing of the
rhythm. Their results are consistent with the present study;
however, they did not evaluate a rhythmic component via the Fourier
transform method. Significant daily variations in the HDL-C levels
were detected by Rivera-Coll et al (48) and Van den Berg et al
(49). However, Van Den Berg
et al (49) did not
evaluate a rhythmic component. Notably, different analytical
methods in other studies make it difficult to compare the result
that lack of circadian rhythm associated with HDL-C levels in the
present study; a fact that may explain, in part, the observed
differences in timing and daily amplitude between the present
research and other studies. A previous study indicated CLOCK
knockout mice exhibit hyperlipidemia and hepatic steatosis, and
PER1 regulates PPARα mRNA expression and the
development of obesity (41).
Furthermore, PER2 has been suggested to be involved in
PPAR-associated pathways and white adipose tissue mobilization
(3). The aforementioned studies
suggested that different circadian clock genes serve a role in the
regulation of lipid regulation.
In the present study, the mRNA expression of six
hepatic core clock genes in the normal control group was associated
with stable rhythmic features, with minimums during the day and
maximums at night (activity period), which is consistent with
previous studies on mice (50,51). Furthermore, the cycle duration was
24 h for five core clock genes (CLOCK, BMAL1,
PER2, CRY1 and CRY2) and 12 h for PER1
in the control group. However, extended or abnormal rhythms were
exhibited in the ADR group. Although PER1 mRNA was expressed
in the ADR group, the rhythm was absent (P<0.05). In addition,
disordered rhythms were revealed in the downstream lipid-associated
clock-controlled genes of core hepatic clock genes (LXR,
DEC1, DEC2, SREBP-1, ABCA1 and
CYP7A1). Among these, the rhythmic expression of functional
clock genes (DEC1 and DEC2), as well as PER1,
was entirely absent in the ADR group. Notably, the former two genes
are downstream of the core clock gene PER1 and regulate
feedback of PER1 transcription (52). CYP7A1, SREBP-1 and
ABCA1 all exhibit periodic oscillations, and are regulated
by DEC1 and DEC2 (53). CYP7α serves important roles in
bile acid synthesis and its rhythmic expression is inhibited by
binding DEC2 via E-box elements. The present finding supports that
increasing hepatic DEC2 mRNA expression may result in a
reduction in CYP7α mRNA expression in NS rats. This may
hinder the metabolism of cholesterol into bile acids, thereby
inducing the occurrence of hypercholesterolemia. LXRα increases
CYP7α expression and promotes bile acid synthesis (54). ABCA1 typically mediates the
transmembrane transport of lipids metabolites (55), serving a key role in the reverse
transport of cholesterol in vivo. It also permits
intracellular cholesterol, phospholipid and free ApoA or ApoE
binding to LXRα, which then initiates HDL synthesis. In addition,
several fatty acid synthase genes are target genes of
SREBP-1, and the activity of SREBP-1 leads to an
increase in blood TG synthesis. The present study indicated that
the circadian rhythmic expression of lipid metabolism genes was
regulated by the critical rhythm of key enzymes and
transcription-associated factors, and the associated fat synthase
gene was simultaneously activated by the core clock genes (Fig. 9).
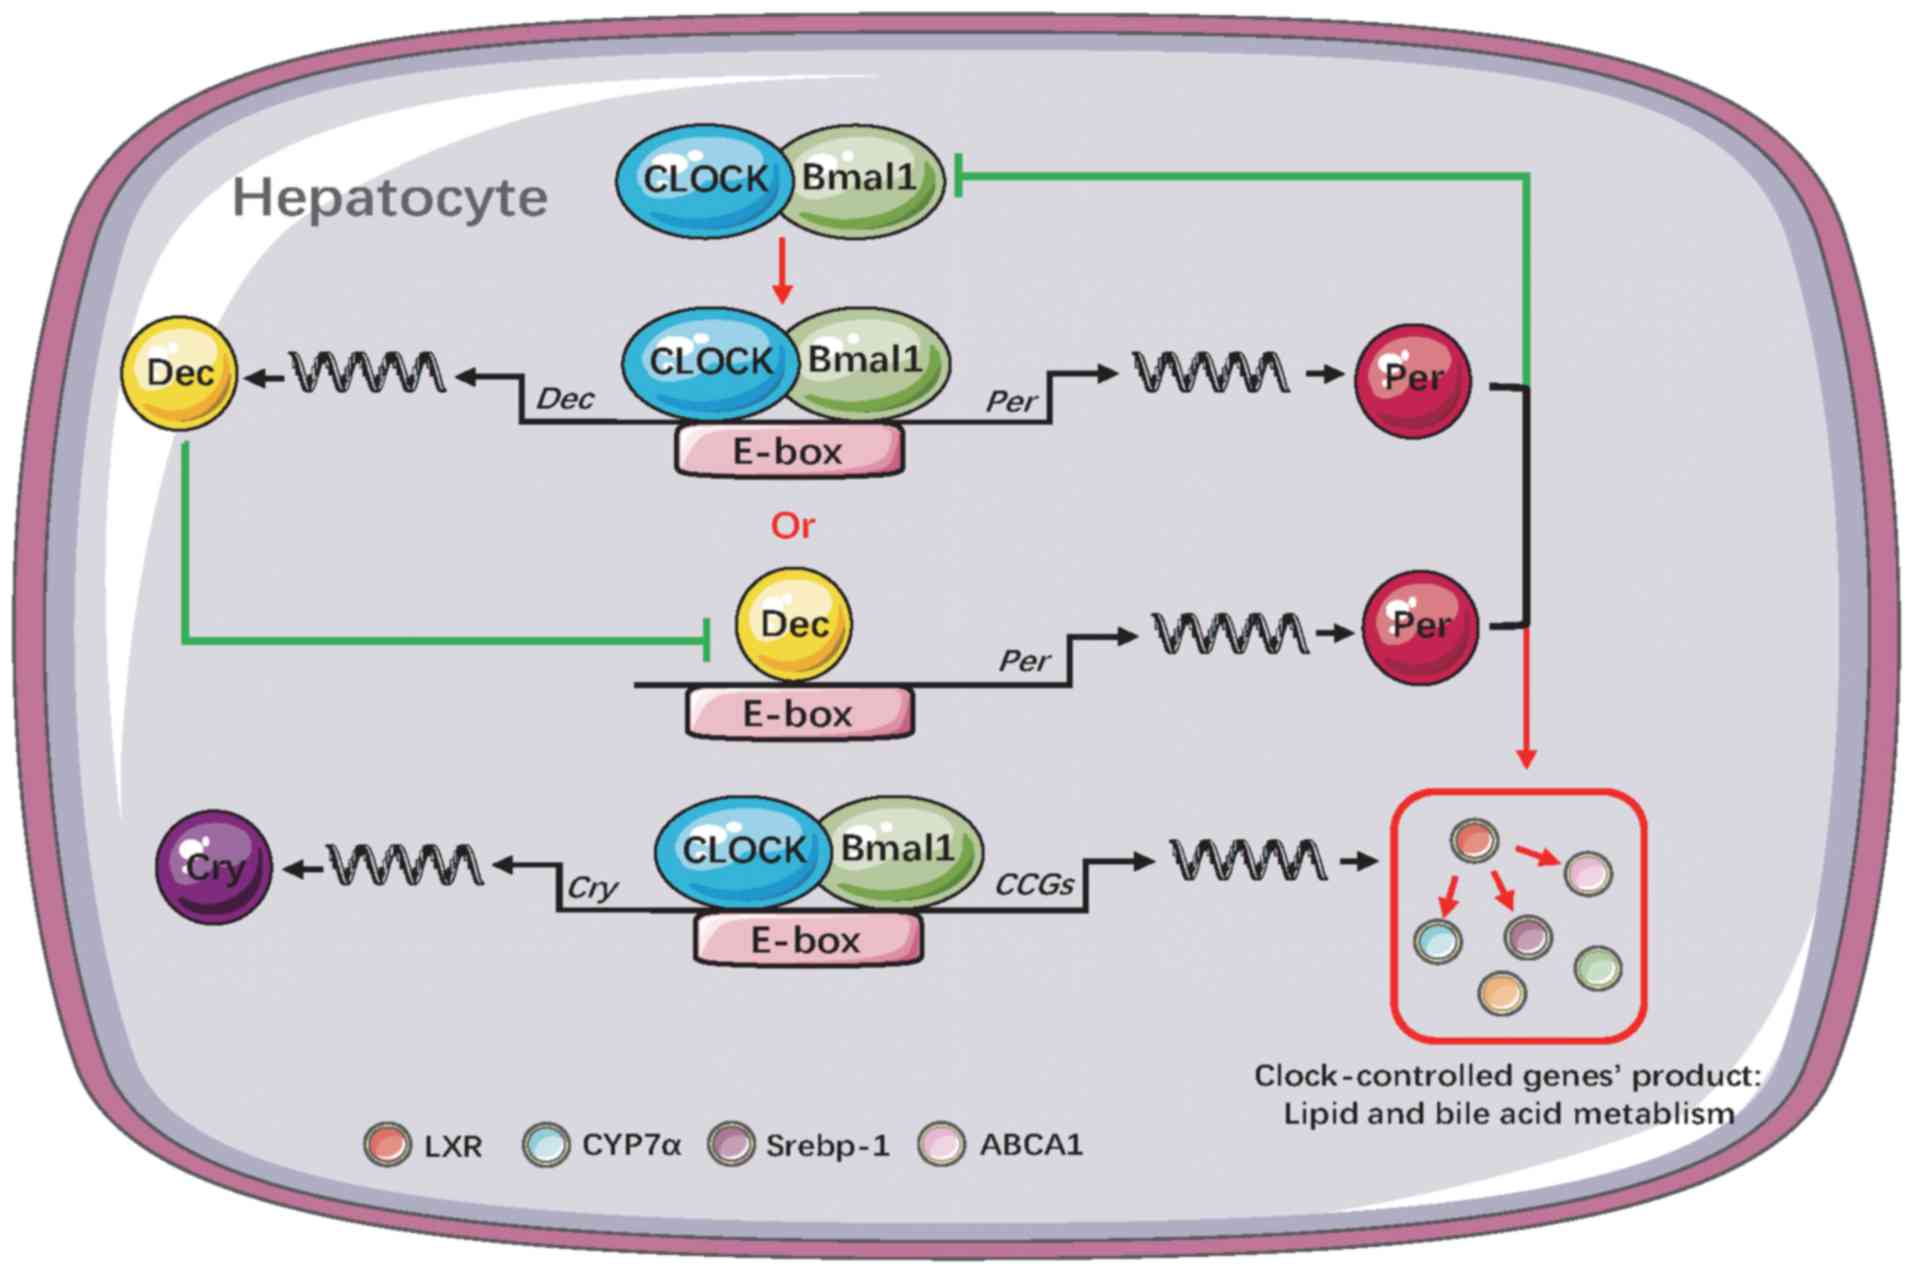 | Figure 9Diagram of liver clock gene and clock
control gene association. The red line represents the promoting
effect, the green line represents inhibition, and the black line
represents transcription into protein. CLOCK, circadian
locomoter output cycles kaput; BMAL1, brain and muscle
ARNT-like protein 1; CRY, cryptochrome; PER, period
homologue; LXR, liver X receptor; CYP7A1, cholesterol
7α-hydroxylase; SREBP-1, sterol regulatory element binding
protein-1c; ABCA1, ATP binding cassette transporter A1;
DEC, differentiated embryo chondrocyte. |
Due to the limitation that human liver tissue cannot
be extracted six times within 24 h to monitor blood lipid rhythm
analysis, GO and KEGG enrichment assays were performed to detect
differentially expressed clock genes to provide a biologically
meaningful explanation of the present results in humans. Using
bioinformatics methods, including the GOplot R package, for
visually combining expression data with functional analysis and
predicting the potential disease-causing genes has been considered
viable in various diseases (56,57). The enrichment of GO annotation
terms revealed that the clock system protein-coding genes were
significantly enriched in specific biological processes, MFs and
CCs. In particular, the most representative functional processes of
clock genes were the circadian regulation of gene expression, E-box
binding, transcription factor activity and negative regulation of
the glucocorticoid receptor signaling pathway. These findings were
consistent with previous evidence that suggest the essential role
of these pathogenetic mechanisms in disease states (4,5,9).
However, the most significant limitation of the current research is
the observational nature of the study in vivo, and the lack
of specific knockdown and response experiments.
The functional interpretation of the GO- and
KEGG-based clock-specific 'concept-and-gene networks' in the
present study highlighted the possibility that core clock genes
exert pathogenic effects via different multifactorial combinations,
providing an important insight into clock core genes that may have
a fundamental influence in NS. The transcriptional amplitude of
clock genes was decreased or absent in patients with NS included in
this study, suggesting that these proteins may represent
susceptibility factors for disordered rhythms.
To compensate for the difficulties and limitations
of human circadian rhythm research, multiple bioinformatics methods
were used to analyze the associations between the overall human
core clock (BMAL1, CLOCK, CRY1, CRY2,
PER1 and PER2) and clock-controlled genes
(LXR, DEC1, DEC2, SREBP-1, ABCA1
and CYP7A1), including signaling pathway and correlation
prediction analyses. Their associations in the co-expression
network were determined (avg. local clustering coefficient, 0.849).
Consistent with the KEGG pathway analysis results, these genes were
primarily enriched in the circadian rhythm pathway, and governed
the regulation of downstream liver-specific, lipid-associated
clock-controlled genes and blood lipid homeostasis and rhythmicity.
These results may aid in providing a deeper understanding of
rhythmic gene expression in the human clock system.
From the publications reviewed, NS is one of the few
acquired conditions that alter the plasma levels of lipoprotein
(58). Once NS enters remission,
lipoprotein levels normalize quickly (38), and the changes in hepatic
circadian rhythm were demonstrated to be secondary to kidney
disease without any damage to liver tissue in the present study.
Since the molecular mechanism of the circadian rhythm of an
organism involves the clock gene system, and the activity of
peripheral clock systems are independent from the central clock
system, the present study results suggested that renal injury lead
to local circadian system disorder, which may have caused the
impaired function of the core clock gene to affect the liver,
subsequently disrupting lipid metabolism. In order to confirm the
phenomenon observed in the present study, further studies are
required.
In conclusion, the present study reported that NS
rats exhibited dyslipidemia and circadian disorders of lipid
metabolism. The results suggested that these changes involve the
abnormal expression of hepatic core clock genes and downstream
clock-controlled genes. Furthermore, the findings indicated that
damage to the hepatic clock system is a potential molecular
mechanism for disordered blood lipid circadian rhythm in the
context of CKD. Such analyses offer a starting point for
understanding the crosstalk between peripheral organs and
peripheral clock systems. Further investigations into the
prevention and treatment of CKD by resetting or repairing disturbed
central or peripheral clock systems are required.
Funding
The present study was supported by the National
Natural Sciences Foundation of China (grant no. 81100545), The
Beijing Municipal Science and Technology Commission (grant nos.
D131100004713007 and D09050704310901), and The Peking Union Medical
College Youth Fund (grant no. 3332016012).
Availability of data and materials
All data generated or analyzed during this study are
included in this published article.
Authors' contributions
PC, RZ, LM, XwL, XmL and YQ contributed to the
conception and design of this study. PC, RZ and LM performed the
experiments. PC analyzed and interpretation of data. PC and YQ
drafted the manuscript. All the authors read and gave final
approval of the version to be published.
Ethics approval and consent to
participate
The animal experimental procedures were approved by
the Animal Ethics Committee of Peking Union Medical College
Hospital (Beijing, China).
Patient consent for publication
Not applicable.
Competing interests
The authors declare that they have no competing
interests.
Acknowledgments
Not applicable.
References
|
1
|
Harper CR and Jacobson TA: Managing
dyslipidemia in chronic kidney disease. J Am Coll Cardiol.
51:2375–2384. 2008. View Article : Google Scholar : PubMed/NCBI
|
|
2
|
Tsimihodimos V, Dounousi E and Siamopoulos
KC: Dyslipidemia in chronic kidney disease: An approach to
pathogenesis and treatment. Am J Nephrol. 28:958–973. 2008.
View Article : Google Scholar : PubMed/NCBI
|
|
3
|
Zhao X, Cho H, Yu RT, Atkins AR, Downes M
and Evans RM: Nuclear receptors rock around the clock. EMBO Rep.
15:518–528. 2014. View Article : Google Scholar : PubMed/NCBI
|
|
4
|
Zhang EE and Kay SA: Clocks not winding
down: Unravelling circadian networks. Nat Rev Mol Cell Biol.
11:764–776. 2010. View
Article : Google Scholar : PubMed/NCBI
|
|
5
|
Ungar F and Halberg F: Circadian rhythm in
the in vitro response of mouse adrenal to adrenocorticotropic
hormone. Science. 137:1058–1060. 1962. View Article : Google Scholar : PubMed/NCBI
|
|
6
|
Mure LS, Le HD, Benegiamo G, Chang MW,
Rios L, Jillani N, Ngotho M, Kariuki T, Dkhissi-Benyahya O, Cooper
HM and Panda S: Diurnal transcriptome atlas of a primate across
major neural and peripheral tissues. Science. 359:eaao03182018.
View Article : Google Scholar : PubMed/NCBI
|
|
7
|
Tokonami N, Mordasini D, Pradervand S,
Centeno G, Jouffe C, Maillard M, Bonny O, Gachon F, Gomez RA,
Sequeira-Lopez ML and Firsov D: Local renal circadian clocks
control fluid-electrolyte homeostasis and BP. J Am Soc Nephrol.
25:1430–1439. 2014. View Article : Google Scholar : PubMed/NCBI
|
|
8
|
Reppert SM and Weaver DR: Coordination of
circadian timing in mammals. Nature. 418:935–941. 2002. View Article : Google Scholar : PubMed/NCBI
|
|
9
|
Oosterman JE, Kalsbeek A, la Fleur SE and
Belsham DD: Impact of nutrients on circadian rhythmicity. Am J
Physiol Regul Integr Comp Physiol. 308:R337–R350. 2015. View Article : Google Scholar :
|
|
10
|
Wharfe MD, Mark PJ and Waddell BJ:
Circadian variation in placental and hepatic clock genes in rat
pregnancy. Endocrinology. 152:3552–3560. 2011. View Article : Google Scholar : PubMed/NCBI
|
|
11
|
Touitou Y, Smolensky MH and Portaluppi F:
Ethics, standards, and procedures of animal and human chronobiology
research. Chronobiol Int. 23:1083–1096. 2006. View Article : Google Scholar : PubMed/NCBI
|
|
12
|
Nguyen TT, Mattick JS, Yang Q, Orman MA,
Ierapetritou MG, Berthiaume F and Androulakis IP: Bioinformatics
analysis of transcriptional regulation of circadian genes in rat
liver. BMC Bioinformatics. 15:832014. View Article : Google Scholar : PubMed/NCBI
|
|
13
|
Wu T, ZhuGe F, Zhu Y, Wang N, Jiang Q, Fu
H, Li Y and Fu Z: Effects of light on the circadian rhythm of
diabetic rats under restricted feeding. J Physiol Biochem.
70:61–71. 2014. View Article : Google Scholar
|
|
14
|
Bertani T, Poggi A, Pozzoni R, Delaini F,
Sacchi G, Thoua Y, Mecca G, Remuzzi G and Donati MB:
Adriamycin-induced nephrotic syndrome in rats: Sequence of
pathologic events. Lab Invest. 46:16–23. 1982.PubMed/NCBI
|
|
15
|
Lu B, Li X and Ma R: Evaluation of the
modified adriamycin induced nephrotic rats. Lab Anim Sci Admin.
16:5–9. 1999.In Chinese.
|
|
16
|
Pereira Wde F, Brito-Melo GE, de Almeida
CA, Moreira LL, Cordeiro CW, Carvalho TG, Mateo EC, Simões E and
Silva AC: The experimental model of nephrotic syndrome induced by
Doxorubicin in rodents:An update. Inflamm Res. 64:287–301. 2015.
View Article : Google Scholar : PubMed/NCBI
|
|
17
|
Brainard GC, Richardson BA, King TS and
Reiter RJ: The influence of different light spectra on the
suppression of pineal melatonin content in the Syrian hamster.
Brain Res. 294:333–339. 1984. View Article : Google Scholar : PubMed/NCBI
|
|
18
|
Trinder P and Webster D: Determination of
HDL-cholesterol using 2,4,6-tribromo-3-hydroxybenzoic acid with a
commercial CHOD-PAP reagent. Ann Clin Biochem. 21:430–433. 1984.
View Article : Google Scholar : PubMed/NCBI
|
|
19
|
Friedewald WT, Levy RI and Fredrickson DS:
Estimation of the concentration of low-density lipoprotein
cholesterol in plasma, without use of the preparative
ultracentrifuge. Clin Chem. 18:499–502. 1972.PubMed/NCBI
|
|
20
|
Westgard JO and Poquette MA: Determination
of serum albumin with the 'SMA 1260' by a bromcresol green
dye-binding method. Clin Chem. 18:647–653. 1972.PubMed/NCBI
|
|
21
|
Fossati P, Prencipe L and Berti G: Enzymic
creatinine assay: A new colorimetric method based on hydrogen
peroxide measurement. Clin Chem. 29:1494–1496. 1983.PubMed/NCBI
|
|
22
|
Neeley WE: Simple automated determination
of serum or plasma glucose by a hexokinase-glucose-6-phosphate
dehydrogenase method. Clin Chem. 18:509–515. 1972.PubMed/NCBI
|
|
23
|
Livak KJ and Schmittgen TD: Analysis of
relative gene expression data using real-time quantitative PCR and
the 2(−Delta Delta C(T)) method. Methods. 25:402–408. 2001.
View Article : Google Scholar
|
|
24
|
Szklarczyk D, Franceschini A, Kuhn M,
Simonovic M, Roth A, Minguez P, Doerks T, Stark M, Muller J, Bork
P, et al: The STRING database in 2011: Functional interaction
networks of proteins, globally integrated and scored. Nucleic Acids
Res. 39:D561–D568. 2011. View Article : Google Scholar :
|
|
25
|
Huang da W, Sherman BT and Lempicki RA:
Bioinformatics enrichment tools: Paths toward the comprehensive
functional analysis of large gene lists. Nucleic Acids Res.
37:1–13. 2009. View Article : Google Scholar
|
|
26
|
Shannon P, Markiel A, Ozier O, Baliga NS,
Wang JT, Ramage D, Amin N, Schwikowski B and Ideker T: Cytoscape: A
software environment for integrated models of biomolecular
interaction networks. Genome Res. 13:2498–2504. 2003. View Article : Google Scholar : PubMed/NCBI
|
|
27
|
Walter W, Sánchez-Cabo F and Ricote M:
GOplot: An R package for visually combining expression data with
functional analysis. Bioinformatics. 31:2912–2914. 2015. View Article : Google Scholar : PubMed/NCBI
|
|
28
|
Paul T and Lemmer B: Disturbance of
circadian rhythms in analgosedated intensive care unit patients
with and without craniocerebral injury. Chronobiol Int. 24:45–61.
2007. View Article : Google Scholar : PubMed/NCBI
|
|
29
|
Palma-Rigo K, Baudrie V, Laude D, Petrel
C, Clauser E and Elghozi JL: Cardiovascular rhythms and cardiac
baroreflex sensitivity in AT(1A) receptor gain-of-function mutant
mice. Chronobiol Int. 27:128–137. 2010. View Article : Google Scholar : PubMed/NCBI
|
|
30
|
Lee VW and Harris DC: Adriamycin
nephropathy: A model of focal segmental glomerulosclerosis.
Nephrology (Carlton). 16:30–38. 2011. View Article : Google Scholar
|
|
31
|
Mamdani M, Williamson V, McMichael GO,
Blevins T, Aliev F, Adkins A, Hack L, Bigdeli T, van der Vaart AD,
Web BT, et al: Integrating mRNA and miRNA weighted gene
co-expression networks with eQTLs in the nucleus accumbens of
subjects with alcohol dependence. PLoS One. 10:e01376712015.
View Article : Google Scholar : PubMed/NCBI
|
|
32
|
Szklarczyk D, Morris JH, Cook H, Kuhn M,
Wyder S, Simonovic M, Santos A, Doncheva NT, Roth A, Bork P, et al:
The STRING database in 2017: Quality-controlled protein-protein
association networks, made broadly accessible. Nucleic Acids Res.
45:D362–D368. 2017. View Article : Google Scholar
|
|
33
|
Szklarczyk D, Franceschini A, Wyder S,
Forslund K, Heller D, Huerta-Cepas J, Simonovic M, Roth A, Santos
A, Tsafou KP, et al: STRING v10: Protein-protein interaction
networks, integrated over the tree of life. Nucleic Acids Res.
43(Database Issue): D447–D452. 2015. View Article : Google Scholar
|
|
34
|
Huang da W, Sherman BT and Lempicki RA:
Systematic and integrative analysis of large gene lists using DAVID
bioinformatics resources. Nat Protoc. 4:44–57. 2009. View Article : Google Scholar : PubMed/NCBI
|
|
35
|
Feng G, Shaw P, Rosen ST, Lin SM and Kibbe
WA: Using the bioconductor GeneAnswers package to interpret gene
lists. Methods Mol Biol. 802:101–112. 2012. View Article : Google Scholar
|
|
36
|
Wahl P, Ducasa GM and Fornoni A: Systemic
and renal lipids in kidney disease development and progression. Am
J Physiol Renal Physiol. 310:F433–F445. 2016. View Article : Google Scholar :
|
|
37
|
Rogacev KS, Pinsdorf T, Weingärtner O,
Gerhart MK, Welzel E, van Bentum K, Popp J, Menzner A, Fliser D,
Lütjohann D and Heine GH: Cholesterol synthesis, cholesterol
absorption, and mortality in hemodialysis patients. Clin J Am Soc
Nephrol. 7:943–948. 2012. View Article : Google Scholar : PubMed/NCBI
|
|
38
|
Kaysen GA: Nonrenal complications of the
nephrotic syndrome. Ann Rev Med. 45:201–210. 1994. View Article : Google Scholar : PubMed/NCBI
|
|
39
|
Schalk BW, Visser M, Deeg DJ and Bouter
LM: Lower levels of serum albumin and total cholesterol and future
decline in functional performance in older persons: The
Longitudinal Aging Study Amsterdam. AGE Ageing. 33:266–272. 2004.
View Article : Google Scholar : PubMed/NCBI
|
|
40
|
Lamia KA, Storch KF and Weitz CJ:
Physiological significance of a peripheral tissue circadian clock.
Proc Natl Acad Sci USA. 105:15172–15177. 2008. View Article : Google Scholar : PubMed/NCBI
|
|
41
|
Richards J, All S, Skopis G, Cheng KY,
Compton B, Srialluri N, Stow L, Jeffers LA and Gumz ML: Opposing
actions of Per1 and Cry2 in the regulation of Per1 target gene
expression in the liver and kidney. Am J Physiol Regul Integr Comp
Physiol. 305:R735–R747. 2013. View Article : Google Scholar : PubMed/NCBI
|
|
42
|
Chua EC, Shui G, Lee IT, Lau P, Tan LC,
Yeo SC, Lam BD, Bulchand S, Summers SA, Puvanendran K, et al:
Extensive diversity in circadian regulation of plasma lipids and
evidence for different circadian metabolic phenotypes in humans.
Proc Natl Acad Sci USA. 110:14468–14473. 2013. View Article : Google Scholar : PubMed/NCBI
|
|
43
|
Nikolaeva S, Pradervand S, Centeno G,
Zavadova V, Tokonami N, Maillard M, Bonny O and Firsov D: The
circadian clock modulates renal sodium handling. J Am Soc Nephrol.
23:1019–1026. 2012. View Article : Google Scholar : PubMed/NCBI
|
|
44
|
Hou XW, Jiang Y, Wang LF, Xu HY, Lin HM,
He XY, He JJ and Zhang S: Protective role of granulocyte
colony-stimulating factor against adriamycin induced cardiac, renal
and hepatic toxicities. Toxicol Lett. 187:40–44. 2009. View Article : Google Scholar : PubMed/NCBI
|
|
45
|
Bertani T, Cutillo F, Zoja C, Broggini M
and Remuzzi G: Tubulo-interstitial lesions mediate renal damage in
adriamycin glomerulopathy. Kidney Int. 30:488–496. 1986. View Article : Google Scholar : PubMed/NCBI
|
|
46
|
Pippin JW, Brinkkoetter PT, Cormack-Aboud
FC, Durvasula RV, Hauser PV, Kowalewska J, Krofft RD, Logar CM,
Marshall CB, Ohse T and Shankland SJ: Inducible rodent models of
acquired podocyte diseases. Am J Physiol Renal Physiol.
296:F213–F229. 2009. View Article : Google Scholar
|
|
47
|
Rudic RD, McNamara P, Curtis AM, Boston
RC, Panda S, Hogenesch JB and Fitzgerald GA: BMAL1 and CLOCK, two
essential components of the circadian clock, are involved in
glucose homeostasis. PLoS Biol. 2:e3772004. View Article : Google Scholar : PubMed/NCBI
|
|
48
|
Rivera-Coll A, Fuentes-Arderiu X and
Diez-Noguera A: Circadian rhythmic variations in serum
concentrations of clinically important lipids. Clin Chem.
40:1549–1553. 1994.PubMed/NCBI
|
|
49
|
Van den Berg R, Noordam R, Kooijman S,
Jansen SWM, Akintola AA, Slagboom PE, Pijl H, Rensen PCN, Biermasz
NR and van Heemst D: Familial longevity is characterized by high
circadian rhythmicity of serum cholesterol in healthy elderly
individuals. Aging cell. 16:237–243. 2017. View Article : Google Scholar : PubMed/NCBI
|
|
50
|
Fonken LK, Aubrecht TG, Meléndez-Fernández
OH, Weil ZM and Nelson RJ: Dim light at night disrupts molecular
circadian rhythms and increases body weight. J Biol Rhythms.
28:262–271. 2013. View Article : Google Scholar : PubMed/NCBI
|
|
51
|
Baeza-Raja B, Eckel-Mahan K, Zhang L,
Vagena E, Tsigelny IF, Sassone-Corsi P, Ptácek LJ and Akassoglou K:
p75 neurotrophin receptor is a clock gene that regulates
oscillatory components of circadian and metabolic networks. J
Neurosci. 33:10221–10234. 2013. View Article : Google Scholar : PubMed/NCBI
|
|
52
|
Honma S, Kawamoto T, Takagi Y, Fujimoto K,
Sato F, Noshiro M, Kato Y and Honma K: Dec1 and Dec2 are regulators
of the mammalian molecular clock. Nature. 419:841–844. 2002.
View Article : Google Scholar : PubMed/NCBI
|
|
53
|
Kato Y, Kawamoto T, Fujimoto K and Noshiro
M: DEC1/STRA13/SHARP2 and DEC2/SHARP1 coordinate physiological
processes, including circadian rhythms in response to environmental
stimuli. Curr Top Dev Biol. 110:339–372. 2014. View Article : Google Scholar : PubMed/NCBI
|
|
54
|
Edwards PA, Kast HR and Anisfeld AM:
BAREing it all: The adoption of LXR and FXR and their roles in
lipid homeostasis. J Lipid Res. 43:2–12. 2002.PubMed/NCBI
|
|
55
|
Bodzioch M, Orsó E, Klucken J, Langmann T,
Böttcher A, Diederich W, Drobnik W, Barlage S, Büchler C,
Porsch-Ozcürümez M, et al: The gene encoding ATP-binding cassette
transporter 1 is mutated in Tangier disease. Nat Genet. 22:347–351.
1999. View Article : Google Scholar : PubMed/NCBI
|
|
56
|
Bossi P, Bergamini C, Siano M, Cossu Rocca
M, Sponghini AP, Favales F, Giannoccaro M, Marchesi E, Cortelazzi
B, Perrone F, et al: Functional genomics uncover the biology behind
the responsiveness of head and neck squamous cell cancer patients
to cetuximab. Clin Cancer Res. 22:3961–3970. 2016. View Article : Google Scholar : PubMed/NCBI
|
|
57
|
D'Amato G, Luxán G, del Monte-Nieto G,
Martínez-Poveda B, Torroja C, Walter W, Bochter MS, Benedito R,
Cole S, Martinez F, et al: Sequential Notch activation regulates
ventricular chamber development. Nat Cell Biol. 18:7–20. 2016.
View Article : Google Scholar :
|
|
58
|
Boerwinkle E, Menzel HJ, Kraft HG and
Utermann G: Genetics of the quantitative Lp(a) lipoprotein trait.
III. Contribution of Lp(a) glycoprotein phenotypes to normal lipid
variation. Hum Genet. 82:73–78. 1989. View Article : Google Scholar : PubMed/NCBI
|