Introduction
Autism spectrum disorder (ASD) describes a range of
conditions classified as neuronal developmental disorders,
including autism, Asperger's syndrome, childhood disintegrative
disorder and pervasive developmental disorder. Features of these
disorders include social deficits and communication difficulties,
stereotyped or repetitive behaviors and interests, sensory issues
and in certain cases, cognitive delays (1). While the specific causes of autism
spectrum disorders have yet to be identified, it is believed that
genetic mutations may be the most significant factor affecting its
pathogenesis (2). Other risk
factors include prenatal factors, perinatal factors,
neuroanatomical abnormalities and certain environmental factors
(3–5). While it has been possible to
identify general risk factors, it has been more difficult to
elucidate specific factors. At present, the prediction of ASD may
only be of a global nature in terms of using genetic biomarkers,
and therefore requires the use of general markers (6).
There has been an increasing number of articles in
the previous decade describing hundreds of genes/proteins
associated with ASD, a number of which were suggested as potential
disease biomarkers, including interleukin (IL)-6, IL-18,
brain-derived neurotrophic factor and RAR related orphan receptor A
(7–9). Additionally, several genes [arginine
vasopressin (AVP), oxytocin neurophysin 1 prepropeptide (OXT) and
insulin-like growth factor 1] have been studied in clinical trials
(nos. NCT01093768 and NCT01962870) (10,11). In addition, a number of articles
have described genetic changes and alterations in gene expression
associated with ASD (12,13). Increased and decreased gene
expression levels/activities have been observed (14–16). Multiple genes have also been
suggested to affect the pathogenic development of ASD via unknown
mechanisms (17,18). A number of studies have suggested
a direct functional association between specific gene mutations and
ASD. For example, Clipperton-Allen and Page (19) identified that mutations in
phosphatase and tensin homolog (PTEN)-encoding negative regulators
of the phosphoinositide 3-kinase/protein kinase B/mechanistic
target of rapamycin pathway were markedly associated with ASD
(19).
Nevertheless, to the best of our knowledge, no
systematic analysis has evaluated the quality and strength of the
evidence of these specific genes as a functional network/group
underlying the overall biological processes dysregulated in ASD.
The present study, instead of focusing on one or two specific
genes, aimed to provide a complete description of the genetic map
of ASD using a comprehensive literature data-mining review,
followed by gene set enrichment analysis (GSEA) and a sub-network
enrichment analysis (SNEA) to study the underlying functional
profile of the genes identified. We hypothesize that the majority,
if not all, of these previously identified genes serve significant
roles in the development of ASD, and that the major pathways/gene
sets enriched by these genes are those most likely to be
functionally associated with the disease.
Materials and methods
The workflow of the present study was as follows: i)
Literature data-mining to discover gene-ASD relations; ii)
enrichment analysis on the identified genes to study their
pathogenic significance in ASD; iii) network connectivity analysis
(NCA) was used to test for direct functional association between
the top identified genes. A genetic database (ASD_GD) has been
developed and deposited into an open source 'Bioinformatics
Database' (http://database.gousinfo.com). The publicly
downloadable version of the database is available at http://gousinfo.com/database/Data_Genetic/ASD_GD.xlsx.
The database includes 488 genes with metric scores, 97 pathways and
93 diseases that were associated with ASD. The 97 pathways were
identified through a GSEA approach using the ASD target genes as
input against the Gene Ontology (GO) and Pathway Studio Ontology.
The 93 diseases were identified using a SNEA process. Both the GSEA
and SNEA were conducted using Pathway Studio, where the enrichment
P-values and Jaccard similarity (Js) were
provided in the analysis results. For each ASD-gene association,
there was information regarding the supporting references,
including titles and specific sentences where the association had
been identified. For more information regarding the database,
please refer to 'ASD_GD→Database Note' (http://gousinfo.com/database/Data_Genetic/ASD_GD.xlsx),
where the subsequent update information is also included.
Literature data mining and article
selection criteria
In the present study, a literature data-mining
analysis was performed for all articles describing gene-ASD
associations available in the Pathway Studio database (www.pathwaystudio.com) updated until April 2016. The
Pathway Studio database contains over 6.1 M unique associations
supported by ≥35 million references. The literature data-mining
analysis was conducted using Elsevier's proprietary MedScan natural
language processing (NLP) system of the Pathway Studio software as
described previously (20), in
which essential facts are extracted according to predefined fact
types in the form of information triplets (subject-verb-object).
Domain ontologies are developed in order to identify types,
properties and inter-associations of relevant entities in the
biomedical literature (21). The
data extracted included information on proteins/genes, small
molecules, cell types and diseases represented as entities, and
their interactions were defined by association types including
binding, regulation and expression. The result was a database of
genomic and proteomic information, with a specific focus on how the
proteins, cell processes and small molecules interact, modify and
regulate each other in pathways and networks. Search results were
obtained from the Pathway Studio database (www.Pathwaystudio.com), including a full list of gene
names, the types of associations and the bibliographic information
of the supporting articles; for example, the titles and specific
sentences where the associations had been identified, allowing for
the calculation of the article metric scores described
subsequently.
Literature metrics analysis
For literature metrics analysis, three 'weights' for
each article and two scores for each gene-disease association were
proposed.
Definition of three weights for an
article
The quality weight (QW). The QW of an article was
defined as Eq. 1.
QW=e−βx[publication age(PubAge)−1]
where PubAge=current date - publication date +1 years; β=0.23, such
that QW=1 for literature published in a current year and QW=0.1 if
it was published 10 years previously.
The Citation Weight (CW). The CW of a reference was
defined as Eq. 2.
CW=sin(θ′)=β×Ncite/√(β×Ncite)2+PubAge2=β×citation ration(CR)/√β2CR2+1
where the CR=number of citations/PubAge. β was set to control the
initial values of CW. β=1/√3, so that CW=0.5 when CR=1
(Ncite = PubAge).
The Novelty Weight (NW). The NW of a reference was
defined as Eq. 3, where;
NW=0or1(0:PubAge>AgeNovel;1:otherwise)
The Novelty Age threshold was specified by AgeNovel
in Eq. 3. This represented the maximum age for all references in
order for that association to be considered novel. In this study,
we set AgeNovel=1 to surface only these identified in the current
year as novel markers.
Quality Score (QScore) for a gene-disease
association
The QScore for a literature-based gene-disease
association was defined as Eq. 4, where:
QScore=sum(CWi+QWi)/2,i=1,2,…,n
where CWi and QWi are the weights for the
reference i (i=1,2, etc.), and n represents the total number of
references supporting an association.
The Novelty Score (NScore) was defined as Eq. 5,
where:
NScore=[sum(CWi+NWi)]*[NW1*NW2*…NWn],i=1,2,…n
where n represents the total number of references supporting a
gene-disease association, and CWi and QWi are
the weights for the 'ith' reference.
GSEA
To fully elucidate the underlying functional profile
and the pathogenic significance of the identified genes, GSEA and
SNEA were performed as described previously (22) on the entire gene list (n=488
genes).
Pathway enrichment analysis
When considering a disease associated with a number
of genetic pathways, the gene-wise Enrichment Score (EScore) for
the gene k (k=1,2,3, etc.) within a gene set was defined as Eq. 6
where;
EScore=sum[−log10(pValuei)]/max[−log10(pValuei)],i=1,2,…,n
where 'P-valuei' is the enrichment score of the
'ith' pathway within the gene set, 'n' represents the
total number of pathways and 'm' represents the number of pathways
including the 'kth' gene.
Results
Summary of literature data mining
analysis
In the present study, a literature data-mining
analysis of 2,064 articles was performed and identified a total of
488 genes directly associated with ASD in the scientific
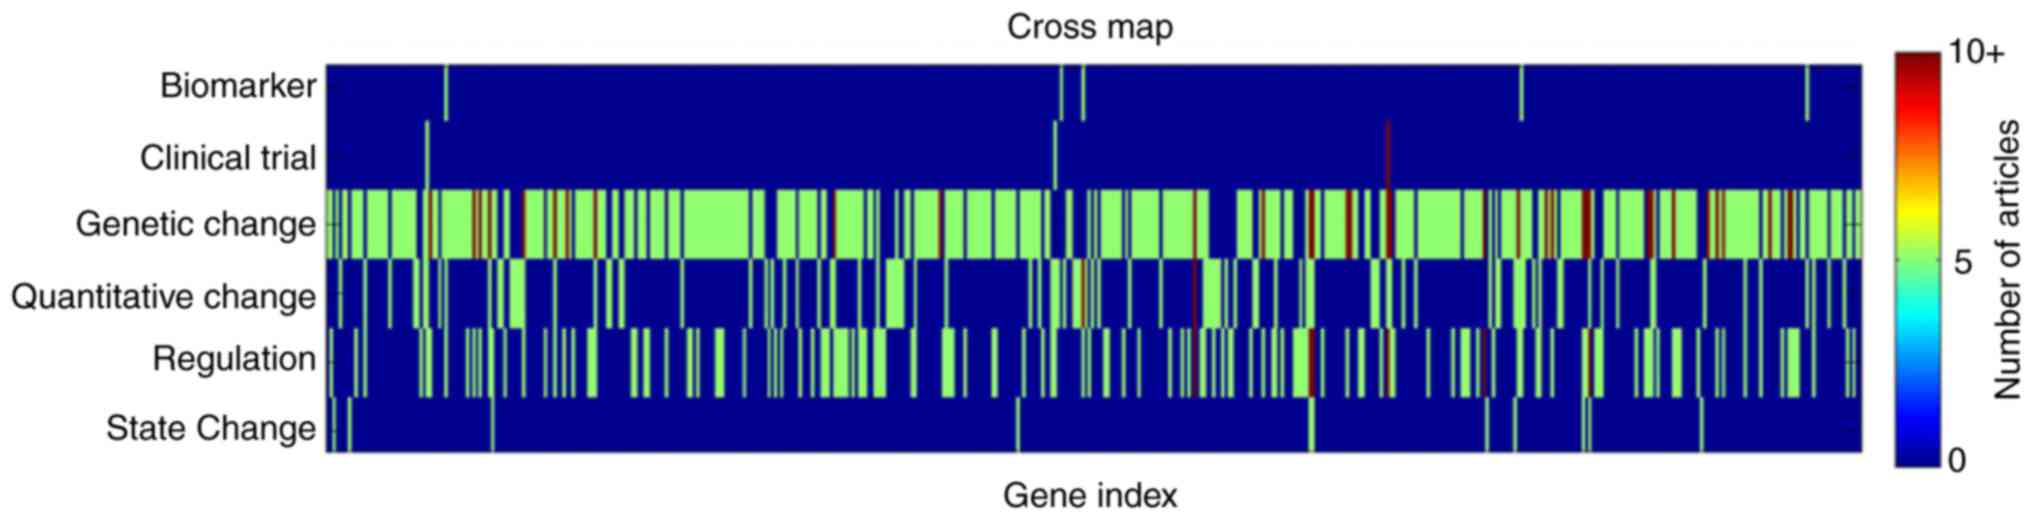
literature. According to the categories of gene-ASD associations,
the 2,064 articles were identified in 6 different classes: i)
Biomarker (0.3%); ii) Clinical Trial (0.5%); iii) Genetic Change
(78%); iv) Quantitative Change (6.6%); v) Regulation (14.2%); and,
vi) State Change (0.4%). Overall, for the 488 genes, 0.8% were
demonstrated to have a 'Biomarker' association with the disease,
0.5% genes with 'Clinical Trial', 59.2% with 'Genetic Change',
15.9% with 'Quantitative Change', 22% with 'Regulation' and 1.7%
with 'State Change'. One gene may present multiple associations
with ASD. An example of this was identified for the AVP gene, which
was identified in four separate association types: 'Genetic
Change'; 'Quantitative Change'; 'Clinical Trial'; and 'Regulation'.
A full list of genes and supported associations may be located in
the 'ASD_GD-Ref for Related Genes' database.
Altogether, 23.7% genes were demonstrated to have
multiple associations with ALS. Specifically, 76.3% genes presented
1 type of association, 17.4% with 2, 4.9% with 3 and 1.4% with 4,
as indicated in Figs. 1 and
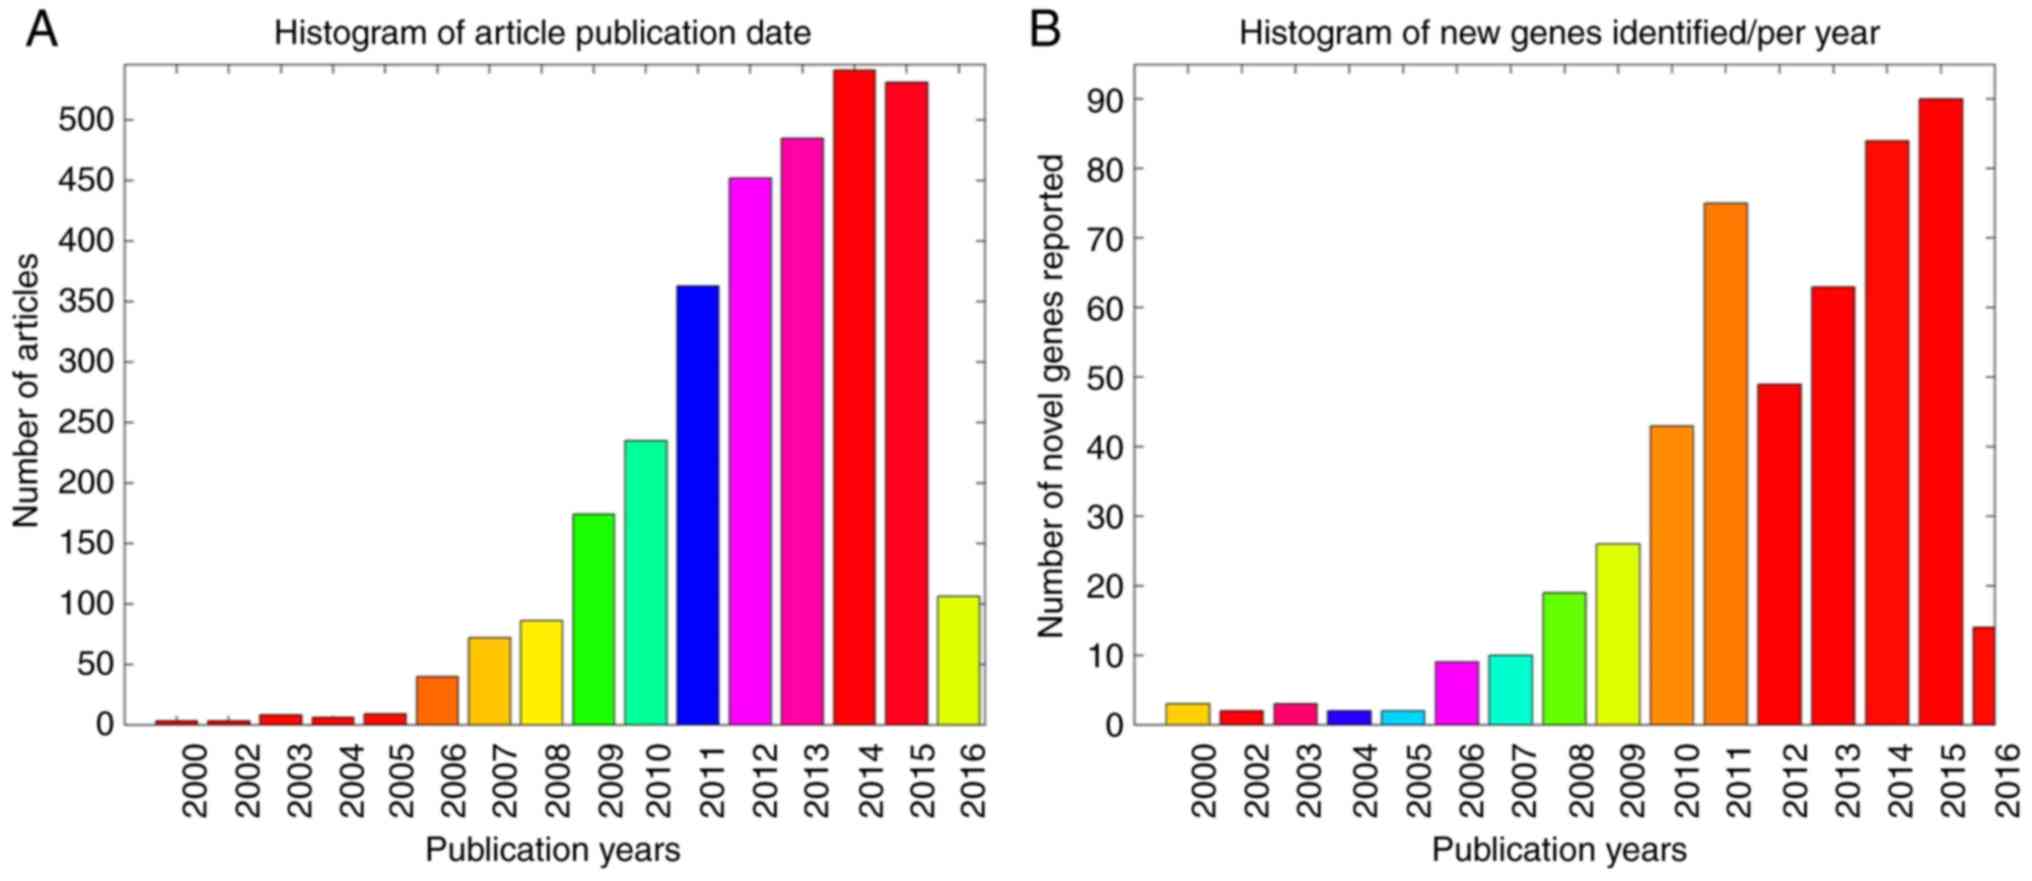
2A demonstrates the publication
date distribution of the 2,064 articles, including literature data
from the previous 16 years (2000–2016), with the number of novel
genes identified each year presented in Fig. 2B. Notably, the ASD-associated
articles had an average PubAge of only 3.6 years. In the present
study, the PubAge was defined as: Current year-publication date +1
year. In addition, a significant increase in the total number of
publications was observed in the past 10 years, particularly in the
period subsequent to 2012, with the highest number of novel genes
identified during this time period (Fig. 2B).
Literature metric scores and
rankings
Table I summarizes
the top 14 genes of the entire set of gene-disease associations for
ASD by QScore. The NScore for these genes was 0 as, in every case,
the age of their oldest publication exceeded the calculated
threshold for novelty (set at 1 year). As expected, the QScore for
these genes was similar to their number of associated references,
indicating that the relations supported by a large number of
references were less likely to be affected overall by variations in
aggregate PubAge or by the cumulative citation numbers of the
underlying articles. In other words, a high reference number was
the primary driver for higher QScores, suggesting that QScores may
be the most useful indicator for distinguishing associations at the
low end of the reference distribution, where the factors of age and
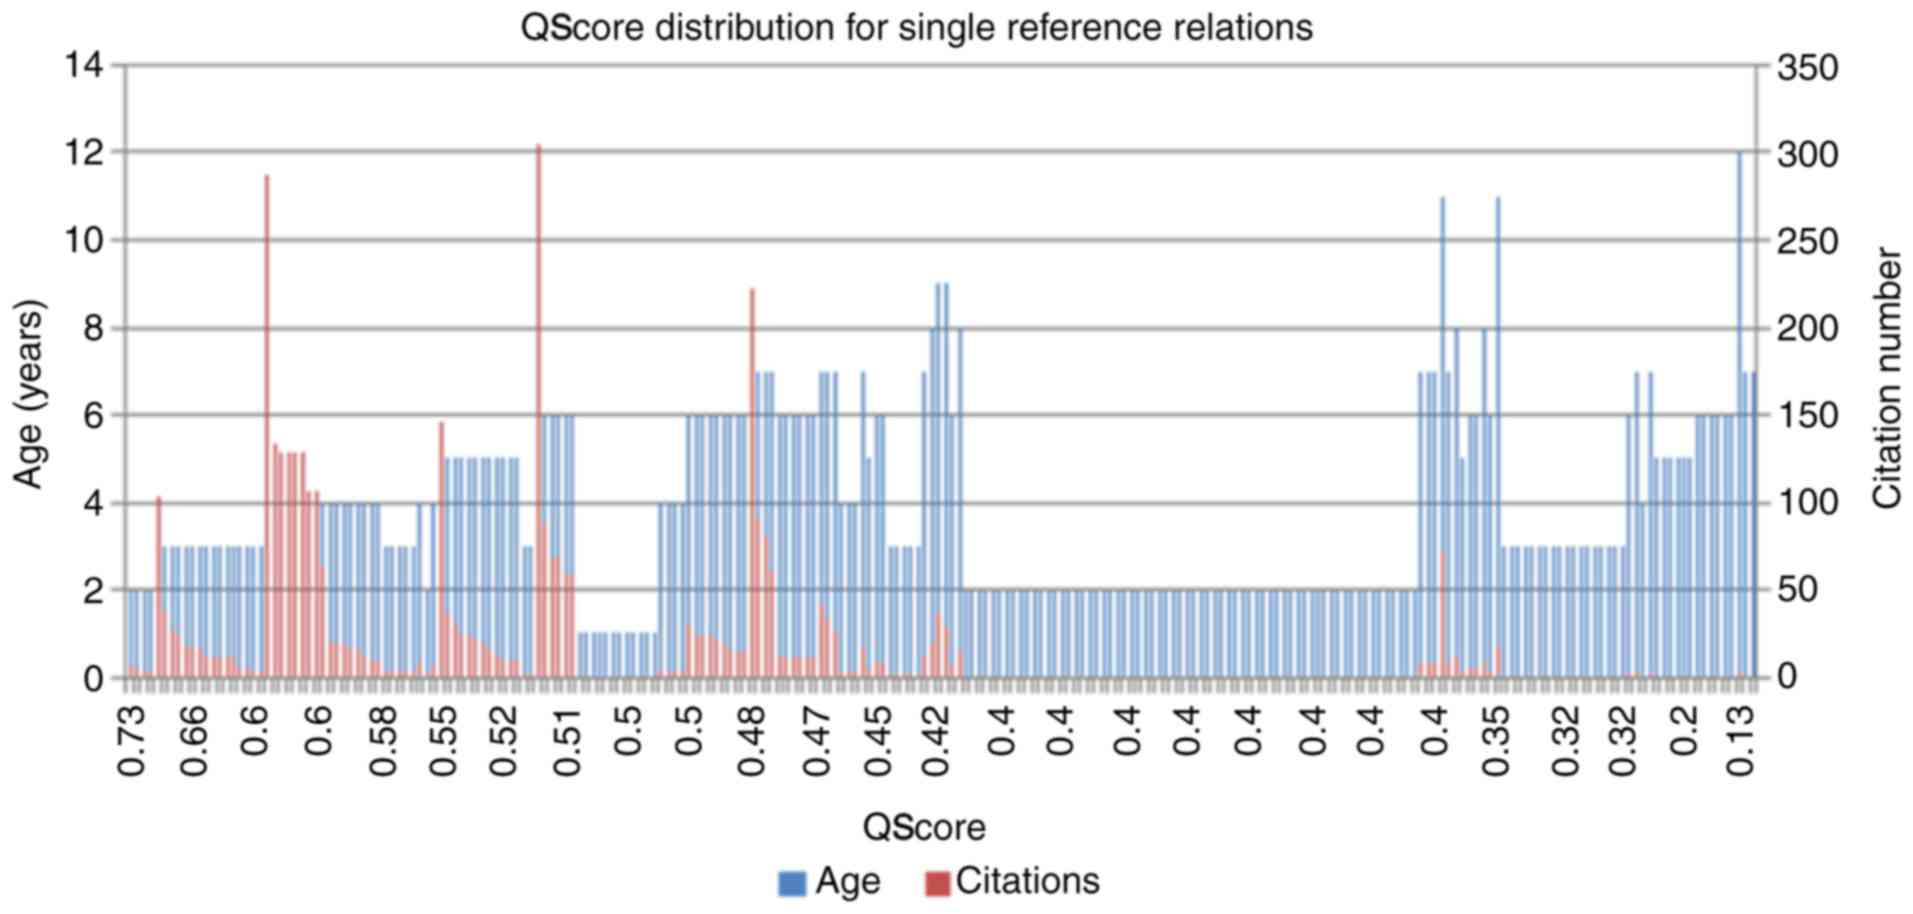
CW will be able to provide additional discriminatory power. An
example of this is provided in Fig.
3, which indicates the distribution of the PubAge and the
citation number compared with the calculated QScores for all single
reference associations among the ASD literature-associated genes.
The single reference genes comprise almost one-half of all the
ASD-associated genes (236/488 × 100=48%), and therefore it Is
important and useful to provide a method for identifying the
strongest candidate genes in this group. As observed in Fig. 3, the association presenting the
highest QScores were these supported by a high-number of references
with a strong number of citation and recent publication dates.
Older publications with fewer citations were correspondingly
penalized by this method and produced lower relative QScores. The
apparent absence of demonstrated reproducibility for the
associations within this group, for example, they remained single
reference associations over a longer period of time, suggests that
these associations should be analyzed with caution, prior to their
acceptance as fully reliable.
 | Table ITop 14 genes selected by QScore. |
Table I
Top 14 genes selected by QScore.
| Gene symbol | QScore | NScore | Citation
number | RefNum | Age, years | EScore | Number of
pathways |
|---|
| SHANK3 | 80.0 | 0 | 5,397 | 139 | 10 | 320.5 | 18 |
| MECP2 | 72.6 | 0 | 5,320 | 108 | 15 | 325.9 | 22 |
| PTEN | 64.9 | 0 | 4,268 | 100 | 12 | 432.4 | 28 |
| NLGN3 | 52.4 | 0 | 3,200 | 74 | 14 | 249.6 | 18 |
| NLGN4X | 45.6 | 0 | 2,655 | 61 | 14 | 255.2 | 14 |
| OXT | 44.4 | 0 | 3,920 | 88 | 14 | 161.7 | 10 |
| OXTR | 42.1 | 0 | 3,631 | 64 | 9 | 194.8 | 11 |
| NRXN1 | 39.3 | 0 | 2,624 | 63 | 9 | 312.8 | 20 |
| SHANK2 | 34.4 | 0 | 1,784 | 61 | 8 | 303 | 15 |
| CNTNAP2 | 33.5 | 0 | 2,460 | 53 | 9 | 220.3 | 12 |
| SLC6A4 | 17.9 | 0 | 742 | 30 | 13 | 204.9 | 11 |
| TSC2 | 17.9 | 0 | 1,723 | 27 | 13 | 183.7 | 13 |
| TSC1 | 16.4 | 0 | 1,715 | 20 | 11 | 47.1 | 4 |
| CD38 | 14.7 | 0 | 713 | 22 | 7 | 82 | 5 |
On the other hand, NScores provided a useful method
for evaluating the most recently observed gene-disease
associations. While in practice, the user is able to set the
Novelty Age threshold, which represented the maximum age for all
references in order for that association to be considered novel, to
any number of years desired. In the present study, the most
stringent threshold of 1 year was used; therefore, only
associations with publications in 2016 were selected and this
resulted in the identification of a total of 14 novel genes
(Table II). Table II also presents the QScore for
each of these 14 genes The genes for cytochrome P450 family 2
subfamily D member 6 (CYP2D6) and E1A binding protein P300 (EP300)
exhibited the two highest NScores, as a result of the number of
references supporting the relation between these two genes and ASD
(4 and 3 references for CYP2D6 and EP300, respectively), indicating
that they should be prioritized among the novel candidate genes
identified for future study. Notably, EP300 exhibited a
considerably higher EScore and participated in a greater number of
ASD-associated pathways compared with CYP2D6, indicating a greater
concordance, at least at the level of pathway involvement, with
previously studied ASD genes and proteins. This may also indicate
that CYP2D6 is representative of a novel mechanism not previously
studied in association with ASD. Other high Escore candidates among
the novel genes included tumor protein 53 (TP53),
5-hydroxytriptamine receptor 3A (HTR3A) and caspase (CASP1).
| Table IITop 14 genes selected by NScore. |
Table II
Top 14 genes selected by NScore.
| Gene symbol | QScore | NScore | Citation
number | RefNum | Marker age | EScore | Number of
pathways |
|---|
| CYP2D6 | 2 | 4 | 0 | 4 | 1 | 9.1 | 1 |
| EP300 | 1.5 | 3 | 0 | 3 | 1 | 189.3 | 13 |
| UNC80 | 0.5 | 1 | 0 | 1 | 1 | 5.6 | 1 |
| TP53 | 0.5 | 1 | 0 | 1 | 1 | 126 | 12 |
| SLC9A6 | 0.5 | 1 | 0 | 1 | 1 | 69 | 3 |
| SETD1A | 0.5 | 1 | 0 | 1 | 1 | 0 | 0 |
| PIK3CD | 0.5 | 1 | 0 | 1 | 1 | 0 | 0 |
| NFE2L2 | 0.5 | 1 | 0 | 1 | 1 | 15.9 | 2 |
| IL18 | 0.5 | 1 | 0 | 1 | 1 | 52.1 | 6 |
| HTR3A | 0.5 | 1 | 0 | 1 | 1 | 182.5 | 9 |
| CX3CR1 | 0.5 | 1 | 0 | 1 | 1 | 64.5 | 4 |
| CUX1 | 0.5 | 1 | 0 | 1 | 1 | 0 | 0 |
| CASP1 | 0.5 | 1 | 0 | 1 | 1 | 148.1 | 9 |
| CAPRIN1 | 0.5 | 1 | 0 | 1 | 1 | 38.1 | 1 |
Enrichment analysis
The full list of 97 pathways/gene sets enriched with
a minimum P<1E-8 (391 unique genes) is available in the
'ASD_GD-Related Pathways' database, where 58 pathways/gene sets are
demonstrated to be enriched with P<1×10⁻¹⁰ (364
unique genes), and 16 were enriched with P<1×10⁻²⁰
(272 unique genes).
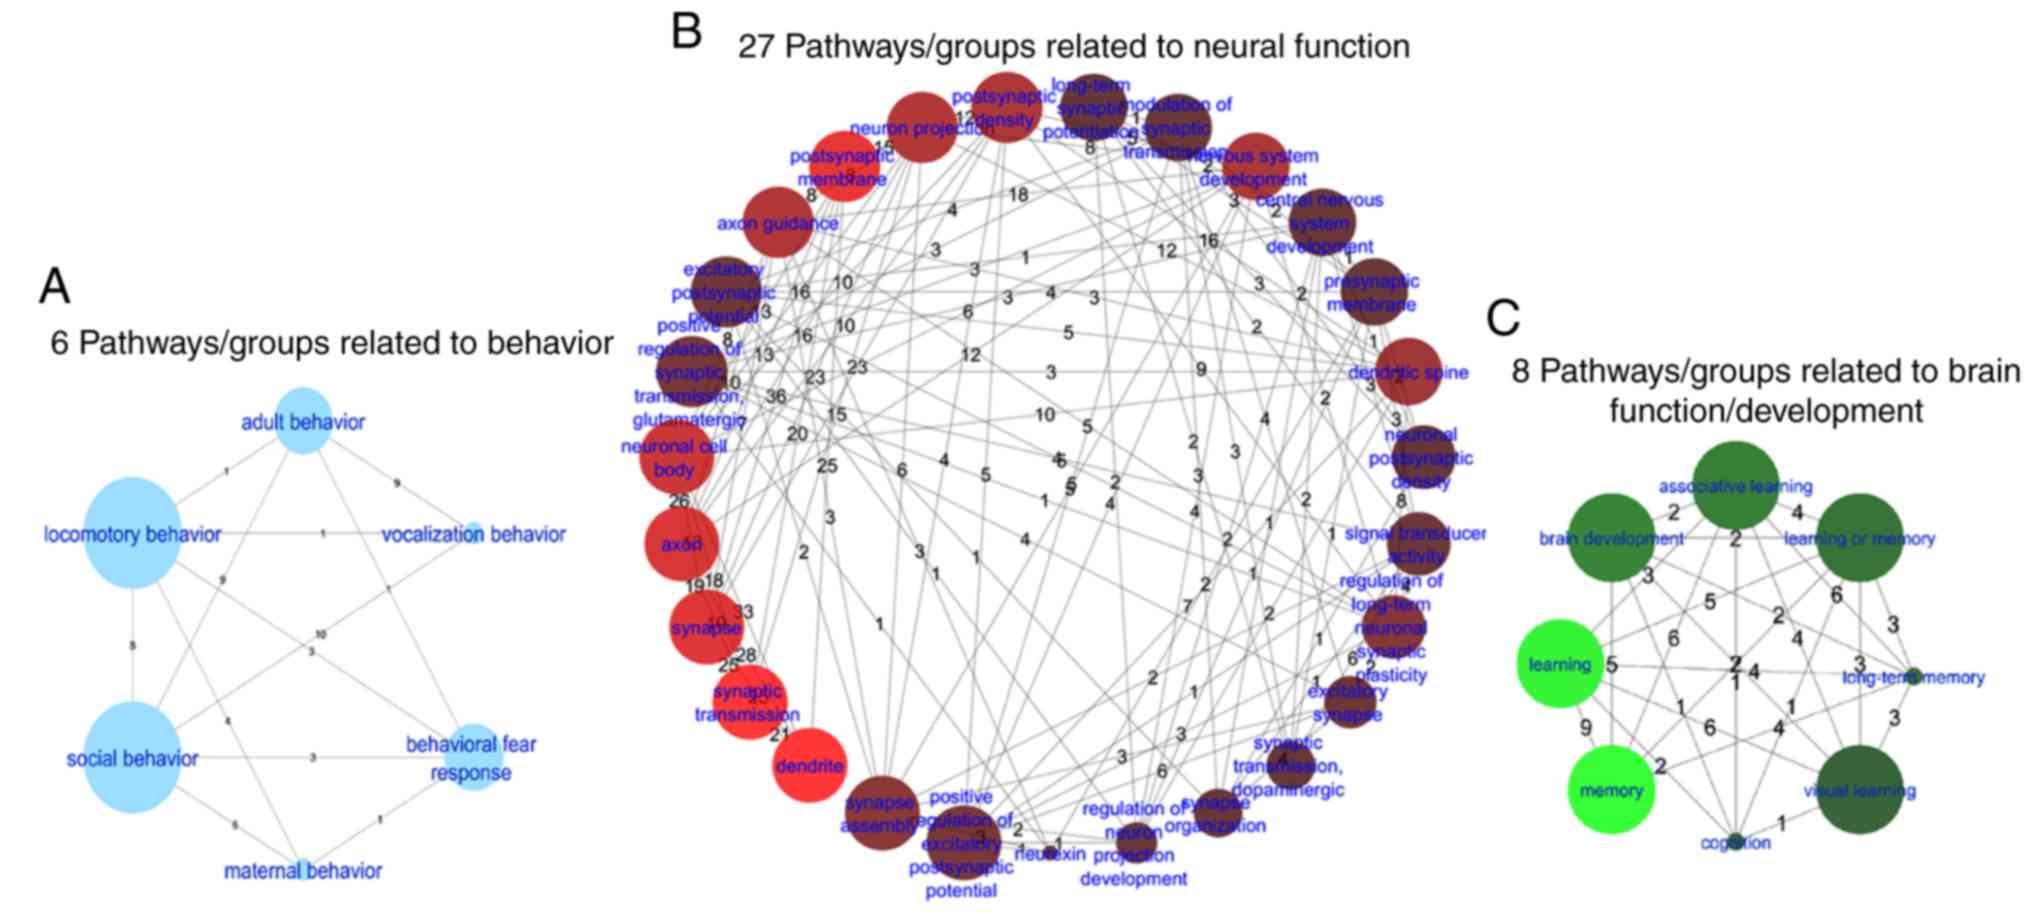
Among the 97 pathways/gene sets enriched, 27
pathways/gene sets that were directly associated with neural
function (260 unique genes), 8 with brain function/development (103
unique genes) and 6 with behavior (112 unique genes) were
determined (Fig. 4). In addition,
a single gene ontology (GO) term associated with aging (30 unique
genes; Q<7.) was identified. The top 10 pathways/groups enriched
by all genes with P<1.0×10⁻²⁵ (221 unique genes) are
summarized in Table III. The
Jaccard similarity (Js) statistic is an
alternative method for comparing the similarity and diversity of
sample sets.
| Table IIITop 10 pathways/groups enriched for
all autism spectrum disorder-associated genes. |
Table III
Top 10 pathways/groups enriched for
all autism spectrum disorder-associated genes.
| Name | Gene ontology
ID | Number of
entities | Number of
overlapping genes | P-value | Q-value | Jaccard
similarity |
|---|
| Dendrite | 0030425 | 396 | 68 |
5.72×10−40 |
1.91×10−37 | 0.081 |
| Synaptic
transmission | 0007268 | 472 | 72 |
1.18×10−37 |
2.95×10⁻³⁵ | 0.079 |
| Response to
drug | 0017035 | 509 | 74 |
3.02×10−37 |
6.04×10⁻³⁵ | 0.078 |
| Postsynaptic
membrane | 0045211 | 227 | 49 |
8.27×10⁻³⁴ |
1.38×10⁻³¹ | 0.071 |
| Synapse | 0045202 | 466 | 65 |
1.36×10⁻³² |
1.95×10⁻³⁰ | 0.072 |
| Axon | 0030424 | 318 | 54 |
1.5×10⁻³¹ |
1.87×10⁻²⁹ | 0.07 |
| Social
behavior | 0035176 | 52 | 27 |
1.34×10⁻³⁰ |
1.49×10⁻²⁸ | 0.051 |
| Neuronal cell
body | 0043025 | 466 | 61 |
4.77×10⁻²⁹ |
4.34×10⁻²⁷ | 0.067 |
| Memory | 0007613 | 76 | 29 |
7.07×10⁻²⁸ |
5.89×10⁻²⁶ | 0.052 |
| Response to organic
cyclic compound | 0014070 | 253 | 46 |
1.28×10⁻²⁷ |
9.86×10⁻²⁶ | 0.064 |
In addition to GSEA, a SNEA was performed. SNEA, an
extension of GSEA, constructs gene sets using the global network of
protein-disease regulation as represented in the Pathway Studio
database (23). The proteins
linked to the diseases identified by GAEA presented significant
overlap with the 488 ASD target genes. In the present study,
enrichments were calculated using diseases as the gene set seeds
for this specific group of genes/proteins, for the purpose of
identifying patterns of pathogenic significance to other disorders
potentially associated with ASD. The complete list of results is
provided in the 'ASD_GD-Related Diseases' database. Table IV presents the top 10
disease-associated sub-networks enriched with a minimum P
<1×10−80.
| Table IVTop 10 disease sub-networks enriched
for all autism spectrum disorder-associated genes. |
Table IV
Top 10 disease sub-networks enriched
for all autism spectrum disorder-associated genes.
| Gene set seed | Total number of
neighbors | Overlap | P-value | Jaccard
similarity |
|---|
| Schizophrenia | 1,230 | 234 |
1.6×10−176 | 0.16 |
| Epilepsy | 756 | 164 |
1.1×10−127 | 0.15 |
| Intellectual
disability | 821 | 166 |
4.9×10−124 | 0.15 |
| Seizures | 832 | 164 |
1.7×10−120 | 0.14 |
| Cognitive
impairment | 409 | 126 |
3.6×10−117 | 0.17 |
| Bipolar
disorder | 490 | 124 |
2.2×10−103 | 0.15 |
| Depressive
disorder, major | 439 | 115 |
2.1×10−97 | 0.14 |
| Alzheimer
disease | 1,312 | 169 |
3.6×10−93 | 0.1 |
| Cognition
disorders | 322 | 95 |
2.8×10−85 | 0.13 |
| Anxiety | 379 | 99 |
3.5×10−83 | 0.13 |
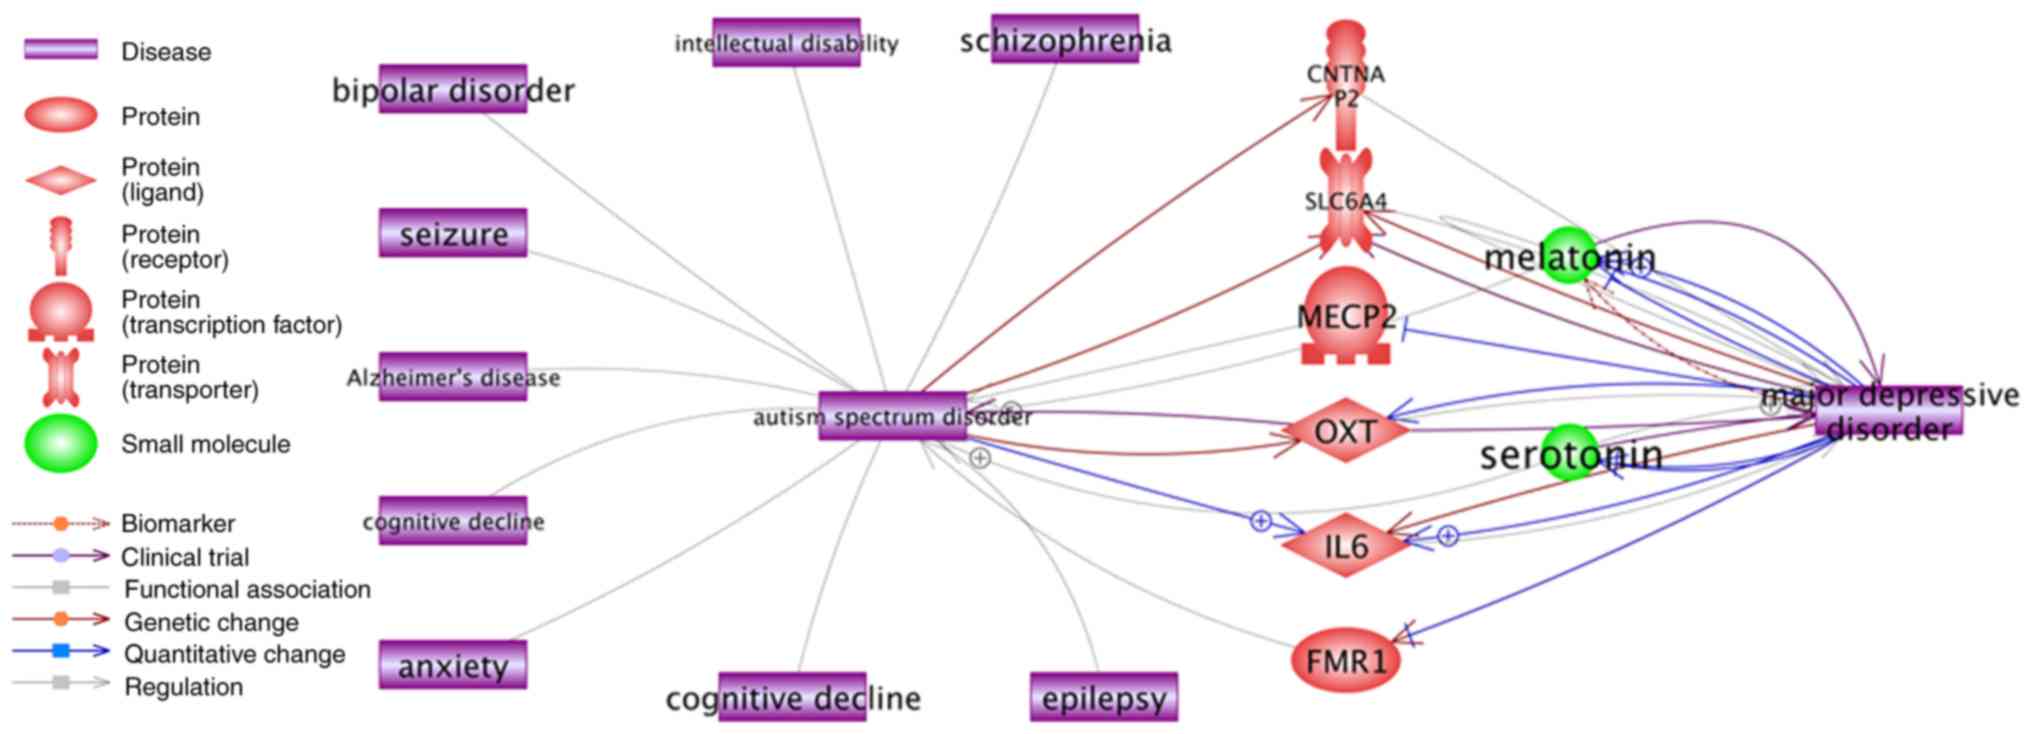
From Table IV, it
was observed that a number of the established ASD-associated genes
were also identified as highly significant (as a subgroup) in other
mental health-associated diseases, with a large percentage of
overlap (Jaccard similarity ≥0.1). A direct functional association
for 9 of the 10 enriched disease types was also identified in the
Pathway Studio literature database between these mental disorders
and ASD (Fig. 5). Notably,
although there was no direct association between ASD and Major
depressive disorder, indirect associations were readily
demonstrated through certain high QScore ASD genes including methyl
CpG-binding protein 2 (MECP2) (QScore=71.4), OXT (QScore=42.1), and
contactin associated protein-like 2 (QScore=35.3).
Prioritizing new literature information
using NScores
One of the challenges in evaluating previous
gene-disease associations in the literature is the ability to
rapidly sort through information to identify the most notable,
reliable and informative additions to previously studied and
accepted observations. As previously stated, a high QScore ranking
may provide a rapid and considered sense of the most reliable data,
primarily in terms of multiple reference support, but also
secondarily by the aggregate PubAge and CW.
Conversely, observations that are supported by a
limited number of references (almost one-half of the ASD-associated
genes in the present study were supported by a single reference)
were ranked conveniently by PubAge and CW (Eq. 5). Unique cases
arise when the association is so novel, as demonstrated by the
genes/proteins in Table II, that
citation data is not necessarily available, leaving only the
criterion of the number of references to evaluate the relevance of
a gene/protein-centered disease association. This functions to
highlight associations that already have multiple source articles,
as previously identified for EP300 and CYP2D6, but does not address
the majority of novel gene associations supported by only a single
reference. A way to evaluate these novel associations, in the
absence of other literature metric data, may be to map them to the
pathways domain already defined by the hundreds of higher QScore
genes/proteins. This information was generated using all the
genes/proteins demonstrating associations with ASD, as summarized
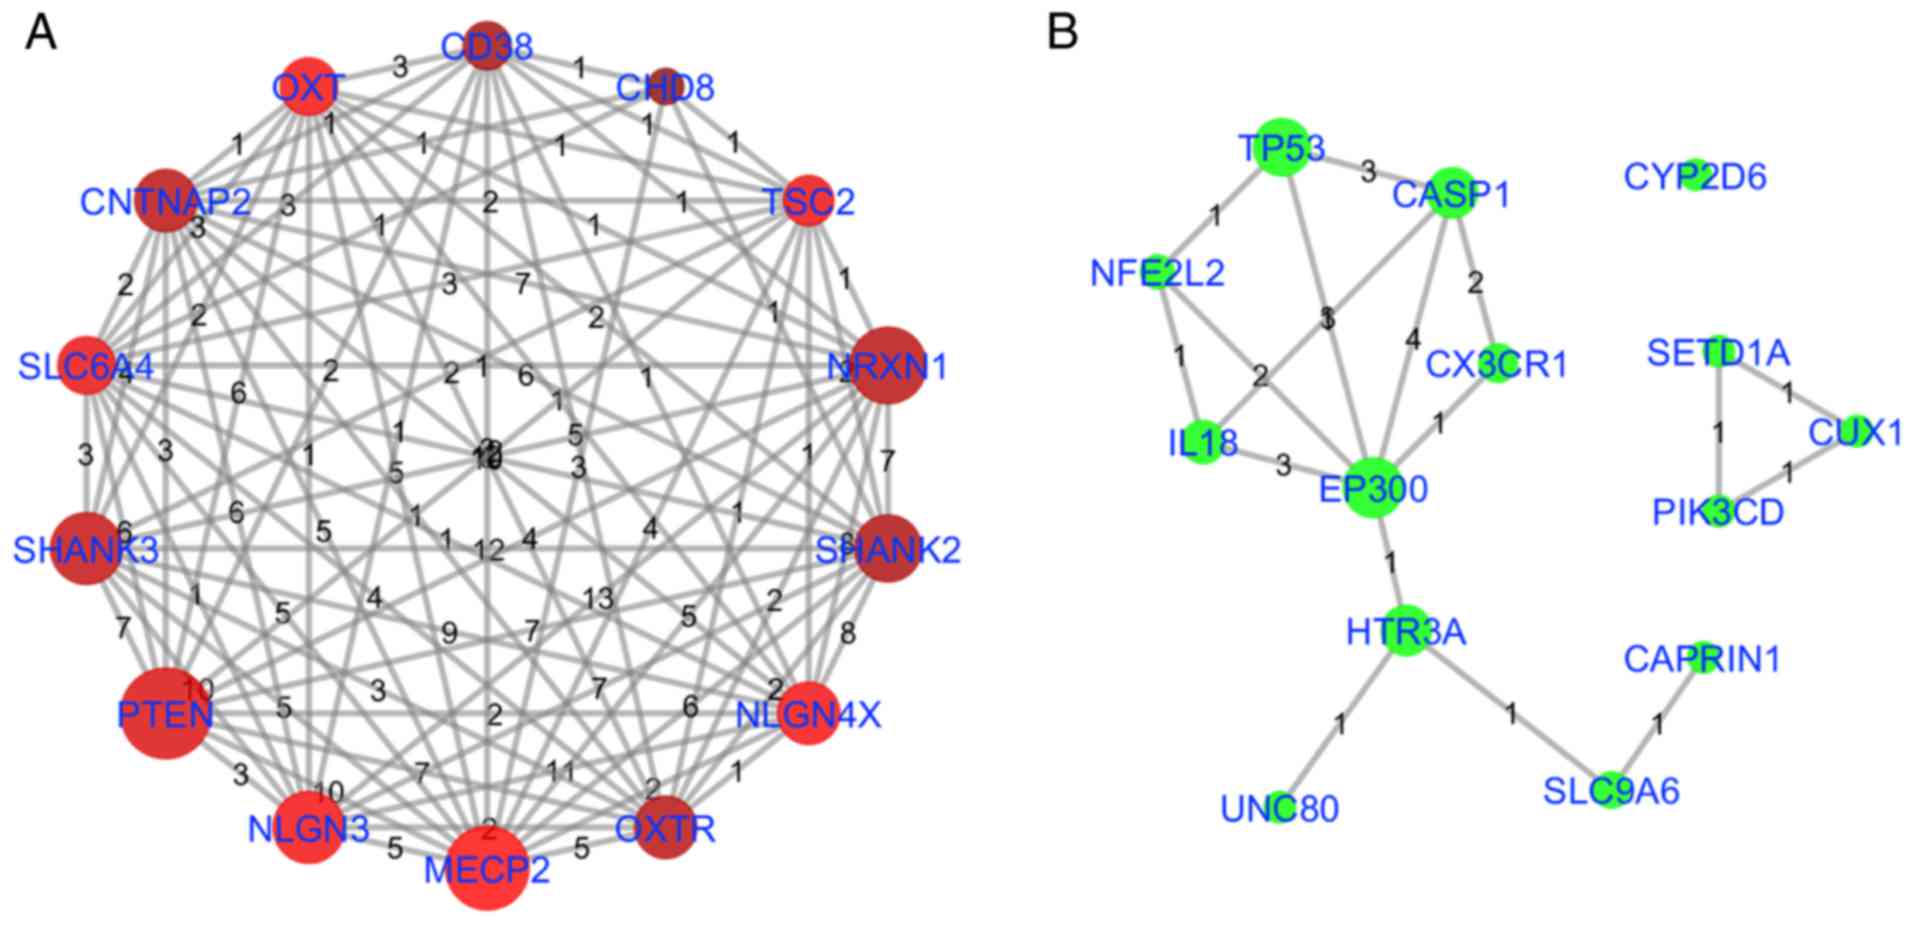
in Table III and Fig. 4, and as illustrated in Fig. 6. Fig. 6A describes the NCA for the top 14
highest QScore genes, indicating significant mutual pathway
participation. Fig. 6B indicates
the NCA for the top 14 NScore genes using the same pathways. As
highlighted previously, EP300 was identified as significant in
terms of pathway participation (included in 13 out of 97 pathways)
and NScore (NScore=3). TP53 and CASP1 also demonstrated marked
pathway involvement and NScore connectivity. HTR3A indicated marked
pathway involvement and limited NScore connectivity. However, HTR3A
was associated with the novel AD genes Unc-80 homolog, NALCN
channel complex subunit, which encodes a leak channel that serves
an important role in the establishment and maintenance of resting
membrane potentials in neurons,mutations of which are associated
with intellectual disability, and SLC9A6, a sodium-hydrogen
exchanger involved with synapse activity, mutations of which are
associated with mental retardation, and therefore may be of
signifciance in future studies. Conversely, CYP2D6 exhibited a high
NScore and weak associations with pathways previously studied in
association with autism, and may have been identifed using this
analysis primarily as a result of the effects of CYP2D6 gene
polymorphisms on the clearance rates of the drug risperidone used
in the treatment of children with ASD (24).
Discussion
In the present study, a literature data-mining
analysis was performed on 2,064 articles dating from January 2000
to April 2016, and identified 488 unique genes/proteins associated
with ASD. Based on the approach, an ASD_GD database was developed.
Within the ASD_GD database, the complete gene list together with
the literature references and enrichment metrics scores are
provided. Results from GSEA and SNEA provide evidence of a
functional association between the majority of these genes at the
pathway level and may assist in identifying which genes/proteins
may serve important roles in the pathogenesis of ASD.
As an automated literature data mining approach, the
Pathway Studio NLP semantic analysis technique is highly effective
and efficient in dealing with large amounts of data in literature
data-mining analyses (25). In
the ASD_GD-Ref for Related Genes database, the detailed information
of all the 2,064 articles studied, including the sentences from
which a specific association was extracted, is included. The
results of the present study are intended to provide an overall
view of the current state of genetic studies in ASD, mitigate
occasional errors and provide a basis for additional
biological/genetic studies.
From ASD_GD to Related Genes the number of
references for a given association can be observed to be closely
correlated with its QScore suggesting that the QScore may be the
most useful indicator in analyzing associations with limited
numbers of references, on the basis of CW and PubAge. Similarly, CR
is also closely correlated with the number of overall references
for a relation (R2=0.94 across all 488 ASD-associated
genes/proteins). As expected, PubAge is also loosely correlated
with reference number (ASD_GD→Publication Age; included in the
downloadable version of the datatbase) but with certain notable
exceptions; for example, the autism-associated chromatin modifier
chromodomain helicase DNA binding protein 8 (CHD8) gene (13) (QScore=20.8). The first publication
associating CDH8 with autism is only 5 years old (26), but has already been highly cited
(1,974 citations) and an ASD-like behavioral phenotype, including
increased anxiety, repetitive behavior and altered social behavior,
was demonstrated in mice heterozygous for CHD8 mutations (27).
The present study also observed that the majority of
genes identified by the literature data-mining analysis were
included in pathways previously implicated with ASD. Specifically,
391/488 total genes/proteins were included in at least one of the
top 97 enriched pathways, and 221/488 genes/proteins in the top 10
pathways. A number of these 97 pathways are potentially
functionally associated with ASD, including 21 neural system, 7
brain function, 3 behavior, and one aging pathway. We hypothesize
that the majority of these genes identified in the literature, in
particular the ones that were identified from significantly
enriched pathways, are functionally associated with ASD. Although
there may be false positives included within individual studies, it
is less likely that as a group, these genes have been identified as
being disrupted in a disease or disorder by chance.
The analysis in the present study did not
specifically focus on single genes; instead, it was noted that the
488 unique genes/proteins identified were not equal in terms of
publication frequency,citation rate of the underlying articles (CW)
or by their novelty (NScore). Using the proposed literature quality
metrics scores including QScore, the genes were ranked according to
several different criteria and significance measures, and the top
14 genes were selected for subsequent analysis. For example, SH3
and multiple ankyrin repeat domains 3, MECP2, PTEN, neuroligin 3
and neuroligin 4, X-linked are the top 5 genes that were most often
replicated in previous studies (with highest QScores), suggesting
that their associations with ASD are well-studied. These 5
particular genes/proteins were most enriched for the GO term
(GO:0035176) for 'Social Behavior' [false discovery rate (FDR)
Q=0.0015] (26), additionally
supporting the association of these high QScore genes/proteins with
the clinical presentation of social-behavioral characteristics
believed to comprise the broad autism phenotype. Notably, 25/48
genes/proteins of this particular GO term category were also
identified among the 488 unique ASD-associated genes/proteins
(P=5.2×10⁻²⁹). Alternatively, the top 2 genes identified
by NScore, namely CYP2D6 and EP300, were previously analyzed
multiple times in 2016. These data suggest that these genes are
likely to possess significant biological relevance to the
disease.
Additionally, it was noted that for the top 97
pathways enriched with 443/488 unique gene/proteins, certain genes
were identified in multiple significantly enriched pathways,
thereby generating high pathway enrichment EScores. The top 5 genes
by EScore included glutamate ionotropic receptor NMDA type (GRIN)
subunit 1 (42/97 pathways), GRIN subunit 2A (38/97), dopamine
receptor (DR) D1 (36/97), GRIN subunit 2B (GRIN2B; 38/97) and DRD2
(31/97), which were revealed to serve multiple roles within
different genetic pathways associated with ASD, suggesting their
biological significance in the disease. Notably, this group of
dopamine and glutamate ionotropic receptors was most markedly
associated, by GO term enrichment analysis, with the response to
amphetamine (FDR Q=0.008) (28)
and its effects on visual learning and cognition. This group of
genes, with the exception of GRIN2B (QScore=13.6), exhibited low
QScores (<2) indicating that they have not yet been well studied
within the context of autism and perhaps, given the data from the
present study, may warrant additional analyses. The combination of
NScore and EScore has been suggested to be effective in identifying
highly relevant genes/proteins that may otherwise have been
overlooked either due to low publication frequency and/or old
publication date. The exploration of the predictive ability of
EScore, in particular, for identifying novel genes/proteins prior
to publication is important, and is currently being investigated by
our study group.
In addition to GSEA, a SNEA was also performed,
which was implemented in Pathway Studio using master casual
networks generated from >6.5 million associations derived from
>4 million full-text articles and 25 million PubMed abstracts.
The ability of the Pathway Studio automated NLP technology to
quickly update the terminologies and linguistics rules used by the
NLP systems ensures that novel terms may be captured rapidly
following their entrance into regular use in the literature, and
updates of literature results occur on a weekly basis. This
extensive database of interaction data provides high levels of
confidence when interpreting experimentally-derived genetic data
against the background of previously published results. The SNEA
results of the present study demonstrated that the majority of the
488 unique genes/proteins (>90%) were also identified to have
regulatory roles in other disparate mental health disorders,
including schizophrenia, epilepsy and cognitive impairment,
alongside marked associations with ASD (29–31). A total of 9 out of 10 of the most
significantly enriched ASD gene/protein associated diseases were
also demonstrated to be directly functionally associated with
ASD.
Results from the literature data-mining analysis of
the present study demonstrate that the majority of the 488 unique
gene/proteins identified by this method exhibited multiple types of
associations with ASD. The literature and enrichment metrics
employed identified key genes with specific significance to ASD. In
addition, NCA and GSEA results suggested that these genes/proteins
serve significant roles within a network of associated genes
contributing to the pathogenesis of ASD. Results from the
sub-network analysis indicate that these same genes have
significant cross-over effects with other mental disorders.
Notably, the data analysis approach proposed in the
present study may be applied to updated ASD literature data.
Consequently, an update of the ASD_GD database has been generated
following the same procedure with updated ASD literature data (up
to June 2018). By comparing the two databases (e.g., the current
ASD_GD and the one updated in June 2018), it has been demonstrated
that the approach outlined in the present study is applicable to
other literature data mining techniques within disease-gene
association studies.
In conclusion; ASD is a complex disease whose
genetic causes are associated with a network composed of a large
group of genes. Literature data-mining analysis together with GSEA,
SNEA and NCA methods may serve as an effective approach in
identifying these potential target genes. Comparative analysis
using a similar approach with multiple types of mental disorders
may be useful for identifying not only the most relevant and
significant disease-specific gene targets but may also serve as a
reliable method for identifying significant areas of homology
between the genetic patterns of different disease types.
Funding
The study was supported by the Primary Research
& Development Plan of Jiangsu Province (BE2016630).
Availability of data and materials
All data generated or analyzed during this study are
included in this published article. A genetic database (name:
ASD_GD) has been developed and deposited into an open source
'Bioinformatics Database' (http://database.gousinfo.com). The publicly
downloadable version (in Excel file) of the database is available
at http://gousinfo.com/database/Data_Genetic/ASD_GD.xlsx.
The database includes 488 genes (with metric scores; ASD_GD→Related
Genes), 97 pathways (ASD_GD→Related Pathways) and 93 diseases
(ASD_GD→Related Genes) that are associated with ASD. For each
ASD-gene association, there is information concerning the
supporting references (ASD_GD→Ref for Related Genes), including
titles and relevant sentences where the association has been
identified. For more information regarding the database, please
refer to ASD_GD→Database Note, where the update status was also
included.
Authors' contributions
XC, HC, CC and FZ contributed to the study design,
data collection, data analysis and interpretation. XC, HC and CC
contributed to the writing of the manuscript.
Ethics approval and consent to
participate
Not applicable.
Patient consent to publication
Not applicable.
Competing interests
The authors declare that they have no competing
interests.
Acknowledgments
Not applicable.
References
|
1
|
Chaste P and Leboyer M: Autism risk
factors: Genes, environment, and gene-environment interactions.
Dialogues Clin Neurosci. 14:281–292. 2012.PubMed/NCBI
|
|
2
|
Rutter M: Genetic studies of autism: From
the 1970s into the millennium. J Abnorm Child Psychol. 28:3–14.
2000. View Article : Google Scholar : PubMed/NCBI
|
|
3
|
Aronson M, Hagberg B and Gillberg C:
Attention deficits and autistic spectrum problems in children
exposed to alcohol during gestation: A follow-up study. Dev Med
Child Neurol. 39:583–587. 1997. View Article : Google Scholar : PubMed/NCBI
|
|
4
|
Kolevzon A, Gross R and Reichenberg A:
Prenatal and perinatal risk factors for autism: A review and
integration of findings. Arch Pediatr Adolesc Med. 161:326–333.
2007. View Article : Google Scholar : PubMed/NCBI
|
|
5
|
Minshew NJ: Brief report: Brain mechanisms
in autism: Functional and structural abnormalities. J Autism Dev
Disord. 26:205–209. 1996. View Article : Google Scholar : PubMed/NCBI
|
|
6
|
Tager-Flusberg H: The origins of social
impairments in autism spectrum disorder: Studies of infants at
risk. Neural Netw. 23:1072–1076. 2010. View Article : Google Scholar : PubMed/NCBI
|
|
7
|
Businaro R, Corsi M, Azzara G, Di Raimo T,
Laviola G, Romano E, Ricci L, Maccarrone M, Aronica E, Fuso A, et
al: Interleukin-18 modulation in autism spectrum disorders. J
Neuroinflammation. 13:22016. View Article : Google Scholar : PubMed/NCBI
|
|
8
|
Hu VW: Subphenotype-dependent disease
markers for diagnosis and personalized treatment of autism spectrum
disorders. Dis Markers. 33:277–288. 2012. View Article : Google Scholar : PubMed/NCBI
|
|
9
|
Parker-Athill EC and Tan J: Maternal
immune activation and autism spectrum disorder: Interleukin-6
signaling as a key mechanistic pathway. Neurosignals. 18:113–128.
2010. View Article : Google Scholar : PubMed/NCBI
|
|
10
|
Andari E, Duhamel JR, Zalla T, Herbrecht
E, Leboyer M and Sirigu A: Promoting social behavior with oxytocin
in high-functioning autism spectrum disorders. Proc Natl Acad Sci
USA. 107:4389–4394. 2010. View Article : Google Scholar : PubMed/NCBI
|
|
11
|
Kolevzon A, Bush L, Wang AT, Halpern D,
Frank Y, Grodberg D, Rapaport R, Tavassoli T, Chaplin W, Soorya L,
et al: A pilot controlled trial of insulin-like growth factor-1 in
children with Phelan-McDermid syndrome. Mol Autism. 5:542014.
View Article : Google Scholar
|
|
12
|
LoParo D and Waldman ID: The oxytocin
receptor gene (OXTR) is associated with autism spectrum disorder: A
meta-analysis. Mol Psychiatry. 20:640–646. 2015. View Article : Google Scholar
|
|
13
|
Zhou Y, Kaiser T, Monteiro P, Zhang X, Van
der Goes MS, Wang D, Barak B, Zeng M, Li C, Lu C, et al: Mice with
Shank3 mutations associated with ASD and Schizophrenia display both
shared and distinct defects. Neuron. 89:147–162. 2016. View Article : Google Scholar :
|
|
14
|
Cotney J, Muhle RA, Sanders SJ, Liu L,
Willsey AJ, Niu W, Liu W, Klei L, Lei J, Yin J, et al: The
autism-associated chromatin modifier CHD8 regulates other autism
risk genes during human neurodevelopment. Nat Commun. 6:64042015.
View Article : Google Scholar : PubMed/NCBI
|
|
15
|
King LB, Walum H, Inoue K, Eyrich NW and
Young LJ: Variation in the oxytocin receptor gene predicts brain
region-specific expression and social attachment. Biol Psychiatry.
80:160–169. 2016. View Article : Google Scholar : PubMed/NCBI
|
|
16
|
Theoharides TC, Stewart JM, Panagiotidou S
and Melamed I: Mast cells, brain inflammation and autism. Eur J
Pharmacol. 778:96–102. 2016. View Article : Google Scholar
|
|
17
|
Higashida H, Yokoyama S, Huang JJ, Liu L,
Ma WJ, Akther S, Higashida C, Kikuchi M, Minabe Y and Munesue T:
Social memory, amnesia, and autism: Brain oxytocin secretion is
regulated by NAD+ metabolites and single nucleotide
polymorphisms of CD38. Neurochem Int. 61:828–838. 2012. View Article : Google Scholar : PubMed/NCBI
|
|
18
|
Jiang YH and Ehlers MD: Modeling autism by
SHANK gene mutations in mice. Neuron. 78:8–27. 2013. View Article : Google Scholar : PubMed/NCBI
|
|
19
|
Clipperton-Allen AE and Page DT: Decreased
aggression and increased repetitive behavior in Pten
haploinsufficient mice. Genes Brain Behav. 14:145–157. 2015.
View Article : Google Scholar : PubMed/NCBI
|
|
20
|
Nikitin A, Egorov S, Daraselia N and Mazo
I: Pathway studio - the analysis and navigation of molecular
networks. Bioinformatics. 19:2155–2157. 2003. View Article : Google Scholar : PubMed/NCBI
|
|
21
|
Rindflesch TC, Tanabe L, Weinstein JN and
Hunter L: EDGAR: Extraction of drugs, genes and relations from the
biomedical literature. Pac Symp Biocomput. 2000:517–528. 2000.
|
|
22
|
Sivachenko AY, Yuryev A, Daraselia N and
Mazo I: Molecular networks in microarray analysis. J Bioinform
Comput Biol. 5:429–456. 2007. View Article : Google Scholar : PubMed/NCBI
|
|
23
|
Pyatnitskiy M, Mazo I, Shkrob M, Schwartz
E and Kotelnikova E: Clustering gene expression regulators: New
approach to disease subtyping. PLoS One. 9:e849552014. View Article : Google Scholar : PubMed/NCBI
|
|
24
|
Vanwong N, Ngamsamut N, Medhasi S,
Puangpetch A, Chamnanphon M, Tan-Kam T, Hongkaew Y, Limsila P and
Sukasem C: Impact of CYP2D6 polymorphism on steady-state plasma
levels of risperidone and 9-hydroxyrisperidone in thai children and
adolescents with autism spectrum disorder. J Child Adolesc
Psychopharmacol. 27:185–191. 2017. View Article : Google Scholar
|
|
25
|
Cheadle C, Cao H, Kalinin A and Hodgkinson
J: Advanced literature analysis in a Big Data world. Ann NY Acad
Sci. 1387:25–33. 2017. View Article : Google Scholar
|
|
26
|
Sanders SJ, Murtha MT, Gupta AR, Murdoch
JD, Raubeson MJ, Willsey AJ, Ercan-Sencicek AG, DiLullo NM,
Parikshak NN, Stein JL, et al: De novo mutations revealed by
whole-exome sequencing are strongly associated with autism. Nature.
485:237–241. 2012. View Article : Google Scholar : PubMed/NCBI
|
|
27
|
Katayama Y, Nishiyama M, Shoji H, Ohkawa
Y, Kawamura A, Sato T, Suyama M, Takumi T, Miyakawa T and Nakayama
KI: CHD8 haploinsufficiency results in autistic-like phenotypes in
mice. Nature. 537:675–679. 2016. View Article : Google Scholar : PubMed/NCBI
|
|
28
|
Supek F, Bošnjak M, Škunca N and Šmuc T:
REVIGO summarizes and visualizes long lists of gene ontology terms.
PLoS One. 6:e218002011. View Article : Google Scholar : PubMed/NCBI
|
|
29
|
Alabdali A, Al-Ayadhi L and El-Ansary A:
Association of social and cognitive impairment and biomarkers in
autism spectrum disorders. J Neuroinflammation. 11:42014.
View Article : Google Scholar : PubMed/NCBI
|
|
30
|
Goldstein G, Minshew NJ, Allen DN and
Seaton BE: High-functioning autism and schizophrenia: A comparison
of an early and late onset neurodevelopmental disorder. Arch Clin
Neuropsychol. 17:461–475. 2002. View Article : Google Scholar
|
|
31
|
Robinson SJ: Childhood epilepsy and autism
spectrum disorders: Psychiatric problems, phenotypic expression,
and anticonvulsants. Neuropsychol Rev. 22:271–279. 2012. View Article : Google Scholar : PubMed/NCBI
|