Introduction
Obesity may lead to various diseases, including Type
2 diabetes, hypertension and cardiovascular disease (CVD) (1). Adipose tissues store lipids as a
source of energy, and the secretion of various adipokines affects
metabolism in adipose tissues and non-adipose tissues, leading to
the development of various associated disorders (2). Recently, a global rise in the
occurrence of obesity associated with metabolic syndromes has been
observed, and appears to be the result of physical inactivity and
the intake of a high-calorie diet (3).
According to a study of the US population, the
proportion of obese individuals [body mass index (BMI) ≥30]
increased by ~10% over 10 years, from 34.5% in 2005 to 38.1% in
2014, and the proportion of markedly obese individuals (BMI ≥40)
increased by 32.2% over the same period (from 5.9 to 7.8%). The US
society has altered into a markedly obese society (4). Similar to the trends in adults, the
occurrence of obesity and extreme obesity in minors (aged between 2
and 19 years) is also increasing. In particular, the most marked
change was observed in adolescents of between 12 and 19 years of
age, with an increase in extreme obesity from 2.6 to 9.1% in the
last 10 years (4). The increase
in obesity and extreme obesity of adolescents is expected to have a
severe impact on society in the future (5). Obesity initiated by changes in the
regional circulation of body fats is an atherogenic risk factor for
problems such as hypertension, dyslipidemia, alterations in the
coagulation profile and inflammatory cytokines; ultimately, these
conditions are responsible for the mortality and morbidity of
patients with CVD (6,7).
Non-alcoholic fatty liver disease (NAFLD) is
associated with an increase in triacylglycerols (triglycerides or
TGs) in liver tissues, which causes liver damage such as
hepatocellular necrosis, steatohepatitis and steatosis (8). The equilibrium between lipogenesis
and hepatic lipolysis is imperative for the improvement of patients
with NAFLD. High-fat diet (HFD)-treated animals exhibit mild
obesity and are appropriate for use in the development of
preventive agents for metabolic syndromes including NAFLD (9-11).
Therefore, an HFD-fed mice model was selected for the detection of
the various pharmacological effects of the test material.
AMP-activated protein kinase (AMPK), a key regulator
of glucose and lipid metabolism in cells, serves an important
function in the mediation of hepatic lipogenesis (12,13). Previous studies have identified
that AMPK activity is decreased by factors associated with the
development of NAFLD, such as obesity and inflammation (14,15). Therefore, the inhibition of
hepatic lipogenesis by AMPK activity is predicted as a feasible
therapeutic approach to avoid the initiation and progression of
NAFLD (11,16).
Metformin is an oral antidiabetic medicine of the
biguanide class and an AMPK activator (17,18). It is a widely used medicine for
the treatment of Type 2 diabetes, particularly for patients who are
overweight with normal kidney function (19-21). However, it is not recommended for
patients with any conditions that could lead to increased risk of
kidney disorders and lactic acidosis (22,23). However, lactic acidosis is rare
and is primarily associated with other conditions, such as damaged
kidney or liver function, rather than metformin itself (24). Therefore, in the present study,
metformin was selected as a reference drug.
Blue honeysuckle (BH; berries of Lonicera
caerulea var. edulis L., Caprifoliaceae) is an abundant
source of ascorbic acid and phenolic components, including
flavonoids, low-molecular-mass phenolic acids and anthocyanins
(25,26). These compounds have various
biological activities, including marked antioxidant activity
(26). Orally administered BH was
identified to protect mice against ionizing radiation (27), ameliorate abnormal lipid and
glucose metabolism in rats (28),
and exert hepatoprotective (29),
anti-inflammatory (30) and
therapeutic (31) effects on
hyperthyroidism. More specifically, BH extracts exhibited the most
marked antioxidant potency among 12 types of colored berries
(32), and the phenol-rich
extracts of BH were demonstrated to have wound-healing and
anti-inflammatory activates in in vitro and in vivo
studies (30), in addition to
protective properties against the skin damage caused by ultraviolet
rays (33).
In the present study, the pharmacological activities
of BH extract (BHe) were determined in HFD-fed mice.
Materials and methods
Animals and husbandry
In total, 48 female 6-week-old ICR mice (OrientBio,
Seongnam, Korea) were acclimatized for 7 days before experimental
use. Mice were assigned to each polycarbonate cage in groups of 4
or 5 in a humidity (40-45%) and temperature (20-25°C)-controlled
room, with a 12-h light/12-h dark cycle, and ad libitum
access to water and commercial rodent chow (cat. no. 38057;
Purinafeed, Seongnam, Korea). After 7 days of acclimatization, the
animals were given free access to an HFD with 45% of calories from
fat (cat. no. D12451, Research Diet, New Brunswick, NJ, USA). In
intact control mice, the animals were given free access to a normal
pellet diet (NFD; cat. no. 38057; Purinafeed). HFD-adapted mice
were selected following a 1-week adaptation period and assigned to
one of six treatment groups containing 8 mice on the basis of their
body weights: 1) Healthy control: Oral administration of NFD and
distilled water (10 ml/kg); 2) HFD control: Oral administration of
HFD and distilled water (10 ml/kg); 3) metformin: Oral
administration of HFD and metformin (250 mg/kg); 4) BHe400: Oral
administration of HFD and BHe (400 mg/kg); 5) BHe200: Oral
administration of HFD and BHe (200 mg/kg); and 6) BHe100: Oral
administration of HFD and BHe (100 mg/kg).
All laboratory animals were treated in accordance
with the national regulations of the usage and welfare of
labora-tory animals and approved by the Institutional Animal Care
and Use Committee in Daegu Haany University (Gyeongsan, Korea)
prior to the experiments (approval no. DHU2017-022).
Preparation and administration of test
substances
BHe was prepared by Aribio Co. Ltd. (Seongnam,
Korea) as a deep-purple powder and stored at −20°C until use.
Natuzyme, a pectinase enzyme derived from Aspergillus niger
and used as a pectin-degrading enzyme in plants for degrading
shells, was used for the preparation of the test substances.
Briefly, the following procedure was followed for frozen BH fruits:
Heating at 45–55°C for 3 min; pulverization; enzyme treatment
[pectinase: 0.05% (w/w) Natuzyme DP ultra, 0.05% (w/w) Natuzyme
olimax, 2-2.5 h, 50 rev/min]; centrifugation at 6,400 × g; heating
at 80°C for 15-30 sec; addition of chitosan (0.005%) and guar gum
(0.005%); filtration (disc separation, diatomite filtration and
filter press); condensation at 63 Brix, 50°C and 0.092 MPa for 1
min; sterilization at 90-95°C for 15-30 sec; and freeze-drying.
From this process, BHe was obtained at a yield of 10.83%. Chitosan
(0.005%) was used as a protein coagulant and subsequently removed
by filtration to limit the possible effects of chitosan. Metformin
hydrochloride was purchased from Wako Pure Chemical Industries,
Ltd. (Osaka, Japan). Appropriate amounts of BHe were dissolved in
distilled water to obtain solutions of 40, 20 and 10 mg/ml. After 1
week of HFD administration, the test solutions were orally
administered to the mice once daily for 84 days at a volume of 10
ml/kg (equivalent to 400, 200 and 100 mg/kg) using a stainless
steel Zonde attached to a 1 ml syringe. In addition, metformin
hydrochloride was dissolved in distilled water at a concentration
of 25 mg/ml and also orally administered at a volume of 10 ml/kg
(equivalent to 250 mg/kg) (34).
HFD control and healthy control mice were orally administered equal
volumes of distilled water, instead of the test material, to
provide the same experimental conditions. The administration of
metformin (250 mg/kg) as a positive control was selected on the
basis of previous animal studies (19,35).
Body and organ weight changes
Body weight changes were recorded using an automatic
electronic balance (XB320M, Precisa Gravimetrics AG, Zurich,
Switzerland) at the following time points: 8 days before the HFD
was supplied; 1 day before initiation of administration; at the
time of initial administration day (D0); and every week until the
end of the experiment. All experimental mice, at the initiation and
termination of the experiment, were fasted overnight (without water
for 12 h) to limit the variations in feeding. Furthermore, gains in
body weight were recorded during the adaptation period (day 8 to
day 0 of test material administration) and the administration
period (day 0 to day 84 of test material administration).
At sacrifice, the changes in the weight of the
liver, the left periovarian fat pads, and fat pads deposited on the
abdominal wall attached to the muscularis quadratus lumborum, were
recorded. The relative changes in organ/tissue weights (as a
percentage of body weight) were estimated compared with the body
weight at sacrifice to decrease the variation from individual body
weights (35).
Determination of mean daily food
consumption (MDFC)
A feed weight of 150 g was supplied per cage and the
quantity of the food remaining after 24 h was determined using an
automatic electronic balance. The observed values were divided by
the number of reared mice in the same cage and to yield the
individual MDFC of the mice (g/day/mouse). The MDFC was calculated
once weekly throughout the 84-day administration period (35).
Determination of fat density in the total
body and abdominal cavity
The mean body fat density of the total body and
abdominal cavity region (%) of each mouse was determined using a
live dual-energy X-ray absorptiometry (DEXA) InAlyzer (Medikors
Inc., Seongnam, Korea) on the final day of the test material
administration.
Serum biochemistry analyses
Blood was collected from the caudal vena cava at the
time of sacrifice and stored in clotting-activated serum tubes; the
serum was separated by centrifugation at 12,600 × g for 10 min at
room temperature. Serum alanine aminotransferase (ALT), aspartate
transaminase (AST), alkaline phosphatase (ALP), lactate
dehydrogenase (LDH), γ-glutamyltransferase (GGT), total cholesterol
(TC), TG, high-density lipoprotein (HDL) and low-density
lipoprotein (LDL) levels were determined using a blood analyzer
(Dri-Chem NX500i; Fuji Medical System Co., Ltd., Tokyo, Japan) and
stored at −150°C in an ultra-low temperature freezer (MDF-1156,
Sanyo, Tokyo, Japan) until use.
Determination of fecal lipid
composition
Feces were collected 8 h after the final
administration of the test material and the lipids were extracted
by the method described by Folch et al (36). The fecal TG and TC concentrations
were estimated using a commercial TC colorimetric assay kit (Total
Cholesterol assay kit; cat. no. 100102303; Cayman Chemical Company,
Ann Arbor, MI, USA) in conjunction with a microplate reader
(Sunrise; Tecan Group, Ltd., Männedorf, Switzerland).
Determination of lipid peroxidation and
antioxidant defense system
The glutathione (GSH) and malondialdehyde (MDA)
content and the catalase (CAT) and superoxide dismutase (SOD)
enzyme activities in hepatic tissues were estimated. The weight of
the separated hepatic tissues was determined, and the tissues were
homogenized in ice-cold 0.01 M Tris/HCl buffer (pH 7.4) using a
bead beater (TacoTMPre; GeneResearch Biotechnology Corp., Taichung,
Taiwan) and an ultrasonic cell disruptor (KS-750; Madell Technology
Corp., Ontario, CA, USA), and centrifuged at 12,000 × g for 15 min.
The tissue homogenates were stored in an ultra-low temperature
freezer at −150°C until further use. The liver lipid peroxidation
levels were estimated using the thiobarbituric acid relative
substances assay and the values were recorded as nmol MDA per mg
protein (37). The total protein
content was measured in accordance with the method described by
Lowry et al (38), with
bovine serum albumin (Invitrogen; Thermo Fisher Scientific, Inc.)
used as an internal standard. The GSH content was estimated
spectrophotometrically from the absorbance at 412 nm, as described
by Sedlak and Lindsay (39). The
decomposition of H2O2 in the presence of CAT
was examined spectrophotometrically at 240 nm, as described by Aebi
(40). CAT enzyme activity was
defined as the quantity of enzyme needed to decompose 1 nM
H2O2 per min at room temperature and pH 7.8.
SOD enzyme activity was measured spectrophotometrically at 560 nm,
as described by Sun et al (41). SOD enzyme activity was defined as
the amount of enzyme required to decrease the initial absorbance of
nitroblue tetrazolium by 50% in 1 min.
Analysis of hepatic glucose-regulating
enzyme activity
A hepatic enzyme source was prepared as described
previously by Hulcher and Oleson (42). First, 0.3 g hepatic tissue was
homogenized in buffer solution (0.2 M EDTA, 0.1 M triethanolamine
and 0.002 M dithiothreitol), and centrifuged at 1,000 × g for 15
min at 4°C. The supernatant was collected in a separate tube and
further centrifuged at 10,000 × g for 15 min at 4°C. The hepatic
glucose-regulating (glucokinase, GK) activity was estimated as
described previously by Davidson and Arion (43). A 980 µl reaction mixture
[100 mM KCl, 50 mM NAD+, 50 mM
4-(2-hydroxyethyl)-1-piperazineethane-sulfonic
acid-N-acetylglucosaminyltransferase (pH 7.4), 10 mM
glucose, 7.5 mM MgCl2, 10 mg/ml albumin, 2.5 mM
dithioerythritol, 10 µl hepatic tissue homogenate and 4
units of glucose-6-phosphate dehydrogenase] was pre-incubated at
37°C for 10 min, and the reaction was initiated by the addition of
5 mM ATP solution (10 µl). Following incubation for a
further 10 min at 37°C, the change in absorbance at 340 nm was
recorded. Glucose-6-phosphatase (G6Pase) activity was estimated
using the method described by Alegre et al (44). The buffer solution was
pre-incubated at 37°C for 3 min and 5 µl hepatic tissue
homogenate was added to the mixture, prior to further incubation at
37°C for 4 min, and the change in absorbance at 340 nm was
determined. Phosphoenolpyruvate carboxykinase (PEPCK) activity was
estimated in accordance with the Bentle and Lardy (45) method. PEPCK enzyme activity was
determined by the decrease in absorbance at 340 nm.
Reverse transcription-quantitative
polymerase chain reaction (RT-qPCR) analysis
The mRNA expression of acetyl-CoA carboxylase 1
(ACC1), AMPKα1 and AMPKα2 in hepatic tissues, and mRNA expression
of leptin, uncoupling protein 2 (UCP2), adiponectin,
CCAAT/enhancer-binding protein (C/EBP)α, C/EBPβ and
sterol-regulatory-element-binding protein 1c (SREBP1c) in
periovarian adipose tissue were determined using RT-qPCR (46). Briefly, RNA from adipose tissues
was isolated using TRIzol® reagent (Invitrogen; Thermo
Fisher Scientific, Inc., Waltham, MA, USA). The RNA quality and
quality were assessed using the CFX96TM Real-Time System (Bio-Rad
Laboratories, Inc., Hercules, CA, USA). The isolated RNA samples
were treated with recombinant DNase I (Ambion; Thermo Fisher
Scientific, Inc.) and reverse-transcribed using a high-capacity
cDNA RT kit (Applied Biosystems; Thermo Fisher Scientific, Inc.).
The analyses were performed using the ABI Step One Plus Real-Time
System (Applied Biosystems; Thermo Fisher Scientific, Inc.)
(47), with mRNA expression
calculated relative to the vehicle control. The following thermal
conditions were applied: 94°C for 10 min; 39 cycles of 94°C for 15
sec and 57°C for 20 sec; and 72°C for 30 sec. The data were
normalized to GAPDH mRNA expression using the comparative threshold
cycle method (48). The
oligonucleotide primer sequences used for PCR are listed in
Table I.
 | Table IOligonucleotides used for the reverse
transcription-quantitative polymerase chain reaction. |
Table I
Oligonucleotides used for the reverse
transcription-quantitative polymerase chain reaction.
| Target | Sequence
(5′-3′) | GenBank accession
no. |
|---|
| Leptin | | NM_008493 |
| Sense |
CCAAAACCCTCATCAAGACC | |
| Antisense |
GTCCAACTGTTGAAGAATGTCCC | |
| UCP2 | | NM_011671 |
| Sense |
CCGCATTGGCCTCTACGACTCT | |
| Antisense |
CCCCGAAGGCAGAAGTGAAGTG | |
| Adiponectin | | NM_009605.4 |
| Sense |
CCCAAGGGAACTTGTGCAGGTTGGATG | |
| Antisense |
GTTGGTATCATGGTAGAGAAGAAAGCC | |
| C/EBPα | | NM_001287523.1 |
| Sense |
TGGACAAGAACAGCAACGAGTAC | |
| Antisense |
CGGTCATTGTCACTGGTCAACT | |
| C/EBPβ | | |
| Sense |
AAGCTGAGCGACGAGTACAAGA | NM_001287739.1 |
| Antisense |
GTCAGCTCCAGCACCTTGTG | |
| SREBP1c | | XM_006532714.2 |
| Sense |
AGCCTGGCCATCTGTGAGAA | |
| Antisense |
CAGACTGGTACGGGCCACAA | |
| ACC1 | | NM_133360.2 |
| Sense |
GCCATTGGTATTGGGGCTTAC | |
| Antisense |
CCCGACCAAGGACTTTGTTG | |
| AMPKα1 | | XM_011245321.1 |
| Sense |
AAGCCGACCCAATGACATCA | |
| Antisense |
CTTCCTTCGTACACGCAAAT | |
| AMPKα2 | | NM_178143.2 |
| Sense |
GATGATGAGGTGGTGGA | |
| Antisense |
GCCGAGGACAAAGTGC | |
| GAPDH | | NM_008084 |
| Sense |
CATCTTCCAGGAGCGAGACC | |
| Antisense |
TCCACCACCCTGTTGCTGTA | |
Histopathology
Following determination of the organ weights, the
left periovarian fat pad, left lateral lobe of the liver and the
fat pads stored in the abdominal wall attached to the muscularis
quadratus lumborum were fixed in 10% neutral-buffered formalin.
Following embedding of the organs in paraffin using an automated
tissue processor (Shandon Citadel 2000; Thermo Fisher Scientific,
Inc.) and embedding center (Shandon Histocentre 3; Thermo Fisher
Scientific, Inc.), 3-4-µm serial sections were prepared
using a microtome (RM2255; Leica Biosystems, Wetzlar, Germany).
Representative tissue sections were stained with
hematoxylin and eosin (H&E) and examined under a light
microscope (Eclipse 80i; Nikon Corporation, Tokyo, Japan).
Alternatively, dehydrated liver tissues in 30% sucrose solutions
were sectioned using a cryostat and stained with oil red O
(19). The detailed
histopathological changes in the mean hepatocyte diameters
(determined by H&E staining) and steatohepatitis regions were
determined using an automated image analysis process Model
iSolution FL (version 9.1; IMT i-solution Inc., Vancouver, QC,
Canada) (19). The area of
steatohepatitis (proportion of fats stored in the hepatic
parenchyma) was measured as a percentage of the lipid-deposited
regions between the limited histological fields of view of the
liver (and expressed in units of %/mm2 of hepatic
parenchyma). The mean diameters of the hepatocytes and white
adipocytes were estimated in the same fields of view following
embedding in paraffin and H&E staining using an automated image
analysis process.
A minimum of 10 hepatocytes in each field of view
and 10 white adipocytes for each fat pad were checked. The
thicknesses of the deposited periovarian fat pad, the mean areas
occupied by zymogen granules, and the abdominal wall fat pads were
also estimated by an automated image analysis process. The area of
the zymogen granule distribution (%/mm2; the area
occupied by the intracellular pink granules in an exocrine cell)
was calculated using the automated image analysis process of Model
iSolution FL. During the analysis, the histopathologist was blinded
to the group distribution.
Statistical analyses
All numerical values are presented as the mean ±
standard deviation of 8 mice. Multiple comparison tests were
performed to determine the differences between dose groups. The
Levene test was used to measure the variance homogeneity (49); briefly, if the Levene test
indicated no significant deviations from variance homogeneity, the
observed data were evaluated by one-way analysis of variance
followed by the Bonferroni test. Statistical analyses were computed
using SPSS (version 22; IBM Corp, Armonk, NY, USA). Furthermore,
the percentage changes compared with the HFD control were estimated
to improve understanding of the efficacy of the test substances.
The percentage changes between the HFD and intact control groups
were also determined to detect the induction of disease using the
following equations in accordance with our previous studies
(19,50).
Change compared with the intact control (%)=[(data
for the HFD control-data for the intact control)/data for the
intact control] ×100.
Change compared with the HFD control (%)=[(data for
the test substance administered mice-data for the HFD control)/data
for the HFD control] ×100.
Results
Changes in organ and tissue weights
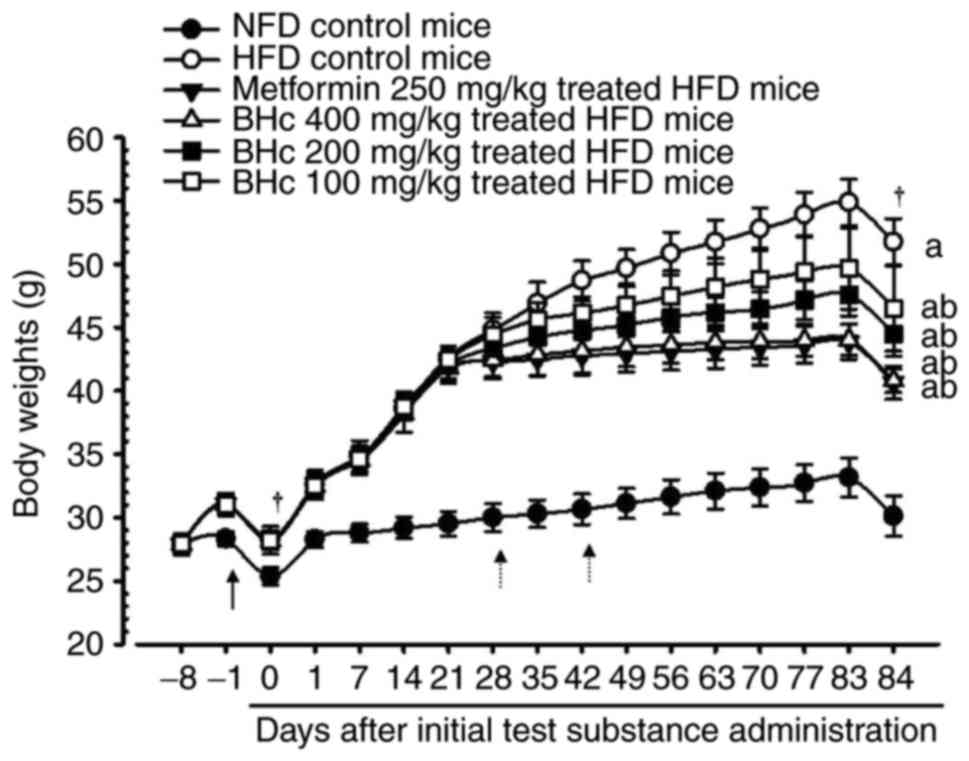
Significant increases in the body weight of HFD
control mice (P<0.05) were observed in comparison with healthy
control mice from 7 days after HFD administration, throughout 7
days of HFD adaption, and after 84 days of test material
administration. However, significant (P<0.05) decreases in the
body weights were observed in the metformin (250 mg/kg) and BHe
(200 and 400 mg/kg)-treated mice at 28 days after HFD
administration, and at 42 days after initial administration in the
100 mg/kg BHe-treated group compared with in the HFD control mice.
Accordingly, metformin-(250 mg/kg) and BHe-treated mice exhibited a
significant (P<0.05) decrease in body weight gain during the 84
days of test material administration compared with in the HFD
control mice. All dosages of BHe (400, 200 and 100 mg/kg) resulted
in clear dose-dependent decreases in body weight and body weight
gain during the experimental period of 84 days compared with HFD
control mice (Table II; Fig. 1). The body weight change during
the experimental period (84 days of HFD) in the control group was
increased by 393.44% compared with in the healthy control; however,
the changes were −47.02, −21.97, −31.28 and −46.12% in metformin
(250 mg/kg) and BHe (400, 200 and 100 mg/kg)-treated mice compared
with in the HFD control mice, respectively.
| Table IIChanges in body weight gains and
daily food consumption in NFD- or HFD-fed mice. |
Table II
Changes in body weight gains and
daily food consumption in NFD- or HFD-fed mice.
| Group | Body weight at time
following initial test material treatment, g
| Body weight gain
during
| Mean daily food
consumption, g |
|---|
| 8 days before
[A] | 1 day before
[B] | 0 daya [C] | 84 daysa [D] | Adaptation period
[B-A], g | period [D-C],
g |
|---|
| Controls | | | | | | | |
| Intact | 27.86±0.52 | 28.34±0.57 | 25.36±0.67 | 30.13±1.59c | 0.48±0.15 | 4.76±1.30 | 4.63±0.32 |
| HFD | 27.88±0.84 | 31.03±0.90b | 28.25±0.73b | 51.75±1.85b | 3.15±0.26b | 23.50±1.68b | 3.87±0.21b |
| Metformin (250
mg/kg) | 27.91±0.45 | 31.09±0.58b | 28.21±0.45b | 40.66±1.30b,c | 3.18±0.21b | 12.45±1.00b,c | 3.90±0.25b |
| Test material | | | | | | | |
| BHe (400
mg/kg) | 27.89±0.60 | 31.03±0.63b | 28.15±0.69b | 40.81±0.92b,c | 3.14±0.05b | 12.66±1.03b,c | 3.90±0.22b |
| BHe (200
mg/kg) | 27.85±0.74 | 31.03±0.75b | 28.36±0.62b | 44.51±1.79b-d | 3.18±0.20b | 16.15±1.81b-d | 3.86±0.25b |
| BHe (100
mg/kg) | 27.89±0.82 | 31.01±0.77b | 28.20±1.10b | 46.54±3.39b-d | 3.13±0.15b | 18.34±2.71b-d | 3.89±0.23b |
The absolute liver weights also exhibited a
significant (P<0.05) increase in the HFD control mice compared
with in the healthy control mice. The increase in absolute liver
weight was normalized to that of HFD control mice for all
treatments. Specifically, all BHe-treated mice also exhibited
definitive dose-dependent decreases in the absolute liver weight
compared with in the HFD control mice. However, no significant
changes in the relative liver weights were observed in any HFD-fed
mice compared with in the intact control, and the changes in the
relative liver weights were not significant (Table III). The absolute liver weight
in the HFD control group was increased by 65.35% compared with in
the intact control; however, the changes in the metformin (250
mg/kg) and BHe (400, 200 and 100 mg/kg)-treated mice compared with
in the HFD control mice were −20.23, −10.01, −14.93 and −20.33%,
respectively. The relative liver weight in the HFD control group
was altered by −3.77% compared with in the intact control; however,
the changes in the metformin (250 mg/kg) and BHe (400, 200 and 100
mg/kg)-treated mice compared with in the HFD control group were
1.58, 0.52, −0.91 and 1.03%, respectively.
| Table IIIChanges in absolute and relative
organ weights in NFD- or HFD-fed mice. |
Table III
Changes in absolute and relative
organ weights in NFD- or HFD-fed mice.
| Group | Absolute organ
weights, g
| Relative organ
weights (% of body weights)
|
|---|
| Liver | Periovarian fat
pads | Abdominal wall fat
pads | Liver | Periovarian fat
pads | Abdominal wall fat
pads |
|---|
| Control | | | | | | |
| Intact | 1.073±0.096b,c | 0.089±0.027b | 0.076±0.031b,c | 3.563±0.300 | 0.297±0.094b | 0.252±0.104b |
| HFD | 1.774±0.085a,c | 0.775±0.110a,c | 0.564±0.105a,c | 3.429±0.140 | 1.500±0.226a,c | 1.091±0.208a,c |
| Metformin (250
mg/kg) | 1.415±0.090a,b | 0.220±0.069b | 0.194±0.052a,b | 3.483±0.246 | 0.541±0.172b | 0.479±0.134b |
| Test material | | | | | | |
| BHe (400
mg/kg) | 1.413±0.028a,b | 0.236±0.054a,b | 0.217±0.092a,b | 3.464±0.098 | 0.577±0.129b | 0.533±0.235a,b |
| BHe (200
mg/kg) | 1.509±0.092a,b | 0.350±0.097a,b | 0.307±0.053a,b | 3.398±0.288 | 0.784±0.211a,b | 0.690±0.121a,b |
| BHe (100
mg/kg) | 1.596±0.061a-c | 0.498±0.130a-c | 0.377±0.073a-c | 3.446±0.291 | 1.077±0.314a-c | 0.813±0.162a-c |
The periovarian and abdominal wall-stored fat pad
relative and absolute weights in HFD control mice also exhibited
significant (P<0.05) increases compared with in the healthy
control mice. All BHe-treated mice exhibited definitive
dose-dependent decreases in the relative and absolute weights of
periovarian and abdominal wall-stored fat pads compared with in the
HFD control mice (Table III).
The weight of absolute periovarian fat pads in HFD control mice was
increased by 772.29% compared with in the intact control; however,
−71.65, −35.75, −54.92 and −69.61% decreases were observed in the
metformin (250 mg/kg) and BHe (400, 200 and 100 mg/kg)-treated mice
compared with in the HFD control group, respectively. The relative
weight of the periovarian fat pads in the HFD control mice was
increased by 405.35% compared with in the intact control mice.
However, they were decreased by −63.94, −28.18, −47.72 and −61.53%
in the metformin (250 mg/kg) and BHe (400, 200 and 100
mg/kg)-treated mice compared with in the HFD control mice,
respectively. The absolute weight of abdominal wall-stored fat pads
in HFD control mice was increased by 647.19% compared with in the
healthy control mice, but decreased by −65.57, −33.17, −45.62 and
−61.56% in the metformin (250 mg/kg) and BHe (400, 200 and 100
mg/kg)-treated mice compared with in the HFD control mice,
respectively. The relative weight of the abdominal wall-stored fat
pads in HFD control mice was increased by 333.39% in intact control
mice, but decreased by −56.12, −25.49, −36.76 and −51.12% in the
metformin (250 mg/kg) and BHe (400, 200 and 100 mg/kg)-treated mice
compared with in the HFD control mice, respectively.
Effects on food consumption
A significant (P<0.05) decrease (−16.37%) in MFDC
was observed after 84 days of administration in all HFD mice.
However, changes of 0.83, 0.85, −0.26 and 0.50% in the metformin
(250 mg/kg) and BHe (400, 200 and 100 mg/kg)-treated mice were
observed compared with in the HFD control, respectively. In
addition, no significant alteration in the MDFC compared with in
the HFD control mice was observed following any treatment (Table II).
Serum biochemical analysis
Significant increases in serum ALT, AST, LDH, ALP
and GGT levels were detected in the HFD control group. However,
decreases in the serum ALT, AST, ALP, GGT and LDH levels compared
with in the HFD control group were observed in all treatment
groups. Specifically, all BHe treatments resulted in dose-dependent
decreases in serum ALT, AST, ALP, LDH and GGT levels compared with
the levels in HFD control mice (Table IV). An increase of 203.82% in
serum AST levels was observed in the HFD control group, with
changes of −41.54, −18.00, −33.17 and −43.80% in the metformin (250
mg/kg) and BHe (400, 200 and 100 mg/kg)-treated groups,
respectively. An increase of 292.64% in the serum ALT levels in the
HFD control group was observed, with changes of −44.52, −19.35,
−35.54 and −45.01% in the metformin (250 mg/kg) and BHe (400, 200
and 100 mg/kg)-treated groups, respectively. The ALP levels in the
HFD control group were increased by 214.48%, with changes of
−28.67, −18.31, −24.01 and −31.91% in the metformin (250 mg/kg) and
BHe (400, 200 and 100 mg/kg)-treated groups, respectively.
Similarly, a 439.38% increase in the serum LDH levels was observed
in the HFD control mice, with changes of −53.28, −33.04, −48.74 and
−57.54% in the metformin (250 mg/kg) and BHe (400, 200 and 100
mg/kg)-treated mice, respectively. The serum GGT levels increased
by 426.67% in the HFD control group, with changes of −56.96,
−30.38, −43.04 and −58.23% in the metformin (250 mg/kg) and BHe
(400, 200 and 100 mg/kg)-treated groups, respectively.
| Table IVChanges in serum AST, ALT, ALP, LDH
and GGT levels in NFD- or HFD-fed mice. |
Table IV
Changes in serum AST, ALT, ALP, LDH
and GGT levels in NFD- or HFD-fed mice.
| Group | AST, IU/l | ALT, IU/l | ALP, IU/l | LDH, IU/l | GGT, IU/l |
|---|
| Control | | | | | |
| Intact | 65.38±12.93b,c | 32.25±10.71b,c | 72.50±17.06b,c |
600.63±258.42b,c | 1.88±0.83b |
| HFD |
198.63±18.10a,c |
126.63±18.32a,c |
228.00±33.72a,c |
3,239.63±912.22a,c | 9.88±2.03a,c |
| Metformin (250
mg/kg) |
116.13±26.18a,b | 70.25±21.63a,b |
162.63±25.91a,b |
1,513.50±462.28a,b | 4.25±1.67b |
| Test material | | | | | |
| BHe (400
mg/kg) |
111.63±17.18a,b | 69.63±14.17a,b |
155.25±21.37a,b |
1,375.50±363.23a,b | 4.13±1.36b |
| BHe (200
mg/kg) |
132.75±17.73a,b | 81.63±13.67a,b |
173.25±17.19a,b |
1,660.50±283.42a,b | 5.63±1.51a,b |
| BHe (100
mg/kg) |
162.88±13.60a-c |
102.13±14.23a,c |
186.25±18.98a,b |
2,169.25±342.83a,b | 6.88±1.73a-c |
Significant increases in serum TC and TG levels were
also observed in the HFD control group compared with in the healthy
control mice. However, significant decreases in the serum TC, TG
and LDL levels were observed in all treatment groups compared with
in the HFD control. Specifically, all BHe-treated mice also
exhibited a dose-dependent decrease in the serum TG, TC and LDL
levels compared with in the HFD control group (Table V). An increase of 171.96% was
observed in the TC levels, with changes of −40.88, −25.53, −30.97
and −40.44% in the metformin (250 mg/kg) and BHe (400, 200 and 100
mg/kg)-treated groups, respectively. An increase of 246.94% was
observed in the TG levels in the HFD control group, with changes of
−44.59, −21.12, −35.06 and −43.82% in the metformin (250 mg/kg) and
BHe (400, 200 and 100 mg/kg)-treated groups compared with in the
HFD control mice, respectively. Similarly, the serum LDL levels
were increased by 324.00% in the HFD control mice, but changes in
−53.58, −25.28, −40.57 and −53.02% were observed in the metformin
(250 mg/kg) and BHe (400, 200 and 100 mg/kg)-treated groups
compared with in the HFD control mice, respectively.
| Table VChanges in serum lipid contents and
zymogen granules in NFD- or HFD-fed mice. |
Table V
Changes in serum lipid contents and
zymogen granules in NFD- or HFD-fed mice.
| Total
cholesterol, |
Triacylglycerol, | Low-density | High-density | Zymogen
granules, |
|---|
| Groups | mg/dl | mg/dl | lipoprotein,
mg/dl | lipoprotein,
mg/dl | %/mm2 of
exocrine |
|---|
| Control | | | | | |
| Intact |
103.88±19.58b,c | 61.25±12.73b,c | 15.63±3.38b | 96.13±19.90b,c | 44.93±5.19b,c |
| HFD |
282.50±29.32a,c |
212.50±29.77a,c | 66.25±11.54a,c | 21.50±10.99a,c | 13.99±2.95a,c |
| Metformin (250
mg/kg) |
167.00±15.98a,b |
117.75±22.58a,b | 30.75±10.11b | 63.88±19.21a,b | 32.44±5.92a,b |
| Test material | | | | | |
| BHe (400
mg/kg) |
168.25±34.08a,b |
119.38±26.50a,b | 31.13±10.58a,b | 60.50±15.73a,b | 35.82±5.46a,b |
| BHe (200
mg/kg) |
195.00±24.88a,b |
138.00±25.53a,b | 39.38±10.25a,b | 52.00±10.39a,b | 28.44±7.38a,b |
| BHe (100
mg/kg) |
210.38±23.77a-c |
167.63±21.25a-c | 49.50±10.20a-c | 40.38±10.47a,c | 24.77±5.02a,b |
A significant decrease in serum HDL levels was
observed in the HFD control group compared with in the healthy
control mice. However, a significant increase in the serum HDL
levels was observed in all treatment groups compared with in the
HFD control. Specifically, all BHe-treated mice also exhibited
clear dose-dependent increases in serum HDL levels compared with in
the BHe (400 mg/kg) and metformin (250 mg/kg)-treated mice
(Table V). The serum HDL levels
were changed by −77.63% in the HFD control mice, with 197.09,
87.79, 141.86 and 181.40% in the metformin (250 mg/kg) and BHe
(400, 200 and 100 mg/kg)-treated group compared with in the HFD
control mice, respectively.
Fecal biochemical analysis
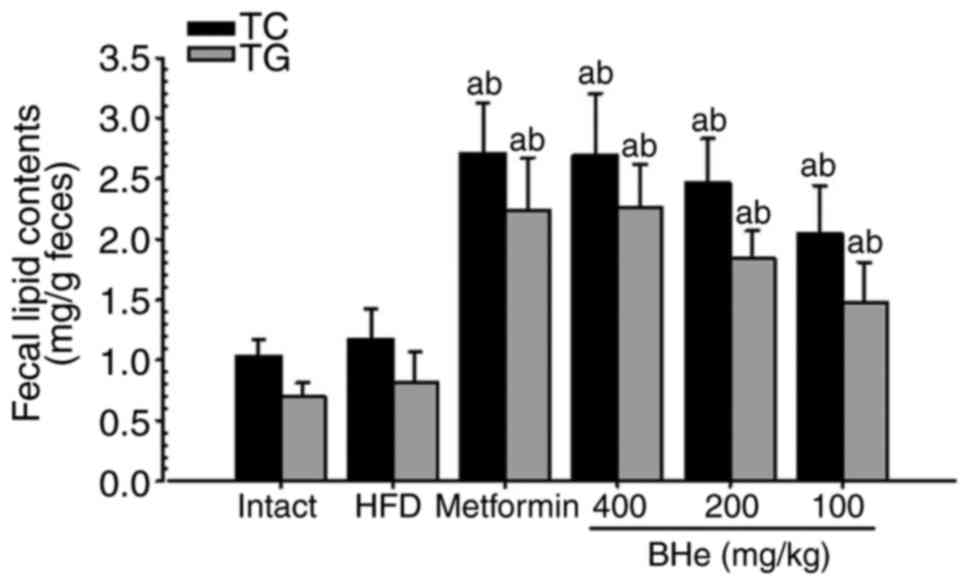
A significant increase in the fecal TC and TG levels
was observed in all treatment groups; however, the changes in the
HFD control group were not significant. Specifically, all
BHe-treated groups exhibited a clear dose-dependent increase in the
fecal TC and TG levels compared with in the HFD control group
(Fig. 2). The fecal TC content
increased by 13.04% in the HFD control group, with changes of
131.20, 74.57, 110.26 and 130.34% observed in metformin (250 mg/kg)
and BHe (400, 200 and 100 mg/kg)-treated groups compared with in
the HFD control group, respectively. The fecal TG content was
increased by 16.25% in the HFD control group, with changes of
174.65, 81.57, 127.04 and 177.57% observed in the metformin (250
mg/kg) and BHe (400, 200 and 100 mg/kg)-treated groups,
respectively.
Effects on lipid peroxidation and the
antioxidant defense system
A significant (P<0.05) increase in liver lipid
peroxidation (hepatic MDA content) was observed in the HFD control
group compared with in the healthy control mice. However, the
changes were significantly normalized by all treatments.
Specifically, all BHe treatments resulted in noticeable
dose-dependent changes in the hepatic MDA content compared with
those of the HFD control group (Table VI). The hepatic MDA content in
the HFD control group was 466.75% compared with in the healthy
control group, with changes of −56.55, −29.82, −44.13 and −58.57%
observed in the metformin (250 mg/kg) and BHe (400, 200 and 100
mg/kg)-treated groups, respectively, compared with in the HFD
control mice.
| Table VIChanges in the liver lipid
peroxidation and antioxidant defense systems in NFD- or HFD-fed
mice. |
Table VI
Changes in the liver lipid
peroxidation and antioxidant defense systems in NFD- or HFD-fed
mice.
| Group | Lipid peroxidation
| Antioxidant defense
system
|
|---|
| Malondialdehyde,
nM/mg tissue | Glutathione, μM/mg
tissue | Catalase, U/mg
tissue | SOD, U/mg
tissue |
|---|
| Control | | | | |
| Intact | 9.66±3.22b,c | 56.47±14.77b,c | 58.77±13.89b,c | 8.38±1.84b,c |
| HFD | 54.74±11.12a,c | 10.04±3.60a,c | 11.26±2.74a,c | 0.75±0.29a,c |
| Metformin (250
mg/kg) | 23.79±6.63a,b | 30.49±14.70a,b | 38.77±10.01a,b | 4.24±1.47a,b |
| Test material | | | | |
| BHe (400
mg/kg) | 22.68±3.77a,b | 32.25±10.14a,b | 40.67±15.90b | 4.37±1.25a,b |
| BHe (200
mg/kg) | 30.58±10.14a,b | 25.44±11.94a | 31.71±11.73a,b | 3.08±0.77a,b |
| BHe (100
mg/kg) | 38.42±10.33a-c | 20.34±8.49a | 24.95±11.54a | 2.32±1.02a,c |
Significant (P<0.05) decreases in hepatic GSH,
SOD, and CAT were observed in the HFD control group compared with
in the intact control. However, the hepatic GSH content markedly
increased in all treatment groups, including BHe (200 mg/kg).
Specifically, all BHe-treated mice exhibited a definitive
dose-dependent increase in hepatic GSH content compared with in the
HFD control group (Table VI).
The hepatic GSH content was decreased by 82.21% in the HFD control
group, with changes of 203.61, 102.54, 153.25 and 221.05% in the
metformin (250 mg/kg) and BHe (400, 200 and 100 mg/kg)-treated
groups compared with in the HFD control mice, respectively. The
hepatic CAT activity was decreased by −80.84% in the HFD control
group, with changes of 244.38, 121.64, 181.63 and 261.26% in the
metformin (250 mg/kg) and BHe (400, 200 and 100 mg/kg)-treated
mice, respectively. The hepatic SOD activities decreased by −91.11%
in the HFD control group, with changes of 469.13, 211.24, 313.59
and 485.91% in the metformin (250 mg/kg) and BHe (400, 200 and 100
mg/kg)-treated groups, respectively.
Effects on the body fat density and total
and abdominal fat mass
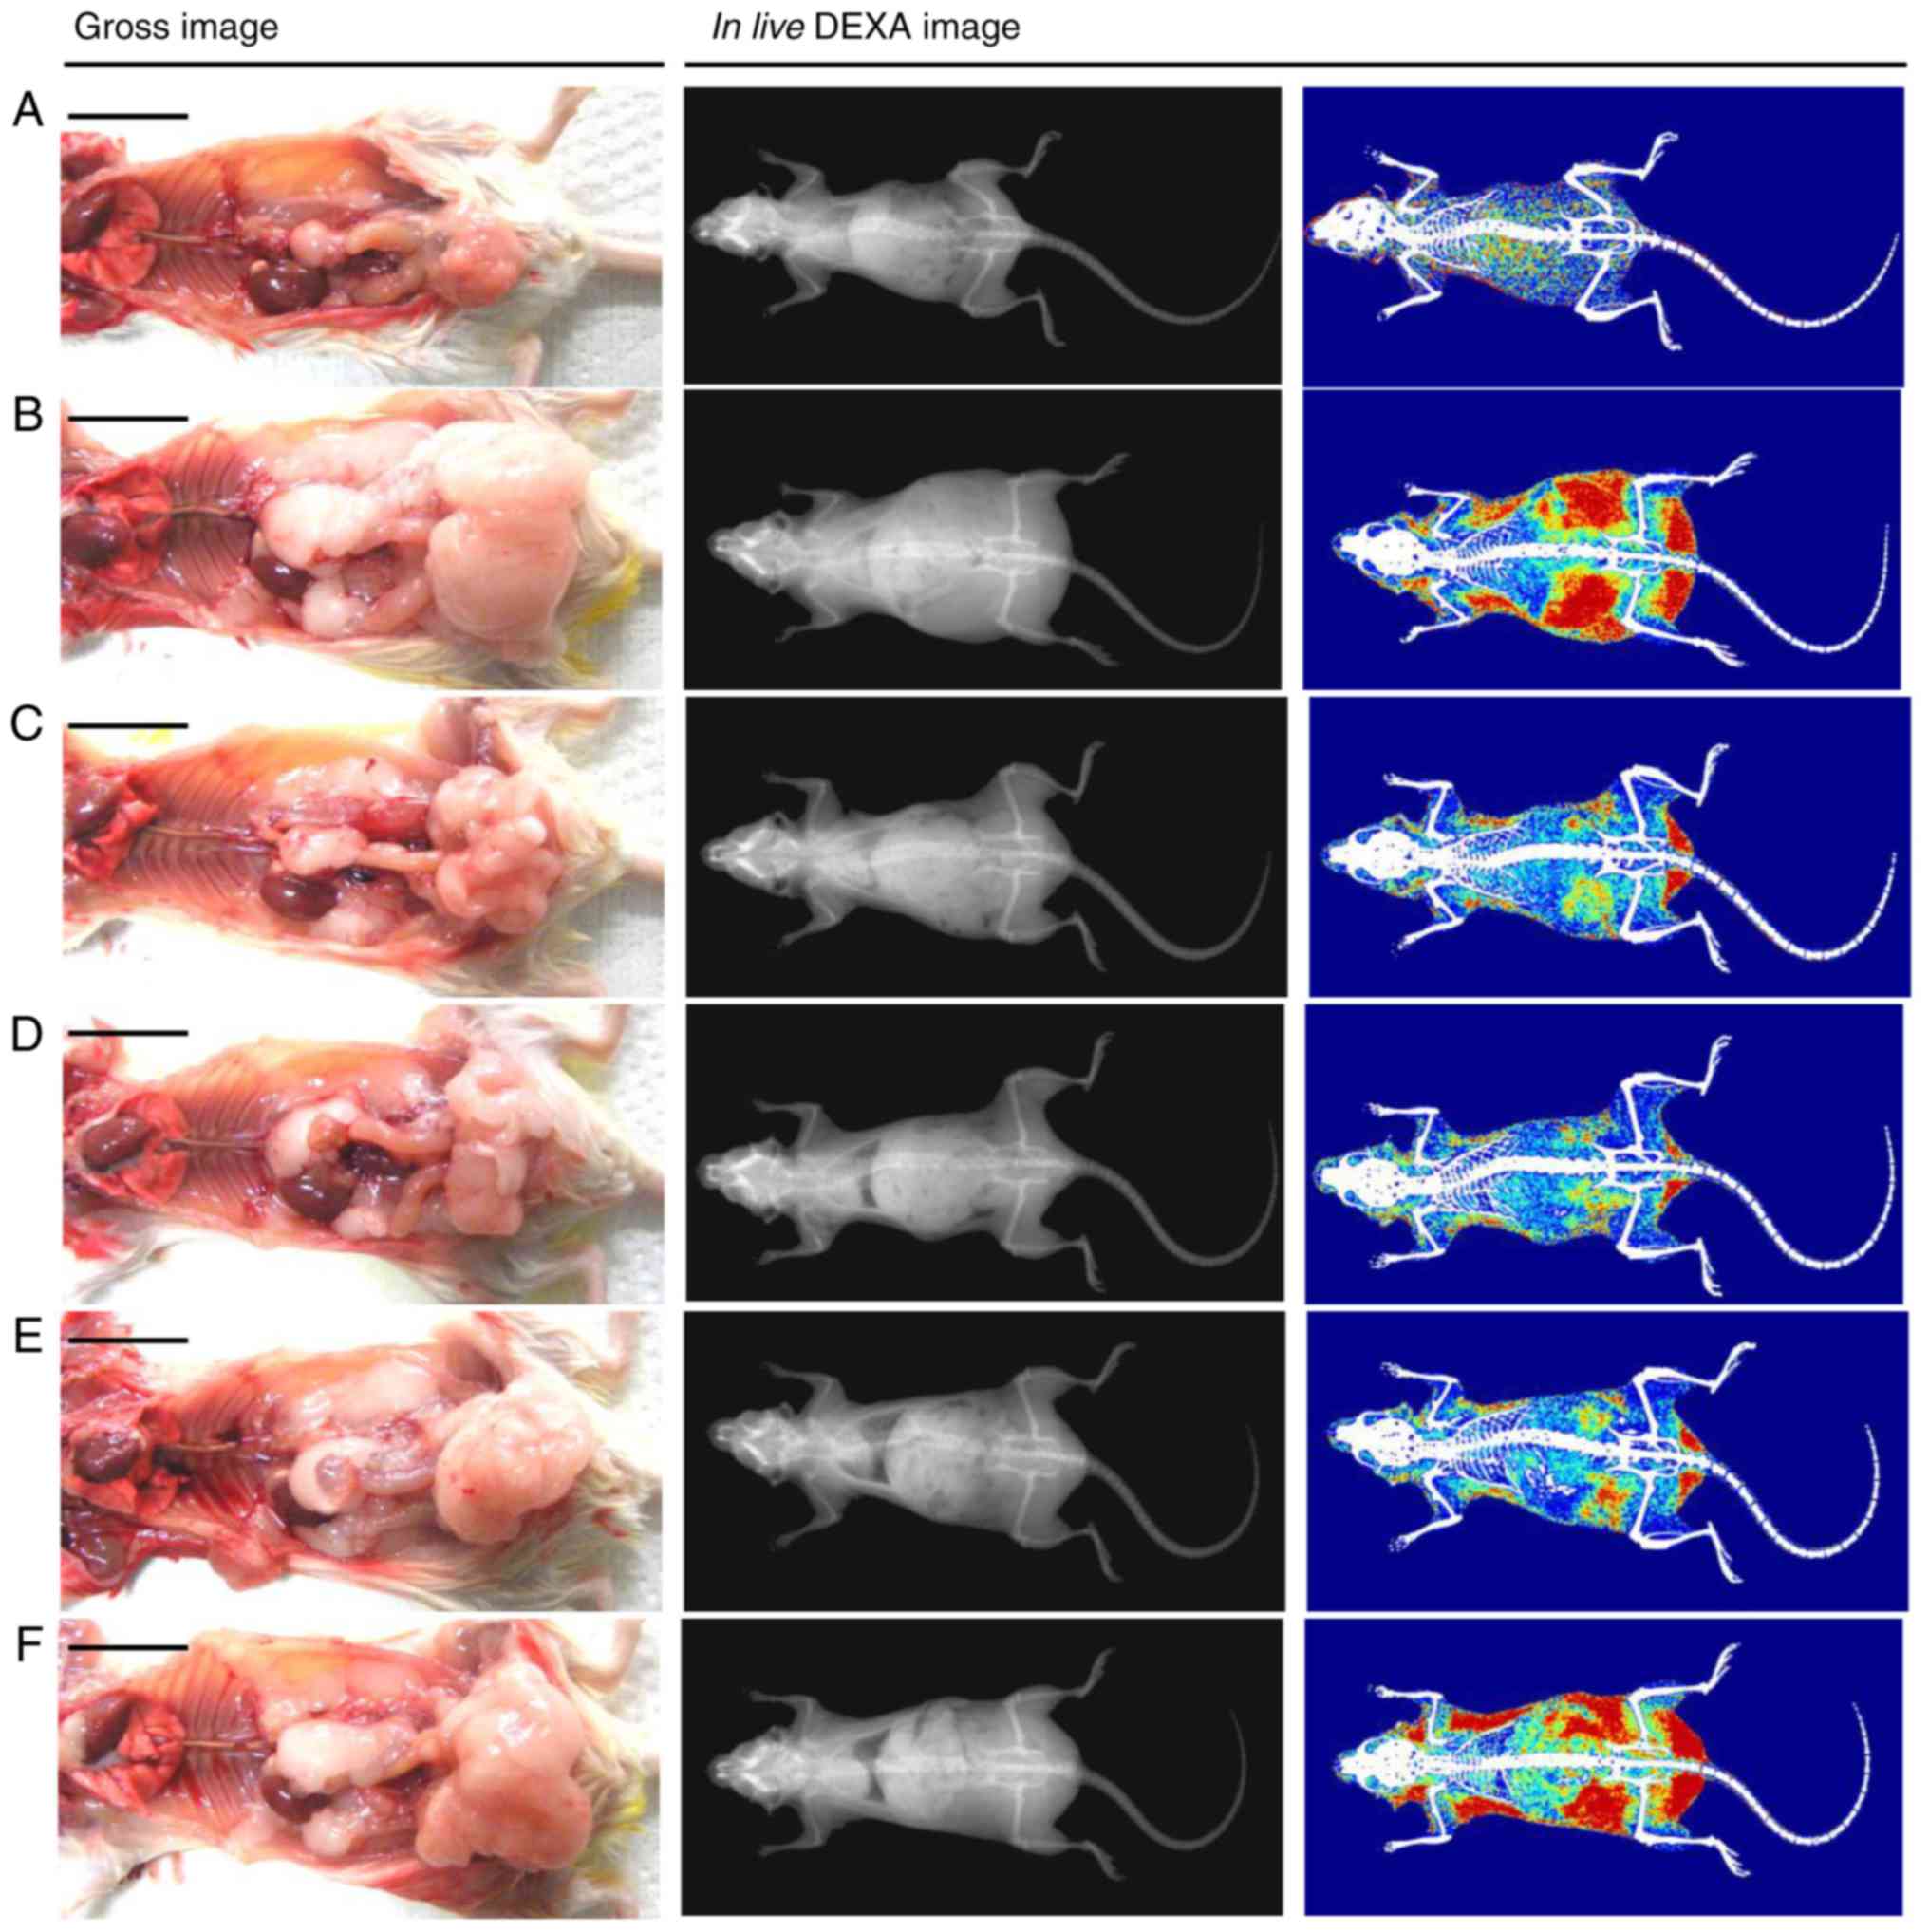
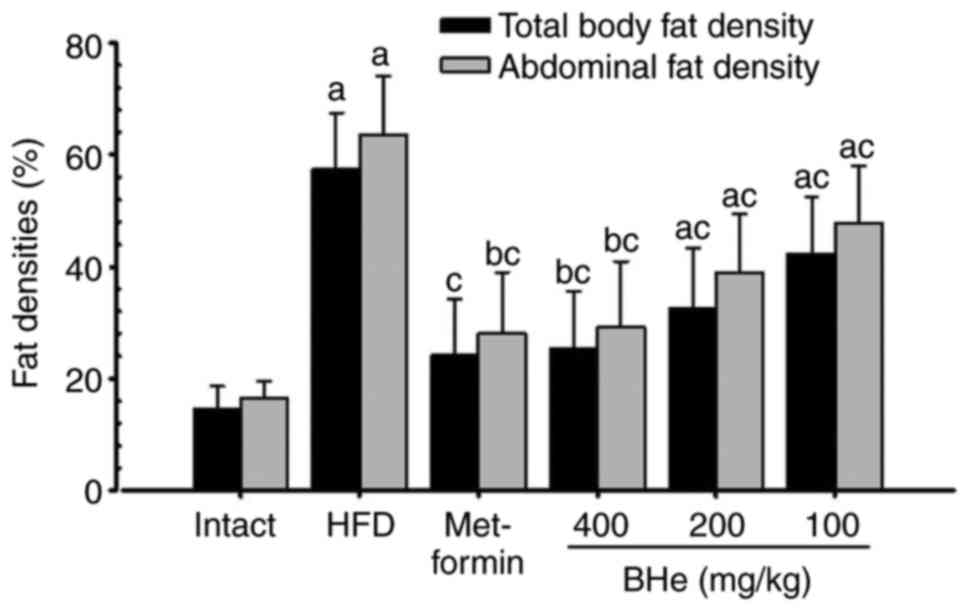
Significant (P<0.05) increases in the total body
fat and abdominal fat density was observed in the HFD control mice
compared with in the intact control, whereas a significant
(P<0.05) decrease in the total body and abdominal fat density
was observed in all treatment groups following analysis via live
DEXA. Specifically, all doses of BHe resulted in clear
dose-dependent decreases in the total body and abdominal fat
density compared with in the HFD control mice (Figs. 3 and 4). The mean total body fat density was
increased by 295.14% in the HFD control group, with changes of
−58.03, −26.29, −43.12 and −56.10% in the metformin (250 mg/kg) and
BHe (400, 200 and 100 mg/kg)-treated groups, respectively. A-55.96%
decrease in the mean abdominal fat density was observed in the HFD
control group, with changes of −55.96, −24.78, −38.78 and −54.12%
in the metformin (250 mg/kg) and BHe (400, 200 and 100
mg/kg)-treated groups, respectively.
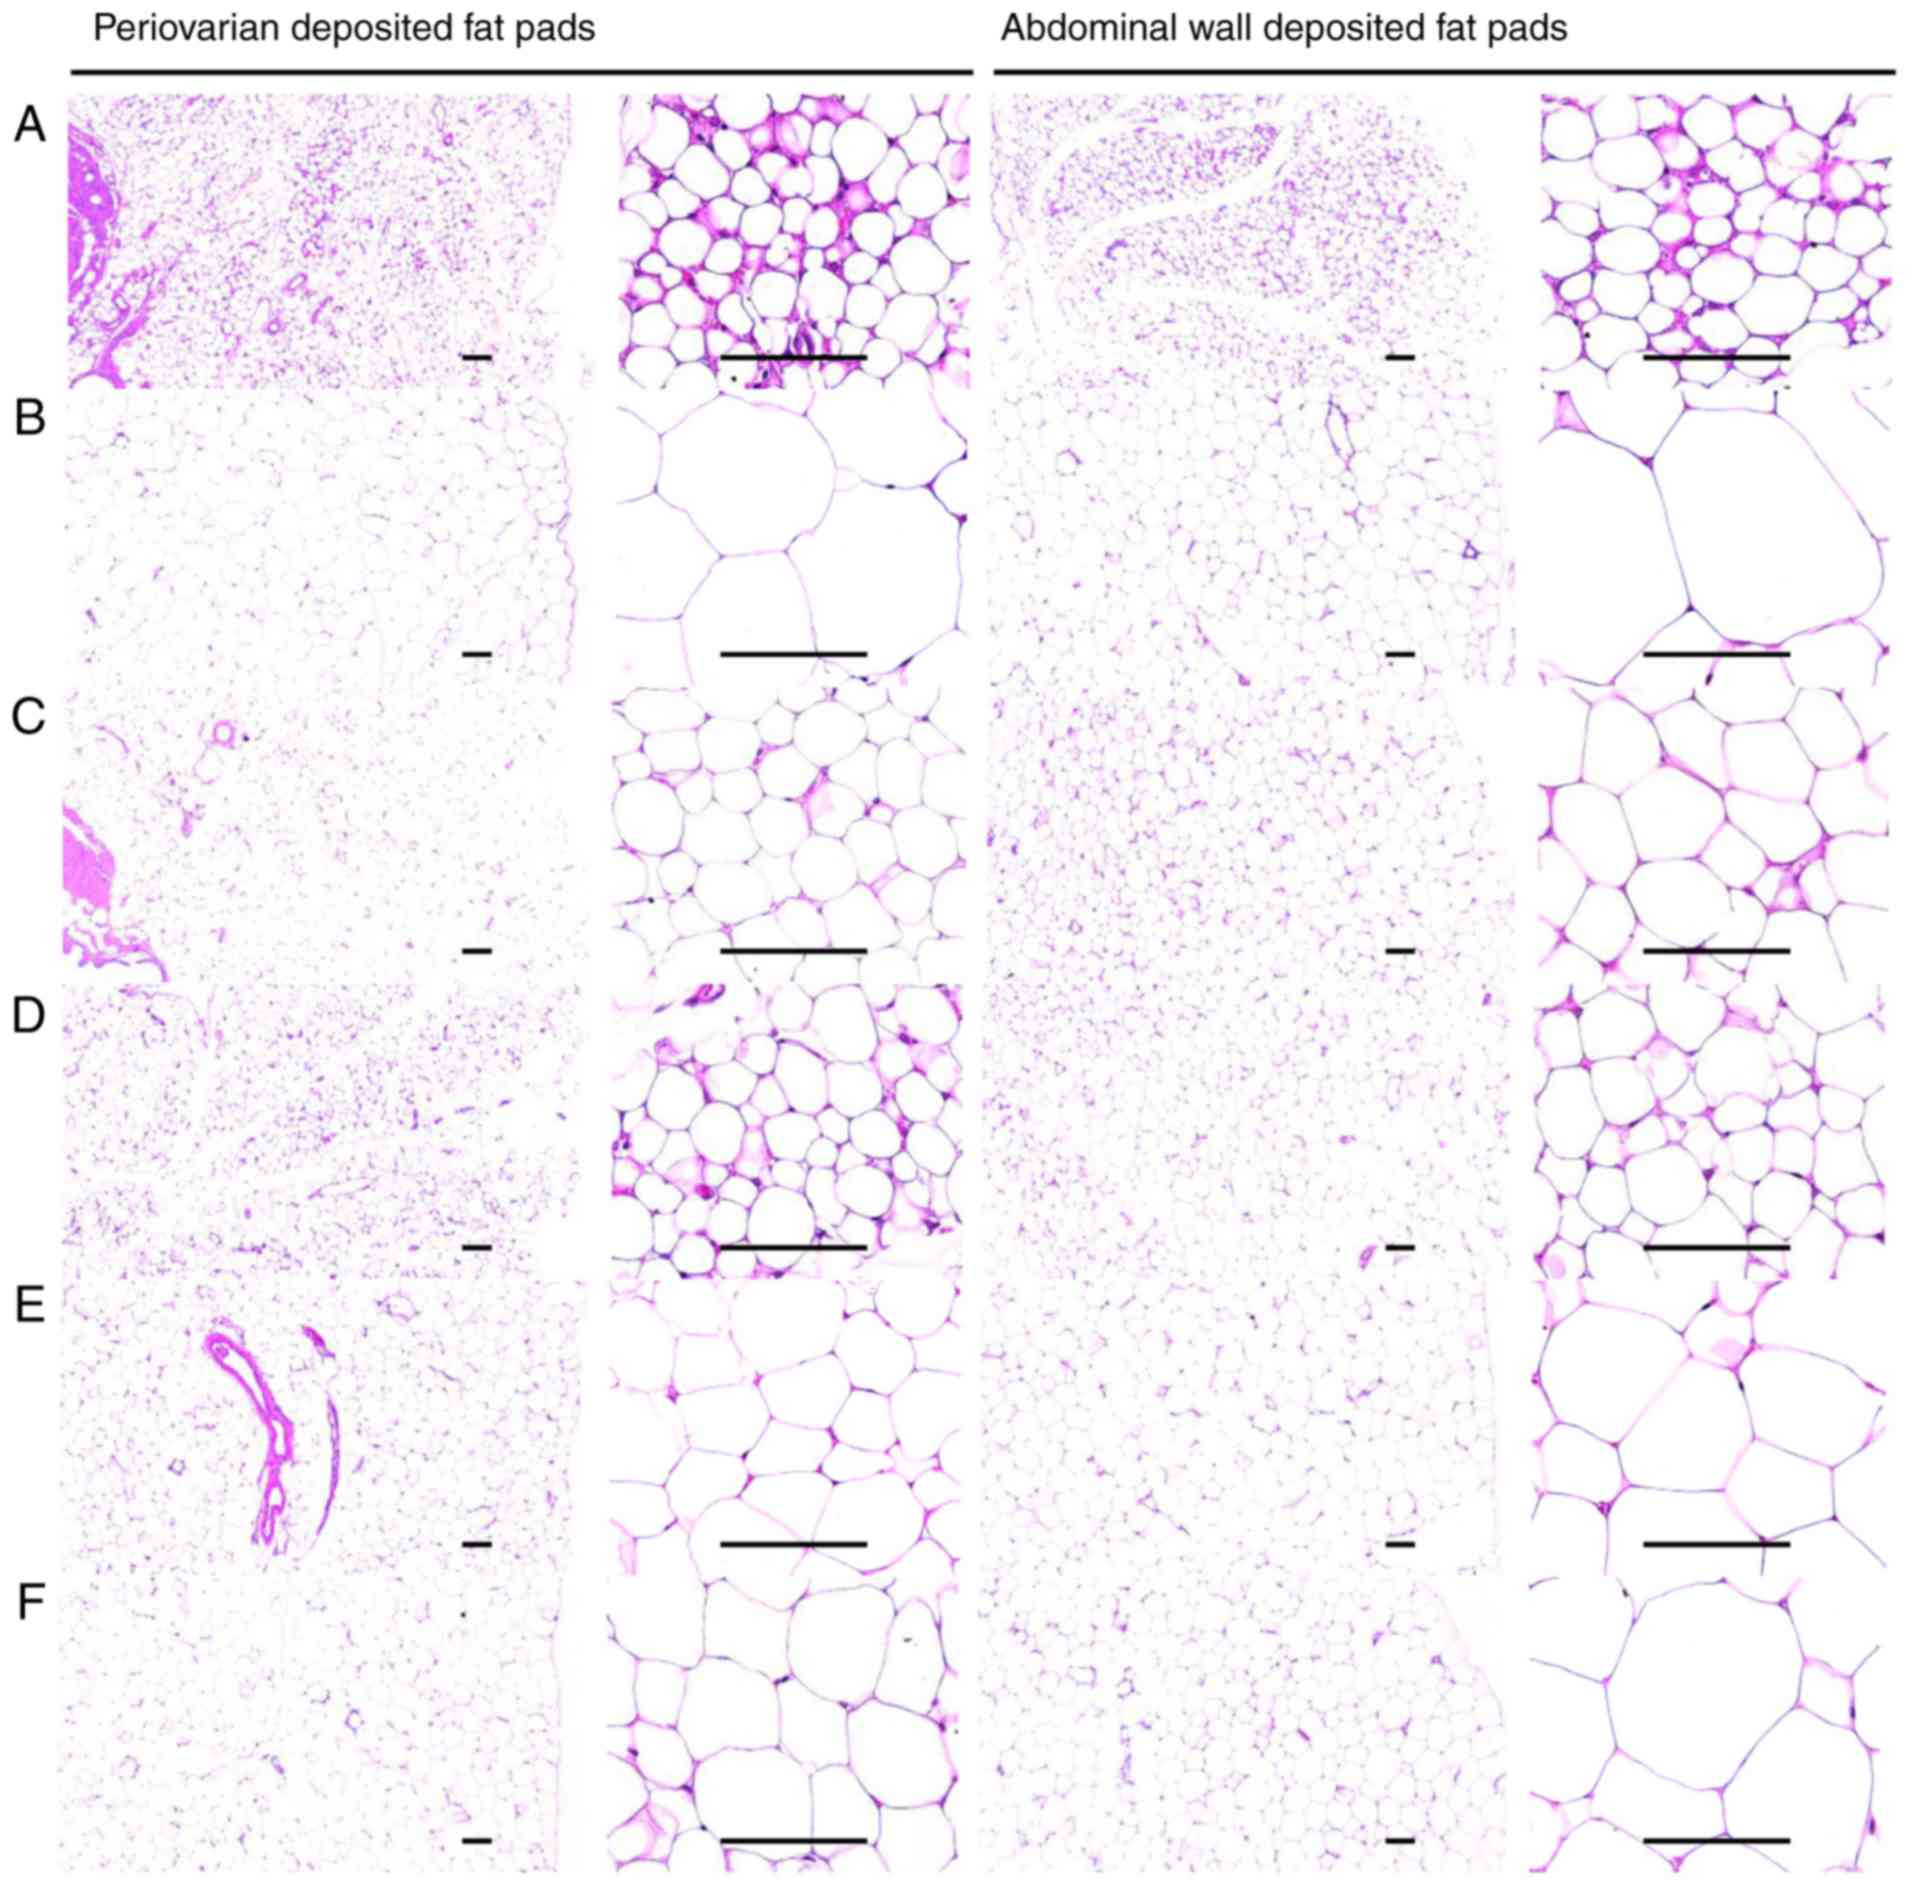
Effects on the adipocyte histopathology
analysis
A significant (P<0.05) increase in the thickness
of the periovarian fat pad and abdominal white adipocyte, and
diameter of each stored fat pad was observed in the HFD control
group. However, the fat deposition and hypertrophy of adipocytes
were significantly (P<0.05) inhibited by all treatments compared
with in the HFD control mice. In particular, all BHe-treated mice
exhibited clear dose-dependent decreases in the periovarian and
abdominal wall-stored white adipocyte thickness, and diameters of
stored fat pads compared with those of the HFD control mice
(Table VII; Fig. 5).
| Table VIIChanges in the
histopathology-histomorphometry of the periovarian- and abdominal
wall-deposited fat pads in NFD- or HFD-fed mice. |
Table VII
Changes in the
histopathology-histomorphometry of the periovarian- and abdominal
wall-deposited fat pads in NFD- or HFD-fed mice.
| Group | Periovarian fat
pads
| Abdominal wall fat
pads
|
|---|
| Thickness, mm | Adipocyte diameter,
µm | Thickness, mm | Adipocyte diameter,
µm |
|---|
| Control | | | | |
| Intact | 2.20±0.66b | 29.81±5.94b | 2.03±0.67b | 37.24±4.87b,c |
| HFD | 4.50±0.46a,c |
120.44±12.38a,c | 5.32±1.14a,c |
132.47±14.58a,c |
| Metformin (250
mg/kg) | 2.76±0.48b | 46.02±10.22b | 3.03±0.85b | 66.17±12.75a,b |
| Test material | | | | |
| BHe (400
mg/kg) | 2.81±0.54b | 43.03±13.29b | 3.14±0.58b | 60.96±21.41b |
| BHe (200
mg/kg) | 3.46±0.50a,b | 55.99±11.89a,b | 3.60±0.41a,b | 75.16±18.32a,b |
| BHe (100
mg/kg) | 3.78±0.49a,c | 64.77±15.83a-c | 3.79±0.70a,b | 83.82±18.97a,b |
A 104.72% increase in thickness of the stored
periovarian fat pad in the HFD control groups was observed compared
with in the healthy control, with changes of −38.57, −15.98, −23.09
and −37.65% in the metformin (250 mg/kg) and BHe (400, 200 and 100
mg/kg)-treated groups, respectively, compared with in the HFD
control mice. A 304.03% increase in the mean diameters of
periovarian white adipocyte tissues in the HFD control group was
observed, with changes of −61.79, −46.22, −53.51 and −64.27% in the
metformin (250 mg/kg) and BHe (400, 200 and 100 mg/kg)-treated
groups, respectively. An increase of 161.95% in the thickness of
the abdominal wall-stored fat pads was observed in the HFD control
groups, with changes of −43.09, −28.73, −32.28 and −40.97% in the
metformin (250 mg/kg) and BHe (400, 200 and 100 mg/kg)-treated
groups, respectively. The mean diameters of the abdominal
wall-stored fat pad white adipocyte tissues in the HFD control
group were increased by 255.71% compared with in the healthy
control mice, with changes of −50.05, −36.73, −43.27 and −53.98% in
the metformin (250 mg/kg) and BHe (400, 200 and 100 mg/kg)-treated
groups, respectively, compared with in the HFD control mice.
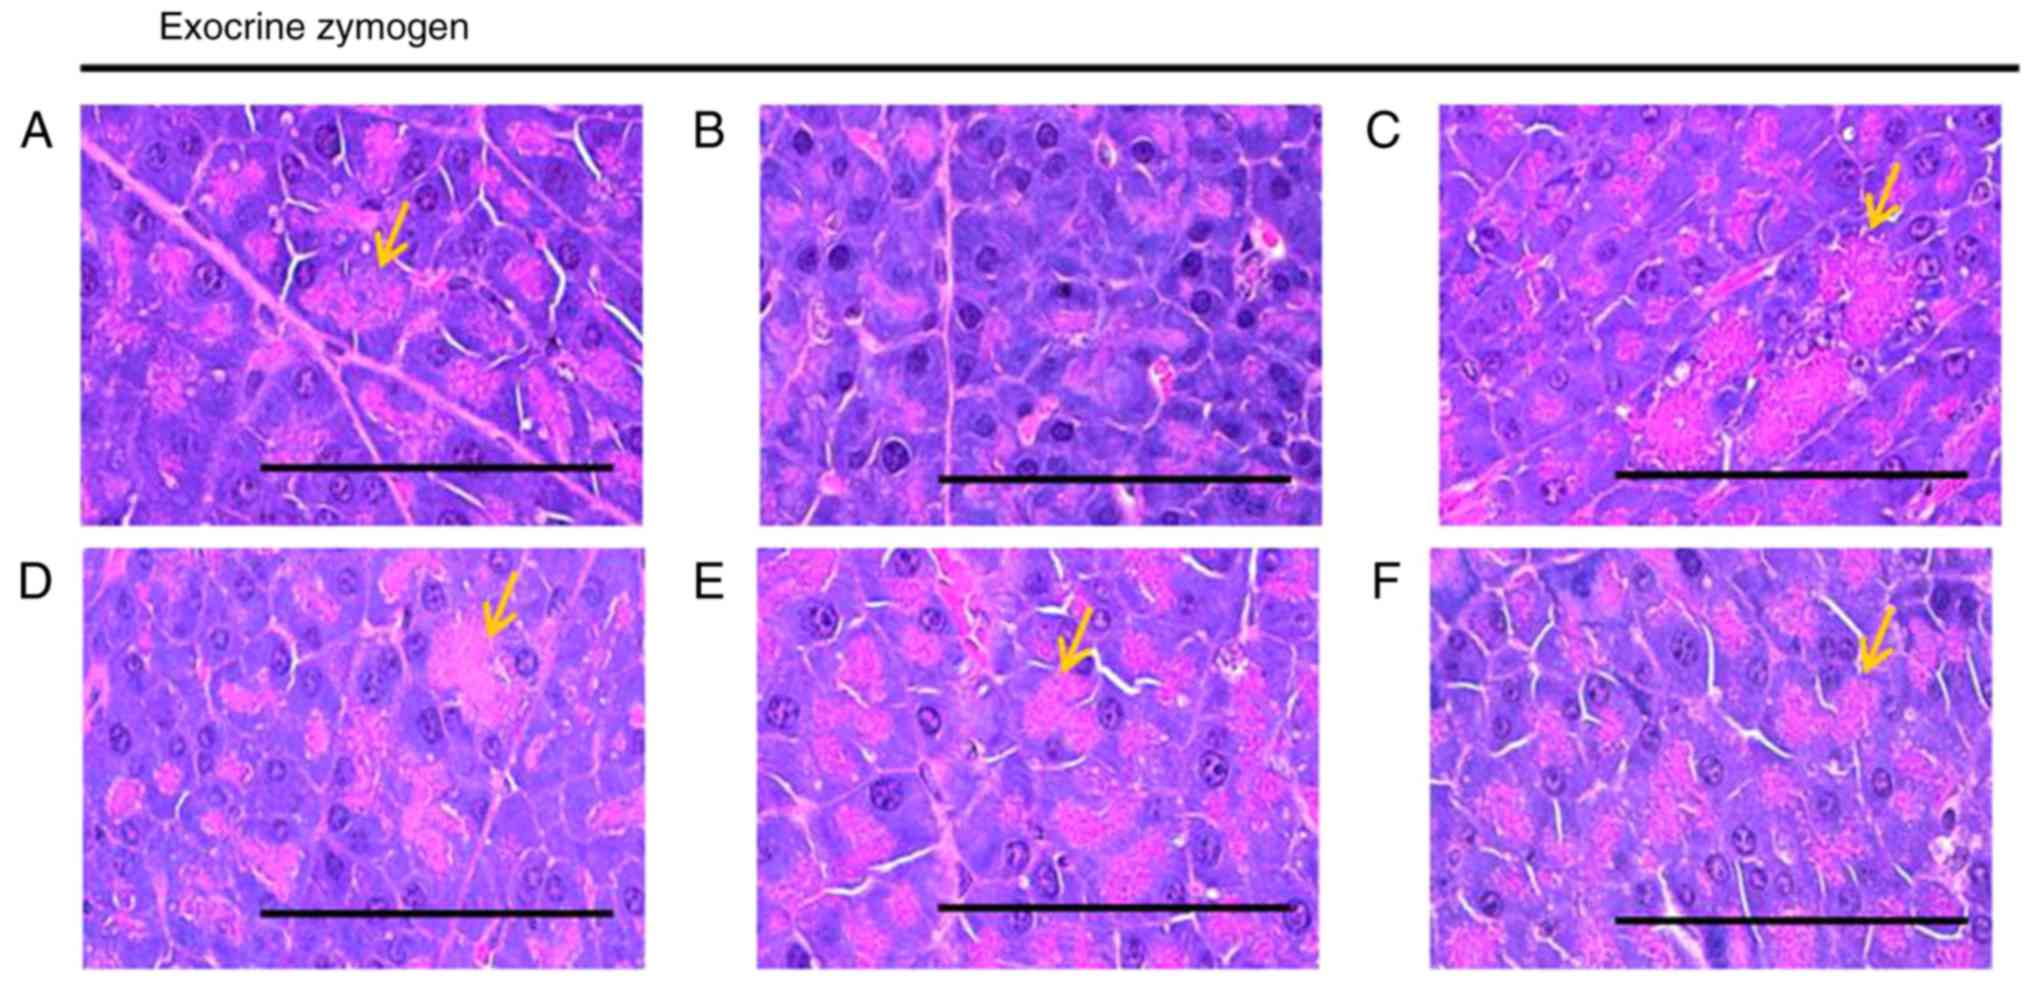
Effects on the exocrine pancreas zymogen
granule content
A significant (P<0.05) decrease in the exocrine
pancreas zymogen granule content (the proportion of exocrine
pancreas occupied by zymogen granules) was observed in the HFD
control group, which resulted from the release of zymogen granules.
The exocrine pancreas zymogen granule content was significantly
(P<0.05) increased in all treatment groups compared with in the
HFD control mice. Specifically, all BHe treatments resulted in
clear dose-dependent increases in the proportion of the regions of
the exocrine pancreas occupied by zymogen granules compared with
that in the HFD control group (Table
V; Fig. 6). The proportion of
the regions of exocrine pancreas occupied by zymogen granules in
the HFD control groups decreased by −68.87% compared with in the
healthy control, with changes of 131.93, 77.07, 103.28 and 156.04%
in the metformin (250 mg/kg) and BHe (400, 200 and 100
mg/kg)-treated groups, respectively.
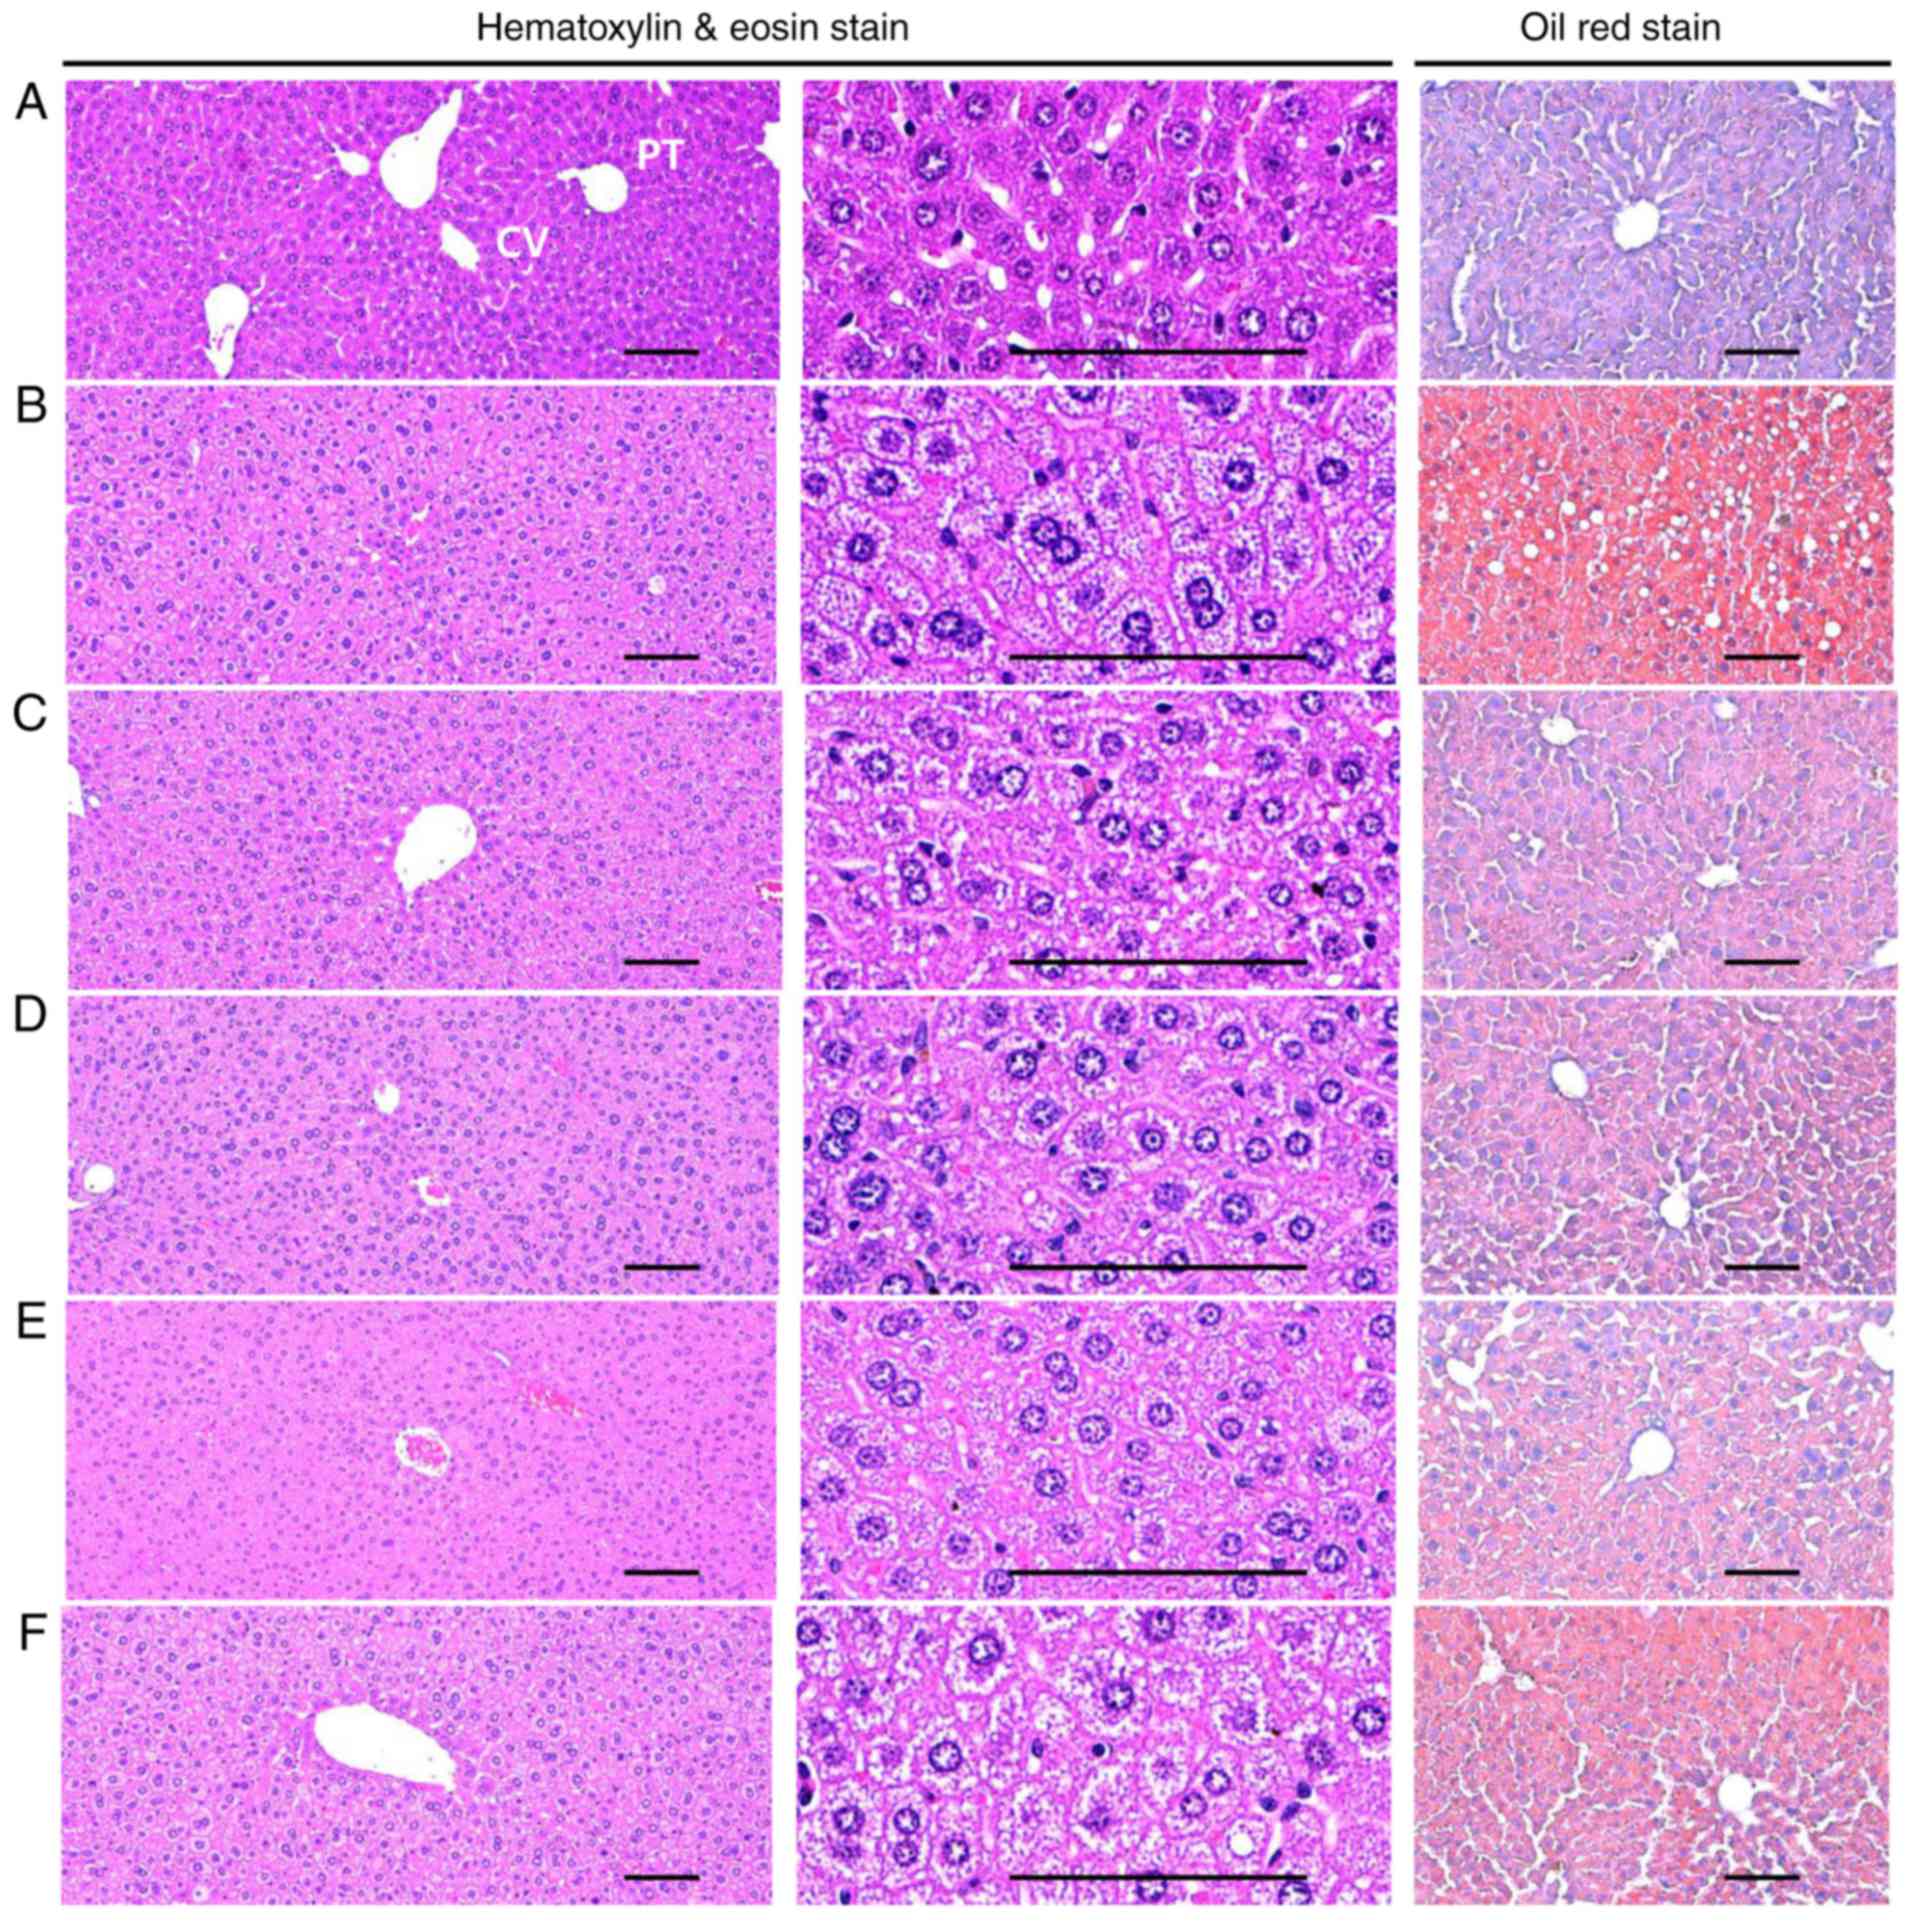
Effects on hepatocyte hypertrophy and
steatohepatitis
A significant (P<0.05) increase in the mean
diameter of the hepatocytes (hypertrophy) was observed in the HFD
control groups compared with in the healthy control group. However,
hypertrophy was markedly decreased in all treatment groups compared
with in the HFD control mice. Specifically, all BHe-treated mice
exhibited clear dose−dependent decreases in the hepatocyte
hypertrophies, the mean hepatocyte diameter, compared with in the
HFD control groups (Table
VIII; Fig. 7). A significant
increase of 156.79% in the mean diameter of hepatocytes in the HFD
control group was observed, with changes of −33.99, −20.38, −29.91
and −33.80% in the metformin (250 mg/kg) and BHe (400, 200 and 100
mg/kg)-treated groups, respectively.
| Table VIIIChanges in liver steatosis and mean
hepatocyte diameters in hepatic tissue of NFD- or HFD-fed mice. |
Table VIII
Changes in liver steatosis and mean
hepatocyte diameters in hepatic tissue of NFD- or HFD-fed mice.
| Group | Liver steatosis,
%/mm2 of hepatic tissues | Mean hepatocyte
diameter, µm/cell |
|---|
| Control | | |
| Intact | 7.20±2.87b,c | 13.36±1.04b,c |
| HFD | 78.84±10.03a,c | 34.30±2.65a,c |
| Metformin (250
mg/kg) | 45.65±10.12a,b | 22.64±3.75a,b |
| Test material | | |
| BHe (400
mg/kg) | 42.87±10.51a,b | 22.71±4.25a,b |
| BHe (200
mg/kg) | 53.03±10.05a,b | 24.04±4.66a,b |
| BHe (100
mg/kg) | 60.33±12.81a,b | 27.31±2.34a,b |
A significant (P<0.05) increase in
steatohepatitis (proportion of regions with fatty change in the
liver parenchyma) was also observed in the HFD control group
compared with in the healthy control group. However, the changes
were decreased to the level in the healthy control group by all the
test treatments. Specifically, all BHe-treated mice exhibited
dose-dependent decreases in the steatohepatitis area compared with
in the HFD control group (Table
VIII; Fig. 7). The
steatohepatitis area was increased by 995.16% in the HFD control
group, with changes of −42.09, −23.48, −32.74 and −45.62% in the
metformin (250 mg/kg) and BHe (400, 200 and 100 mg/kg)-treated
groups, respectively.
Effects on hepatic enzyme activity
Significant (P<0.05) decreases in hepatic GK,
G6Pase and PEPCK (the blood glucose-utilizing hepatic enzymes)
activities were observed in the HFD control groups, whereas changes
were increased to the level in the healthy control group by all
treatments. Specifically, all BHe-treated mice exhibited clear
dose-dependent increases in the hepatic GK, G6Pase and PEPCK
activity compared with in the HFD control group (Table IX). The hepatic GK activity in
the HFD control mice was altered by −69.17%, with changes of 91.80,
37.38, 50.05 and 90.34% in the metformin (250 mg/kg) and BHe (400,
200 and 100 mg/kg) −treated groups, respectively. The hepatic
G6Pase activity was increased by 129.69% in the HFD control group,
with changes of −44.32, −24.80, −33.68 and −42.39% in the metformin
(250 mg/kg) and BHe (400, 200 and 100 mg/kg)-treated groups,
respectively. The hepatic PEPCK activity increased by 294.52% in
the HFD control group, with changes of −60.67, −30.38, −45.89 and
−58.42% in the metformin (250 mg/kg) and BHe (400, 200 and 100
mg/kg)-treated groups, respectively.
| Table IXChanges in the hepatic
glucose-regulating enzyme activities in NFD or HFD-fed mice. |
Table IX
Changes in the hepatic
glucose-regulating enzyme activities in NFD or HFD-fed mice.
| Group | Glucokinase,
nM/min/mg protein |
Glucose-6-phosphatase, nM/min/mg
protein | PEPCK, nM/min/mg
protein |
|---|
| Control | | | |
| Intact | 3.91±1.17b,c |
118.63±19.56b | 1.51±0.47b |
| HFD | 1.20±0.32a,c |
272.48±33.18a,c | 5.94±0.87a,c |
| Metformin (250
mg/kg) | 2.31±0.41a,b |
151.73±29.80b | 2.34±0.45b |
| Test material | | | |
| BHe (400
mg/kg) | 2.29±0.47a,b |
156.97±18.57b | 2.47±0.43b |
| BHe (200
mg/kg) | 1.81±0.23a |
180.71±28.36a,b | 3.21±1.17a,b |
| BHe (100
mg/kg) | 1.65±0.22a |
204.90±26.70a-c | 4.13±1.00a-c |
Effects on expression of lipid
metabolism-associated genes
A significant (P<0.05) increase in mRNA
expression of hepatic ACC1, adipose tissue leptin, C/EBPα, C/EBPβ
and SREBP1c mRNA, and a significant (P<0.05) decrease in hepatic
AMPKα1, AMPKα2, adipose tissue UCP2 and adiponectin mRNA expression
was observed in the HFD control group; however, the changes were
decreased to the level in the healthy control in mRNA expression of
hepatic ACC1, adipose tissue leptin, C/EBPα, C/EBPβ and SREBP1c
mRNA and increased to the level in the healthy control in hepatic
AMPKα1, AMPKα2, adipose tissue UCP2 and adiponectin mRNA expression
by all treatments. Specifically, all doses of BHe (400, 200 and 100
mg/kg) resulted in definitive dose-dependent decreases in the mRNA
expression of hepatic ACC1, adipose tissue leptin, C/EBPα, C/EBPβ
and SREBP1c, and dose-dependent increases in mRNA expression of
hepatic AMPKα1, AMPKα2, adipose tissue UCP2 and adiponectin
compared with in the metformin (250 mg/kg)-treated group using
RT-qPCR analysis (Table X).
| Table XChanges in lipid
metabolism-associated gene expressions in NFD- or HFD-fed mice. |
Table X
Changes in lipid
metabolism-associated gene expressions in NFD- or HFD-fed mice.
| Group | Control
| BHe
|
|---|
| Intact | HFD | Metformin | 400 mg/kg | 200 mg/kg | 100 mg/kg |
|---|
| Hepatic tissue | | | | | | |
| ACC1 | 1.01±0.13b | 4.38±1.22a,c | 1.73±0.33b | 1.76±0.47b | 2.29±0.51a,b | 2.98±0.23a-c |
| AMPKα1 | 1.00±0.09b,c | 0.48±0.10a,c | 0.83±0.12a,b | 0.84±0.08b | 0.73±0.13a,b | 0.66±0.13a-c |
| AMPKα2 | 1.01±0.12b | 0.54±0.09a,c | 0.87±0.12b | 0.83±0.11a,b | 0.73±0.11a,b | 0.66±0.04a,c |
| Adipose tissue | | | | | | |
| Leptin | 0.96±0.08b | 5.94±1.08a,c | 1.89±0.76b | 1.95±0.50b | 2.79±0.72a,b | 3.64±0.89a-c |
| UCP2 | 0.99±0.06b,c | 0.24±0.07a,c | 0.61±0.12a,b | 0.58±0.18a,b | 0.47±0.12a,b | 0.39±0.08a,c |
| Adiponectin | 1.00±0.12b,c | 0.15±0.08a,c | 0.67±0.20a,b | 0.63±0.13a,b | 0.47±0.10a-c | 0.36±0.10a-c |
| C/EBPα | 1.00±0.08b,c | 1.89±0.23a,c | 1.27±0.14a,b | 1.28±0.12a,b | 1.35±0.11a,b | 1.46±0.15a,b |
| C/EBPβ | 0.98±0.06b,c | 3.23±0.72a,c | 1.62±0.33a,b | 1.52±0.33b | 1.89±0.26a,b | 2.28±0.37a-c |
| SREBP1c | 1.03±0.16b,c | 2.29±0.42a,c | 1.44±0.13a,b | 1.37±0.21b | 1.53±0.26a,b | 1.77±0.24a,b |
Discussion
The increased incidence of NAFLD, characterized by
the excess accumulation of fats in the liver, has paralleled the
global increase in the number of obese individuals (11,51,52). Increases in liver lipids in NAFLD,
such as diacylglycerols, TGs and ceramides, intensify hepatic
insulin resistance, and lead to cardiovascular complications and
Type 2 diabetes (53,54). Therefore, the identification of
strategies to limit excessive fat accumulation in the liver is
critical for the treatment of NAFLD and the prevention of the
associated health risks. Currently, there is no approved
pharmacological treatment for NAFLD (11). Several drug therapies have been
recommended for the management of NAFLD, but none has exhibited
sufficient efficacy on the entire scope of liver damage (55). Lifestyle mediations involving
weight loss and exercise are the only accepted treatments for this
disease, but are often difficult to maintain for patients with
NAFLD (11). There is therefore a
serious requirement to identify agents that are targeted at
increased hepatic lipids and are safe for long-term administration.
BH is a rich source of ascorbic acid and phenolic components,
principally anthocyanins, low-molecular-mass phenolic acids and
flavonoids with multiple biological activities, including marked
antioxidant activity (25,26).
In the present study, the potential beneficial hepatoprotective,
hypolipidemic and anti-obesity activities of BHe were investigated
in obese mice. In addition, liver antioxidant defense systems
(lipid peroxidation and MDA content) and antioxidant defense system
(GSH content, and CAT and SOD activity) were determined via lipid
metabolism-associated gene expression analysis (hepatic ACC1,
AMPKα1, AMPKα2, adipose tissue leptin, UCP2, adiponectin, C/EBPα,
C/EBPβ and SREBP1c) performed using RT-qPCR in addition to hepatic
glucose-regulating enzyme activities (PEPCK, GK and G6Pase).
After 91 days of consecutive supply of HFD, the HFD
control group exhibited clearly increased body weights and gains,
abdominal and body fat density, periovarian and abdominal
wall-stored fat pad weights, and serum AST, ALT, ALP, LDH, GGT, TG,
TC and LDL levels, and decreased HDL levels. In addition, increases
in dorsal and periovarian abdominal stored fat pad thicknesses,
steatohepatitis area, adipocyte hypertrophy, and hepatocyte
hypertrophy were detected. The majority of hepatocytes usually
exhibit steatosis. As certain hepatocytes in the present study were
ballooned and expanded by fat vacuoles, it would not be incorrect
to suggest that this was steatohepatitis. Histopathological
examination of the HFD control mice revealed decreased zymogen
content, increased hepatic lipid peroxidation and deterioration of
the endogenous antioxidant defense systems, including decreases in
liver CAT and SOD activities, and GSH content. There were also
decreases in glucose utilization associated with hepatic GK
activity, increases in hepatic gluconeogenesis-associated G6Pase
and PEPCK activities, increases in hepatic ACC1 mRNA expression,
decreases in hepatic AMPKα1 and AMPKα2 mRNA expression, increases
in periovarian adipose tissue leptin, C/EBPα, C/EBPβ and SREBP1c
mRNA expression, and decreases in adipose tissue UCP2 and
adiponectin mRNA expression, which suggested that HFD-induced AMPK
downregulation was dependent on the dysregulation of glucose and
lipid metabolism, and demonstrated the occurrence of oxidative
stress-associated diabetic hepatopathy (NAFLD) and hyperlipidemia
in the present study. However, all obesity and obesity-associated
complications, including NAFLD, were significantly and
dose-dependently repressed by 84 days of continuous oral treatment
with BHe. Treatment dramatically normalized the depletion of the
hepatic lipid peroxidation and the liver endogenous antioxidant
defense system, variations in hepatic glucose-regulated enzyme
activity, and changes in lipid metabolism-associated gene
expression, including the hepatic AMPKα1 and AMPKα2 mRNA
expression, which was altered in a dose-dependent manner.
Specifically, 400 mg/kg BHe consistently exhibited promising
inhibitory activities against obesity and its associated problems
(i.e. hepatic steatosis, NAFLD and hyper-lipidemia) through the
AMPK upregulation-mediated hepatic glucose enzyme activity and
lipid metabolism-associated gene expression, and antioxidant
defense system and pancreatic lipid digestion enzyme modulatory
activities compared with in the metformin-administered (250 mg/kg)
HFD mice. These results were considered to provide direct evidence
that BHe (400, 200 and 100 mg/kg) exhibited favorable anti-obesity
effects, including NAFLD refinement activities in HFD mice through
changes in AMPK upregulation-mediated hepatic glucose enzyme
activity and lipid metabolism-associated gene expression compared
with those induced by metformin treatment. Therefore, BHe may be a
promising refinement agent or medicinal food for the treatment of
Type 2 diabetes and its various complications, including NAFLD.
The mouse model of obesity was induced by the
provision of HFD to the animals, who subsequently exhibited the
features of hypolipidemia and hepatic steatosis. HFD-fed animals
exhibit mild obesity and hyperglycemia, and are appropriate for use
in the development of the preventive agents for metabolic syndromes
(9). In the present study, only
adapted animals with consistent body weight increases compared with
in the healthy control after 1 week of HFD adherence were selected.
Weight gain is an important indicator of obesity. Jung et al
(56) and Lee et al
(57) identified that weight gain
was a direct contributor to obesity. In this experiment, the
decreased body weight gain in the BHe-treated animals relative to
the HFD model provided a direct indication of the inhibitory effect
on weight gain.
The accumulation of or increase in fat storage in
the body is a key characteristic of cellular hypertrophy and
obesity, and is considered to be the main mode of enlargement of
the intra-abdominal adipose tissues in rodents (19,35). Adipose tissues are known to work
primarily as an energy storage organ, but also as a secretory and
endocrine organ (58). Changes in
the secretion, action of adipokines and mRNA expression during
obesity are markedly associated with the development of numerous
illnesses (19). In the present
study, consistent oral administration of BHe for 84 days markedly
and dose-dependently suppressed the build-up of adipose tissues
compared with the administration of metformin (250 mg/kg). These
results are considered reliable evidence that BHe (400, 200 and 100
mg/kg) exerts more favorable anti-obesity effects in HFD animals
compared with metformin (250 mg/kg), as identified using DEXA and
histopathological analysis.
It is generally considered that obesity can result
in various conditions, including a decrease in the number of
zymogen granules, acinar cell atrophy and the onset of pancreatic
steatosis (19). The increased
number of zymogen granules in the exocrine pancreatic acinar cells
indicates the development of various digestive enzymes,
particularly for the digestion of proteins and lipids (59). In the present study,
histopathological observations revealed a decrease in pancreatic
zymogen granules in the HFD control animals compared with the
healthy control, which induced lipid absorption-associated obesity.
However, the decreased zymogen depositions in the exocrine pancreas
were effectively and dose-dependently suppressed by treatment with
BHe; furthermore, the proper-ties of the 400 mg/kg BHe group were
comparable with those of the HFD control. These results are
considered to be direct evidence that BHe (400, 200 and 100 mg/kg)
exerts favorable anti-obesity properties in HFD animals and that
these effects might be mediated through the inhibition of lipid
digestion by limiting the production or discharge of pancreatic
enzymes in the metformin (250 mg/kg) and BHe (400 mg/kg)-treated
groups. BHe activated AMPK to decrease zymogen granules and
increase TC and TG in feces. This decreased the amount of lipid
(TG) absorbed in the body through a decrease in the secretion of
lipolytic enzyme and thus the increased fecal excretion of lipids
(TC and TG) during fat ingestion. These changes were responsible
for the anti-obesity effects. The decrease in zymogen deposition in
the exocrine pancreas might be due to the decrease in LDL synthesis
(a decrease in the degradation of fat to TC, TG and LDL) by the
increased AMPK activity. The direct or indirect suppression of the
release of zymogen granules is presumed to be the mechanism for the
decreased consumption of zymogen granules by BHe.
Increases in the digestive tract motility are also
linked with increases in fecal excretion and decreased body weight
(60,61). Noticeable dose-dependent increases
in fecal excretions, and fecal TG and TC content were induced by
treatment with BHe (400, 200 and 100 mg/kg) compared with metformin
(250 mg/kg). Thus, it is possible that BHe induced an increase in
digestive tract motility; however, detailed mechanistic studies are
required to clarify the precise anti-obesity mechanisms of BHe.
Similarly, other studies (62,63) have identified that treatment with
metformin decreased the absorption of bile salts, which could
increase the excretion of cholesterol. These effects of metformin
indicate that it directs the intestinal enterocytes to decrease the
active transfer of bile salts through a mechanism that is
independent of Na+/K+-ATPase activity. In the
present study, BHe (400, 200 and 100 mg/kg) decreased the TG and TC
content in fecal excretion in a dose-dependent manner. It has been
suggested that BHe may participate in the retardation of the bile
absorption-like metabolism of the metformin. A slight increase in
fecal TG and TC content was observed in the HFD control animals as
a secondary effect of HFD ingestion.
The prolonged progression of diabetes in HFD mice
generally causes hyperlipidemia (64). As the most serious effect of
hyperlipidemia is the increase in serum TG, TC and LDL levels, and
the decrease in HDL levels (35,56), the efficiency of hypolipidemic
agents is usually estimated on the basis of the decrease in serum
TG, TC and LDL levels and an increase in HDL levels (19,56). In the present study, BHe markedly
and dose-dependently decreased the serum TG, TC and LDL levels,
whereas an increase in the serum HDL levels was observed. These
results are considered direct evidence that the favorable
hypolipidemic properties exerted by BHe (400, 200 and 100 mg/kg) in
HFD animals may have been mediated by the inhibition of lipid
breakdown caused by decreased pancreatic enzyme production or
release. In addition, the favorable hypolipidemic effects of BHe in
HFD animals reflected a decrease in lipid absorption and lipid
propulsion in feces, occurring through the aforementioned
pancreatic digestive enzyme-moderating properties. Significant
dose-dependent increases in fecal TG and TC content occurred
following treatment with BHe compared with the HFD control, which
corresponded to the increases in zymogen granule deposition
observed in the histopathological examinations of the exocrine
pancreas.
As obesity develops, the liver weight increases
owing to abnormal glycosylation or fibrosis associated with changes
in hepatocyte hypertrophy and the hepatosteatosis, which results in
lipid storage in the cytoplasm, and increases in serum ALP, GGT,
AST, ALT and LDH levels (19,56). The improvement in these irregular
variations is a direct reflection of the amelioration of
hepatopathies (65). Serum AST
activities increase with hepatocellular necrosis and skeletal
muscle necrosis. No increase in serum ALT activity was observed,
whereas an increased serum AST activity indicated muscle necrosis.
However, the increase in AST activity is normally slow compared
with that of ALT owing to the liver damage and revealed whole cell
disturbance as it leaks only from the necrotic cells and not from
membrane instability (66). ALT
enters the bloodstream owing to the damage in liver cells and
circulates for a few days. The increase in serum AST and ALT levels
is a sensitive sign of active liver damage along with serum ALP,
LDH and GGT increases; however, it is difficult to clarify the
cause of liver damage (66). In
this experiment, BHe dose-dependently and effectively decreased
diabetic hepatopathies compared with metformin (250 mg/kg)
treatment. BHe suppressed the increases in the serum ALP, AST, LDH,
ALT and GGT content during steatohepatitis, the increase in liver
weight, and the associated hepatocyte hypertrophic variations at a
histopathological level. These results are considered clear
evidence that BHe exerted favorable and dose-dependent
hepatoprotective effects against HFD-induced NAFLD. Further
research is required to elucidate whether the primary reason for
the effect of BHe on obesity and NAFLD was the absorption blockage
of cholesterol or the increase in intestinal peristalsis.
To elucidate the mechanisms by which BHe exerts
anti-obesity and refinement activities on associated complications,
including NAFLD, the lipid metabolism and AMPK signaling in the
hepatic and adipose tissues was investigated. The activation of
AMPK in the two types of tissue is a major participant in the
regulation of lipids and glucose metabolism by limiting
lipogenesis, glucose production, and the stimulation of fatty acid
oxidation (12,19). Given the function of AMPK
signaling pathway-associated proteins in glucose and lipid
metabolism, it is important to identify and analyze their mRNA
expression in adipose tissues and the liver. Thus, it was
investigated whether BHe affected the mRNA expression of AMPK and
the AMPK signaling pathway-associated proteins in these tissues.
The gene expression analyses indicated that BHe significantly and
dose-dependently decreased the mRNA expression of lipogenic genes,
such as C/EBPα, C/EBPβ, SREBP1c and leptin, in the periovarian
adipose tissue of HFD mice. BHe also dose-dependently and
significantly increased mRNA expression of the
thermogenesis-associated protein UCP2 in adipose tissue, and AMPKα1
and AMPKα2 in hepatic tissue; these increases were comparable with
those induced by metformin (250 mg/kg). In addition, BHe
significantly and dose-dependently increased adiponectin mRNA
expression in adipose tissue; this effect was also comparable with
that of metformin (250 mg/kg). The effect of fat cell-derived
adiponectin on insulin-sensitizing and fatty acid-oxidizing action
is dependent on AMPK in the adipose tissue and liver (67). In the present study, it was
revealed that mRNA expression of AMPKα was decreased in the liver
of HFD mice, which suggested that the alterations in AMPKα
expression enhanced the pathogenesis of lipid accumulation in the
livers of NAFLD HFD mice (46).
However, BHe significantly and dose-dependently stimulated AMPK
expression and inhibited ACC1 mRNA expression in the hepatic
tissues (in a manner comparable with the effects of 250 mg/kg
metformin), which suggested that BHe ameliorated abnormal lipid
metabolism through the suppression of lipogenesis and the promotion
of fatty acid oxidation via the upregulation of AMPK. In addition,
the consistent upregulation of AMPK and the AMPK signaling pathway
indicated favorable modulation of the endogenous antioxidant
defense systems and glucose-regulating enzymes. Therefore, it was
also considered that the antioxidative effects and favorable
modulatory activities on glucose-regulatory enzymes (GK, G6Pase and
PECK) were also mediated by the upregulation of AMPK, which was
similar to the effects of metformin, a well-documented AMPK
activator (17,18).
In conclusion, the anti-obesity activity, including
the NAFLD refinement effects of BHe, was observed in HFD-induced
obese mice in the present study. After 84 days of continuous oral
administration of BHe (400, 200 and 100 mg/kg), the HFD diet
induced the AMPK downregulation-dependent dysregulation of glucose
and lipid metabolism; consequently, oxidative stress-associated
diabetic hepatopathy (NAFLD) and hyperlipidemia were significantly
and dose-dependently inhibited. In particular, BHe (400 mg/kg)
consistently indicated favorable inhibitory activities against
obesity, hyperlipidemia and hepatic steatosis (NAFLD) through AMPK
upregulation-mediated hepatic glucose enzyme activity and lipid
metabolism-associated gene expression, antioxidant defense system,
and pancreatic lipid digestion enzyme modulatory activities,
compared with the effects of metformin (250 mg/kg) in HFD mice. BHe
exhibited favorable anti-obesity effects, including anti-NAFLD
activities, in HFD mice, through the AMPK upregulation-mediated
effects on hepatic glucose enzyme activity and lipid
metabolism-associated gene expression, antioxidant defense system
and pancreatic lipid digestion enzyme-modulatory activities.
Therefore, BHe is a promising novel potent refinement agent or
medicinal food for the treatment of obesity and a variety of its
associated problems, including NAFLD.
Funding
The present study was supported by the Korea
Institute of Planning and Evaluation for Technology in Food,
Agriculture, Forestry and Fisheries (IPET) through the High
Value-Added Food Technology Development Program, funded by Ministry
of Agriculture, Food and Rural Affairs (grant no. 116019-3).
Availability of data and materials
All data generated or analyzed during this study are
included in this published article.
Authors’ contributions
DJS, SKK and HJL conceived and designed research.
JWK, IJC, SKK and HJL performed experiments. JWK, YSL and JSC
contributed new reagents or analytical tools. JWK, YSL, SKK and HJL
analyzed data. JWK, SKK, JSC and HJL wrote the manuscript. All
authors read and approved the manuscript.
Ethics approval and consent to
participate
All laboratory animals were treated in accordance
with the national regulations of the usage and welfare of
laboratory animals and approved by the Institutional Animal Care
and Use Committee in Daegu Haany University (Gyeongsan, Korea)
prior to the experiments (approval no. DHU2017-022).
Patient consent for publication
Not applicable.
Competing interests
The BHe was prepared by Aribio Co. Ltd., to which
two authors, JWK and DJS were affiliated. However, the authors
declare that they have no competing interests.
Acknowledgments
Not applicable.
References
|
1
|
Wendel AA, Purushotham A, Liu LF and
Belury MA: Conjugated linoleic acid fails to worsen insulin
resistance but induces hepatic steatosis in the presence of leptin
in ob/ob mice. J Lipid Res. 49:98–106. 2008. View Article : Google Scholar
|
|
2
|
Tilg H and Moschen AR: Adipocytokines:
Mediators linking adipose tissue, inflammation and immunity. Nat
Rev Immunol. 6:772–783. 2006. View
Article : Google Scholar : PubMed/NCBI
|
|
3
|
James PT, Leach R, Kalamara E and Shayeghi
M: The worldwide obesity epidemic. Obes Res. 9(Suppl 4): 228S–233S.
2001. View Article : Google Scholar : PubMed/NCBI
|
|
4
|
Flegal KM, Kruszon-Moran D, Carroll MD,
Fryar CD and Ogden CL: Trends in obesity among adults in the United
States 2005 to 2014. JAMA. 315:2284–2291. 2016. View Article : Google Scholar : PubMed/NCBI
|
|
5
|
Ogden CL, Carroll MD, Lawman HG, Fryar CD,
Kruszon-Moran D, Kit BK and Flegal KM: Trends in obesity prevalence
among children and adolescents in the United States, 1988–1004
through 2013–2014. JAMA. 315:2292–2299. 2016. View Article : Google Scholar : PubMed/NCBI
|
|
6
|
Kunitomi M, Wada J, Takahashi K,
Tsuchiyama Y, Mimura Y, Hida K, Miyatake N, Fujii M, Kira S,
Shikata K and Maknio H: Relationship between reduced serum IGF-I
levels and accumu-lation of visceral fat in Japanese men. Int J
Obes Relat Metab Disord. 26:361–369. 2002. View Article : Google Scholar : PubMed/NCBI
|
|
7
|
Hida K, Wada J, Eguchi J, Zhang H, Baba M,
Seida A, Hashimoto I, Okada T, Yasuhara A, Nakatsuka A, et al:
Visceral adipose tissue-derived serine protease inhibitor: A unique
insulin-sensitizing adipocytokine in obesity. Proc Natl Acad Sci
USA. 102:10610–10615. 2005. View Article : Google Scholar : PubMed/NCBI
|
|
8
|
Angulo P: Nonalcoholic fatty liver
disease. N Engl J Med. 346:1221–1231. 2002. View Article : Google Scholar : PubMed/NCBI
|
|
9
|
Park SH, Ko SK and Chung SH: Euonymus
alatus prevents the hyperglycemia and hyperlipidemia induced by
high-fat diet in ICR mice. J Ethnopharmacol. 102:326–335. 2005.
View Article : Google Scholar : PubMed/NCBI
|
|
10
|
Kim UH, Yoon JH, Li H, Kang JH, Ji HS,
Park KH, Shin DH, Park HY and Jeong TS: Pterocarpan-enriched soy
leaf extract ameliorates insulin sensitivity and pancreatic β-cell
proliferation in type 2 diabetic mice. Molecules. 19:18493–18510.
2014. View Article : Google Scholar : PubMed/NCBI
|
|
11
|
Tan Y, Kim J, Cheng J, Ong M, Lao WG, Jin
XL, Lin YG, Xiao L, Zhu XQ and Qu XQ: Green tea polyphenols
ameliorate non-alcoholic fatty liver disease through upregulating
AMPK activation in high fat fed Zucker fatty rats. World J
Gastroenterol. 23:3805–3814. 2017. View Article : Google Scholar : PubMed/NCBI
|
|
12
|
Lin CH, Kuo YH and Shih CC: Effects of
Bofu-Tsusho-San on diabetes and hyperlipidemia associated with
AMP-activated protein kinase and glucose transporter 4 in
high-fat-fed mice. Int J Mol Sci. 15:20022–20044. 2014. View Article : Google Scholar : PubMed/NCBI
|
|
13
|
Steinberg GR and Kemp BE: AMPK in Health
and disease. Physiol Rev. 89:1025–1078. 2009. View Article : Google Scholar : PubMed/NCBI
|
|
14
|
Xu XJ, Gauthier MS, Hess DT, Apovian CM,
Cacicedo JM, Gokce N, Farb M, Valentine RJ and Ruderman NB: Insulin
sensitive and resistant obesity in humans: AMPK activity, oxidative
stress, and depot-specific changes in gene expression in adipose
tissue. J Lipid Res. 53:792–801. 2012. View Article : Google Scholar : PubMed/NCBI
|
|
15
|
Hasanvand A, Amini-Khoei H, Hadian MR,
Abdollahi A, Tavangar SM, Dehpour AR, Semiei E and Mehr SE:
Anti-inflammatory effect of AMPK signaling pathway in rat model of
diabetic neuropathy. Inflammopharmacology. 24:207–219. 2016.
View Article : Google Scholar : PubMed/NCBI
|
|
16
|
Smith BK, Marcinko K, Desjardins EM, Lally
JS, Ford RJ and Steinberg GR: Treatment of nonalcoholic fatty liver
disease: Role of AMPK. Am J Physiol Endocrinol Metab.
311:E730–E740. 2016. View Article : Google Scholar : PubMed/NCBI
|
|
17
|
Ma A, Wang J, Yang L, An Y and Zhu H: AMPK
activation enhances the anti-atherogenic effects of high density
lipoproteins in apoE−/− mice. J Lipid Res. 58:1536–1547.
2017. View Article : Google Scholar : PubMed/NCBI
|
|
18
|
Mottillo EP, Desjardins EM, Fritzen AM,
Zou VZ, Crane JD, Yabut JM, Kiens B, Erion DM, Lanba A, Granneman
JG, et al: FGF21 does not require adipocyte AMP-activated protein
kinase (AMPK) or the phosphorylation of acetyl-CoA carboxylase
(ACC) to mediate improvements in whole-body glucose homeostasis.
Mol Metab. 6:471–481. 2017. View Article : Google Scholar : PubMed/NCBI
|
|
19
|
Kang SJ, Lee JE, Lee EK, Jung DH, Song CH,
Park SJ, Choi SH, Han CH, Ku SK and Lee YJ: Fermentation with
Aquilariae Lignum enhances the anti-diabetic activity of green tea
in type II diabetic db/db mouse. Nutrients. 6:3536–3571. 2014.
View Article : Google Scholar : PubMed/NCBI
|
|
20
|
Kim E, Liu NC, Yu IC, Lin HY, Lee YF,
Sparks JD, Chen LM and Chang C: Metformin inhibits nuclear receptor
TR4-mediated hepatic stearoyl-CoA desaturase 1 gene expression with
altered insulin sensitivity. Diabetes. 60:1493–1503. 2011.
View Article : Google Scholar : PubMed/NCBI
|
|
21
|
Torres TP, Sasaki N, Donahue EP, Lacy B,
Printz RL, Cherrington AD, Treadway JL and Shiota M: Impact of a
glycogen phosphorylase inhibitor and metformin on basal and
glucagon-stimulated hepatic glucose flux in conscious dogs. J
Pharmacol Exp Ther. 337:610–620. 2011. View Article : Google Scholar : PubMed/NCBI
|
|
22
|
Jones G, Macklin J and Alexander W:
Contraindications to the use of metformin. BMJ. 326:4–5. 2003.
View Article : Google Scholar : PubMed/NCBI
|
|
23
|
Bolen S, Feldman L, Vassy J, Wilson L, Yeh
HC, Marinopoulos S, Wiley C, Selvin E, Wilson R, Bass EB and
Brancati FL: Systematic review: Comparative effectiveness and
safety of oral medications for type 2 diabetes mellitus. Ann Intern
Med. 147:386–399. 2007. View Article : Google Scholar : PubMed/NCBI
|
|
24
|
Khurana R and Malik IS: Metformin: Safety
in cardiac patients. Heart. 96:99–102. 2010.
|
|
25
|
Chaovanalikit A, Thompson MM and Wrolstad
RE: Characterization and quantification of anthocyanins and
polyphenolics in blue honeysuckle (Lonicera caerulea L.). J Agric
Food Chem. 52:848–852. 2004. View Article : Google Scholar : PubMed/NCBI
|
|
26
|
Svarcova I, Heinrich J and Valentova K:
Berry fruits as a source of biologically active compounds: The case
of Lonicera caerulea. Biomed Pap Med Fac Univ Palacky Olomouc Czech
Repub. 151:163–174. 2007. View Article : Google Scholar
|
|
27
|
Zhao H, Wang Z, Ma F, Yang X, Cheng C and
Yao L: Protective effect of anthocyanin from lonicera caerulea var.
Edulis on Radiation-induced damage in mice. Int J Mol Sci.
13:11773–11782. 2012. View Article : Google Scholar : PubMed/NCBI
|
|
28
|
Jurgoński A, Juśkiewicz J and Zduńczyk Z:
An anthocyanin-rich extract from Kamchatka honeysuckle increases
enzymatic activity within the gut and ameliorates abnormal lipid
and glucose metabolism in rats. Nutrition. 29:898–902. 2013.
View Article : Google Scholar
|
|
29
|
Palíková I, Valentová K, Oborná I and
Ulrichová J: Protectivity of blue honeysuckle extract against
oxidative human endothelial cells and rat hepatocyte damage. J
Agric Food Chem. 57:6584–6589. 2009. View Article : Google Scholar : PubMed/NCBI
|
|
30
|
Jin XH, Ohgami K, Shiratori K, Suzuki Y,
Koyama Y, Yoshida K, Ilieva I, Tanaka T, Onoe K and Ohno S: Effects
of blue honeysuckle (Lonicera caerulea L.) extract on
lipopoly-saccharide-induced inflammation in vitro and in vivo. Exp
Eye Res. 82:860–867. 2006. View Article : Google Scholar
|
|
31
|
Park SI, Lee YJ, Choi SH, Park SJ, Song CH
and Ku SK: Therapeutic effects of blue honeysuckle on lesions of
hyperthyroidism in rats. Am J Chin Med. 44:1441–1456. 2016.
View Article : Google Scholar : PubMed/NCBI
|
|
32
|
Chen L, Xin X, Yuan Q, Su D and Liu W:
Phytochemical proper-ties and antioxidant capacities of various
colored berries. J Sci Food Agric. 94:180–188. 2014. View Article : Google Scholar
|
|
33
|
Vostálová J, Galandáková A, Palíková I,
Ulrichová J, Doležal D, Lichnovská R, Vrbková J and Rajnochová
Svobodová A: Lonicera caerulea fruits reduce UVA-induced damage in
hairless mice. J Photochem Photobiol B. 128:1–11. 2013. View Article : Google Scholar : PubMed/NCBI
|
|
34
|
Korea Food and Drug Administration:
Testing Guidelines for Safety Evaluation of Drugs. Notification No.
2015–082. 2015.
|
|
35
|
Kim CM, Yi SJ, Cho IJ and Ku SK: Red-koji
fermented red ginseng ameliorates high fat diet-induced metabolic
disorders in mice. Nutrients. 5:4316–4332. 2013. View Article : Google Scholar : PubMed/NCBI
|
|
36
|
Folch J, Lees M and Sloane-Stanley GH: A
simple method for the isolation and purification of total lipids
from animal tissues. J Biol Chem. 226:497–509. 1957.PubMed/NCBI
|
|
37
|
Jamall IS and Smith JC: Effects of cadmium
on glutathione peroxidase, superoxidase dismutase and lipid
peroxidation in the rat heart: A possible mechanism of cadmium
cardiotoxicity. Toxicol Appl Pharmacol. 80:33–42. 1985. View Article : Google Scholar : PubMed/NCBI
|
|
38
|
Lowry OH, Rosenbrough NJ, Farr AL and
Randall RJ: Protein measurement with the Folin phenol reagent. J
Biol Chem. 193:265–275. 1951.PubMed/NCBI
|
|
39
|
Sedlak J and Lindsay RH: Estimation of
total, protein-bound, and nonprotein sulfhydryl groups in tissue
with Ellman’s reagent. Anal Biochem. 25:192–205. 1968. View Article : Google Scholar : PubMed/NCBI
|
|
40
|
Aebi H: Catalase. Methods in Enzymatic
Analysis. Bergmeyer HU: Academic Press; New York NY: pp. 673–686.
1974, View Article : Google Scholar
|
|
41
|
Sun Y, Larry WO and Ying L: A simple
method for clinical assay of superoxide dismutase. Clin Chem.
34:497–500. 1988.PubMed/NCBI
|
|
42
|
Hulcher FH and Oleson WH: Simplified
spectrophotometric assay for microsomal 3-hydroxy-3-methylglutaryl
CoA reductase by measurement of coenzyme A. J Lipid Res.
14:625–631. 1973.PubMed/NCBI
|
|
43
|
Davidson AL and Arion WJ: Factors
underlying significant underestimations of glucokinase activity in
crude liver extracts: Physiological implications of higher cellular
activity. Arch Biochem Biophys. 253:156–167. 1987. View Article : Google Scholar : PubMed/NCBI
|
|
44
|
Alegre M, Ciudad CJ, Fillat C and
Guinovart JJ: Determination of glucose-6-phosphatase activity using
the glucose dehydrogenase-coupled reaction. Anal Biochem.
173:185–189. 1988. View Article : Google Scholar : PubMed/NCBI
|
|
45
|
Bentle LA and Lardy HA: Interaction of
anions and divalent metal ions with phosphoenolpyruvate
carboxykinase. J Biol Chem. 251:2916–2921. 1976.PubMed/NCBI
|
|
46
|
Sung YY, Kim DS, Kim SH and Kim HK:
Anti-obesity activity, acute toxicity, and chemical constituents of
aqueous and ethanol Viola mandshurica extracts. BMC Complement
Altern Med. 17:2972017. View Article : Google Scholar : PubMed/NCBI
|
|
47
|
Bashir KMI, Kim MS, Stahl U and Cho MG:
Agrobacterium-mediated genetic transformation of Dictyosphaerium
pulchellum for the expression of erythropoietin. J Appl Phycol.
1–16. 2018.
|
|
48
|
Schmittgen TD and Livak KJ: Analyzing
real-time PCR data by the comparative C(T) method. Nat Protoc.
3:1101–1108. 2008. View Article : Google Scholar : PubMed/NCBI
|
|
49
|
Levene A: Pathological factors influencing
excision of tumours in the head and neck. Part I. Clin Otolaryngol
Allied Sci. 6:145–151. 1981. View Article : Google Scholar : PubMed/NCBI
|
|
50
|
Choi JS, Kim JW, Park JB, Pyo SE, Hong YK,
Ku SK and Kim MR: Blood glycemia-modulating effects of melanian
snail protein hydrolysates in mice with type II diabetes. Int J Mol
Med. 39:1437–1451. 2017. View Article : Google Scholar : PubMed/NCBI
|
|
51
|
Williams CD, Stengel J, Asike MI, Torres
DM, Shaw J, Contreras M, Landt CL and Harrison SA: Prevalence of
nonalcoholic fatty liver disease and nonalcoholic steatohepatitis
among a largely middleaged population utilizing ultrasound and
liver biopsy: A prospective study. Gastroenterology. 140:124–131.
2011. View Article : Google Scholar
|
|
52
|
Wong VW, Chu WC, Wong GL, Chan RS, Chim
AM, Ong A, Yeung DK, Yiu KK, Chu SH, Woo J, et al: Prevalence of
non-alcoholic fatty liver disease and advanced fibrosis in Hong
Kong Chinese: A population study using proton-magnetic resonance
spectroscopy and transient elastography. Gut. 61:409–415. 2012.
View Article : Google Scholar
|
|
53
|
Samuel VT, Liu ZX, Qu X, Elder BD, Bilz S,
Befroy D, Romanelli AJ and Shulman GI: Mechanism of hepatic insulin
resistance in nonalcoholic fatty liver disease. J Biol Chem.
279:32345–32353. 2004. View Article : Google Scholar : PubMed/NCBI
|
|
54
|
Savage DB, Petersen KF and Shulman GI:
Disordered lipid metabolism and the pathogenesis of insulin
resistance. Physiol Rev. 87:507–520. 2007. View Article : Google Scholar : PubMed/NCBI
|
|
55
|
Rotman Y and Sanyal AJ: Current and
upcoming pharmaco-therapy for non-alcoholic fatty liver disease.
Gut. 66:180–190. 2017. View Article : Google Scholar
|
|
56
|
Jung YM, Lee SH, Lee DS, You MJ, Chung IK,
Cheon WH, Kwon YS, Lee YJ and Ku SK: Fermented garlic protects
diabetic, obese mice when fed a high-fat diet by antioxidant
effects. Nutr Res. 31:387–396. 2011. View Article : Google Scholar : PubMed/NCBI
|
|
57
|
Lee JE, Kang SJ, Choi SH, Song CH, Lee YJ
and Ku SK: Fermentation of green tea with 2% Aquilariae lignum
increases the anti-diabetic activity of green tea aqueous extracts
in the high fat-fed mouse. Nutrients. 7:9046–9078. 2015. View Article : Google Scholar : PubMed/NCBI
|
|
58
|
Fujita H, Fujishima H, Koshimura J, Hosoba
M, Yoshioka N, Shimotomai T, Morii T, Narita T, Kakei M and Ito S:
Effects of antidiabetic treatment with metformin and insulin on
serum and adipose tissue adiponectin levels in db/db mice. Endocr
J. 52:427–433. 2005. View Article : Google Scholar : PubMed/NCBI
|
|
59
|
Gartner LP and Hiatt JL: Color Textbook of
Histology. 3rd edition. Saunders; Philadelphia: pp. 417–422.
2007
|
|
60
|
Bertrand RL, Senadheera S, Markus I, Liu
L, Howitt L, Chen H, Murphy TV, Sandow SL and Bertrand PP: A
Western diet increases serotonin availability in rat small
intestine. Endocrinology. 152:36–47. 2011. View Article : Google Scholar
|
|
61
|
Snedeker SM and Hay AG: Do interactions
between gut ecology and environmental chemicals contribute to
obesity and diabetes. Environ Health Perspect. 120:332–339. 2012.
View Article : Google Scholar
|
|
62
|
Carter D, Howlett HC, Wiernsperger NF and
Bailey C: Effects of metformin on bile salt transport by monolayers
of human intestinal Caco-2 cells. Diabetes Obes Metab. 4:424–427.
2002. View Article : Google Scholar : PubMed/NCBI
|
|
63
|
Carter D, Howlett HC, Wiernsperger NF and
Bailey CJ: Differential effects of metformin on bile salt
absorption from the jejunum and ileum. Diabetes Obes Metab.
5:120–125. 2003. View Article : Google Scholar : PubMed/NCBI
|
|
64
|
Chen H, Qu Z, Fu L, Dong P and Zhang X:
Physicochemical properties and antioxidant capacity of 3
polysaccharides from green tea, oolong tea, and black tea. J Food
Sci. 74:C469–C474. 2009. View Article : Google Scholar : PubMed/NCBI
|
|
65
|
Quine SD and Raghu PS: Effects of
(−)-epicatechin, a flavonoid on lipid peroxidation and antioxidants
in streptozotocin-induced diabetic liver, kidney and heart.
Pharmacol Rep. 57:610–615. 2005.PubMed/NCBI
|
|
66
|
Sodikoff CH: Laboratory profiles of small
animal diseases: A guide to laboratory diagnosis. Mosby Inc.; St.
Louise; pp. 1–36. 1995
|
|
67
|
Wu X, Motoshima H, Mahadev K, Stalker TJ,
Scalia R and Goldstein BJ: Involvement of AMP-activated protein
kinase in glucose uptake stimulated by the globular domain of
adiponectin in primary rat adipocytes. Diabetes. 52:1355–1363.
2013. View Article : Google Scholar
|