Introduction
Renal osteodystrophy (ROD), a complex bone disorder,
mainly results from hormonal dysmetabolism during the progression
of chronic kidney disease (CKD). In 1983, Sherrard et al
(1) recommended a classification
system for ROD using the parameters of bone turnover and the
unmineralized bone (osteoid) area as a percentage of total bone
area and fibrosis. On the basis of these criteria, ROD can be
classified into three main categories: Osteitis fibrosa
characterized by high bone turnover, adynamic bone disease (ABD)
with low bone turnover, and mixed lesion (2). In general, osteitis fibrosa does not
cause mineralization abnormalities, but stimulates secondary
hyperparathyrodism (SHPT) and eventually the excessive
proliferation of osteocytes in long bones. A cross-sectional study
conducted by Mathias et al (3) recruited 21 patients with osteitis
fibrosa, and found that total alkaline phosphatase (tAP) and
parathyroid hormone (PTH) were markedly increased whereas the serum
calcium level was decreased. Conversely, ABD is characterized by
the mineralization abnormality of bone collagen and absence of
osteoid accumulation in combination with relative
hypoparathyroidism. Moore et al (4) determined serum biomarkers of bone
and mineral metabolism in 43 African-American hemodialysis patients
and revealed that ABD exhibited significantly decreased levels of
serum phosphorus, calcium-phosphorus product, PTH, tAP and
bone-specific alkaline phosphatase (bAP). Nevertheless, the
diagnostic efficiency of routine serum biomarkers is far from
satisfactory. Ferreira et al (5) discovered that an elevation in PTH
(>300 pg/ml) together with higher tAP (>120 U/l) had a low
sensitivity (58.8%) and negative predictive value (44.0%) for the
diagnosis of osteitis fibrosa. Similarly, another study comprising
93 CKD patients from 18 Macedonian ambulatory nephrology centers
indicated that the sensitivity of PTH (≤237 pg/ml) for ABD
diagnosis was 78%, and specificity was 53%; the sensitivity and
specificity of tAP (≤66 U/l) were 74 and 54%, respectively
(6). Although bone biopsy is
considered the gold standard for ROD diagnosis, the invasiveness
seriously restricts its clinical application. Therefore, further
studies are warranted to screen novel biomarkers that should be
unique to mineral metabolism and be well correlated with
histomorphometric findings in ROD progression.
Fibroblast growth factor (FGF)-23, originally
identified in human osteoblasts, is an important hormonal regulator
of circulating phosphate and calcitriol via suppressing the Na/Pi
IIc cotransporters in proximal tubule cells (7). In the concurrent presence of FGF
receptor (FGFR)-1 and the transmembrane protein Klotho, FGF-23 also
antagonizes 1α-hydroxylase and subsequently leads to 1,25-dihydroxy
vitamin D deficiency and calcium malabsorption, which may initiate
the development of bone and mineral disorders (8). Bai et al (9) generated transgenic mice
overexpressing human FGF-23 and revealed that FGF-23 transgenic
mice recapitulated the biochemical (hypophosphatemia,
hypovitaminosis D and decreased renal tubular phosphate
reabsorption) and skeletal abnormalities (rickets and osteomalacia)
consistent with human X-linked hypophosphatemic (XLH) rickets and
autosomal dominant hypophosphatemic rickets. More directly, Wang
et al (10) transfected
human FGF-23 into osteoblasts in vitro and found that
overexpressed FGF-23 could significantly disturb osteo-blast
differentiation and matrix mineralization. In addition, a growing
body of literature has noted that elevated FGF-23 is a common
feature in CKD. In an animal study conducted by Parker et al
(11), serum FGF-23 was
significantly higher in CKD dogs compared with in control dogs (467
vs. 315 pg/ml). In agreement with the aforementioned report, a
prospective study including 3,879 CKD patients showed that serum
FGF-23 was 236 RU/ml (IQR 160-372 RU/ml) in patients with end-stage
kidney disease, a value 5.5-fold higher than baseline values, 43
RU/ml (12). However, there is
scant information currently available on the involvement of FGF-23
in ROD progression to date.
Materials and methods
Animals and treatment
Male Sprague-Dawley rats (n=96) weighing 120-150 g
had access to standard diet and water and were housed with constant
temperature (23±1°C) and humidity (55±5%), and a 12-h light/dark
cycle. All animal experimentation was in accordance with the
guidelines of the Institutional Animal Use and Care Committee,
Anhui Medical University. According to the protocol of Kim et
al (13), rats were grouped
using a block randomization method, and divided equally between the
ROD and sham-operated (SO) groups. Then, 48 rats in each group were
randomly divided into 8 subgroups using the same method.
Randomization sequences were created using excel 2007 (Microsoft
Corporation, Redmond, WA, USA) with a 1:1 allocation using random
block sizes of 8. Rats were operated on under anesthesia with
intraperitoneal injections of pentobarbital (60 mg/kg body weight).
The ROD model was induced with 48 rats via left nephrectomy plus
intravenous injection of Adriamycin (5 mg/kg body weight; Shenzhen
Wanle Pharmaceutical Co. Ltd., Shenzhen, China), dissolved in 0.9%
saline. The other 48 rats formed the SO group and underwent a sham
laparotomy with ureteric manipulation through a midline incision.
Subsequently, animals in both groups were anesthetized by
intraperitoneal pentobar-bital injection and sacrificed by cardiac
puncture at 24 h, 72 h, 1 week, 2 weeks, 3 weeks, 1 month, 2 months
or 3 months after surgery (depending on subgroup). According to the
disease duration, the 8 subgroups were classified into acute stage
(disease duration ≤1 week), advanced stage (1 week< disease
duration ≤1 month), or chronic stage (1 month< disease duration
≤3 months).
Laboratory analysis
All rats were individually housed in metabolic cages
and urine was collected for 24 h. Urine creatinine concentration
(UCr) and urinary protein concentration (UP) from the sample at 24
h were determined using the biuret colorimetric method (Boehringer
Mannheim, Milan, Italy). Blood samples were obtained from the
abdominal aorta and centrifuged at 1,600 x g for 15 min and 4°C.
Serum albumin (Alb), blood urea nitrogen (BUN), serum creatinine
(SCr), uric acid (UA), calcium and phosphate were measured by
standard enzymatic methods (Randox Laboratories Ltd., Crumlin, UK).
The serum protein levels of FGF-23, 25-hydroxyvitamin D [25-(OH)D],
parathyroid hormone (PTH), osteocalcin (OC), bone-specific alkaline
phosphatase (bAP), total alkaline phosphatase (tAP), procollagen
type I carboxy-terminal propeptide (PICP), cross-linked
carboxyterminal telopeptide of type I collagen (ICTP),
tartrate-resistant acid phosphatase (TRAP), urinary
deoxypyridinoline (DPD) and pyridinoline (PYD) were determined
using commercially available enzyme-linked immunosorbent assay
(eLISA) kits (Invitrogen; Thermo Fisher Scientific, Inc.),
according to the manufacturer’s protocols.
Kidney histology
Once harvested, the kidney was washed with saline
and blotted on gauze. Kidney sections were fixed in 4%
paraformaldehyde and embedded in paraffin. Paraffin-embedded
sections (4-µm thick) were stained with hematoxylin and
eosin. Renal morphologic lesions were evaluated on ten randomly
selected, non-overlapping specimens from each rat at x400
magnification, and examined independently by two pathologists
blinded to the experimental design.
Bone morphology
At harvest, the distal femurs were excised, placed
in 70% ethanol, and dehydrated in increasing concentrations of
ethanol. Specimens were embedded in methyl methacrylate and not
decalcified. Bones were sectioned (4-µm) longitudinally
through the frontal plane using a micro-tome (Leica, Wetzlar,
Germany), and stained with Goldner’s trichrome for
histomorphological analysis.
Reverse transcription (RT)-PCR
Total RNA was isolated from bone tissues using
TRIzol® reagent (Invitrogen; Thermo Fisher Scientific,
Inc.), using a routine protocol. Ultraviolet spectrophotometry to
measure absorbance, and agarose gel electrophoresis, confirmed no
RNA degradation. cDNA was synthesized from 1 µg total RNA
using an exScript RT reagent kit (Takara Biotechnology, Dalian,
China).
Primers for FGF-23, FGFR-1, Klotho, Collagen (Col)-X
and GAPDH are listed in Table I.
RT-PCR was performed with an AB detection system and SYBR
Green® PCR Master Mix (Applied Biosystems; Thermo Fisher
Scientific, Inc.) in accordance with the manufacturer’s
instructions. Amplification conditions were as follows:
Pre-denaturing at 95°C for 2 min; denaturing at 94°C for 20 sec,
annealing at 60°C for 20 sec, extension at 72°C for 30 sec; and,
finally, one cycle of 5 min at 72°C. GAPDH was also measured in
each sample and used as an internal control for loading and reverse
transcription efficiency. The average threshold cycle (Ct, the
cycles of template amplification to the threshold) was calculated
for each sample. The quantitative 2-ΔΔCt was used to
compare relative mRNA expression (14,15).
 | Table IPrimers used in RT-PCR. |
Table I
Primers used in RT-PCR.
| Genes | Forward
(5′-3′) | Reverse
(5′-3′) |
|---|
| FGF-23 |
GATGCTGGCTCCGTAGTGATAAT |
TGATGCTTCGGTGACAGGTAGA |
| FGFR-1 |
GGCACCTGAGGCATTGTTT |
TACTGGGCTTGTCCATTCG |
| Klotho |
GCCGAGCAAGACTCACTG |
GCAAAGTAGCCACAAAGGT |
| Col X |
TCTGGGATGCCTCTTGTC |
GATCTTGGGTCATAGTGCTG |
| GAPDH |
GTTACCAGGGCTGCCTTCTC |
GGGTTTCCCGTTGATGACC |
Western blot analysis
Bone tissues were homogenized in ice-cold buffer (40
mM KCl, 10 mM HePeS, pH 7.9, 3 mM MgCl2, 5% glycerol,
0.5 µg/ml leupeptin, 0.1 µg/ml aprotinin, 1.5
µg/ml pepstatin, and 100 mg/ml phenylmethyl-sulphonyl
fluoride) with a Polytron homogenizer for 15-20 sec. Homogenates
were centrifuged at 500 x g for 10 min at 41°C, following which
supernatants were re-centrifuged at 12,000 x g for 15 min at 41°C.
The pellets were resuspended in 0.5 ml homogenizing buffer
containing 0.5% Nonidet P-40 (Wuhan Boster Biological Technology,
Ltd., Wuhan, China) and the total protein concentration of each
supernatant was determined by the dye binding method using bovine
serum albumin as the standard. Samples (50 µg) were
subjected to 10% SDS-PAGe and transferred onto a nitrocellulose
membrane (Bio-Rad Laboratories, Inc.- Hercules, CA, USA). The
membranes were sealed with Tris-buffered saline and 0.1% (w/v)
Tween-20 (TBST) containing 5% non-fat dry milk (Bio-Rad
Laboratories, Inc.) overnight. Immunoblots were incubated with
anti-FGF-23, Klotho, FGFR-1, Col X and GAPDH primary antibodies
(Medical Discovery Leader Biotech Co., Ltd., Beijing, China;
www.Mdlbiotech.com) at 4°C overnight (Table II). The membranes were washed
three times (10 min each) with TBST, followed by incubation with
horseradish peroxidase-conjugated anti-rabbit immunoglobulin G
antibodies (1:3,000 dilution; Medical Discovery Leader) at room
temperature (25°C) for 60 min. The reaction products were assessed
using an enhanced chemiluminescence detection system and exposed to
radiographic film for variable periods.
| Table IIAntibodies used in western
blotting. |
Table II
Antibodies used in western
blotting.
| Antibody | Full name | Catalogue
number | Dilution | Supplier
details | Incubation
conditions |
|---|
| FGF‑23 | Anti‑fibroblast
growth Factor 23 antibody | MD2758 | 1:500 | Medical Discovery
Leader Biotech Co., Ltd., Beijing, China | 4°C overnight |
| Klotho | Anti‑Klotho
antibody | MD6723 | 1:500 | Medical Discovery
Leader Biotech Co., Ltd., Beijing, China | 4°C overnight |
| FGFR‑1 | Anti‑fibroblast
growth factor receptor 1 antibody | MD460 | 1:500 | Medical Discovery
Leader Biotech Co., Ltd., Beijing, China | 4°C overnight |
| Col X | Anti‑collagen X
antibody | MD6722 | 1:500 | Medical Discovery
Leader Biotech Co., Ltd., Beijing, China | 4°C overnight |
| GAPDH | Anti‑glyceraldehyde
3 phosphate dehydrogenase antibody | AF7021 | 1:1,000 | Affinity
Bioscience, Changzhou, China | 4°C overnight |
Statistical analysis
All data are expressed as the means ± SeM. The
Student’s two-sample t-test was used for comparisons of normally
distributed variables with equal variances between two groups.
Comparisons of mean values among multiple groups were conducted
using one-way ANOVA and the Student-Newman-Keuls post hoc test. A
value of P<0.05 was considered to indicate a statistically
significant difference. Pearson’s correlation coefficients (r) were
reported for serum FGF-23 and biochemical parameters (calcium,
phosphate, 25-(OH)D, OC, tAP, bAP, PICP, ICTP, TRAP, PYD, DPD and
Col X). Pearson’s correlation coefficient (r) is a measure of the
linear correlation between two variables X and Y. It has a value
between +1 and -1, where 1 is total positive linear correlation, 0
is no linear correlation, and −1 is total negative linear
correlation. Statistical analyses were performed using the SPSS
v.17.0 software (SPSS, Inc., Chicago, IL, USA).
Results
Renal function indices
Renal function indices of the ROD and SO groups are
listed in Table III. Compared
with 24 h post-surgery, UA in the ROD group was significantly
increased at 72 h and 3 months post-surgery; SCr and Ucr were
significantly higher at the advanced and chronic stages, whereas
BUN was decreased at the advanced and chronic stages (P<0.01).
Compared with the SO group, BUN and UA in the ROD group were
significantly higher in each stage, SCr and UCr were notably
elevated at the advanced and chronic stages, and UPr markedly
increased only at 1-month post-surgery (P<0.05). Nevertheless,
Alb in the ROD group was significantly lower compared with the SO
group, throughout the observational period (P<0.05).
| Table IIIRenal function indices in ROD and SO
rats. |
Table III
Renal function indices in ROD and SO
rats.
| Categories | Alb (g/l) | BUN (mmol/l) | SCr (smol/l) | UA
(µmol/l) | UCr
(µmol/l) | UPr (mg) |
|---|
| SO group | | | | | | |
| 24 h | 34.83±2.36 | 7.02±1.18 | 17.83±9.58 | 64.25±7.55 | 32.40±9.26 | 2.90±0.85 |
| 72 h | 35.60±2.03 | 7.06±1.41 | 18.09±3.78 | 62.24±3.14 | 31.49±5.32 | 3.08±0.77 |
| 1 week | 33.52±2.05 | 6.80±1.40 | 18.73±6.94 | 60.72±3.33 | 32.06±4.36 | 3.17±0.80 |
| 2 weeks | 34.15±1.71 | 6.88±1.74 | 21.61±5.44 | 60.06±1.14 | 30.33±5.19 | 3.25±0.44 |
| 3 weeks | 34.86±1.75 | 6.12±1.02 | 19.53±5.43 | 61.00±3.65 | 32.06±5.01 | 2.90±0.87 |
| 1 month | 33.65±2.13 | 7.22±1.48 | 19.50±5.38 | 61.29±2.24 | 31.15±6.91 | 3.62±0.80 |
| 2 months | 34.38±2.65 | 5.87±1.38 | 17.86±6.82 | 61.12±2.60 | 31.42±5.93 | 3.36±0.93 |
| 3 months | 35.28±1.93 | 6.93±0.80 | 20.40±9.41 | 59.83±5.91 | 31.60±9.26 | 3.18±1.42 |
| ROD group | | | | | | |
| 24 h | 30.98±2.06a | 14.66±5.57a | 15.50±3.39 | 52.00±13.58 | 17.50±6.60a | 4.41±1.52 |
| 72 h | 32.38±2.03a | 13.31±3.83a | 17.20±4.17 |
95.21±26.16a,b | 50.00±58.23 | 2.88±1.11 |
| 1 week | 33.00±3.88 | 8.15±0.93b | 20.00±3.41 | 54.83±16.92 | 52.00±34.85b | 4.50±2.08 |
| 2 weeks | 31.49±2.01a | 8.48±1.04b |
27.67±3.50a,b | 70.80±15.07 | 56.60±36.63b | 4.54±2.18 |
| 3 weeks | 27.80±5.70a | 9.58±1.15a | 19.67±2.34 | 75.00±8.69a | 71.67±38.95b | 5.52±3.00 |
| 1 month | 30.77±1.19a | 10.19±1.13a |
27.00±3.03a,b | 79.17±34.08 |
276.80±157.37a,b |
22.14±12.85a,b |
| 2 months | 34.28±2.87b |
9.24±1.74a,b |
33.50±4.80a,b |
79.00±2.61a,b |
1,094.60±661.09a,b | 11.67±8.40 |
| 3 months | 29.24±3.58a | 11.04±3.87a |
33.75±3.37a,b |
87.00±8.22a,b |
1,632.33±491.43a,b | 5.39±3.74 |
Serum FGF-23
Serum level of FGF-23 is presented in Fig. 1A. Compared with 24 h post-surgery,
serum FGF-23 in the ROD group was significantly elevated at 2
months and 3 months post-surgery (P<0.05). Compared with the SO
group, serum FGF-23 was significantly higher in the ROD group at
all the time-points (P<0.05). Furthermore, the highest level of
serum FGF-23 appeared at 3 months (164.37 pg/ml), which is
~3.29-fold higher than the SO group baseline level (49.95±4.25
pg/ml).
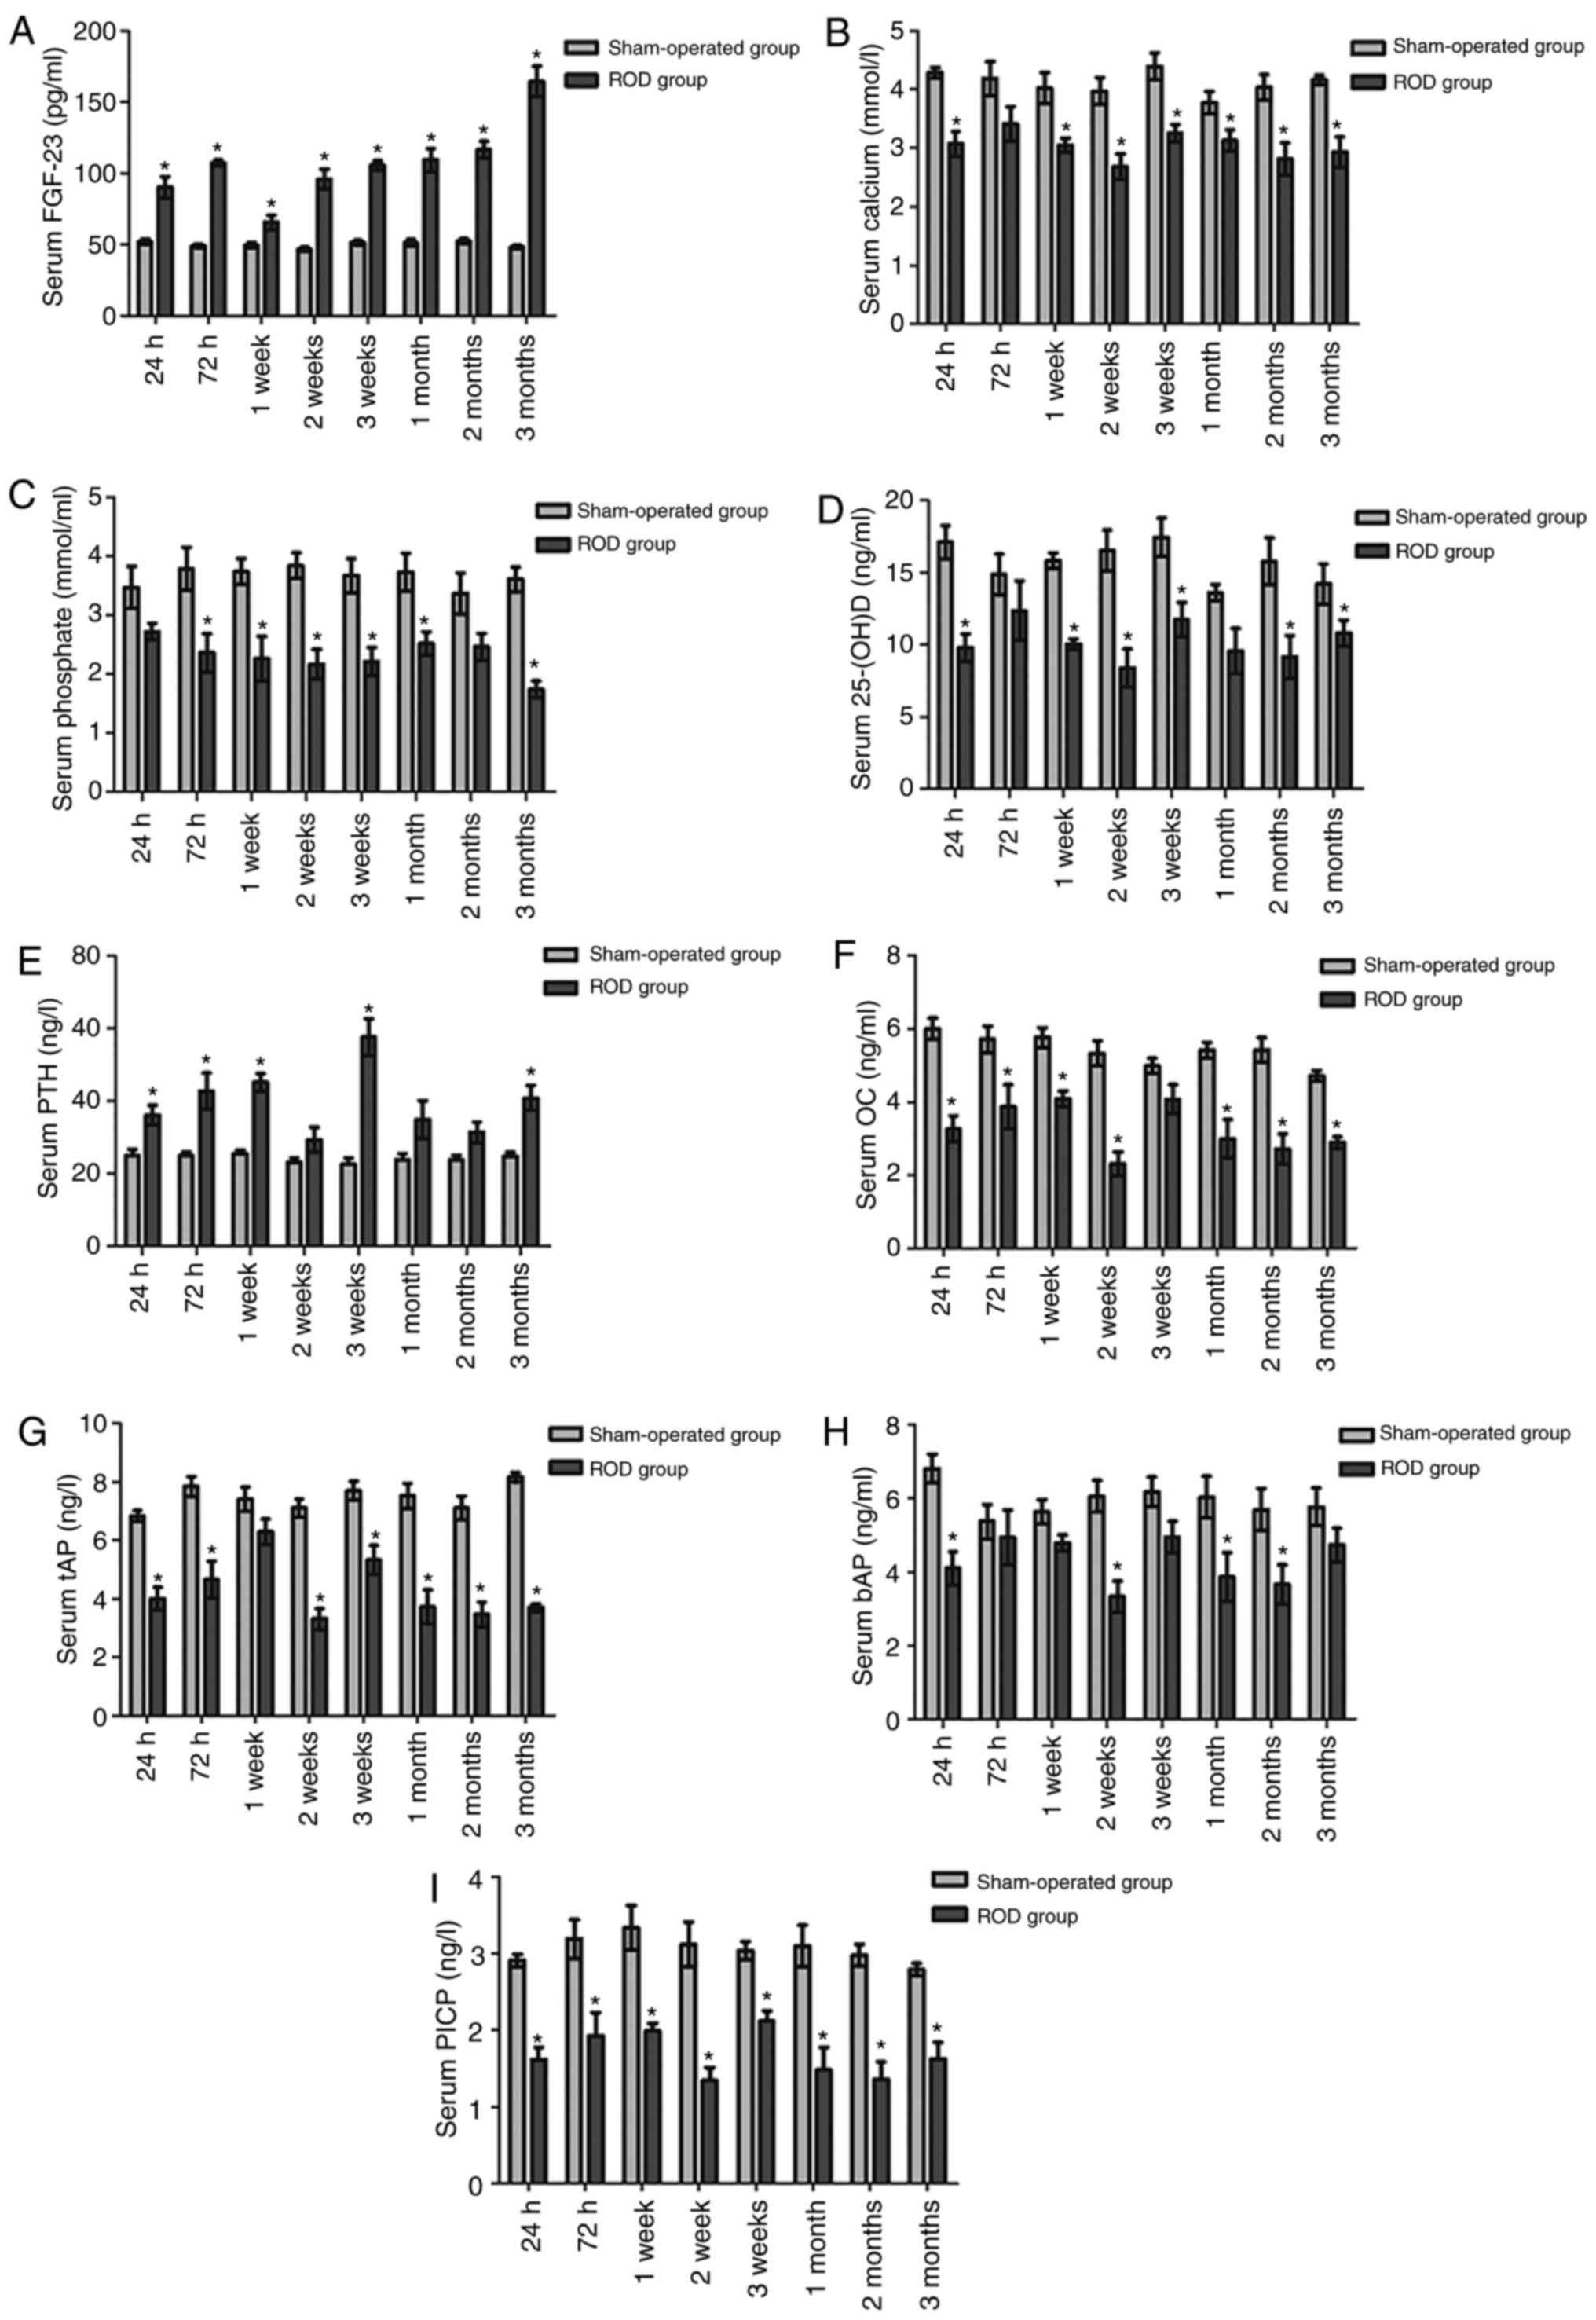 | Figure 1Serum FGF-23, calcium, phosphate,
25-(OH)D, PTH, osteoblastic and osteoclastic proteins in ROD and SO
rats. (A) Serum FGF-23 was significantly higher in the ROD group at
all the time-points (P<0.05). (B-D) The levels of calcium,
phosphate and 25-(OH)D were significantly decreased in the ROD
group at every stage compared with the SO group (P<0.05). (e)
Serum PTH was significantly higher than that in the SO group, from
the acute stage to the chronic stage (P<0.05). (F-I)
Osteoblastic proteins (OC, PICP, tAP and bAP) were significantly
lower, relative to the SO group (P<0.05). (J-M) Osteolytic
proteins (ICTP, TRAP, PYD and DPD) were significantly lower,
relative to the SO group (P<0.05). *P<0.05,
significantly different from the corresponding SO group. ROD, renal
osteodystrophy; SO, sham operated; 25-(OH)D, 25-hydroxyvitamin D;
bAP, bone-specific alkaline phosphatase; DPD, deoxypyridinoline;
FGF-23, fibroblast growth factor-23; ICTP, cross-linked
carboxyterminal telopeptide of type I collagen; OC, osteo-calcin;
PICP, procollagen type I carboxy-terminal propeptide; PTH,
parathyroid hormone; PYD, urinary pyridinoline; tAP, total alkaline
phosphatase; TRAP, tartrate-resistant acid phosphatase. |
Bone metabolism indices
Changes in serum calcium, phosphate, 25-(OH)D, PTH,
osteoblastic and osteoclastic proteins are shown in Fig. 1. Compared with at 24 h
post-surgery, PTH was significantly elevated in the ROD group at 3
weeks post-surgery (P<0.01), though no significant differences
in calcium, phosphate and 25-(OH)D were observed among the
time-points (P>0.05). At the time of sacrifice, the levels of
calcium, phosphate and 25-(OH)D were significantly decreased in the
ROD group in every stage compared with in the respective SO group
(P<0.05) (Fig. 1B-D). By
contrast, serum PTH was significantly higher than in the SO group,
from the acute to the chronic stage (P<0.05) (Fig. 1e). Osteoblastic (OC, PICP, tAP and
bAP) (Fig. 1F-I) and osteolytic
proteins (ICTP, TRAP, PYD and DPD) (Fig. 1J-M) were notably different between
the two groups, and the ROD group expressed significantly lower
levels of bone turnover markers relative to the SO group during the
present study (P<0.05). Compared with at 24 h post-surgery, tAP,
TRAP and ICTP in the ROD group were significantly increased at 1
week, 1 week and 3 weeks post-surgery, respectively
(P<0.05).
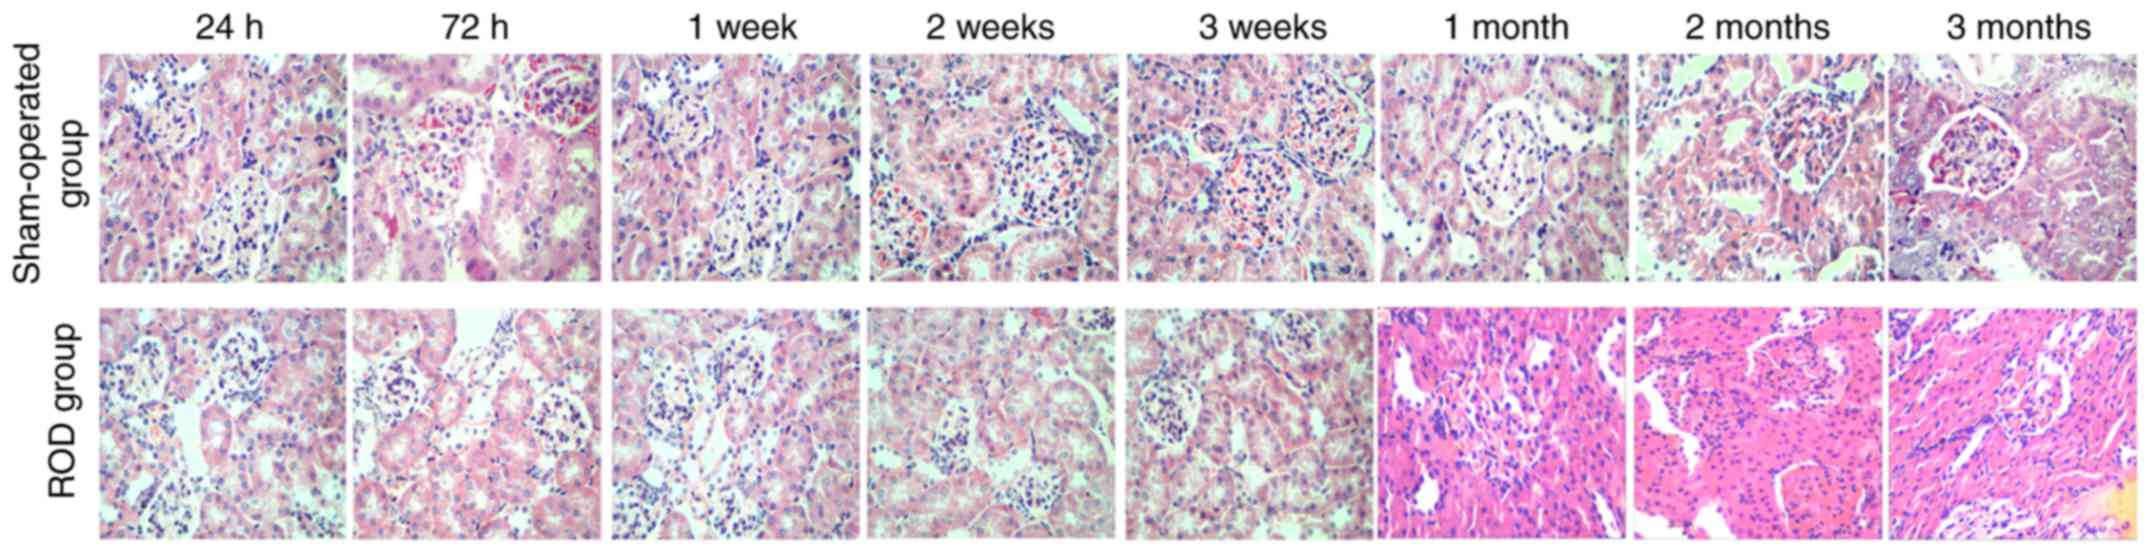
Kidney histology
Histological images of the kidney are shown in
Fig. 2. By contrast with the SO
group, renal injury in the ROD group gradually deteriorated over
time. Renal damage was limited to epithelial cell swelling,
accompanied by inflammatory cell infiltration in both the
glomerulus and interstitium during the acute and advanced stages;
when progressing to the chronic stage, renal pathology was
characterized by inflammatory cell infiltration and tubule
collapse. By contrast, kidney sections from the SO group had a
normal appearance during the whole observational period.
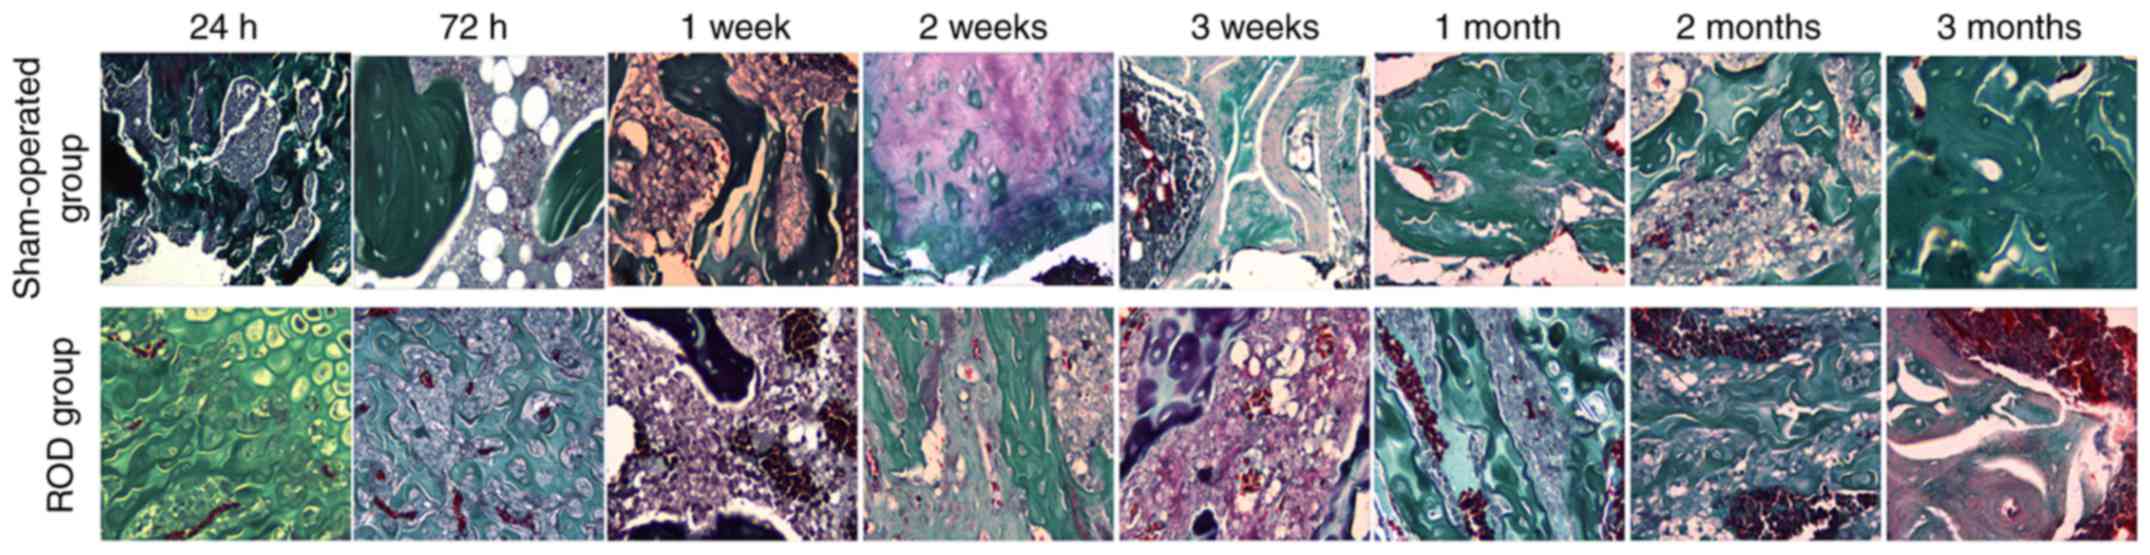
Bone morphology
Representative histological images of distal femurs
are shown in Fig. 3. In the acute
stage, there was no notable difference in bone histology between
the ROD and SO groups. Pathological lesions in the ROD group
occurred at the advanced stage and were gradually aggravated
thereafter. Compared with the SO group, Adriamycin induced a
low-turnover bone lesion characterized by a marked decrease in bone
formation rate, osteoblasts, osteoclasts, and trabecular volume
thickness, and a clear elevation in osteoid volume.
Bone expression of FGF-23, Klotho, FGFR-1
and Col X
Bone expression levels of FGF-23, Klotho, FGFR-1 and
Col X at the time of sacrifice in the ROD and SO groups are shown
in Fig. 4. Compared with at 24 h
post-surgery, FGF-23 and FGFR-1 mRNA levels in the ROD group were
significantly increased at the chronic stage; Klotho mRNA
significantly increased at 72 h, 1, 2 and 3 months post-surgery,
and Col X mRNA were significantly elevated at 3 months post-surgery
(P<0.05). The ROD group had significant increases in FGF-23 and
Klotho mRNA expression compared with the SO group at each stage
(P<0.05) (Fig. 4A and B), and
increased FGFR-1 mRNA at the advanced and chronic stages
(P<0.05) (Fig. 4C). In the ROD
group, the highest expression levels for FGF-23 mRNA were at 3
months (10.63-fold), and the highest expression levels for Klotho
and FGFR-1 mRNA were at 2 months (3.83- and 6.24-fold,
respectively).
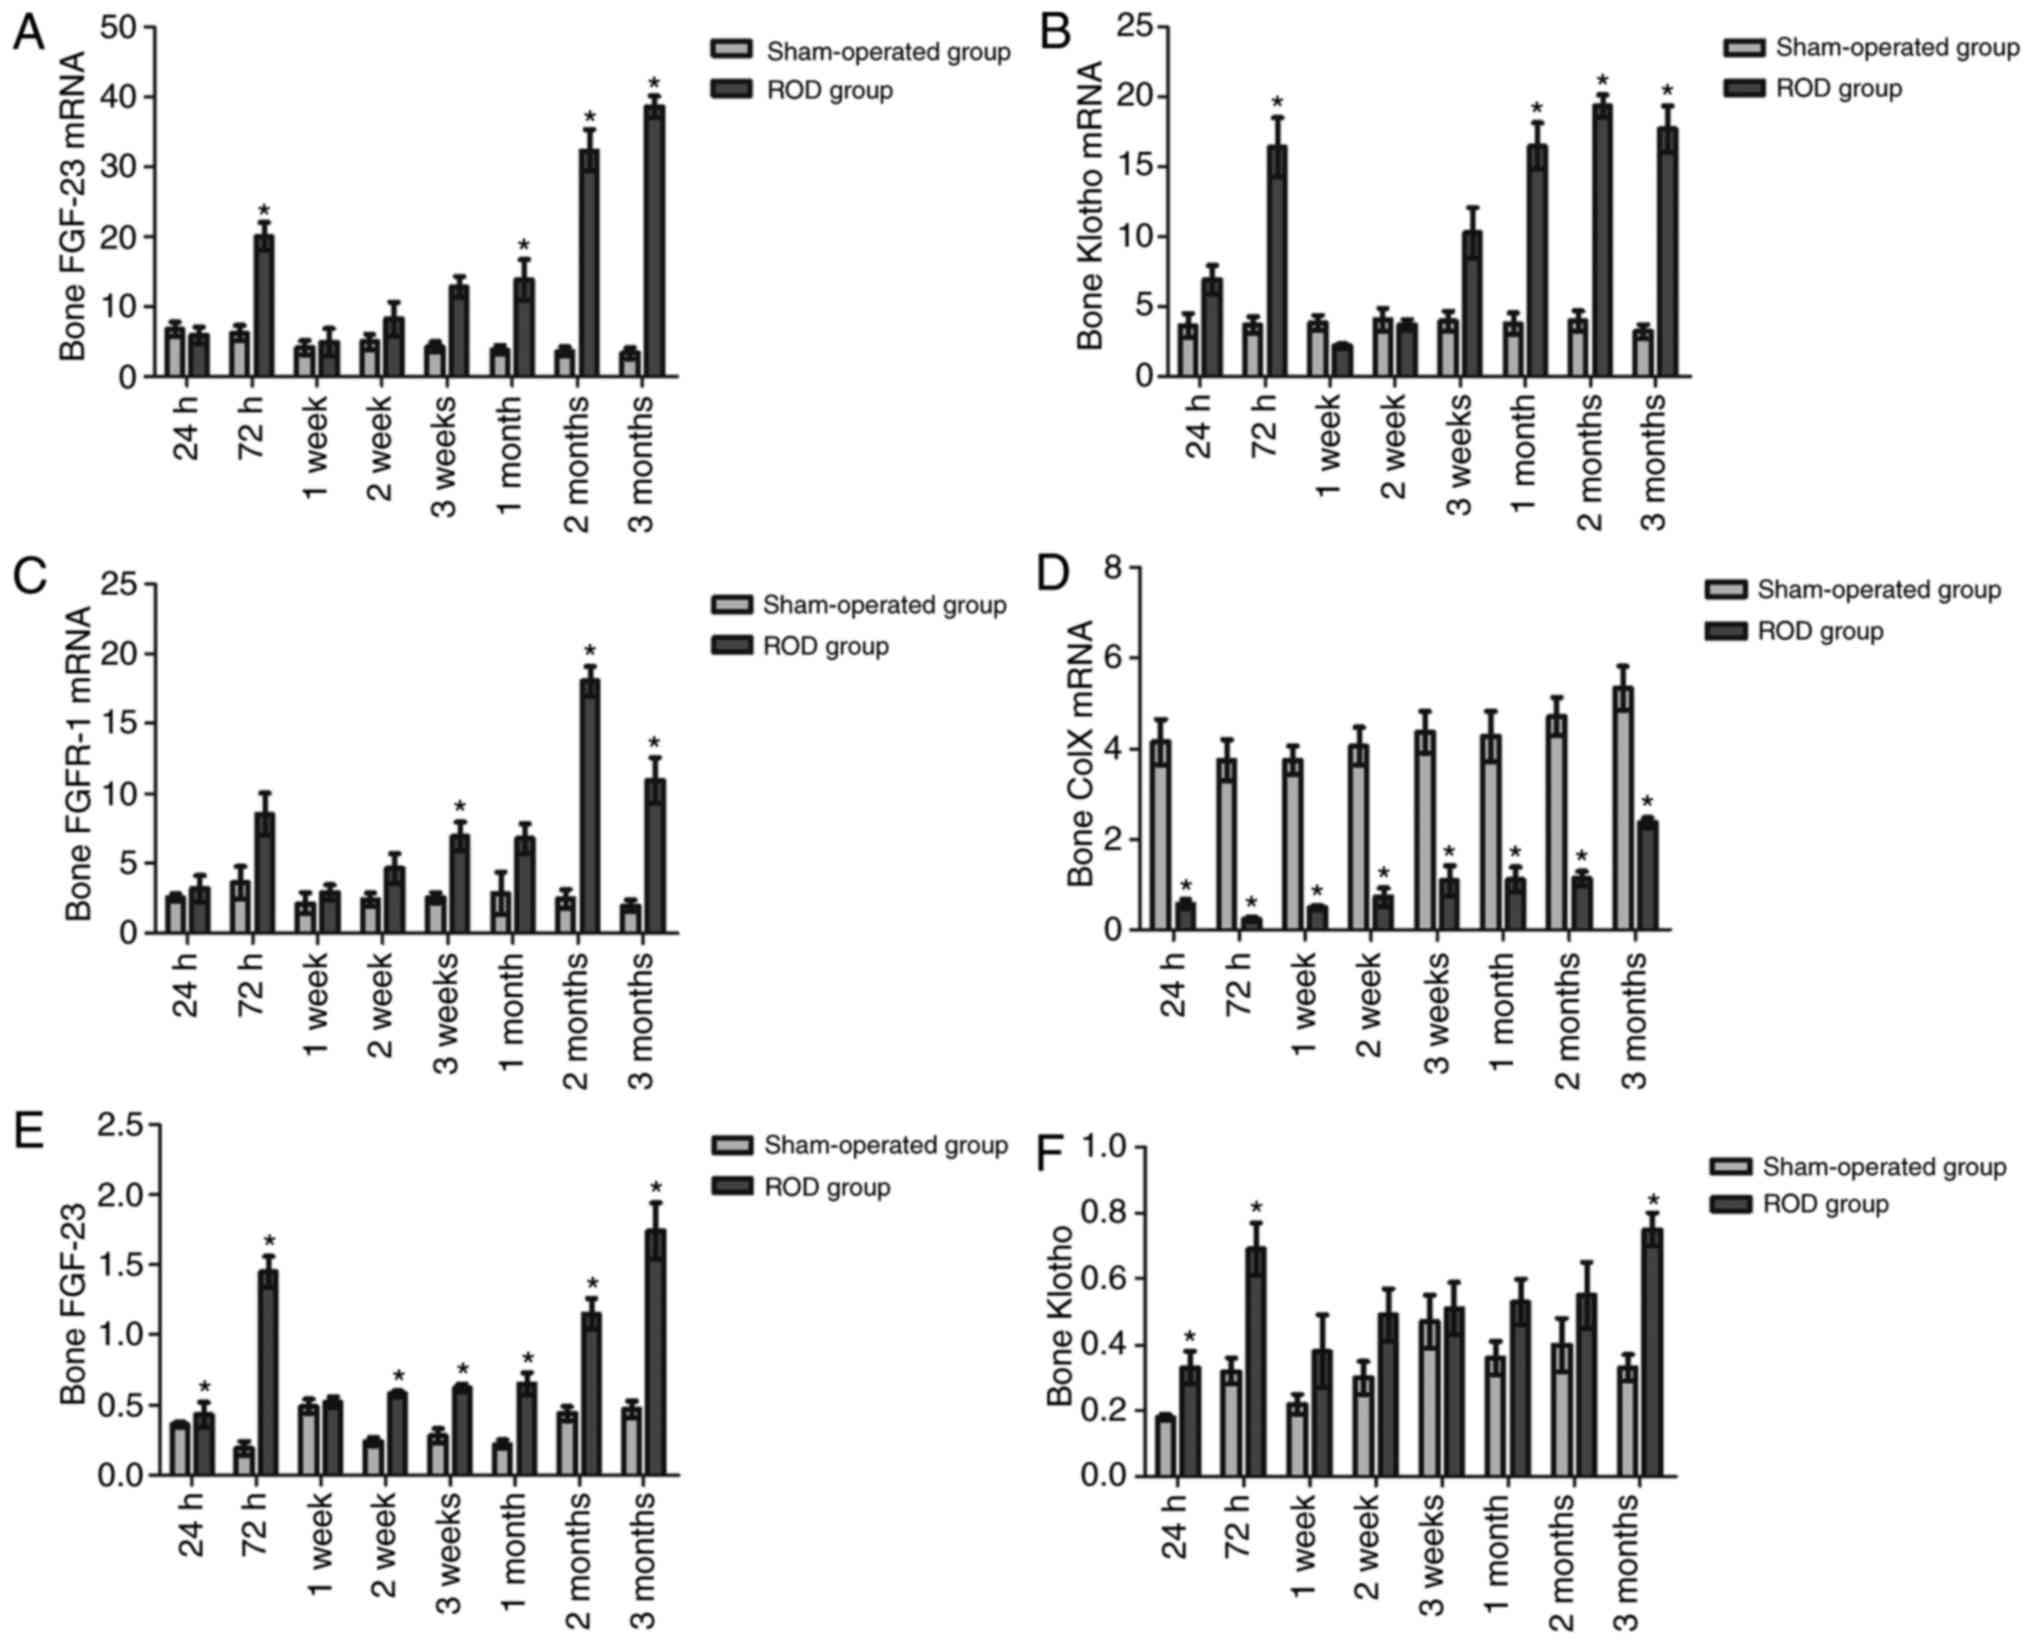 | Figure 4The bone expressions of FGF-23,
FGFR-1, Klotho and Col X in ROD and SO rats. (A and B) The ROD
group had significant elevations in FGF-23 and Klotho mRNA
expression compared with the SO group in each stage (P<0.05),
and (C) increased FGFR-1 mRNA at the advanced and chronic stages
(P<0.05). (D) On the contrary, Col X mRNA in the ROD group was
significantly decreased at each time-point (P<0.05). (e and G)
The ROD group exhibited incremental increases in FGF-23 and FGFR-1
protein as compared with the SO group at each stage (P<0.05),
(F) whereas a significantly higher Klotho level was observed only
in the acute stage and chronic stage (P<0.05). (H) By contrast,
the expression of Col X protein was significantly suppressed in the
ROD rats throughout the observational period (P<0.05). (I)
Representative western blots showing total protein expressions of
bone FGF-23, FGFR-1, Klotho and Col X in ROD and SO rats.
*P<0.05, significantly different from the
corresponding SO group. ROD, renal osteodystrophy; SO, sham
operated; Col X, collagen X; FGF-23, fibroblast growth factor-23;
FGFR-1, fibroblast growth factor receptor-1. |
On the contrary, Col X mRNA in the ROD group was
significantly reduced, with a 94% decrease at 72 h (P<0.05)
(Fig. 4D). Subsequently, western
blotting was conducted to evaluate the bone expression levels of
FGF-23, FGFR-1, Klotho and Col X protein (Fig. 4I). Compared with at 24 h
post-surgery, FGF-23, Klotho and FGFR-1 protein in the ROD group
were significantly higher at 72 h, 2 months and 3 months
post-surgery; and Col X were significantly upregulated at the
advanced and chronic stages (P<0.05). The ROD group exhibited
incremental values of FGF-23 and FGFR-1 protein expression, as
compared with the SO group, at each stage (P<0.05) (Fig. 4e and G), whereas a significantly
higher Klotho level was observed only in the acute and chronic
stages (P<0.05) (Fig. 4F). In
the ROD group, the highest expression for FGF-23 and FGFR-1
proteins was at 72 h (6.63- and 1.46-fold, respectively).
Furthermore, the highest expression levels of Klotho were exhibited
at 3 months (1.27-fold). By contrast, the expression of Col X
protein was significantly suppressed in ROD rats throughout the
observational period and showed the largest downregulation (57%
decrease) at 2 weeks (P<0.05) (Fig. 4H).
Associations between serum FGF-23 levels
and biochemical parameters
Associations between serum FGF-23 levels and
biochemical parameters in ROD rats are depicted in Fig. 5. Serum FGF-23 was negatively
correlated with calcium (r=−0.585, P<0.01, Fig. 5A), phosphate (r=−0.645,
P<0.01, Fig. 5B), 25-(OH)D
(r=−0.532, P<0.01, Fig.
5C), OC (r=−0.607, P<0.01, Fig. 5e), tAP (r=−0.718,
P<0.01, Fig. 5F), bAP
(r=−0.503, P<0.01, Fig.
5G), PICP (r=−0.696, P<0.01, Fig. 5H), ICTP (r=−0.572,
P<0.01, Fig. 5I), TRAP
(r=−0.699, P<0.01, Fig.
5J), PYD (r=−0.505, P<0.01, Fig. 5K), DPD (r=−0.232, P=
0.023, Fig. 5L) and Col X
(r=−0.244, P=0.017, Fig.
5N). As expected, serum FGF-23 was positively correlated with
bone expression levels of the FGF-23 protein (r=+0.772,
P<0.01, Fig. 5M) and serum PTH
(r=+0.399, P<0.01, Fig.
5D).
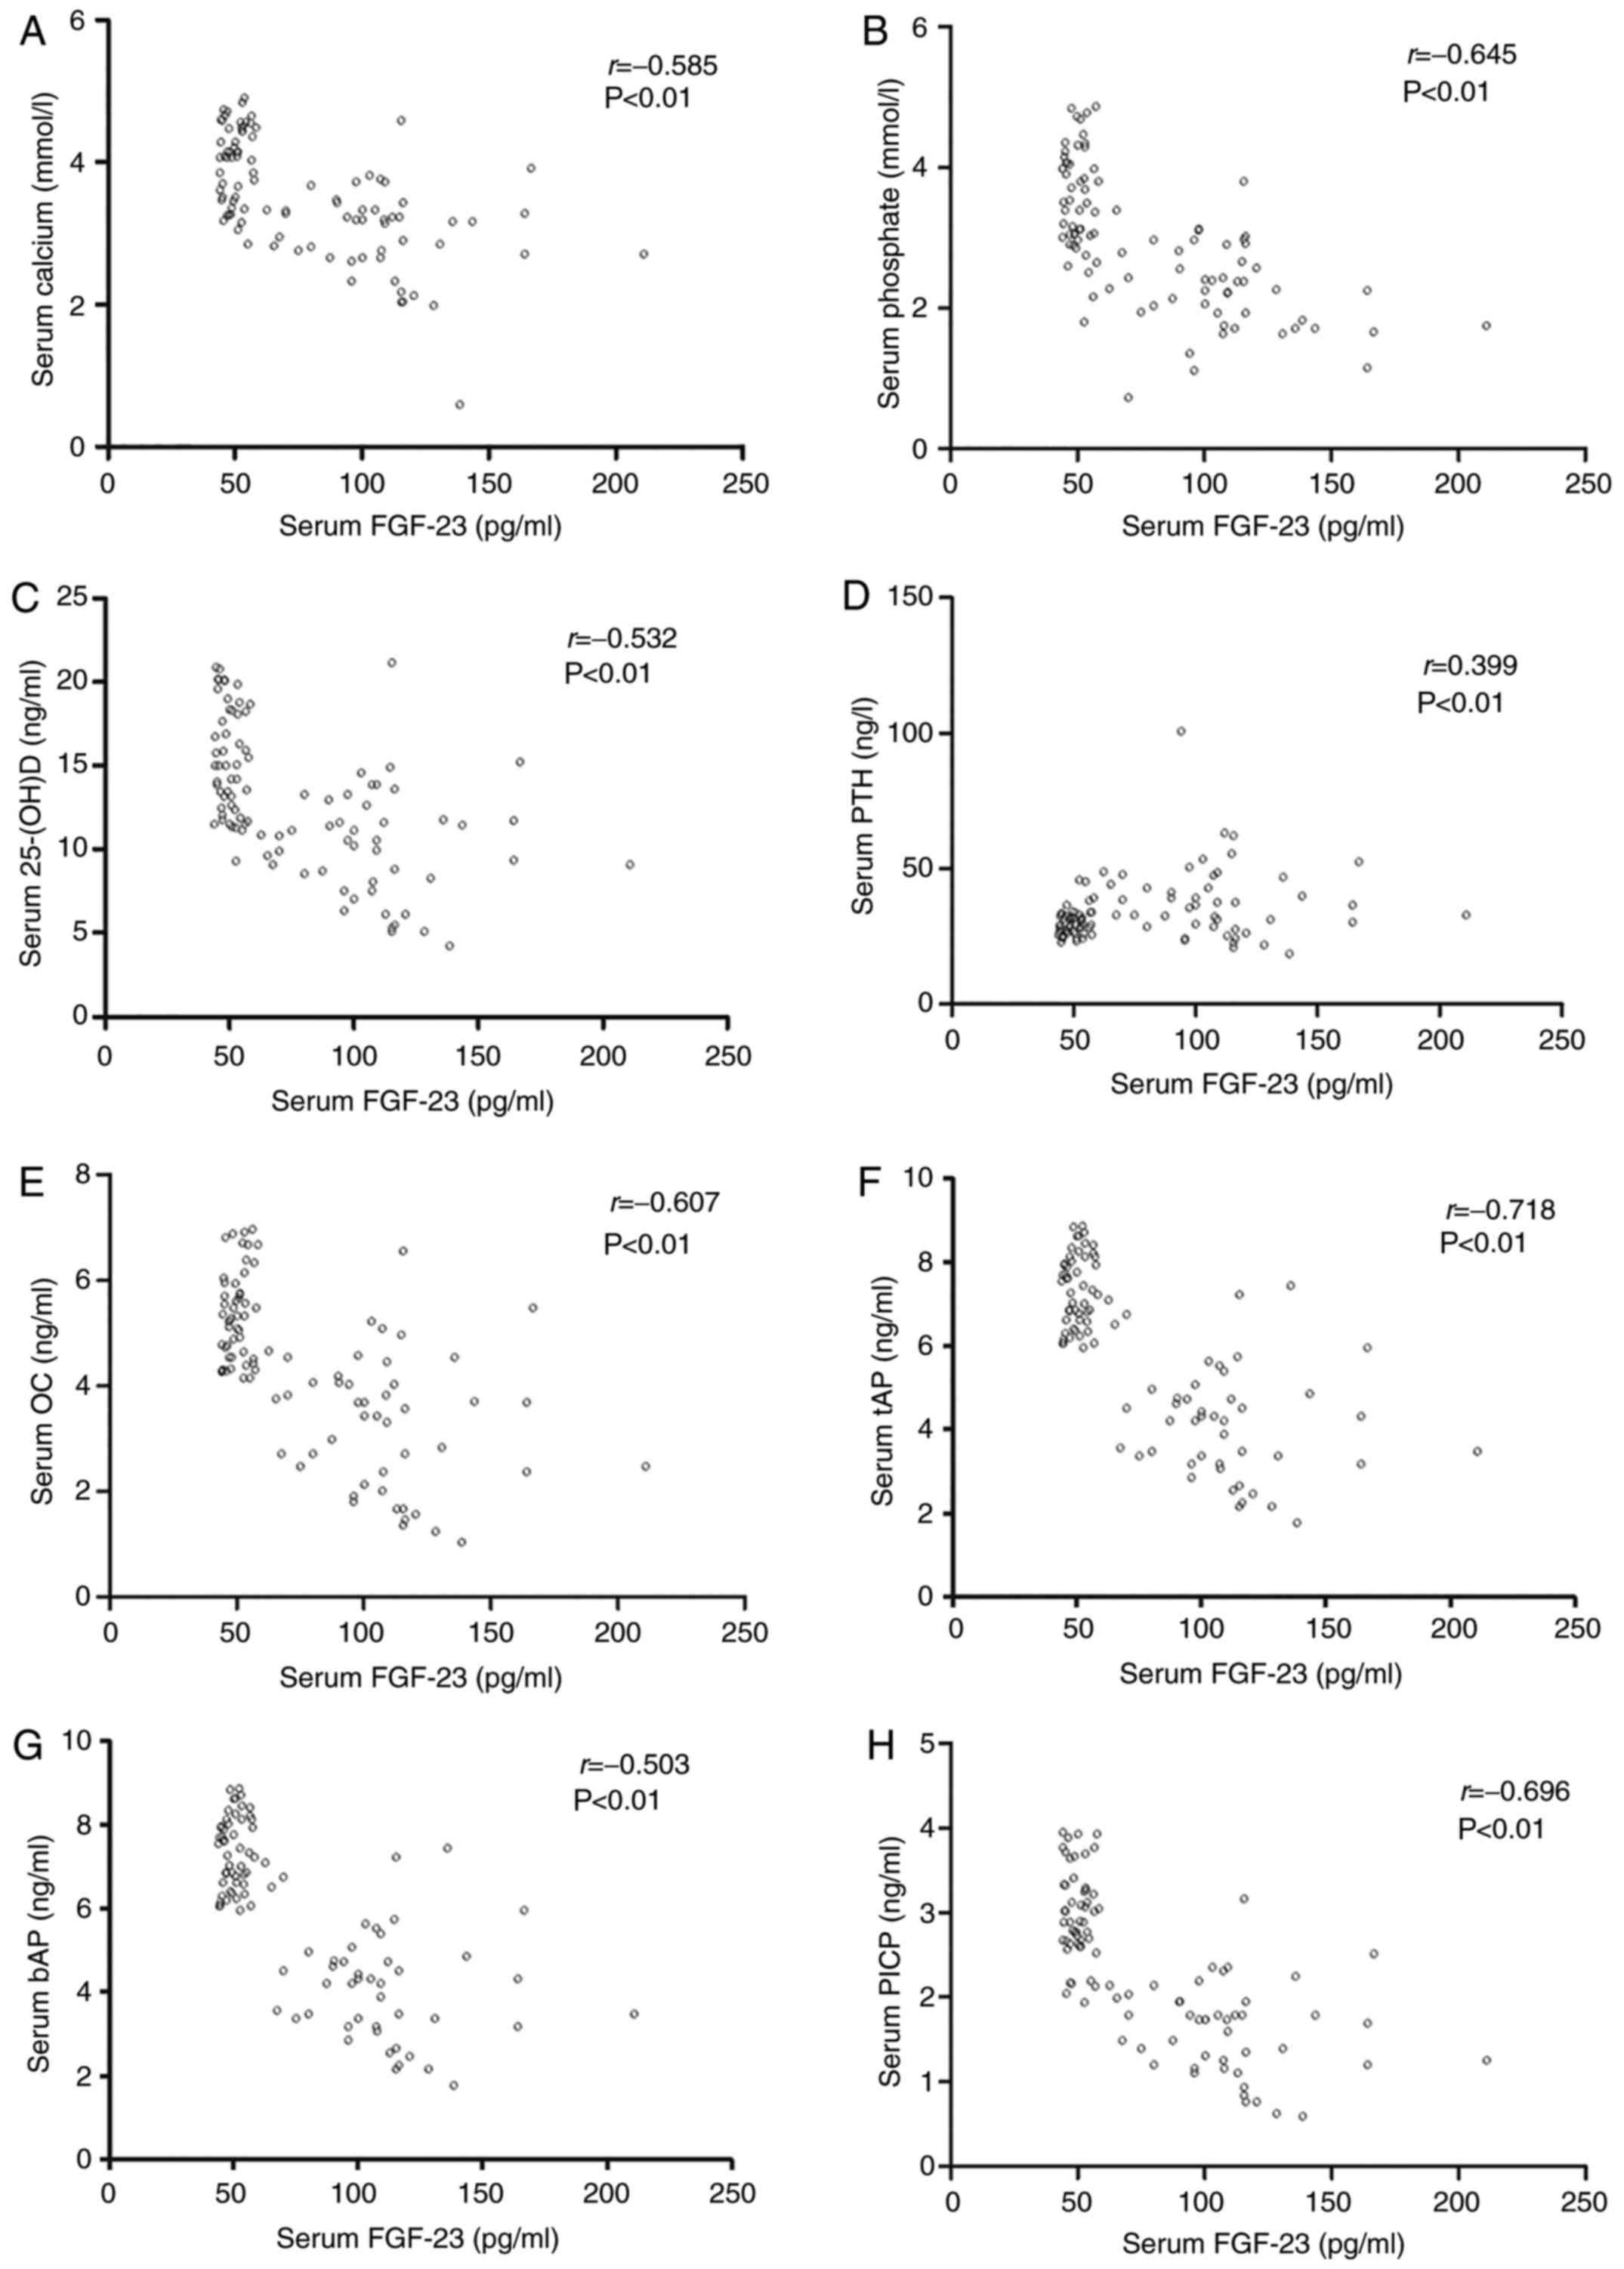 | Figure 5Associations between serum FGF-23
levels and biochemical parameters in ROD rats. Serum FGF-23 was
negatively correlated with (A) calcium, (B) phosphate, (C)
25-(OH)D, (e) OC, (F) tAP, (G) bAP, (H) PICP. However, serum FGF-23
levels were positively correlated with bone expression levels of
(D) serum PTH. Serum FGF-23 was negatively correlated with (I)
ICTP, (J) TRAP, (K) PYD, (L) DPD and (N) Col X. However, serum
FGF-23 levels were positively correlated with bone expression
levels of (M) FGF-23 protein. ROD, renal osteodystrophy; 25-(OH)D,
25-hydroxyvitamin D; bAP, bone-specific alkaline phosphatase; DPD,
deoxypyridinoline; FGF-23, fibroblast growth factor-23; ICTP,
cross-linked carboxyterminal telopeptide of type I collagen; OC,
osteocalcin; PICP, procollagen type I carboxy-terminal propeptide;
PTH, parathyroid hormone; PYD, urinary pyridinoline; tAP, total
alkaline phosphatase; TRAP, tartrate-resistant acid
phosphatase. |
Discussion
Adriamycin-induced nephropathy is often recognized
as a classical model for gaining valuable insights into the
molecular and cellular mechanisms of CKD and its complications
(16,17). However, it remains to be
identified whether Adriamycin triggers bone and mineral disorders
on the basis of nephrotoxicity. In 1980, Van Vleet and Ferrans
(18) first studied chronic
Adriamycin (2.4 mg/kg/w) intoxication in 50 weanling rabbits for
≤17 weeks; prominent renal damage was selective for the inner
cortex, and other lesions contained skeletal muscle degeneration
and osteodystrophy-associated fractures. Coincidentally, 2 decades
later, Ishii et al (19)
established a uremic model in Sprague-Dawley rats by a single
peritoneal injection of 5 mg/kg Adriamycin, and found that the
glomerular filtration rate (GFR) and serum 25-(OH)D were reduced by
52 and 77%, respectively, whereas PTH had a 2.5-fold increase after
14 weeks. The Adriamycin-injected rats could also develop a
low-turnover ROD resembling osteomalacia, as evidenced by a
4.3-fold increase in osteoid volume, a 73% reduction in BFR, a 56%
decrease in adjusted apposition rate, and a 5-fold increase in
mineralization lag time. As predicted, the present study confirmed
the nephrotoxicity of Adriamycin, indicated by significantly
increased BUN, SCr, UA, UCr, UPr and decreased serum Alb.
Progressive loss of renal function is one of the major
manifestations of Adriamycin toxicity in animals. Wu et al
(20) found that
Adriamycin-injected mice developed renal dysfunction characterized
by elevated BUN and SCr at day 28. Similarly, our study also
revealed that both BUN and SCr increased markedly in the ROD group
at the advanced stage, which may be due to Adriamycin-induced
reduction of glomerular size, mesangial expansion, tubular atrophy,
tubulointerstitial fibrosis and glomerular sclerosis (21). GFR is considered the best overall
index for the assessment of renal function, usually assessed by two
main routes: First, measuring the urinary excretion rate of a
tracer using timed urine collections (22); second, determination of the plasma
elimination kinetics of a tracer after a single bolus injection
(23). However, urine collection
is difficult to conduct precisely, and rats cannot tolerate
repeated blood draws. Therefore, GFR was not measured in this
study. In addition, Adriamycin injection could result in
significant reductions of serum calcium, phosphate, 25-(OH) D and
bone turnover markers, except for PTH. Furthermore, bone morphology
demonstrated low-turnover lesions associated with Adriamycin in the
present study.
FGF-23 is a bone-derived hormone that negatively
regulates serum phosphate and bone formation (24,25). A number of recent publications
based on clinical and experimental research suggest that serum
FGF-23 is elevated in CKD. A randomized controlled trial enrolling
556 children with CKD from 55 centers documented that the average
serum FGF-23 was 183 kRU/l among all patients and inversely
correlated with GFR; specifically, it gradually increased with the
disease duration (128 kRU/l in stage 3, 226 kRU/l in stage 4, and
654 kRU/l in stage 5) (26). In
an animal study conducted by Hasegawa et al (27), progressive nephritis was induced
in Wistar-Kyoto rats by single injection of anti-glomerular
basement membrane (GBM) antiserum. Serum FGF-23 showed a moderate
but significant increase by day 10 and rapidly increased thereafter
in rats with anti-GBM nephritis. In the present study, serum FGF-23
was significantly higher in the Adriamycin-injected rats throughout
the observational period, when compared with their counterparts,
and the highest level appeared at 3 months. However, whether FGF-23
serves as a biomarker for ROD progression remains unknown.
FGF-23 cellular signaling requires the concurrent
presence of FGFR-1, -2, -3, -4 and Klotho. Among the four
receptors, FGFR-1 has the highest affinity for FGF-23 (28). The findings of this study revealed
that elevated serum FGF-23 was accompanied by the overexpression of
bone FGF-23, FGFR-1 and Klotho in the ROD group. Mace et al
(29) established a 5/6
nephrectomy rat model to examine the regulation of FGF-23
expression, and found that serum and bone-derived FGF-23 levels
were markedly upregulated in uremic rats at 8 weeks post-surgery;
conversely, the influence of FGFR signaling was examined using the
FGFR inhibitor PD173074, which resulted in not only the suppression
of serum FGF-23, but also the downregulation of bone-derived FGF-23
in both uremic and normal control rats after 5-h of exposure. More
directly, Shalhoub et al (30) studied the effects of exogenous
FGF-23 on osteoblastic MC3T3.e1 cell proliferation and
differentiation for 14 days in vitro and observed that
FGF-23 plus Klotho produced significant inhibition of
mineralization and osteoblast activity through upregulating FGFR-1;
conversely, these effects could be fully blocked by the FGFR-1
inhibitor SU5402.
Col X is encoded by the COL10A1 gene and
synthesized by terminally differentiated chondrocytes. Currently,
Col X is the only known specific molecular marker for new bone
formation during endochondral ossification (31,32). Chung et al (33) generated transgenic mice carrying a
dominant interference mutation in Col X and observed the
development of craniofacial skeletal abnormalities, including skull
and mandibular dysplasia. In addition, genetic variation of
COL10A1 has been verified as the molecular basis of human
Schmid metaphyseal chondrodysplasia (SMCD). Chan et al
(34) studied Col X mutations in
the growth plate cartilage of patients with SMCD and discovered
that a nonsense mutation in the carboxyl-terminal domain not only
changed the Tyr632 codon (TAC) to a stop codon (TAA),
but that it also caused Col X haploinsufficiency. In the present
study, Col X expression was significantly suppressed and negatively
correlated with FGF-23 in ROD rats throughout the observational
period. In a transgenic mouse model, Wang et al (35) documented a notable elevation in
serum and bone FGF23 accompanied by downregulated Col X in the
growth plates. By contrast, blocking FGF-23 action could reverse
Col X downregulation and improve the skeletal phenotype in XLH mice
(36).
The last objective of the present study was to
determine whether serum FGF-23 could reflect changes in
conventional mineral and bone biomarkers in ROD progression. Our
study showed that serum FGF-23 was negatively correlated with
calcium, phosphate, 25-(OH)D and bone turnover biomarkers.
Similarly, Kanda et al (37) examined the association between
serum FGF-23 and bone-metabolism-associated markers in patients
with CKD and found that serum FGF-23 was negatively correlated with
calcium and 1,25(OH)2D. Furthermore, multivariate
logistic regression analysis showed that FGF-23 was independently
associated with vertebral fractures, and the optimal cutoff level
of FGF-23 indicative of vertebral fracture was 56.8 pg/ml
(sensitivity, 0.82; specificity, 0.63). Specifically, FGF-23
expression was negative for the markers of late osteogenic
differentiation, bone sialoprotein and OC in human trabecular bone
cells in vitro(38).
In conclusion, a biomarker for ROD should be
non-invasive, detectable early on, and consistent with bone
pathological changes. This study showed that serum level and bone
expression of FGF-23 were both significantly elevated in the ROD
group since 24 h post-surgery. Serum FGF-23 was significantly
associated with abnormalities in bone formation rate, osteo-blast,
osteoclast, trabecular volume thickness, and osteoid volume.
Therefore, FGF-23 may serve as a novel biomarker for ROD. However,
the present study is still only observational and exploratory, and
more evidence will be collated in the future. even though
information on this hypothesis is still scarce, in
vitrostudies have been initiated in our laboratory to verify
the data.
Acknowledgments
Not applicable.
Funding
This study was supported by the National Natural
Science Foundation of China (grant no. 81570637).
Availability of data and materials
The datasets generated during and/or analyzed during
the current study are available from the corresponding author on
reasonable request.
Authors’ contributions
PH and BH conceived and supervised the study; SYL,
DDZ, HHL, YFW, GMJ, YX and YW performed experiments; SYL and DDZ
analyzed data; SYL and PH wrote the manuscript; XX and WW reviewed
the manuscripts. All authors approved the final version of the
manuscript.
Ethics approval and consent to
participate
All animal experimentation was undertaken in
accordance with the guidelines of the Institutional Animal Use and
Care Committee, Anhui Medical University.
Patient consent for publication
Not applicable.
Competing interests
The authors declare no conflict of interest.
Abbreviations:
|
ABD
|
adynamic bone disease
|
|
Alb
|
Serum albumin
|
|
bAP
|
bone-specific alkaline phosphatase
|
|
BUN
|
blood urea nitrogen
|
|
CKD
|
chronic kidney disease
|
|
Col X
|
collagen X
|
|
DPD
|
urinary deoxypyridinoline
|
|
FGF-23
|
fibroblast growth factor-23
|
|
FGFR
|
fibroblast growth factor receptor
|
|
ICTP
|
cross-linked carboxyterminal
telopeptide of type I collagen
|
|
OC
|
osteocalcin
|
|
PICP
|
procollagen type I carboxy-terminal
propeptide
|
|
PTH
|
parathyroid hormone
|
|
PYD
|
pyridinoline
|
|
ROD
|
renal osteodystrophy
|
|
SCr
|
serum creatinine
|
|
SHPT
|
secondary hyperparathyrodism
|
|
tAP
|
total alkaline phosphatase
|
|
TRAP
|
artrate-resistant acid phosphatase
|
|
UA
|
uric acid
|
|
UCr
|
urine creatinine
|
|
UP
|
urinary protein
|
|
XLH
|
X-linked hypophosphatemic
|
References
|
1
|
Sherrard DJ, Hercz G, Pei Y, Maloney NA,
Greenwood C, Manuel A, Saiphoo C, Fenton SS and Segre GV: The
spectrum of bone disease in end stage renal failure-an evolving
disorder. Kidney Int. 43:436–442. 1993. View Article : Google Scholar : PubMed/NCBI
|
|
2
|
Afifi A: Renal osteodystrophy in
developing countries. Artif Organs. 26:767–769. 2002. View Article : Google Scholar : PubMed/NCBI
|
|
3
|
Mathias R, Salusky I, Harman W, Paredes A,
Emans J, Segre G and Goodman W: Renal bone disease in pediatric and
young adult patients on hemodialysis in a children’s hospital. J Am
Soc Nephrol. 3:1938–1946. 1993.PubMed/NCBI
|
|
4
|
Moore C, Yee J, Malluche H, Rao DS,
Monier-Faugere MC, Adams E, Daramola-Ogunwuyi O, Fehmi H, Bhat S
and Osman-Malik Y: Association between bone histology and markers
of bone and mineral metabolism in african-american hemodialysis
patients. Clin J Am Soc Nephrol. 4:1484–1493. 2009. View Article : Google Scholar : PubMed/NCBI
|
|
5
|
Ferreira A, Saraiva M, Behets G, Macedo A,
Galvão M, D’Haese P and Drüeke TB: evaluation of bone remodeling in
hemodialysis patients: Serum biochemistry, circulating cytokines
and bone histomorphometry. J Nephrol. 22:783–793. 2009.PubMed/NCBI
|
|
6
|
Bervoets AR, Spasovski GB, Behets GJ, Dams
G, Polenakovic MH, Zafirovska K, Van Hoof VO, De Broe Me and
D’Haese PC: Useful biochemical markers for diagnosing renal
osteodystrophy in predialysis end-stage renal failure patients. Am
J Kidney Dis. 41:997–1007. 2003. View Article : Google Scholar : PubMed/NCBI
|
|
7
|
Portale AA, Zhang MY, David V, Martin A,
Jiao Y, Gu W and Perwad F: Characterization of FGF23-dependent
egr-1 cistrome in the mouse renal proximal tubule. PLoS One.
10:e01429242015. View Article : Google Scholar : PubMed/NCBI
|
|
8
|
Hu P, Xuan Q, Hu B, Lu L, Wang J and Qin
YH: Fibroblast growth factor-23 helps explain the biphasic
cardiovascular effects of vitamin D in chronic kidney disease. Int
J Biol Sci. 8:663–671. 2012. View Article : Google Scholar : PubMed/NCBI
|
|
9
|
Bai X, Miao D, Li J, Goltzman D and
Karaplis AC: Transgenic mice overexpressing human fibroblast growth
factor 23 (R176Q) delineate a putative role for parathyroid hormone
in renal phosphate wasting disorders. endocrinology. 145:5269–5279.
2004. View Article : Google Scholar : PubMed/NCBI
|
|
10
|
Wang H, Yoshiko Y, Yamamoto R, Minamizaki
T, Kozai K, Tanne K, Aubin JE and Maeda N: Overexpression of
fibroblast growth factor 23 suppresses osteoblast differentiation
and matrix mineralization in vitro. J Bone Miner Res. 23:939–948.
2008. View Article : Google Scholar : PubMed/NCBI
|
|
11
|
Parker VJ, Harjes LM, Dembek K, Young GS,
Chew DJ and Toribio RE: Association of Vitamin D metabolites with
parathyroid hormone, fibroblast growth factor-23, calcium, and
phosphorus in dogs with various stages of chronic kidney disease. J
Vet Intern Med. 31:791–798. 2017. View Article : Google Scholar : PubMed/NCBI
|
|
12
|
Isakova T, Xie H, Yang W, Xie D, Anderson
AH, Scialla J, Wahl P, Gutiérrez OM, Steigerwalt S, He J, et al
Chronic renal Insufficiency Cohort (Cric) Study Group: Fibroblast
growth factor 23 and risks of mortality and end-stage renal disease
in patients with chronic kidney disease. JAMA. 305:2432–2439. 2011.
View Article : Google Scholar : PubMed/NCBI
|
|
13
|
Kim J and Shin W: How to do random
allocation (randomization). Clin Orthop Surg. 6:103–109. 2014.
View Article : Google Scholar : PubMed/NCBI
|
|
14
|
Livak KJ and Schmittgen TD: Analysis of
relative gene expression data using real-time quantitative PCR and
the 2(-Delta Delta C(T)) method. Methods. 25:402–408. 2001.
View Article : Google Scholar
|
|
15
|
Schmittgen TD and Livak KJ: Analyzing
real-time PCR data by the comparative C(T) method. Nat Protoc.
3:1101–1108. 2008. View Article : Google Scholar : PubMed/NCBI
|
|
16
|
Hu P, Qin YH, Pei J, Lei FY, Hu B and Lu
L: Beneficial effect of all-trans retinoic acid (ATRA) on
glomerulosclerosis rats via the downregulation of alpha-smooth
muscle actin: A comparative study between ATRA and benazepril. Exp
Mol Pathol. 89:51–57. 2010. View Article : Google Scholar : PubMed/NCBI
|
|
17
|
Okuda S, Oh Y, Tsuruda H, Onoyama K,
Fujimi S and Fujishima M: Adriamycin-induced nephropathy as a model
of chronic progressive glomerular disease. Kidney Int. 29:502–510.
1986. View Article : Google Scholar : PubMed/NCBI
|
|
18
|
Van Vleet JF and Ferrans VJ: Clinical and
pathologic features of chronic adriamycin toxicosis in rabbits. Am
J Vet Res. 41:1462–1469. 1980.PubMed/NCBI
|
|
19
|
Ishii H, Wada M, Furuya Y, Nagano N,
Nemeth EF and Fox J: Daily intermittent decreases in serum levels
of parathyroid hormone have an anabolic-like action on the bones of
uremic rats with low-turnover bone and osteomalacia. Bone.
26:175–182. 2000. View Article : Google Scholar : PubMed/NCBI
|
|
20
|
Wu HJ, Yiu WH, Wong DW, Li RX, Chan LY,
Leung JC, Zhang Y, Lian Q, Lai KN, Tse HF, et al: Human induced
pluripotent stem cell-derived mesenchymal stem cells prevent
adriamycin nephropathy in mice. Oncotarget. 8:103640–103656. 2017.
View Article : Google Scholar : PubMed/NCBI
|
|
21
|
Wang Y, Wang YP, Tay YC and Harris DC:
Progressive adriamycin nephropathy in mice: Sequence of histologic
and immunohistochemical events. Kidney Int. 58:1797–1804. 2000.
View Article : Google Scholar : PubMed/NCBI
|
|
22
|
Brod J and Sirota JH: The renal clearance
of endogenous ‘creatinine’ in man. J Clin Invest. 27:645–654. 1948.
View Article : Google Scholar : PubMed/NCBI
|
|
23
|
Cousins C, Mohammadtaghi S, Mubashar M,
Strong R, Gunasekera RD, Myers MJ and Peters AM: Clearance kinetics
of solutes used to measure glomerular filtration rate. Nucl Med
Commun. 20:1047–1054. 1999. View Article : Google Scholar : PubMed/NCBI
|
|
24
|
Hu P, Huang BY, Xia X, Xuan Q, Hu B and
Qin YH: Therapeutic effect of CNP on renal osteodystrophy by
antagonizing the FGF-23/MAPK pathway. J Recept Signal Transduct
Res. 36:213–219. 2016. View Article : Google Scholar
|
|
25
|
Wolf M: Update on fibroblast growth factor
23 in chronic kidney disease. Kidney Int. 82:737–747. 2012.
View Article : Google Scholar : PubMed/NCBI
|
|
26
|
Doyon A, Fischer DC, Bayazit AK, Canpolat
N, Duzova A, Sözeri B, Bacchetta J, Balat A, Büscher A, Candan C,
et al: Markers of bone metabolism are affected by renal function
and growth hormone therapy in children with chronic kidney disease.
PLoS One. 10:e01134822015. View Article : Google Scholar : PubMed/NCBI
|
|
27
|
Hasegawa H, Nagano N, Urakawa I, Yamazaki
Y, Iijima K, Fujita T, Yamashita T, Fukumoto S and Shimada T:
Direct evidence for a causative role of FGF23 in the abnormal renal
phosphate handling and vitamin D metabolism in rats with
early-stage chronic kidney disease. Kidney Int. 78:975–980. 2010.
View Article : Google Scholar : PubMed/NCBI
|
|
28
|
Urakawa I, Yamazaki Y, Shimada T, Iijima
K, Hasegawa H, Okawa K, Fujita T, Fukumoto S and Yamashita T:
Klotho converts canonical FGF receptor into a specific receptor for
FGF23. Nature. 444:770–774. 2006. View Article : Google Scholar : PubMed/NCBI
|
|
29
|
Mace ML, Gravesen E, Nordholm A,
Hofman-Bang J, Secher T, Olgaard K and Lewin E: Kidney fibroblast
growth factor 23 does not contribute to elevation of its
circulating levels in uremia. Kidney Int. 92:165–178. 2017.
View Article : Google Scholar : PubMed/NCBI
|
|
30
|
Shalhoub V, Ward SC, Sun B, Stevens J,
Renshaw L, Hawkins N and Richards WG: Fibroblast growth factor 23
(FGF23) and alpha-klotho stimulate osteoblastic MC3T3e1 cell
proliferation and inhibit mineralization. Calcif Tissue Int.
89:140–150. 2011. View Article : Google Scholar : PubMed/NCBI
|
|
31
|
Schmid TM and Linsenmayer TF:
Immunohistochemical localization of short chain cartilage collagen
(type X) in avian tissues. J Cell Biol. 100:598–605. 1985.
View Article : Google Scholar : PubMed/NCBI
|
|
32
|
Kwan AP, Cummings CE, Chapman JA and Grant
ME: Macromolecular organization of chicken type X collagen in
vitro. J Cell Biol. 114:597–604. 1991. View Article : Google Scholar : PubMed/NCBI
|
|
33
|
Chung KS, Jacenko O, Boyle P, Olsen BR and
Nishimura I: Craniofacial abnormalities in mice carrying a dominant
interference mutation in type X collagen. Dev Dyn. 208:544–552.
1997. View Article : Google Scholar : PubMed/NCBI
|
|
34
|
Chan D, Weng YM, Graham HK, Sillence DO
and Bateman JF: A nonsense mutation in the carboxyl-terminal domain
of type X collagen causes haploinsufficiency in schmid metaphyseal
chon-drodysplasia. J Clin Invest. 101:1490–1499. 1998. View Article : Google Scholar : PubMed/NCBI
|
|
35
|
Wang X, Wang S, Li C, Gao T, Liu Y,
Rangiani A, Sun Y, Hao J, George A, Lu Y, et al: Inactivation of a
novel FGF23 regulator, FAM20C, leads to hypophosphatemic rickets in
mice. PLoS Genet. 8:e10027082012. View Article : Google Scholar : PubMed/NCBI
|
|
36
|
Liu ES, Martins JS, Raimann A, Chae BT,
Brooks DJ, Jorgetti V, Bouxsein ML and Demay MB:
1,25-Dihydroxyvitamin D alone improves skeletal growth,
microarchitecture, and strength in a murine model of XLH, despite
enhanced FGF23 expression. J Bone Miner Res. 31:929–939. 2016.
View Article : Google Scholar : PubMed/NCBI
|
|
37
|
Kanda E, Yoshida M and Sasaki S:
Applicability of fibroblast growth factor 23 for evaluation of risk
of vertebral fracture and chronic kidney disease-mineral bone
disease in elderly chronic kidney disease patients. BMC Nephrol.
13:1222012. View Article : Google Scholar : PubMed/NCBI
|
|
38
|
Riminucci M, Collins MT, Fedarko NS,
Cherman N, Corsi A, White KE, Waguespack S, Gupta A, Hannon T,
Econs MJ, et al: FGF-23 in fibrous dysplasia of bone and its
association to renal phosphate wasting. Clin J Invest. 112:683–692.
2003. View Article : Google Scholar
|