Introduction
Alzheimer’s disease (AD), the most prevalent disease
leading to progressive dementia, is characterized by degenerative
alterations in various neurotransmitter systems, including the
monoaminergic neural system, and changes in selected brain regions
(1,2). Clinically, it is characterized by
the progressive loss of cognitive function and memory (3). Several risk factors, including
metabolic diseases, cardiovascular diseases, brain insults, aging
and genetic factors, have been identified, however, the etiology of
AD remains to be fully elucidated (4). As the most general form of dementia,
AD is a widely recognized public health crisis, accounting for
50-70% of dementia cases (5,6).
Therefore, it is necessary to have an increased understanding of AD
in order to improve its diagnosis and treatment, and to accelerate
the development of novel therapeutics to reduce dementia
symptoms.
Amyloid β-protein (Aβ) peptides are generated by the
successive proteolysis of β-amyloid precursor protein (APP), a
transmembrane glycoprotein (7,8)
which is cleaved initially by the APP cleaving enzyme 1 (BACE1) and
subsequently by γ-secretase in the transmembrane domain (9). Aggregated Aβ is pivotal in the
pathogenesis of AD (10).
Following penetrating of the neuronal membrane, Aβ aggregates and
destroys cell membranes, inducing memory deficits and neuronal loss
(11). Oxidative stress refers to
the cytopathologic consequences of a mismatch between the
production of free radicals and the ability of cells to defend
against them (12). A previous
study suggested that oxidative stress may be critical in neuronal
degeneration in diseases including AD (13). Muhammad et al compiled
findings on the significance of reactive oxygen species (ROS) in
the pathophysiology of AD (14).
Mitochondria are one of major sources of ROS in cells, and
dysfunction in mitochondrial respiration can increase the formation
of ROS in mitochondria (15). The
importance of mitochondria in regulating cell apoptosis has been
well-documented (16).
Progressive mitochondrial dysfunction contributes to neuronal
degeneration in age-mediated disease (17). It is possible that a downward
spiral may be important to the pathogenesis of AD, including an
interaction between oxidative stress and mitochondrial dysfunction,
promoting the initiation or/and amplification of ROS (18,19).
Notch signals are transferred among adjacent cells
through Notch receptors and their ligands that regulate
differentiation, proliferation and apoptosis in several cell types,
including stem cells (20). Hairy
and enhancer of split (Hes)-related with YRPW motif protein 2
(HEY2), a hairy-related transcription factor family of
Notch-downstream transcriptional repressors, has indispensable and
complementary functions for the development of blood vessels
(21,22). MicroRNAs (miRs) are small
non-coding RNAs that regulate protein output
post-transcriptionally, and each biological process is associated
with miRNA-dependent regulation (23). miR-98 inhibits angiogenesis by
modulating the activities of endothelial cells involved in tubule
formation, cell invasion and cell spreading (24). The present study aimed to
investigate the effect of miR-98 on the production of Aβ, oxidative
stress and mitochondrial dysfunction through the Notch signaling
pathway by targeting HEY2 in AD mice, with the aim of providing a
novel basis for targeted therapy of AD.
Materials and methods
Ethics statement
The protocols of the present study were approved by
the Institutional Review Board of the Affiliated Hospital of
Taishan Medical University (Taishan, China). All animal experiments
were performed according to the Guide for the Care and Use of
Laboratory Animal by International Committees.
Study subjects and AD model
establishment
A total of 70 Kunming mice (aged 24-30 months old,
weighing 20-25 g), comprising 35 males and 35 females were provided
by the Institute of Laboratory Animal of Sichuan Academy of Medical
Sciences (Jianyang, China). They were acclimatized for 1 week prior
to the experiment and were reared in cages according to gender.
With natural light, all mice had free access to water and food. The
room temperature of the laboratory was 18-22°C, with relative
humidity 40-70% and noise <50 db. The mice were randomly divided
into the AD group and the normal group (35 mice per group; all
female). The mice were weighed and anesthetized with 0.4% sodium
pentobarbital (40 mg/kg). Following routine disinfection,
scopolamine (3 mg/kg) (0.3 mg/ml; Xuzhou Lane Pharmaceutical Co.,
Ltd., Xuzhou, Jiangsu) was injected into the subcutaneous occipital
region of the posterior brain every day for a consecutive 2-week
period to establish the AD model. The normal group was administered
with equal volumes of normal saline for 2 weeks. The initial
criteria of successful AD establishment were as follows: Slow
movement, reduced food intake, unresponsive to external stimuli,
dry hair, limb paralysis, overbalancing, and spinning to the right
during tail lift. Finally, 28 AD mice were successfully
modeled.
Behavioral assessment
A step-down passive avoidance test was performed 3
days following successful AD establishment. The platform reaction
box, 10×10×5 cm, was provided by the Institute of Materia Medical,
Chinese Academy of Medical Sciences (Beijing, China). The box was
divided into two sections by a copper gate with continuous
electrical stimulation (36 V) at the bottom of the box. As a safe
area for the mice to avoid electric shock, a rubber pad of 4.5 cm
inner diameter and height was placed on the right rear corner of
each box. Prior to assessment, the mice were placed in the
instrument for 3 min with 36 V alternating voltage at the bottom of
the copper gate. The time taken to react to jump to the pad
(reaction time) and the number of electric shocks they received
within 5 min (error frequency) were recorded as learning
achievements. After 24 h, the animals were again placed into the
instrument for 3 min and then set on the pad. The first time they
jumped off the pad (latent period) and the number of electric
shocks they received within 5 min (error frequency) were recorded
as memory achievements.
Oxidative stress detection in the mouse
hippocampus
Following the behavioral assessment, eight mice were
randomly selected and immediately sacrificed. The brain tissues
were removed for index determination. The mice were sacrificed by
cervical dislocation, and the hippocampus was removed immediately
into an ice bath. The brain tissues were washed with saline, dried
with neutral filter paper and placed in a homogenizer.
Subsequently, 10% tissue homogenates were made with 0.25 mol/l
sucrose and 0.01 mol/l Tris buffer and were centrifuged (4°C) for
30 min at 11,450 × g. The supernatants were collected to determine
the activity and level of various oxidative stress markers,
including glutathione peroxidase (GSH-Px), reduced glutathione
(GSH), superoxide dismutase (SOD), malondialdehyde (MDA),
acetylcholinesterase (AChE) and Na+-K+-ATP.
Assay kits used included the GSH-Px assay kit (cat. no. QS1202,
Beijing Solarbio Science and Technology Co., Ltd., Beijing, China),
the GSH assay kit (cat. no. BC1170, Beijing Solarbio Science and
Technology Co., Ltd.), the SOD assay kit (cat. no. BC0170, Beijing
Solarbio Science and Technology Co., Ltd.), the MDA assay kit (cat.
no. A003-1, Nanjing Jiancheng Institute of Biological Engineering,
Nanjing, Jiangsu, China), the AChE assay kit (cat. no. BH4872,
Shanghai Bo Yao Biotechnology Co., Ltd., Shanghai, China) and the
Na+-K+-ATP activity assay kit (cat. no.
QS1700, Beijing Solarbio Biotechnology Co., Ltd.). All assays were
performed in strict accordance to the kit protocol.
Hematoxylin and eosin (H&E)
staining
On the 16th day following AD establishment, 10 mice
in each group were sacrificed. The hippocampal tissues were removed
and fixed with 4% paraformaldehyde for 24 h. Following dehydration
with 80, 90 and 100% ethanol and n-butanol, the hippocampus was
waxed in a 60°C wax box and then embedded in paraffin. Tissue
sections (5-µm) were dried at 45°C and obtained from each
paraffin block. The sections were heated at 60°C for 1 h and
dewaxed with xylene. Following hydration, the sections were stained
with H&E (Beijing Solarbio Science and Technology Co., Ltd.),
dehydrated with gradient ethanol, cleared with xylene and mounted
with neutral gum. Morphological changes of neurons in the CA1
region of brain tissues in the two groups of mice were observed
under an optical microscope (XP-330; Shanghai Bing Yu Optical
Instrument Co., Ltd., Shanghai, China). The procedure was repeated
three times.
Immunohistochemistry
The treated hippocampal tissues were collected for
the experiment. The sections (30 µm) were exposed to rabbit
anti-mouse (HEY2) monoclonal antibody (10597-1-AP, 1:100; Wuhan
Sanying Biotechnology Co. Ltd., Wuhan, Hubei, China) at 4°C
overnight and were subsequently incubated with biotinylated
goat-anti-rabbit immunoglobulin G horseradish peroxidase (IgG-HRP)
secondary antibody (cat. no. SE134, Beijing Solarbio Science and
Technology Co., Ltd.) at 37°C for 30 min. The nuclei were
counterstained with hematoxylin (cat. no. C0105, Beyotime Institute
of Biotechnology, Shanghai, China) for 30 sec and developed with
diaminobenzidine (cat. no. P0202, Beyotime Institute of
Biotechnology). The sections were then dehydrated to transparency
with hydrochloric acid ethanol and mounted with gum. The
immunohistochemical criteria were as follows: Positive expression
indicated that percentage of positive cells reached >10%, with
obvious brown or brownish yellow particles present in the
cytoplasm. Five visual fields were randomly selected and observed
under an optical microscope. The positive expression rate was
determined as the ratio of the number of positive samples to the
total number of samples. The assessment was repeated three
times.
Terminal deoxynucleotidyl transferase
dUTP nick end labeling (TUNEL) staining
The treated hippocampal tissues were obtained for
the experiment. A TUNEL kit (cat. no. C1086, Beyotime Institute of
Biotechnology) was used to measure apoptosis of the hippocampal
neurons. The sections were treated with 3%
H2O2, dewaxed with xylene I and II for 10 min
each, dehydrated in gradient ethanol at concentrations of 100, 95,
80 and 70% for 2 min each, and soaked with 3%
H2O2 at room temperature for 10 min.
Following washing with PBS for 5 min, 50 µl protease K
solution (20 µg/ml; cat. no. P6556, Sigma-Aldrich; EMD
Millipore, Billerica, MA, USA) was added. The sections were
detached at 37°C for 10 min and washed with PBS twice (5 min per
wash). According to the manufacturer’s protocol, the sections were
treated with 50 µl TUNEL reaction liquid, incubated at 37°C
for 45 min and washed with PBS twice (5 min per wash). Following
the addition of 50 µl transfer fluid, the sections were
incubated at 37°C for 45 min, washed with PBS twice (5 min each
wash), and developed with 50 µl substrate at 25°C for 10
min. Following washing completely, the sections were mounted,
observed under a microscope and analyzed. Views of the CA1 region
of the hippocampus were observed and recorded under a 400X optical
microscope. Positive apoptotic cells in the CA1 region were
analyzed using an image analyzer (ImageJ, V1.8.0 National
Institutes of Health, Bethesda, MD, USA) Positive nuclear labeling
was brownish yellow and negative cell nuclei were light blue. A
total of 10 fields were randomly selected. The ratio of the number
of positive cells to the total number of cells was determined as
the apoptotic index (AI).
RNA isolation and reverse
transcription-polymerase chain reaction (RT-PCR) analysis for
mitochondrial DNA (mtDNA)
To determine the copy number of neuron mtDNA,
RT-qPCR analysis was used to analyze the total DNA content of the
mitochondria. On the 18th day following AD establishment, 10 mice
from each group were sacrificed. The brain hippo-campal tissues
(100 ml were removed and treated with 1 m; TRIzol (Invitrogen;
Thermo Fisher Scientific, Inc., Waltham, MA, USA). The tissues were
ground on ice, placed in 1.5 ml Eppendorf (EP) tubes, mixed
uniformly with 200 µl chloroform, placed at room temperature
for 5 min, and centrifuged at 4°C for 15 min (25,764 × g).
Subsequently, 300 µl of the upper aqueous phase was removed,
placed into new centrifuge tubes, mixed uniformly with equal
volumes of isopropyl alcohol, placed on ice for 10 min and
centrifuged at 4°C for 10 min (25,764 × g). Following discarding of
the supernatants, the tissues were treated with 1 ml precooled 75%
ethanol at 4°C and centrifuged at 4°C for 2 min (25,764 × g). The
supernatants were discarded again and the EP tubes were inverted
and dried at room temperature. RNA was dissolved in 70 µl
diethyl phosphorocyanidate. The tissues were incubated in a water
bath at 55°C for 15 min and stored at −80°C. cDNA was synthesized
using a reverse transcription kit (cat. no. 10601ES76, Shanghai Yi
Sheng Biotechnology Co., Ltd., Shanghai, China). The system was
prepared in sterile EP tubes. The reagent (20 µl) was added
according to the manufacturer’s protocol, and the synthesized cDNA
was stored at 4°C. The copy number of the mitochondrial coding gene
COXI was used as the mtDNA copy number, and 8-Oxoguanine
DNA-glycosylase 1 (Ogg1) was used as an internal reference for the
purpose of reducing the difference in the amount of DNA template in
different tissues. According to gene sequences in the GenBank
database (www.ncbi.nlm.nih.gov/genbank) mitochondrial primers
were designed and synthesized by Shanghai Sangon Biotech Co., Ltd.
(Shanghai, China). The PCR sample and protocol were as follows: 2X
10 µl TaqMan Universal PCR Master Mix, 0.4 µl MT
upstream and downstream primers, 0.4 µl Ogg1 probe, 0.8
µl module, and 8.2 µl ddH2O;
predenaturation at 95°C for 10 min, 40 cycles of denaturation at
95°C for 15 sec, and annealing and extension at 60°C for 60 sec
(Table I). The gene amplification
products of total mitochondrial RNA were assessed by 1% agarose gel
electrophoresis. The average density value of each amplification
product strip was analyzed by a gel image automatic analysis
software Quantity One 4.4.0 (Bio-Rad Laboratories, Inc., Hercules,
CA, USA). The relative density value of amplification products of
mitochondrial genes and Ogg1 represented relative levels of
mitochondria.
 | Table IPrimer sequences for reverse
transcription-polymerase chain reaction analysis. |
Table I
Primer sequences for reverse
transcription-polymerase chain reaction analysis.
| Gene | Sequence |
|---|
| MT | F:
5′-CCCAGCTACTACCATCATTCAAGT-3′ |
| R:
5′-GATGGTTTGGGAGATTGGTTGATGT-3′ |
| Ogg1 | F:
5′-ATGAGGACCAAGCTAGGTGAC-3′ |
| R:
5′-GCCTCACAATCAACTTATCCC-3′ |
RT-quantitative PCR analysis (RT-qPCR) of
mRNA levels
The hippocampal tissues were removed, treated with 1
ml TRIzol reagent (Invitrogen; Thermo Fisher Scientific, Inc.) and
pulverized in an ice bath. According to the manufacturer’s protocol
of the TRIzol reagent, the total RNA of the tissues was collected.
The purity and concentration of the RNA were detected by
ultraviolet spectrophotometry (UV1901; Shanghai Austrian Scientific
Instruments Co., Ltd., Shanghai, China). Samples with
A260/A280=1.8-2.0 concentration were adjusted to 50 ng/µl.
The RNA was reverse transcribed into cDNA (50 ng/µl) with a
PrimeScriptä RT reagent kit (cat. no. RR047A, Beijing, Zhi Jie Fang
Yuan Technology Co., Ltd., Beijing, China) and stored at −80°C
until further use. The primers were automatically designed using
gene tool software [GeneTool Lite V1.0, Genebio Bioinformatics
(Genebio) SA, Geneva, Switzerland] and synthesized by Beijing
TSINGKE Biological Technology Co., Ltd. (Beijing, China), listed in
Table II. According to a
two-step method, the experiment was performed with an ABI 7900HT
real-time quantitative PCR instrument, with U6 and
glyceraldehyde-3-phosphate dehydrogenase (GAPDH) as internal
references. The reaction conditions were as follows:
Predenaturation at 95°C for 30 sec, 40 cycles of denaturation at
95°C for 5 sec, annealing at 58°C for 30 sec and extension at 72°C
for 15 sec. The relative mRNA levels of miR-98, HEY2, Jagged1,
Notch1, Hes1, Hes5, APP, Bax and Bcl-2 were calculated using the
2−Δ∆Cq method (25). Three wells were included for each
gene of each sample. This method was also used for subsequent cell
experiments. The experiment was repeated three times.
| Table IIPrimer sequences used for reverse
transcription-quantitative polymerase chain reaction analysis. |
Table II
Primer sequences used for reverse
transcription-quantitative polymerase chain reaction analysis.
| Gene | Sequence |
|---|
| miR-98 | F:
5′-TGAGGTAGTAAGTTGTAT-3′ |
| R:
5′-AACATGTACAGTCCATGATG-3′ |
| HEY2 | F:
5′-CGCCCTTGTGAGGAAACGA-3′ |
| R:
5′-CCCAGGGTAATTGTTCTCGCT-3′ |
| Jagged1 | F:
5′-AGAAGTCAGAGTTCAGAGGCGTCC-3′ |
| R:
5′-AGTAGAAGGCTGTCACCAAGCAAC-3′ |
| Notch1 | F:
5′-GATGGCCTCAATGGGTACAAG-3′ |
| R:
5′-TCGTTGTTGTTGATGTCACAGT-3′ |
| Hes1 | F:
5′-TCAACACGACACCGGACAAAC-3′ |
| R:
5′-ATGCCGGGAGCTATCTTTCTT-3′ |
| Hes5 | F:
5′-AGTCCCAAGGAGAAAAACCGA-3′ |
| R:
5′-GCTGTGTTTCAGGTAGCTGAC-3′ |
| APP | F:
5′-GTGGACTCTGTGCCAGCCAATA-3′ |
| R:
5′-GTCTTGATGTTTGTCAGCCCAGAA-3′ |
| Bax | F:
5′-AGACAGGGGCCTTTTTGCTAC-3′ |
| R:
5′-AATTCGCCGGAGACACTCG-3′ |
| Bcl-2 | F:
5′-GAGGAGCTCTTCAGGGACGG-3′ |
| R:
5′-GGTGCCGGTGCAGGTACTCA-3′ |
| GAPDH | F:
5′-AATGGATTTGGACGCATTGGT-3′ |
| R:
5′-TTTGCACTGGTACGTGTTGAT-3′ |
| U6 | F:
CTCGCTTCGGCAGCACA |
| R:
AACGCTTCACGAATTTGCGT |
Western blot analysis
The hippocampal tissues were removed. Following
processing with liquid nitrogen, the tissues were ground into a
uniform fine powder with a grinder (M20; Shanghai Shengke
Instrument Equipment Co., Ltd., Shanghai, China) at low
temperature, washed with PBS three times, added to protein lysate,
and centrifuged at 4°C for 20 min (25,764 × g). The supernatants
were collected and total protein concentration was determined using
a bicinchoninic acid kit (cat. no. P0012-1, Beyotime Institute of
Biotechnology). Cells in logarithmic growth phase were collected
and centrifuged at 4°C for 20 min (1,610 × g). Following discarding
of the supernatants, the packed cell volume (PCV) was estimated,
and every 20 µl PCV was mixed with 100 µl lysate and
1 µl phosphatase inhibitor (cat. no. 1111111, Beijing Jiamei
Niono Biotechnology Co., Ltd., Beijing, China). The cells were then
lysed on ice for 30 min and centrifuged at 4°C for 10 min at 25,764
× g. The supernatants were collected for quantitative protein
detection. Subsequently, 50 µg protein was dissolved by 2X
sodium dodecyl sulfate (SDS) sample buffer. Following boiling at
100°C for 5 min, the samples were separated by 10%
SDS-polyacrylamide gel electrophoresis, transferred onto
polyvinylidene fluoride membranes, blocked with 5% skim milk at
room temperature for 1 h and washed with PBS for 2 min. The PVDF
membranes were then incubated with diluted rabbit-anti-mouse
primary antibodies, including HEY2 (1:1,000, cat. no. ab86010),
Jagged1 (1:500, cat. no. ab7771), Notch1 (1:500, cat. no. ab8925),
Hes1 (1:200, cat. no. ab71559), Hes5 (1:1,000, cat. no. ab194111),
APP (1:500, cat. no. ab59592), Bax (1:1,000, cat. no. ab32503) and
Bcl-2 (1:1,000, cat. no. ab119506). These antibodies were purchased
from Abcam (Cambridge, MA, USA). The membranes were then washed
with Tris-buffered saline Tween-20 (TBST) three times, and were
incubated with secondary antibody goat-anti-rabbit labeled with HRP
(1:5,000) for 1 h. The membranes were washed with TBST three times
(5 min per wash), developed with an enhanced chemiluminescence kit
(cat. no. 10001, Beijing Branch Deep Blue Technology Co., Ltd.,
Beijing, China), exposed to X-rays and images were captured. The
absorbance of colored bands was analyzed using the GelDoc, XR+ gel
imaging analysis system [Bole Life Medicine Products (Shanghai)
Co., Ltd., Shanghai, China]. The relative levels of sample protein
equaled the average absorbance of samples to the average absorbance
of relative internal controls. The relative levels of protein in
each sample were used to plot a chart for statistical analysis. The
experiment was repeated three times.
Cell culture, grouping and
transfection
The hippocampal tissues were removed, and bilateral
hippocampal tissues were separated, and vessels and meninges were
removed. Following washing with culture medium three times, the
hippocampal tissues were placed in vials and cut into sections
using ophthalmic scissors. Following the addition of 0.25%
preheated trypsin at 55°C, the hippocampal tissues were detached at
37°C for 30 min and filtered through a 500-mesh copper screen. The
hippocampal neuron cell solutions of mice in the two groups were
placed into 5 ml tubes and centrifuged (4°C) for 5 min at 402 × g.
Following discarding of the supernatants, the cells were resuspeded
with 5 ml complete-cultured cell suspensions by percussion,
containing DMEM/F12 culture medium (1:1) with 20% fetal bovine
serum (FBS; cat. no. 001001, Guangzhou Ruite Biotechnology Co.,
Ltd., Guangzhou, China), 40% glucose DMEM (cat. no. SH30022.01,
Guangzhou Zhanchen Biotechnology Co., Ltd., Guangzhou, China), and
40% F12 medium (cat. no. GNM 11039, Hangzhou Dutai Biotechnology
Co., Ltd., Hangzhou, China). The concentration of the cells was
adjusted to 109 cells/l. The cells were inoculated into
24-well cell culture plates at 37°C with 5% CO2 (1
ml/well). After 48 h, the culture medium was replaced with a
low-serum medium with 10 µmol/l cytarabine (Yixin
Pharmaceutical Co., Ltd., Jilin, China). After 24 h, the medium was
replaced with DMEM/F12 feeding medium with 15% serum. The medium
was replaced every 3.5 days. The culture continued for 9 days,
following which the subsequent experiments were performed.
Hippocampal neuronal cells in the logarithmic growth
phase were collected and divided into the normal group (hippocampal
neurons of normal mice), the blank group (non-transfected
hippocampal neurons of AD mice), the negative control (NC) group
(hippocampal neurons of AD mice transfected with nonsense
sequences), the miR-98 mimic group (hippocampal neurons of AD mice
transfected with miR-98 mimic), the miR-98 inhibitor group
(hippocampal neurons of AD mice transfected with miR-98 inhibitor),
the small interfering (si)RNA-HEY2 group (hippocampal neurons of AD
mice transfected with siRNA-HEY2), and the miR-98 inhibitor +
siRNA-HEY2 group (hippocampal neurons of AD mice transfected with
miR-98 inhibitor and siRNA-HEY2). The sequences were as follows:
miR-98 mimic, sense 5′-UGA GGU AGU AAG UUG UAU UGU U-3′, antisense
5′-CAA UAC AAC UUA CUA CCU CAU U-3′, miR-98 inhibitor: 5′-AAC AAU
ACA ACU UAC UAC CUC A-3′; siRNA-HEY2, sense 5′-GCA CUG GGA CAA ACA
AUA ATT-3′, antisense, 5′-UUA UUG UUU GUC CCA GUG CTT-3′; NC, sense
5′-UUC UCC GAA CGU GUC ACG UTT-3′ and antisense, 5′-ACG UGA CAC GUU
CGG AGA ATT-3′. Prior to transfection, cells in the logarithmic
growth phase were inoculated into 6-well plates until the cells
reached 80-90% confluence. Subsequently, the cells were transferred
to serum-free culture medium Opti-DMEM (Gibco; Thermo Fisher
Scientific, Inc.) and transfected using Lipofectamine 2000 in
accordance with the manufacturer’s protocol (Invitrogen; Thermo
Fisher Scientific, Inc.). A total of 250 µl lipo solution
(cat. no. 11668-027, Shanghai Kanwin Biotechnology Co., Ltd.,
Shanghai, China) containing 240 µl serum-free culture medium
and 10 µl lipo, was incubated for 5 min at room temperature.
A total of 250 µl plasmid solution was used, comprising 200
µl serum-free culture medium and 50 µg plasmid. The
lipo and plasmid solutions were mixed and placed at room
temperature for 20 min. The mixed solution was added into the wells
in a dropwise manner. The wells were mixed and incubated in 5%
CO2 at 37°C. After 5-6 h, they were cultured in complete
medium for 24-48 h to perform the subsequent experiments.
Dual-luciferase reporter gene assay
Target gene analysis of miR-98 was predicted using a
biological prediction website (http://www.microRNA.org). A dual-luciferase reporter
gene assay was used to validate whether HEY2 was a direct target
gene of miR-98. The reporter vector pMIR-reporter (Promega
Corporation, Madison, WI, USA) was inoculated in a 24-well plate
and incubated for 24 h. The HEY2 3′UTR gene fragment was
artificially synthesized and was introduced into the pMIR-reporter
(Promega Corporation) using endonuclease sites SpeI and
HindIII. The mutant site sequences were designed in HEY2
wild-type (WT). Following undergoing restriction enzyme digestion,
the target fragment was inserted into the pMIR-reporter plasmid
through T4 DNA ligase, obtaining pHEY2-Wt. The binding site of the
miR-98 and target gene was predicted using bioinformatics analysis
for site-directed mutagenesis and the pHEY2-Mut vector was
constructed. The pRL-TK vector (cat. no. E2241, Promega
Corporation) of renilla luciferase-expressed enzyme was used as an
internal reference to adjust for the variations in transfection
efficiency and cell number. The miR-98 mimic and its negative
control were cotransfected with the luciferase reporter vector into
293T cells (American Type Culture Collection). After 48 h, the
culture medium was removed and the cells were washed twice with
PBS. The cells were split and the total proteins were collected.
Luciferase activity was detected using a
Dual-Luciferase® Reporter Assay System (cat. no. E1910,
Promega Corporation). Every 10-µl cell sample was treated
with 50 µl firefly luciferase working solution to measure
firefly luciferase activity and with 50 µl renilla
luciferase working solution to determine renilla luciferase
activity. The ratio of firefly luciferase activity to renilla
luciferase activity was determined as the relative luciferase
activity. The experiment was repeated three times.
MTT assay
Following transfection for 48 h, cells in the
logarithmic growth phase in each group were collected and cell
suspensions (1×10⁴ cells/ml) were prepared in serum-free
Opti-DMEM culture medium. The cells were inoculated in 96-well
culture plates (n=8 wells per group, 100 µl per well) and
incubated at 37°C with 5% CO2. The plates were removed
following 24, 48 and 72 h of incubation. Each well was then treated
with 10 µl MTT solution (5 mg/ml, Sigma-Aldrich; EMD
Millipore), and the cells were incubated for another 4 h. Following
incubation, the supernatants were discarded. Each well was treated
with 150 µl dimethylsulfoxide and oscillated for 10 min to
dissolve completely. The optical density (OD) value of each well
was determined by an automatic enzyme reading meter (Bio-Rad
Laboratories, Inc., Hercules, CA, USA) at the wavelength of 490
nm.
Flow cytometry
At 48 h post-transfection, the cells were detached
using trypsin without ethylenediaminetetraacetic acid, collected,
centrifuged at 4°C (5 min, 178 × g), and the supernatants were
discarded. The cells were washed with precooled PBS, centrifuged at
4°C, 178 × g for 5 min and the supernatants were discarded again.
Apoptosis was detected using an Annexin-V-FITC/PI Apoptosis
Detection kit (cat. no. CA1020, Beijing Solarbio Science and
Technology Co., Ltd.). The cells were washed with binding buffer.
The mixed solution of Annexin-V-FITC and binding buffer was
prepared at a proportion of 1:40. The cells were then resuspended,
mixed uniformly by oscillation, and incubated at room temperature
for 30 min. Following the addition of the prepared mixed solution
of PI and binding buffer, the cells were mixed uniformly by
oscillation and were incubated at room temperature for 15 min.
Apoptosis was measured by flow cytometry (FACSCalibur, BD
Biosciences, Franklin Lakes, NJ, USA). The experiment was repeated
three times.
Statistical analysis
Data were analyzed using SPSS 21.0 (IBM SPSS,
Armonk, NY, USA) statistical software. Measurement data are
expressed as the mean ± standard deviation. Comparisons between two
groups were analyzed using an Independent-Samples t-test, whereas
comparisons among multiple groups were analyzed using one-way
analysis of variance. P<0.05 was considered to indicate a
statistically significant difference.
Results
AD mice have poorer learning and memory
abilities than normal mice
A behavioral assessment was performed to examine the
learning and memory abilities of AD mice and the results were as
follows (Table III): Compared
with the normal mice, with respect to learning ability, reaction
time in the AD mice was substantially longer and error times were
significantly increased (P<0.05). With respect to memory
ability, the reaction time of the AD mice was markedly shorter and
error times were significantly longer (P<0.05). These results
indicated that the learning and memory abilities of the AD mice
were substantially poorer than those of the normal mice.
| Table IIIDifferences in learning and memory
abilities between normal mice and AD mice. |
Table III
Differences in learning and memory
abilities between normal mice and AD mice.
| Group | Learning ability
| Memory ability
|
|---|
| Reaction time
(sec) | Error time
(sec) | Reaction time
(sec) | Error time
(sec) |
|---|
| Control (n=35) | 15.26±2.23 | 2.18±0.25 | 195.88±18.06 | 2.35±0.45 |
| AD model
(n=28) | 53.29±6.34a | 7.86±1.52a | 75.14±5.47a | 8.17±0.47a |
AD mice have poorer oxidative stress
function than normal mice
Oxidative stress markers were measured in the AD
mice. The results of changes in oxidative stress functions are
presented in Table IV. Compared
with the normal mice, the activities of SOD and AChE were higher in
the AD mice, whereas the activities of GSH-Px, GSH, MDA and
Na+-K+-ATP were lower (all P<0.05). These
results indicated that, compared with the normal mice, the
antioxidant capacity of the AD mice was substantially lower.
| Table IVIndices for oxidative stress function
between the normal and AD mice. |
Table IV
Indices for oxidative stress function
between the normal and AD mice.
| Group | GSH-Px
(U/mg*pro) | GSH (mg/g*pro) | SOD
(NU/mg*pro) | MDA
(mmol/mg*pro) | AChE
(U/mg*pro) |
Na+-K+-ATP
(U/mg*pro) |
|---|
| Control (n 8) | 43.54±3.51 | 1.06±0.18 | 110.34±4.21 | 5.27±0.44 | 0.75±0.07 | 31.45±1.95 |
| AD model (n=8) | 31.51±2.92a | 0.66±0.12a | 123.25±9.61a | 3.75±0.38a | 1.65±0.11a | 21.51±1.21a |
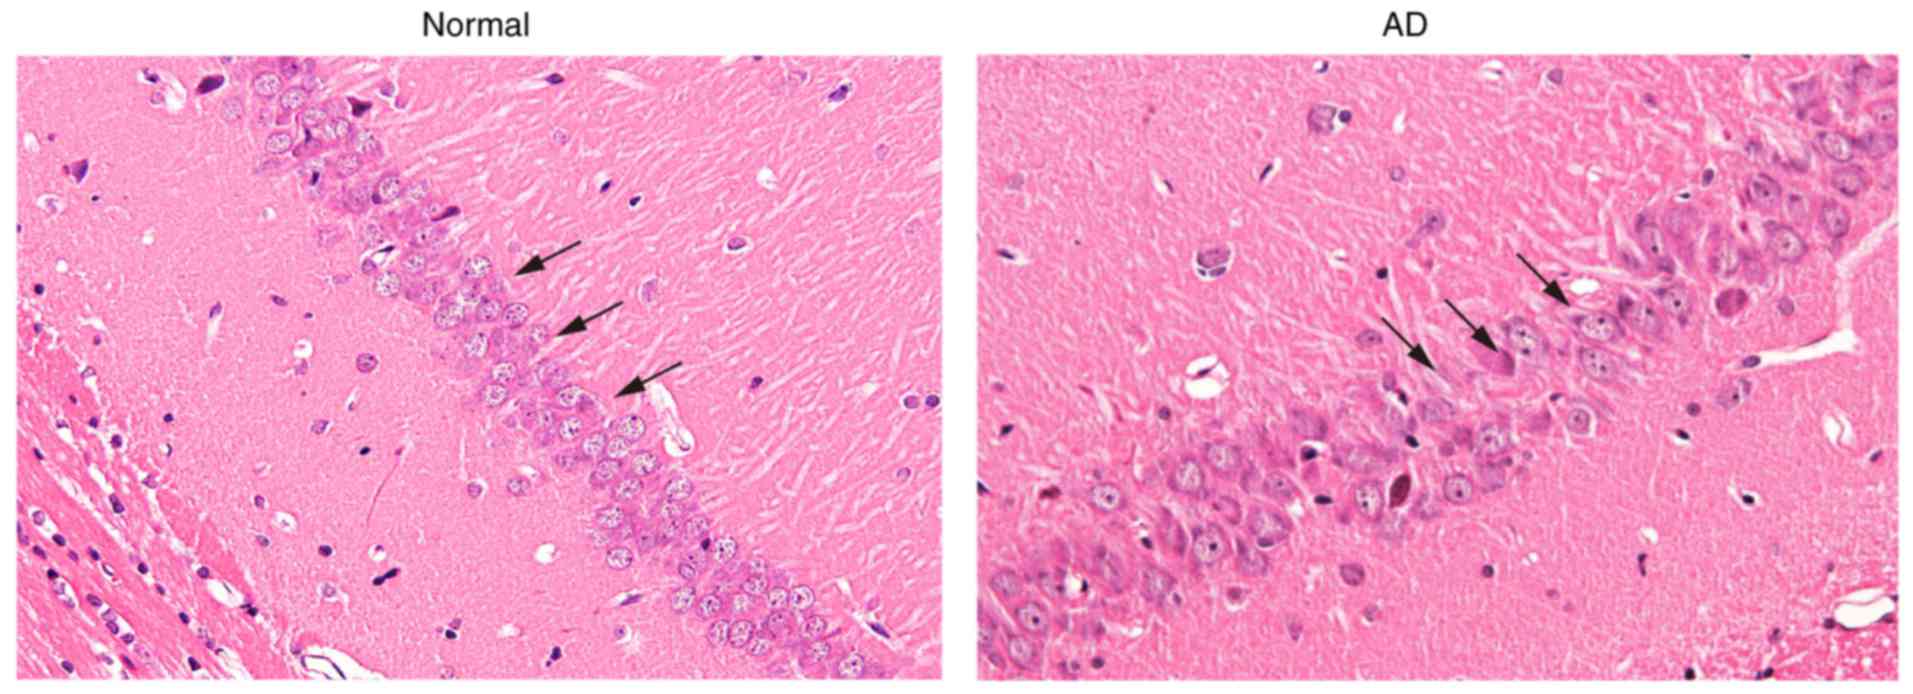
Pyramidal cells in the hippocampal CA1
region exhibit deteriorative morphological changes
Morphological changes of the pyramidal cells in the
hippocampal CA1 region were measured with H&E staining
(Fig. 1). The normal formation of
the hippocampus exhibited four clear layers of pyramidal cells with
uniform morphology in CA1 region. Its fiber structure was clearly
discernible without lymphocytic infiltration. The number of
pyramidal cells in the AD mice was substantially reduced. The cell
arrangement was disordered, and the layer was obscure with
substantial lymphocytic infiltration. Pyramidal cells were markedly
impaired, accompanied by karyopyknosis. Fiber structure was
disordered and obscure, and vacuolization was observed in the
cytoplasm. These results demonstrated that the morphological
changes of pyramidal cells in the hippocampal CA1 region showed
deterioration in the AD mice, compared with those in the
controls.
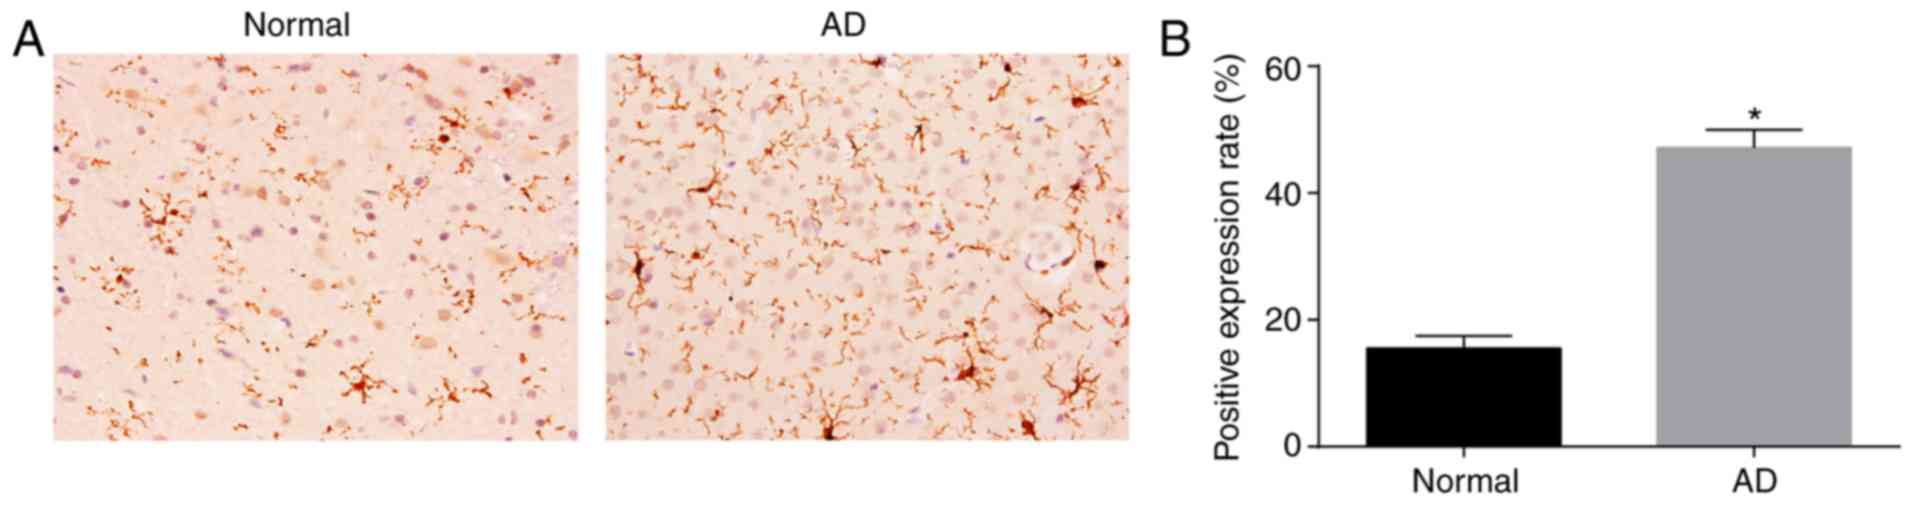
AD mice have higher protein levels of
HEY2 in the CA1 region of brain tissues than normal mice
The protein expression of HEY2 in the CA1 region of
brain tissues was measured by immunohistochemistry (Fig. 2A and B). HEY2 protein was mainly
expressed in the cytoplasm and appeared brown-yellow. Compared with
the AD mice, the number of brown-yellow positive grains in the
brain tissues of normal mice was substantially lower. Compared with
the normal mice, the positive rate of HEY2 protein in the brain
tissues of AD mice was higher (P<0.05). These findings signified
that the AD mice exhibited increased protein levels of HEY2 in the
CA1 region of brain tissues.
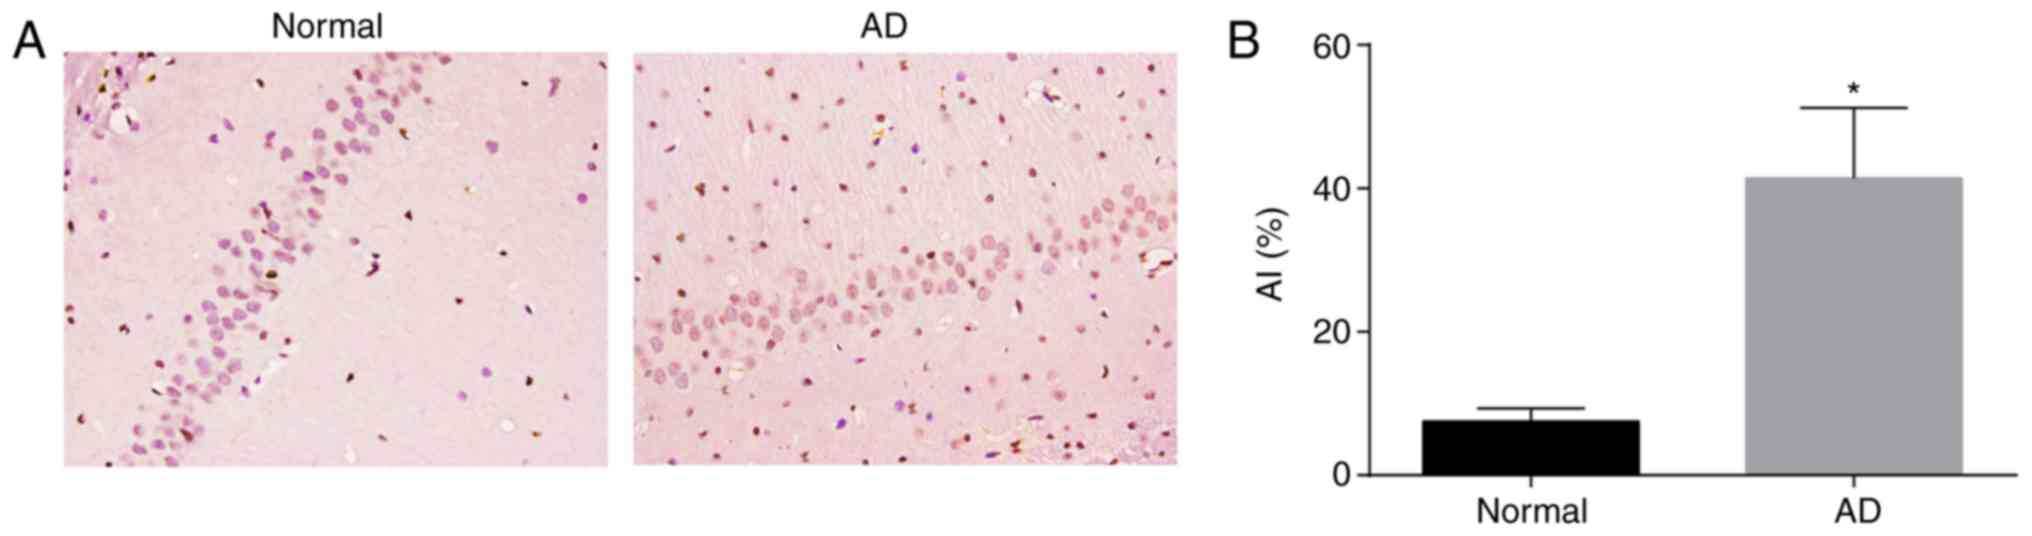
AD mice have higher AI in the CA1 region
of brain tissues compared with normal mice
TUNEL staining was used to determine AI in the CA1
region of brain tissues of AD mice (Fig. 3A and B). Nuclear markers of
positive cells appeared brown-yellow. The apoptosis of positive
granulosa cells was lower in the brain tissues of normal mice and
was substantially higher in the brain tissues of AD mice. Compared
with the normal mice, the AD mice exhibited a higher level of
neuronal apoptosis and AI in the CA1 region of brain tissues
(P<0.05). These findings demonstrated that the AD mice had
elevated AI in the CA1 region of brain tissues.
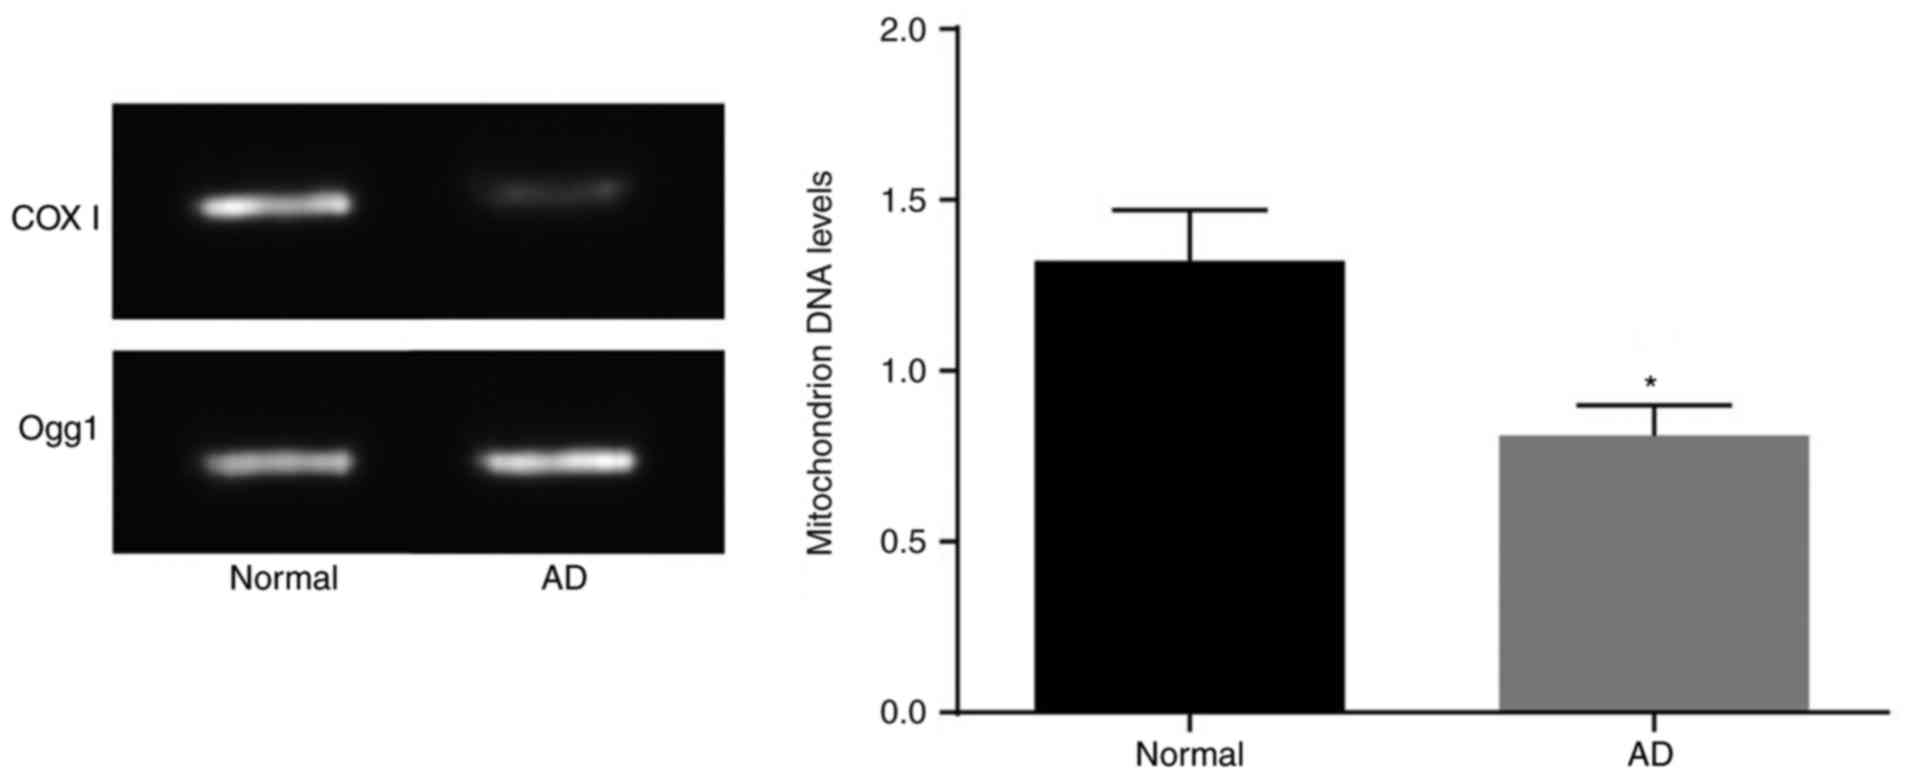
AD mice have reduced mtDNA levels and
dysfunctional neuronal mitochondria
The mtDNA levels were measured by PCR analysis
(Fig. 4). Compared with those in
the normal mice, neuron mtDNA levels in the brain tissues of the AD
mice were lower (P<0.05). This suggested that AD mice had
dysfunction of neuronal mitochondria.
AD mice exhibit downregulated levels of
miR-98, elevated HEY2 and activated notch-HEY2 signaling
pathway
RT-qPCR and western blot analyses were used to
determine levels of miR-98 and mRNA and protein levels of HEY2,
Jagged1, Notch1, Hes1, Hes5, APP, Bax and Bcl-2 in the brain
tissues of AD mice (Fig. 5A-C).
The brain tissues of the AD mice had decreased expression of
miR-98, increased mRNA and protein levels of HEY2, Jagged1, Notch1,
Hes1, Hes5, APP and Bax, and reduced mRNA and protein levels of
Bcl-2 (P<0.05). These results suggested that, compared with the
normal group, the AD group had lower levels of miR-98, higher
levels of HEY2 and increased activation of the Notch-HEY2 signaling
pathway.
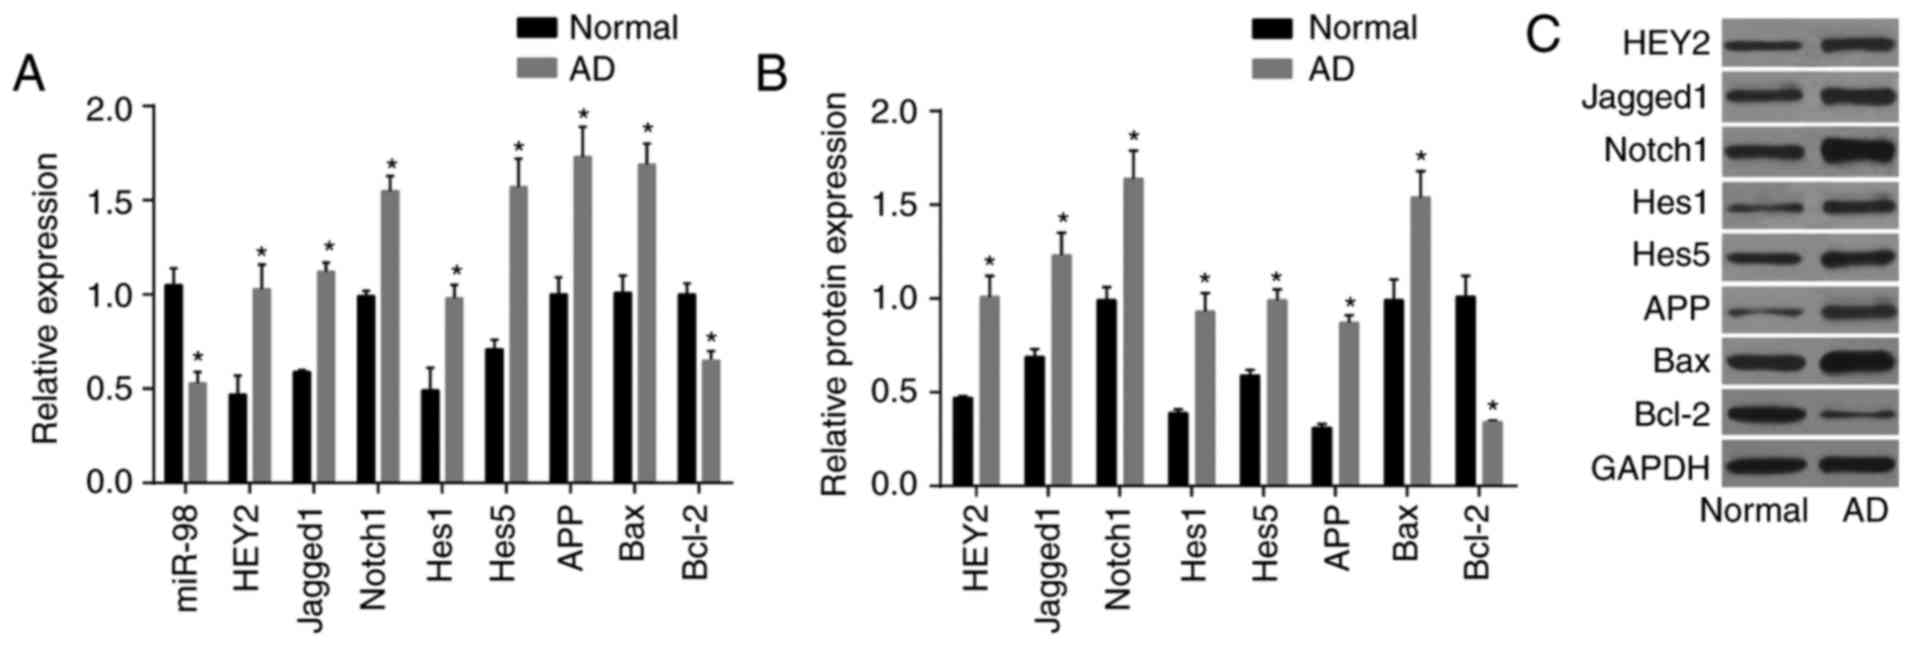 | Figure 5AD mice exhibit decreased levels of
miR-98, increased mRNA and protein levels of HEY2, Jagged1, Notch1,
Hes1, Hes5, APP, Bax, and reduced mRNA and protein levels of Bcl-2
in brain tissue. (A) Levels of miR-98 and mRNA levels of HEY2,
Jagged1, Notch1, Hes1, Hes5, APP, Bax and Bcl-2, measured by
reverse transcription-quantitative polymerase chain reaction
analysis. (B) protein levels of HEY2, Jagged1, Notch1, Hes1, Hes5,
APP, Bax and Bcl-2 measured by western blot analysis. (C) Western
blot bands of HEY2, Jagged1, Notch1, Hes1, Hes5, APP, Bax and Bcl-2
proteins; *P<0.05, vs. normal group. AD, Alzheimer’s
disease; miR-98, microRNA-98; HEY2, hairy and enhancer of
split-related with YRPW motif protein 2; Hes1, hairy and enhancer
of split 1; Hes5, hairy and enhancer of split 5; APP, amyloid
precursor protein; Bcl-2, B cell lymphoma 2; BAX, Bcl-2-associated
X protein; GAPDH, glyceraldehyde-3-phosphate dehydrogenase. |
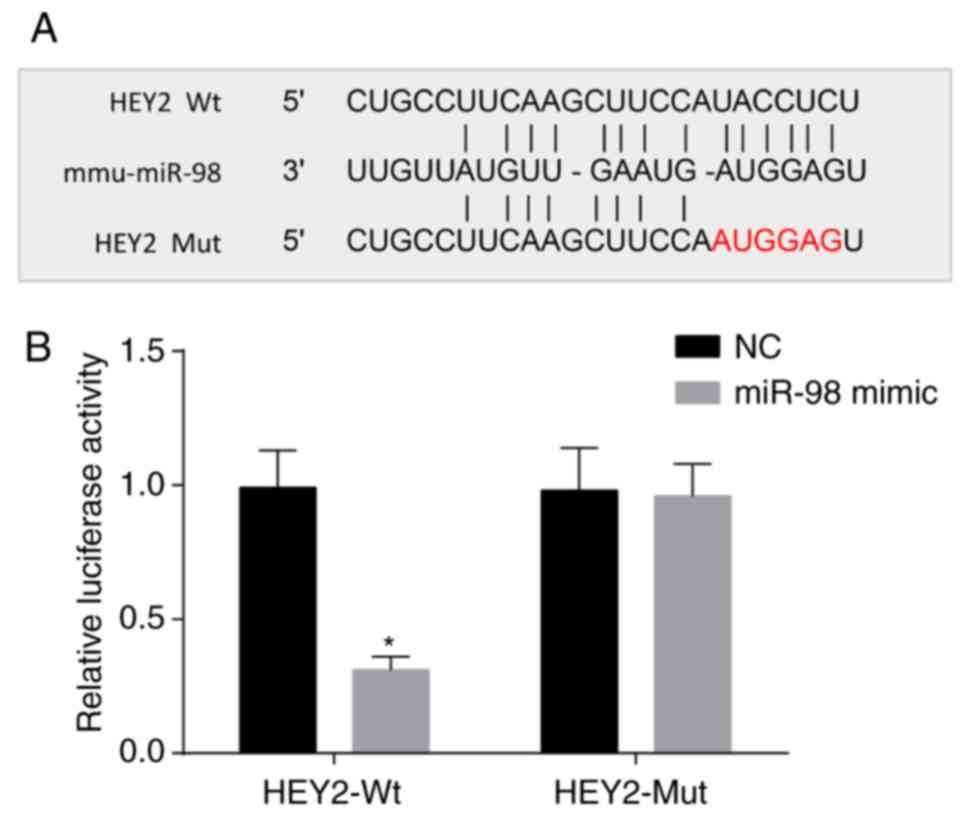
miR-98 targets HEY2
According to the online analysis software, miR-98
and HEY2 3′UTR had a binding site (Fig. 6A). The results of the
dual-luciferase reporter assay are shown in Fig. 6B. Compared with the NC group, the
luciferase activity of the Wt-miR-98/HEY2 cotransfection group was
decreased (P<0.05). However, no significant difference was
observed in the luciferase activity of the Mut-miR-98/HEY2 plasmid
group (P<0.05). Therefore, HEY2 was a target gene of miR-98.
miR-98 inhibits HEY2 and inactivates the
Notch signaling pathway
RT-qPCR and western blot analyses were performed to
determine miR-98 levels and the mRNA and protein levels of HEY2,
Jagged1, Notch1, Hes1, Hes5, APP, Bax and Bcl-2 in neurons
(Fig. 7A-C). Compared with the
normal group, the other groups showed decreased levels of miR-98,
increased mRNA and protein levels of HEY2, Jagged1, Notch1, Hes1,
Hes5, APP and Bax, and reduced mRNA and protein levels of Bcl-2
(all P<0.05). Compared with the blank and NC groups, the miR-98
mimic group exhibited elevated levels of miR-98, lower mRNA and
protein levels of HEY2, Jagged1, Notch1, Hes1, Hes5, APP and Bax,
and increased mRNA and protein levels of Bcl-2 (all P<0.05). The
miR-98 inhibitor group had decreased levels of miR-98, increased
mRNA and protein levels of HEY2, Jagged1, Notch1, Hes1, Hes5, APP
and Bax, and reduced mRNA and protein levels of Bcl-2 (all
P<0.05). The miR-98 inhibitor + si-HEY2 group had reduced levels
of miR-98 (P<0.05), however, no significant change was found in
the expression of the other genes (P>0.05). These results
indicated that miR-98 contributed to the inhibited expression of
HEY2 and suppressed the Notch signaling pathway.
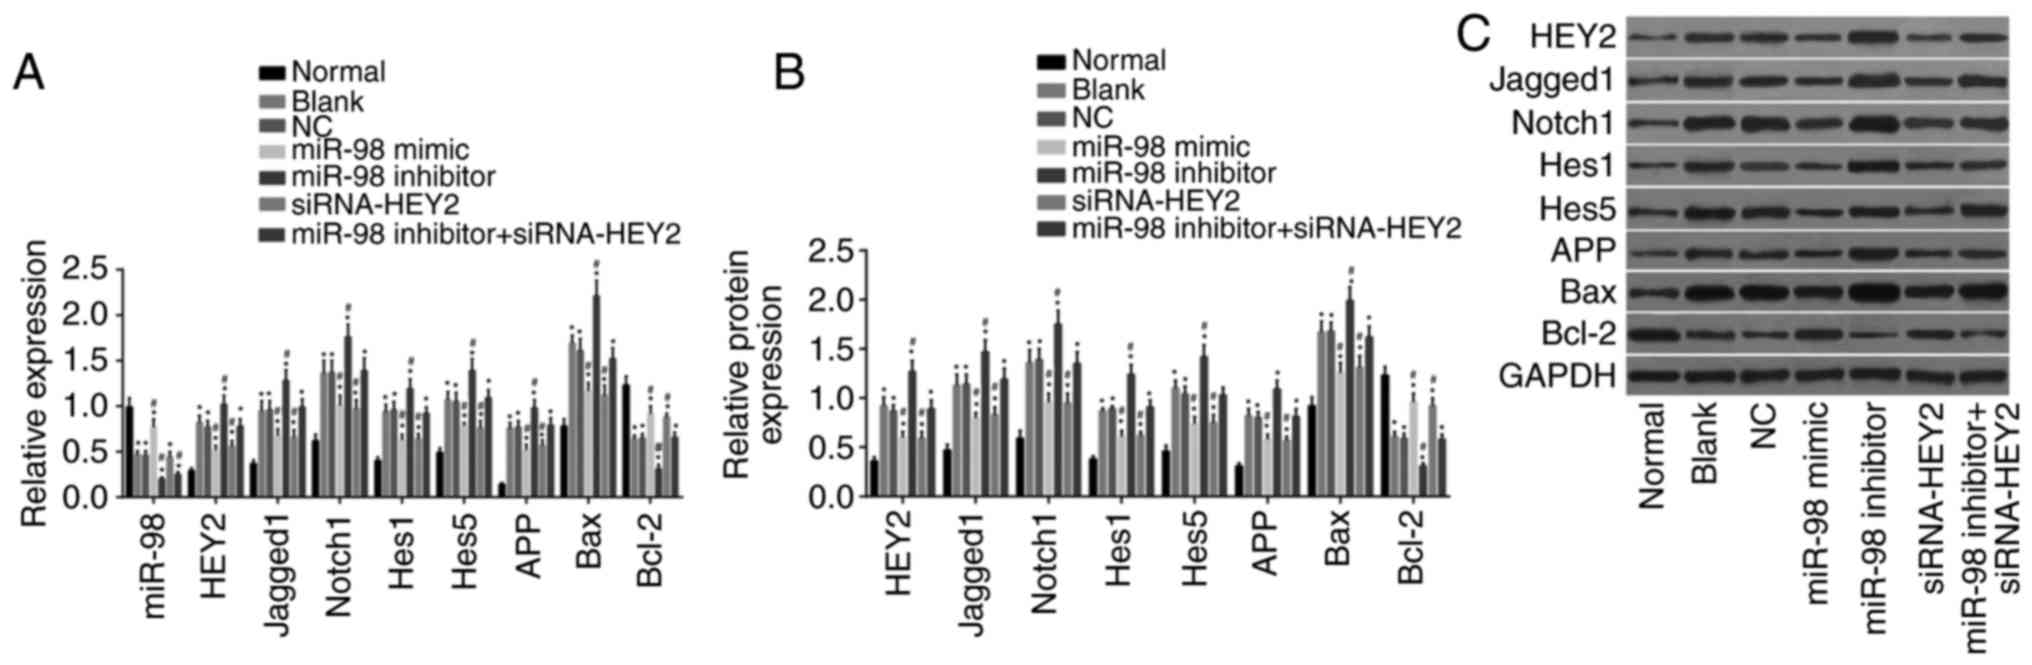 | Figure 7miR-98 contributes to inhibited HEY2
levels and inactivation of the Notch signaling pathway. (A) Levels
of miR-98 and mRNA levels of HEY2, Jagged1, Notch1, Hes1, Hes5,
APP, Bax and Bcl-2 in transfected hippocampal neurons among each
group. (B) Protein levels of HEY2, Jagged1, Notch1, Hes1, Hes5,
APP, Bax and Bcl-2 in transfected hippocampal neurons among each
group. (C) Western blot images of HEY2, Jagged1, Notch1, Hes1,
Hes5, APP, Bax and Bcl-2 proteins in transfected hippocampal
neurons; *P<0.05, vs. normal group;
#P<0.05, vs. blank and NC groups. miR-98,
microRNA-98; HEY2, hairy and enhancer of split-related with YRPW
motif protein 2; Hes1, hairy and enhancer of split 1; Hes5, hairy
and enhancer of split 5; APP, amyloid precursor protein; Bcl-2, B
cell lymphoma 2; BAX, Bcl-2-associated X protein; GAPDH,
glyceraldehyde-3-phosphate dehydrogenase; siRNA, small interfering
RNA. |
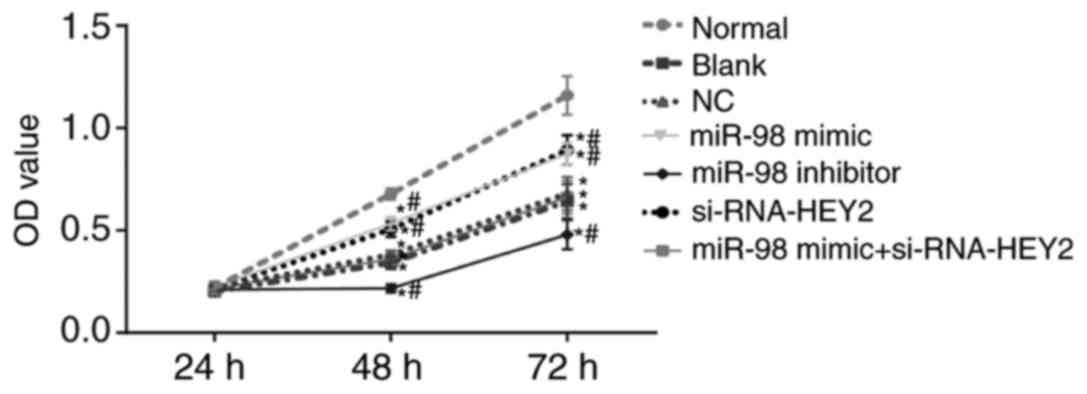
miR-98 promotes and HEY2 inhibits
viability in hippocampal neurons
Neuron viability was detected using an MTT assay
(Fig. 8). The OD values of the
hippocampal neurons in each group increased with time. Compared
with the normal group, the proliferation rates of hippocampal
neurons in the other groups were lower (all P<0.05). Compared
with the blank and NC groups, the miR-98 mimic group and the
siRNA-HEY2 group exhibited higher proliferation rates of
hippocampal neurons, whereas the miR-98 inhibitor group exhibited
lower proliferation rates of hippocampal neurons (all P<0.05),
with no significant change in the miR-98 inhibitor + siRNA-HEY2
group (P>0.05). These results suggested that miR-98 promoted
hippocampal neuron viability whereas HEY2 inhibited the viability
of hippocampal neurons.
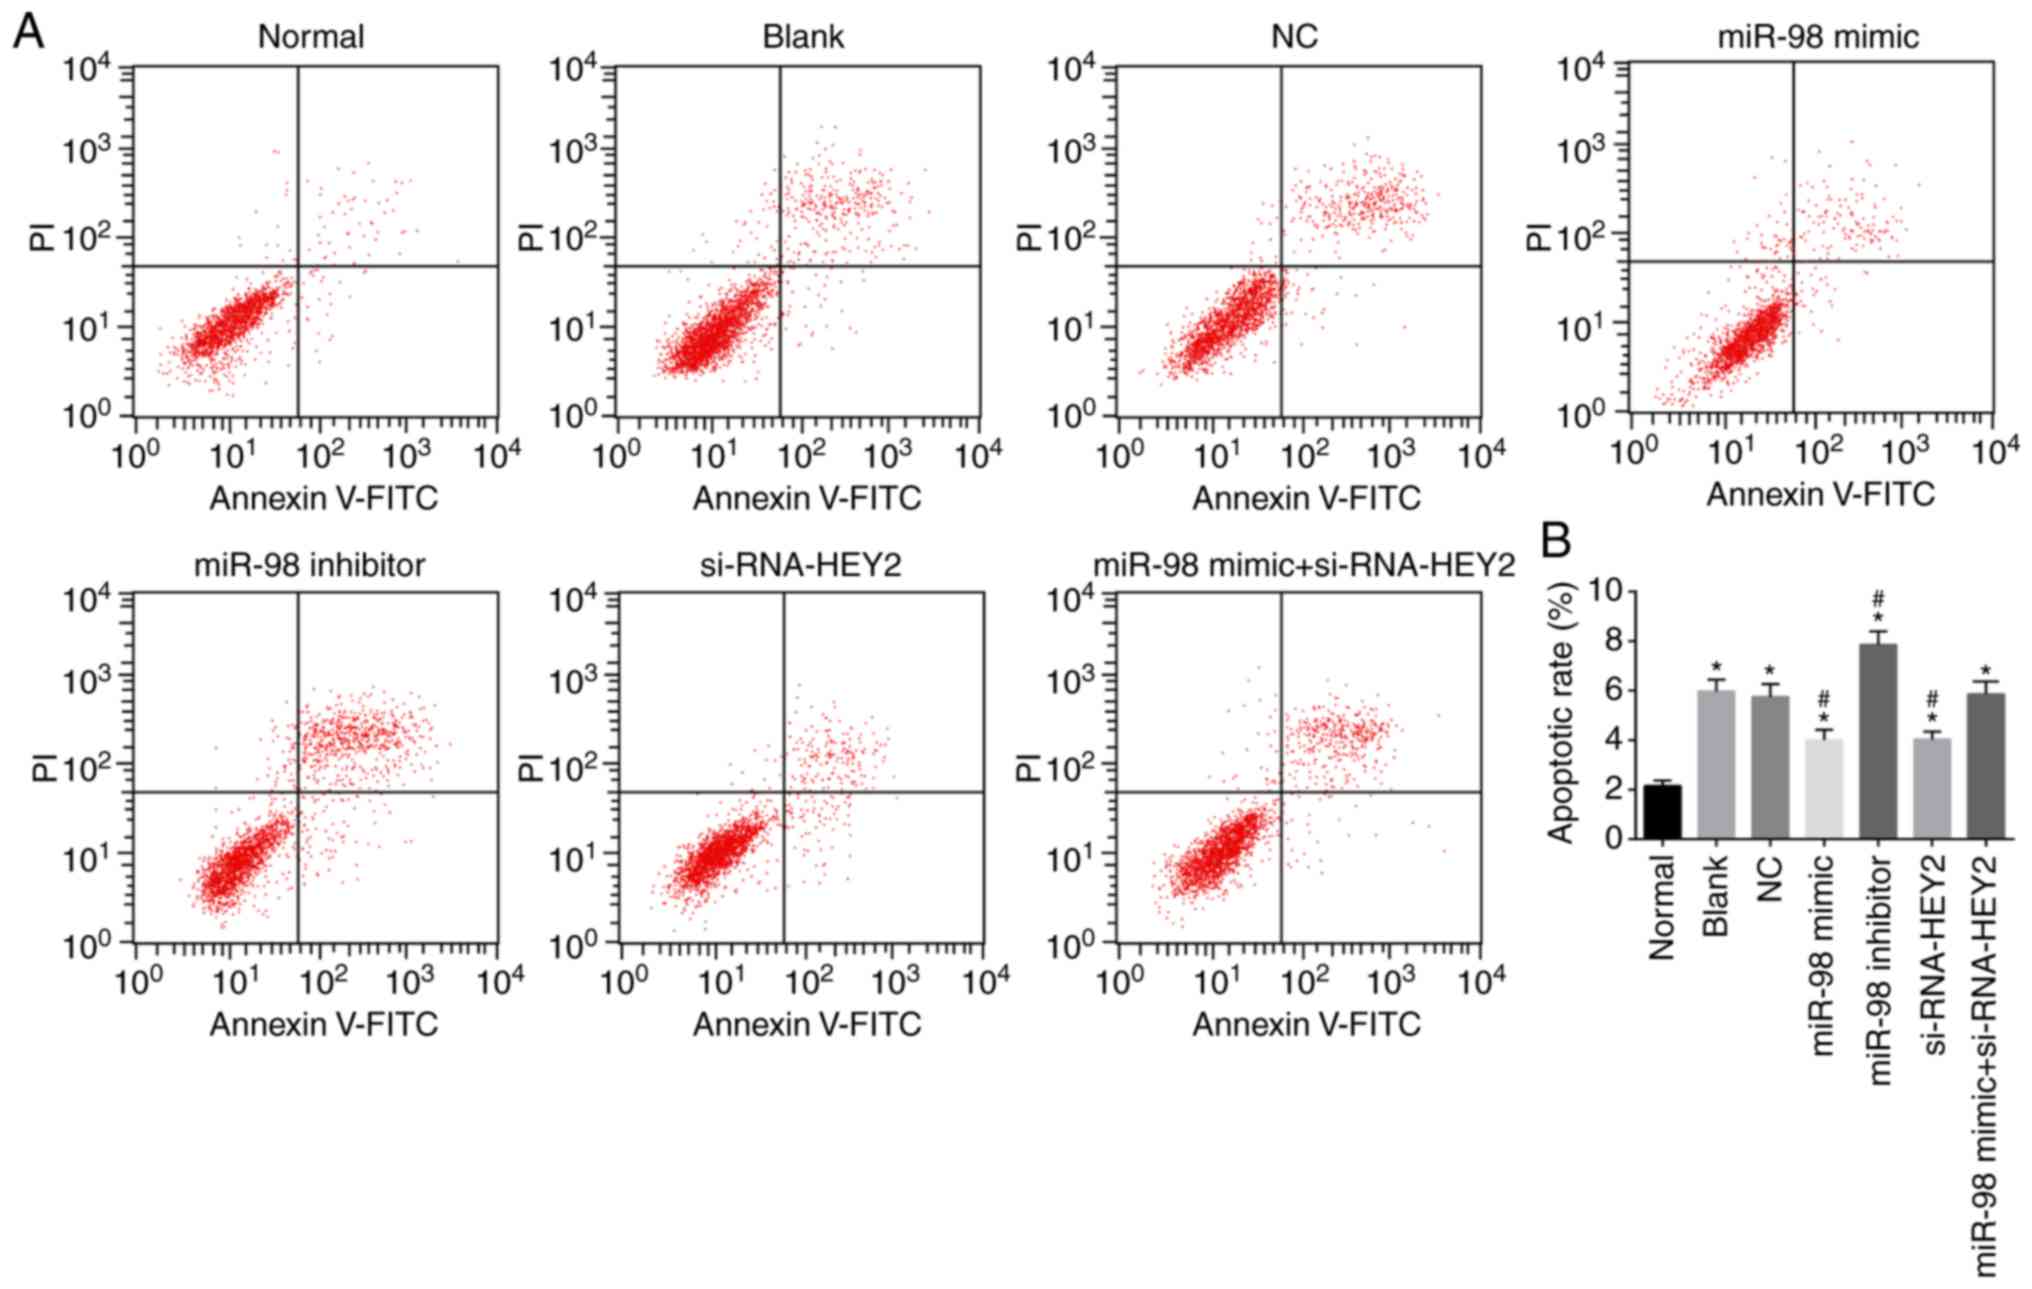
miR-98 suppresses and HEY2 promotes
apoptosis in hippo-campal neurons
Hippocampal neuron apoptosis was detected by Annexin
and V-FITC/PI double staining (Fig.
9A and B). Compared with the normal group, the apoptotic rates
of hippocampal neurons in the other groups were higher (all
P<0.05). Compared with the blank and NC groups, the miR-98 mimic
group and the siRNA-HEY2 group exhibited lower apoptotic rates of
hippocampal neurons, whereas the miR-98 inhibitor group exhibited a
higher apoptotic rate (all P<0.05), and no significant change
was found in the miR-98 inhibitor + siRNA-HEY2 group (P>0.05).
These results suggested that miR-98 inhibited apoptosis and HEY2
promoted apoptosis of hippocampal neurons.
Discussion
AD is characterized by neurofibrillary tangles,
synaptic dysfunction and neurodegeneration; its incidence is
increasing rapidly with the aging of the population as an
increasing number of individuals approach the key risk period for
this age-related disease (26,27). Its characteristics include the
loss of synapses and neuronal death, neurofibrillary tangles and
extracellular Aβ plaques in the intracellular environment, all
leading to cognitive decline (28). The present study investigated the
effect of miR-98 on the production of Aβ, oxidative stress and
mitochondrial dysfunction by targeting HEY2 and the Notch signaling
pathway in AD mice.
The initial results demonstrated that AD mice had
poorer learning and memory abilities, and lower antioxidant
capacity, compared with the normal mice. Epidemiological and
clinical investigations have demonstrated a role for reactive
nitrogen species and ROS, known collectively as oxidative stress
(29). It is considered to be one
of the most important factors in the pathogenesis of AD (30). Certain antioxidants protect DNA
from oxidative damage (31).
Consequently, the weak antioxidant capacity of dementia mice may
result in oxidative stress. In the present study, the mtDNA levels
of AD mice were lower, suggesting that neuronal mitochondria were
dysfunctional. Mitochondrial dysfunction is central to multiple
diseases involving oxidative stress (32). Changes in mtDNA levels, usually
measured as the mitochondrial genome to nuclear genome ratio and
the mtDNA content in body tissues and fluids, is considered a
biomarker of mitochondrial dysfunction (32).
The data obtained in the present study also
indicated that, compared with the normal group, the expression of
miR-98 was lower and the expression of HEY2 was higher in the AD
group. The Notch-HEY2 pathway was activated. miR has emerged as a
key post-transcriptional regulator of gene expression (33), regulating several normal cellular
activities, including growth, differentiation, apoptosis,
inflammation and tissue turnover (34). miR-98-5p has been reported to
exhibit significantly different expression in patients with AD
(35). A previous study
demonstrated that miR-98-5p regulated the expression of SNX6 and
was important in the accumulation of Aβ (36). miR-98 is also reported to induce
an AD-like disturbance by targeting insulin-like growth factor 1
and the overexpression of miR-98-promoted the production of Aβ,
suggesting that miR-98 is vital in the development of the pathology
of AD (37). Liu et al
found that miR-98 was upregulated in rabbit brains during the
progression of AD-like pathology, consistent with previous reports
that miR-98 was upregulated in AD mouse models (38). Furthermore, during zebrafish
arteriovenous differentiation, Sox18 and Sox7 induced HEY2 ortholog
gridlock, and a high expression of HEY2 has been found in other
diseases, indicating that HEY2 may inhibit cell differentiation
(21). However, miR-98
contributed to inhibition of the expression of HEY2 and the Notch
signaling pathway in the present study. In the miR-98 inhibitor
group, the expression of miR-98 was lower and the expression levels
of HEY2, Jagged1, Notch1, Hes1, Hes5, APP and Bax were higher,
whereas the expression of Bcl-2 was lower. Jagged1 is a Notch
ligand; the targeted loss of this expression was shown to be
sufficient to cause spatial memory loss and a reduction in the
activation of exploration-dependent Notch (39). The Notch1 pathway is a cellular
cascade with basic roles from brain development to adult brain
function; the overactivation of Notch1 following brain injury is
detrimental for neuronal survival (40). Hes1 and Hes5, fundamental
helix-loop-helix factors, repress the expression of pro-neural
factors, including Achaetescute homolog 1, thus maintaining neural
progenitor cells and inhibiting neuronal differentiation (41). APP has been investigated
extensively for its role as a precursor of Aβ in AD; it is
potentially involved in the development of neural stem cells, in
addition to the survival, outgrowth and repair of neurons (42). A previous study indicated that the
increased expression of Bax enhanced apoptosis, whereas the
overexpression of Bcl-2 inhibited apoptosis (43).
miR-98 promoted the growth of hippocampal neurons,
whereas HEY2 inhibited the viability of the neurons. The
hippocampus is involved in segregating memories, an ability that
allows for cognitive flexibility and uses the neural process of
pattern separation (44).
Furthermore, miR-98 inhibited cell apoptosis, whereas HEY2 promoted
the apoptosis of hippocampal neurons. A previous study indicated
that miR-98 inhibited interleukin-1β-induced cell apoptosis by
regulating the expression of Bcl-2 (45).
Current treatment options for AD are limited to
medications that decrease symptoms of dementia. Considering the
rapidly aging population in the majority of regions of the world,
novel therapeutic interventions for AD are urgently required
(46). Therefore, the findings of
the present study provide a rationale for the hypothesis that
miR-98 targeting HEY2 inhibits the activity of Notch pathway,
contributing to the inhibition of the production of Aβ and to the
improvement of oxidative stress and mitochondrial dysfunction in AD
mice. However, additional investigations are required to further
demonstrate the effects of miR-98 in the regulation of AD mice by
targeting HEY2 through the Notch signaling pathway prior to its
consideration as an applicable therapy for AD.
Acknowledgments
Not applicable.
Funding
No funding was received.
Availability of data and materials
The datasets used and/or analyzed during the current
study are available from the corresponding author on reasonable
request.
Authors’ contributions
FZC, YZ and HZC wrote the manuscript, and conceived
and designed the experiments. FZC and YZ analyzed the data. FZC and
HZC collected and provided the samples for the study. All authors
read and approved the final manuscript.
Ethics approval and consent to
participate
The protocols of the present study were approved by
the Institutional Review Board of the Affiliated Hospital of
Taishan Medical University (Taishan, China). All animal experiments
were performed according to the Guide for the Care and Use of
Laboratory Animal by International Committees.
Patient consent for publication
Not applicable.
Competing interests
The authors declare that they have no competing
interests.
References
|
1
|
Wenk GL: Neuropathologic changes in
Alzheimer’s disease. J Clin Psychiatry. 64(Suppl 9): S7–S10.
2003.
|
|
2
|
Scheltens P, Blennow K, Breteler MM, de
Strooper B, Frisoni GB, Salloway S and Van der Flier WM:
Alzheimer’s disease. Lancet. 388:505–517. 2016. View Article : Google Scholar : PubMed/NCBI
|
|
3
|
Luque-Contreras D, Carvajal K, Toral-Rios
D, Franco-Bocanegra D and Campos-Peña V: Oxidative stress and
metabolic syndrome: Cause or consequence of Alzheimer’s disease.
Oxid Med Cell Longev 2014. 497802:2014.
|
|
4
|
Chami L and Checler F: BACE1 is at the
crossroad of a toxic vicious cycle involving cellular stress and
β-amyloid production in Alzheimer’s disease. Mol Neurodegener.
7:522012. View Article : Google Scholar
|
|
5
|
Liggins C, Snyder HM, Silverberg N,
Petanceska S, Refolo LM, Ryan L and Carrillo MC: International
Alzheimer’s Disease Research Portfolio (IADRP) aims to capture
global Alzheimer’s disease research funding. Alzheimers Dement.
10:405–408. 2014. View Article : Google Scholar : PubMed/NCBI
|
|
6
|
Yang Q, Wang T, Su N, Liu Y, Xiao S and
Kapoula Z: Long latency and high variability in accuracy-speed of
prosaccades in Alzheimer’s disease at mild to moderate stage.
Dement Geriatr Cogn Dis Extra. 1:318–329. 2011. View Article : Google Scholar : PubMed/NCBI
|
|
7
|
Sagy-Bross C, Kasianov K, Solomonov Y,
Braiman A, Friedman A, Hadad N and Levy R: The role of cytosolic
phospholipase A2 α in amyloid precursor protein induction by
amyloid beta1-42: Implication for neurodegeneration. J Neurochem.
132:559–571. 2015. View Article : Google Scholar
|
|
8
|
Banote RK, Edling M, Eliassen F, Kettunen
P, Zetterberg H and Abramsson A: β-Amyloid precursor protein-b is
essential for Mauthner cell development in the zebrafish in a
Notch-dependent manner. Dev Biol. 413:26–38. 2016. View Article : Google Scholar : PubMed/NCBI
|
|
9
|
Chen Y, Huang X, Zhang YW, Rockenstein E,
Bu G, Golde TE, Masliah E and Xu H: Alzheimer’s β-secretase (BACE1)
regulates the cAMP/PKA/CREB pathway independently of β-amyloid. J
Neurosci. 32:11390–11395. 2012. View Article : Google Scholar : PubMed/NCBI
|
|
10
|
Lu JX, Qiang W, Yau WM, Schwieters CD,
Meredith SC and Tycko R: Molecular structure of β-amyloid fibrils
in Alzheimer’s disease brain tissue. Cell. 154:1257–1268. 2013.
View Article : Google Scholar : PubMed/NCBI
|
|
11
|
Bao XQ, Li N, Wang T, Kong XC, Tai WJ, Sun
H and Zhang D: FLZ alleviates the memory deficits in transgenic
mouse model of Alzheimer’s disease via decreasing beta-amyloid
production and tau hyperphosphorylation. PLoS One. 8:e780332013.
View Article : Google Scholar
|
|
12
|
Jiang Y, Zhou Z, Meng QT, Sun Q, Su W, Lei
S, Xia Z and Xia ZY: Ginsenoside Rb1 treatment attenuates pulmonary
inflammatory cytokine release and tissue injury following
intestinal ischemia reperfusion injury in mice. Oxid Med Cell
Longev. 2015.843721:2015.
|
|
13
|
Simonian NA and Coyle JT: Oxidative stress
in neurodegenerative diseases. Annu Rev Pharmacol Toxicol.
36:83–106. 1996. View Article : Google Scholar : PubMed/NCBI
|
|
14
|
Muhammad S, Bierhaus A and Schwaninger M:
Reactive oxygen species in diabetes-induced vascular damage,
stroke, and Alzheimer’s disease. J Alzheimers Dis. 16:775–785.
2009. View Article : Google Scholar
|
|
15
|
Shen GX: Mitochondrial dysfunction,
oxidative stress and diabetic cardiovascular disorders. Cardiovasc
Hematol Disord Drug Targets. 12:106–112. 2012. View Article : Google Scholar : PubMed/NCBI
|
|
16
|
Li X, Zhang M and Zhou H: The
morphological features and mitochondrial oxidative stress mechanism
of the retinal neurons apoptosis in early diabetic rats. J Diabetes
Res. 2014.678123:2014.
|
|
17
|
Weir HJ, Murray TK, Kehoe PG, Love S,
Verdin EM, O’Neill MJ, Lane JD and Balthasar N: CNS SIRT3
expression is altered by reactive oxygen species and in Alzheimer’s
disease. PLoS One. 7:e482252012. View Article : Google Scholar
|
|
18
|
Wang X, Wang W, Li L, Perry G, Lee HG and
Zhu X: Oxidative stress and mitochondrial dysfunction in
Alzheimer’s disease. Biochim Biophys Acta. 1842.1240–1247.
2014.
|
|
19
|
Brunst KJ, Sanchez Guerra M, Gennings C,
Hacker M, Jara C, Bosquet Enlow M, Wright RO, Baccarelli A and
Wright RJ: Maternal lifetime stress and prenatal psychological
functioning are associated with decreased placental mitochondrial
DNA copy number in the PRISM study. Am J Epidemiol. 186:1227–1236.
2017. View Article : Google Scholar : PubMed/NCBI
|
|
20
|
Hayashi Y, Haneji N, Hamano H and Yanagi
K: Transfer of Sjogren’s syndrome-like autoimmune lesions into SCID
mice and prevention of lesions by anti-CD4 and anti-T cell receptor
antibody treatment. Eur J Immunol. 24:2826–2831. 1994. View Article : Google Scholar : PubMed/NCBI
|
|
21
|
Wu DC, Zhang MF, Su SG, Fang HY, Wang XH,
He D, Xie YY and Liu XH: HEY2, a target of miR-137, indicates poor
outcomes and promotes cell proliferation and migration in
hepatocellular carcinoma. Oncotarget. 7:38052–38063.
2016.PubMed/NCBI
|
|
22
|
Morioka T, Sakabe M, Ioka T, Iguchi T,
Mizuta K, Hattammaru M, Sakai C, Itoh M, Sato GE, Hashimoto A, et
al: An important role of endothelial hairy-related transcription
factors in mouse vascular development. Genesis. 52:897–906. 2014.
View Article : Google Scholar : PubMed/NCBI
|
|
23
|
Vidigal JA and Ventura A: The biological
functions of miRNAs: Lessons from in vivo studies. Trends Cell
Biol. 25:137–147. 2015. View Article : Google Scholar :
|
|
24
|
Siragam V, Rutnam ZJ, Yang W, Fang L, Luo
L, Yang X, Li M, Deng Z, Qian J, Peng C and Yang BB: MicroRNA
miR-98 inhibits tumor angiogenesis and invasion by targeting
activin receptor-like kinase-4 and matrix metalloproteinase-11.
Oncotarget. 3:1370–1385. 2012. View Article : Google Scholar : PubMed/NCBI
|
|
25
|
Livak KJ and Schmittgen TD: Analysis of
relative gene expression data using real-time quantitative PCR and
the 2(−Delta Delta C(T)) method. Methods. 25:402–408. 2001.
View Article : Google Scholar
|
|
26
|
Cummings J, Lee G, Mortsdorf T, Ritter A
and Zhong K: Alzheimer’s disease drug development pipeline: 2017.
Alzheimers Dement (NY). 3:367–384. 2017.
|
|
27
|
Sevigny J, Chiao P, Bussière T, Weinreb
PH, Williams L, Maier M, Dunstan R, Salloway S, Chen T, Ling Y, et
al: Addendum: The antibody aducanumab reduces Aβ plaques in
Alzheimer’s disease. Nature. 546:5642017. View Article : Google Scholar
|
|
28
|
Kocahan S and Doğan Z: Mechanisms of
Alzheimer’s disease pathogenesis and prevention: The brain, neural
pathology, N-methyl-D-aspartate receptors, tau protein and other
risk factors. Clin Psychopharmacol Neurosci. 15:1–8. 2017.
View Article : Google Scholar : PubMed/NCBI
|
|
29
|
Saed GM, Diamond MP and Fletcher NM:
Updates of the role of oxidative stress in the pathogenesis of
ovarian cancer. Gynecol Oncol. 145:595–602. 2017. View Article : Google Scholar : PubMed/NCBI
|
|
30
|
Yang EJ, Ahn S, Ryu J, Choi MS, Choi S,
Chong YH, Hyun JW, Chang MJ and Kim HS: Phloroglucinol attenuates
the cognitive deficits of the 5XFAD mouse model of Alzheimer’s
disease. PLoS One. 10:e01356862015. View Article : Google Scholar
|
|
31
|
Moslemnezhad A, Mahjoub S and Moghadasi M:
Altered plasma marker of oxidative DNA damage and total antioxidant
capacity in patients with Alzheimer’s disease. Caspian J Intern
Med. 7:88–92. 2016.PubMed/NCBI
|
|
32
|
Malik AN and Czajka A: Is mitochondrial
DNA content a potential biomarker of mitochondrial dysfunction.
Mitochondrion. 13:481–492. 2013. View Article : Google Scholar
|
|
33
|
Banerjee A and Luettich K: MicroRNAs as
potential biomarkers of smoking-related diseases. Biomark Med.
6:671–684. 2012. View Article : Google Scholar : PubMed/NCBI
|
|
34
|
Panda H, Chuang TD, Luo X and Chegini N:
Endometrial miR-181a and miR-98 expression is altered during
transition from normal into cancerous state and target PGR, PGRMC1,
CYP19A1, DDX3X, and TIMP3. J Clin Endocrinol Metab. 97:E1316–E1326.
2012. View Article : Google Scholar : PubMed/NCBI
|
|
35
|
Tan L, Yu JT, Tan MS, Liu QY, Wang HF,
Zhang W, Jiang T and Tan L: Genome-wide serum microRNA expression
profiling identifies serum biomarkers for Alzheimer’s disease. J
Alzheimers Dis. 40:1017–1027. 2014. View Article : Google Scholar
|
|
36
|
Li Q, Li X, Wang L, Zhang Y and Chen L:
miR-98-5p acts as a target for Alzheimer’s disease by regulating Aβ
production through modulating SNX6 expression. J Mol Neurosci.
60:413–420. 2016. View Article : Google Scholar : PubMed/NCBI
|
|
37
|
Hu YK, Wang X, Li L, Du YH, Ye HT and Li
CY: MicroRNA-98 induces an Alzheimer’s disease-like disturbance by
targeting insulin-like growth factor 1. Neurosci Bull. 29:745–751.
2013. View Article : Google Scholar : PubMed/NCBI
|
|
38
|
Liu QY, Chang MN, Lei JX, Koukiekolo R,
Smith B, Zhang D and Ghribi O: Identification of microRNAs involved
in Alzheimer’s progression using a rabbit model of the disease. Am
J Neurodegener Dis. 3:33–44. 2014.
|
|
39
|
Marathe S, Jaquet M, Annoni JM and Alberi
L: Jagged1 is altered in Alzheimer’s disease and regulates spatial
memory processing. Front Cell Neurosci. 11:2202017. View Article : Google Scholar
|
|
40
|
Brai E, Alina Raio N and Alberi L: Notch1
hallmarks fibrillary depositions in sporadic Alzheimer’s disease.
Acta Neuropathol Commun. 4:642016. View Article : Google Scholar
|
|
41
|
Kageyama R, Shimojo H and Imayoshi I:
Dynamic expression and roles of Hes factors in neural development.
Cell Tissue Res. 359:125–133. 2015. View Article : Google Scholar
|
|
42
|
Dawkins E and Small DH: Insights into the
physiological function of the β-amyloid precursor protein: Beyond
Alzheimer’s disease. J Neurochem. 129:756–769. 2014. View Article : Google Scholar : PubMed/NCBI
|
|
43
|
MacGibbon GA, Lawlor PA, Sirimanne ES,
Walton MR, Connor B, Young D, Williams C, Gluckman P, Faull RL,
Hughes P and Dragunow M: Bax expression in mammalian neurons
undergoing apoptosis, and in Alzheimer’s disease hippo-campus.
Brain Res. 750:223–234. 1997. View Article : Google Scholar : PubMed/NCBI
|
|
44
|
Burghardt NS, Park EH, Hen R and Fenton
AA: Adult-born hippocampal neurons promote cognitive flexibility in
mice. Hippocampus. 22:1795–1808. 2012. View Article : Google Scholar : PubMed/NCBI
|
|
45
|
Wang J, Chen L, Jin S, Lin J, Zheng H,
Zhang H, Fan H, He F, Ma S and Li Q: Altered expression of
microRNA-98 in IL-1β-induced cartilage degradation and its role in
chondrocyte apoptosis. Mol Med Rep. 16:3208–3216. 2017. View Article : Google Scholar : PubMed/NCBI
|
|
46
|
Lannfelt L, Relkin NR and Siemers ER:
Amyloid-β-directed immunotherapy for Alzheimer’s disease. J Intern
Med. 275:284–295. 2014. View Article : Google Scholar : PubMed/NCBI
|