Introduction
All-trans retinoic acid (ATRA) exerts
essential roles in reproduction, embryogenesis, cell proliferation,
differentiation and apoptosis (1,2).
ATRA also regulates skin function and is widely used for the
treatment of skin diseases such as acne, psoriasis, ichthyosis and
skin cancer (3-5), but its clinical application is
limited by adverse skin reactions, including erythema, scaling,
dryness, desquamation and vessel dilation. These reactions are
potentially associated with epidermal barrier dysfunction (6), but the mechanisms are largely
unknown.
Tight junctions (TJs) in epithelial and endothelial
tissues have been well studied, and a previous study suggested that
the TJs of the stratum granulosum (SG) are responsible for the
protective function of epithelial tissues (7). TJs consist of transmembrane
Claudins, adherent junction (AJ) molecules, occludin, plaque
proteins (e.g. zonula occludens-1, -2 and -3, and multiple PDZ
domain protein), and cell polarity complex proteins [e.g. the
protein kinase C ι-type/partitioning defective 3 homolog
(Par3)/Par6 complex] (8).
Claudins contain two extracellular loops (cytoplasmic C- and
N-terminal) and four transmembrane domains (9,10).
Claudins-1, -2, -4 and -6 are essential for TJ formation and are
involved in the barrier to paracellular transport (9,11-14). The roles of Claudins in barrier
function have been addressed in epithelial cell cultures and
Claudin-knockout/transgenic mice (15,16). Claudin-1 and -4 are concentrated
in TJs (17). Continuous
Claudin-based TJs are present in the epidermis and these particular
TJs are crucial for the barrier function of mammalian skin
(17). In addition, Claudin-1 and
-4 are involved in the pathogenesis of skin lesions (18-20). How Claudin-1 and -4 are regulated
in response to ATRA is largely unknown.
To understand the molecular basis of ATRA-induced
barrier dysfunction, a gene expression array was used to observe
the differential gene expression in mouse skin and HaCaT cells
following treatment with ATRA. Using a mouse model and a gene
expression array, it was demonstrated that ATRA does, in fact,
alter the structure of TJs in mouse skin. Therefore, the hypothesis
was that Claudins possibly exert an essential role in barrier
dysfunction during ATRA-induced skin irritation. The present study
aimed to investigate the molecular mechanisms of barrier
dysfunction during ATRA-induced skin irritation.
Materials and methods
Animals
Male BALB/c mice (n=32; 8 weeks of age; weight, ~25
g) were obtained from Xi’an Jiaotong University Animal Center
(Xi’an, China). The mice were fed standard chow and had access to
water ad libitum, and were caged in a controlled environment
(12 h light/dark cycle; temperature, 20-25°C; humidity, 45-55%).
The mice were acclimatized for 3 days prior to any experiments. All
experimental procedures were performed in accordance with the
‘Principles of Laboratory Animal Care’ (NIH) and with the approval
of the laboratory animal care committee of Xi’an Jiaotong
University (no. XJTULAC2017-733).
Animal treatment
The skin on the backs of the mice was shaved using
an electric shaver. The mice were divided into two group: i)
Treated with topical 0.1% ATRA cream (Chongqing Winbond
Pharmaceutical Co., Ltd., Chongqing, China) twice a day; and ii)
treated with an oil/water cream (vehicle control) twice a day. The
Psoriasis Area and Severity Index (PASI) scoring system was used to
assess the severity of inflammation on the back skin of the mice
(21). The PASI is widely used in
clinical practice. Erythema, scales and thickening are scored as
follows: 0, absent; 1, slight; 2, mild; 3, obvious; and 4, very
obvious. The sum of the scores of these three factors is an
indicator of the severity of inflammation (score of 0-12).
After 5 days of treatment, the mice were
anesthetized using pentobarbital at 50 mg/kg. The skin from the
backs of the mice, including the dermis and subcutaneous tissues,
was removed. The skin was washed with pre-cooled PBS, excess fat
was removed, and the specimens were placed in liquid nitrogen for
RNA extraction. Subsequently, the mice were sacrificed by cervical
dislocation.
Histological and ultrastructural
analysis
ATRA-treated and untreated mouse dorsal skin
specimens (1×1.5 cm) were fixed in 4% paraformaldehyde for 24 h at
4°C, dehydrated and embedded in paraffin. The samples were
sectioned at 7 µm and stained with hematoxylin for 5 min and
eosin for 2 min at room temperature. The epidermal thickness,
parakeratosis, spongiosis and degree of inflammation were
evaluated. Spongiosis (presence of widened intracellular spaces
between epidermal keratinocytes) and inflammation were evaluated on
a scale of 0-4. Epidermal thickness and spongy edema were measured
using the built-in measurement tool in the software ndp.view2
(Hamamatsu Photonics K.K., Hamamatsu, Japan; https://www.hamamatsu.com/jp/en/product/type/U12388-01.html;
version 2.7). The expanded capillaries were counted at high
magnification (×200) in 10 randomly selected fields under an
Olympus BX51 light microscope equipped with a DP70 digital camera
(Olympus Corporation, Tokyo, Japan). Incomplete keratinization was
assessed as present or absent (22).
The specimens were cut into 1-cm blocks and dipped
in ice-cold sodium cacodylate buffer solution containing 2.5%
glutaraldehyde at 4°C for 24 h. The blocks were washed three times
and treated with 1% osmium tetroxide at 4°C for 1 h. The samples
were dehydrated using an ethanol series and embedded in Epon 812.
Ultra-thin sections were stained with lead citrate for 10 min and
uranyl acetate for 30 min at room temperature. Ultrastructural
changes were observed by transmission electron microscopy (TEM)
using a H7650 microscope (Hitachi, Ltd., Tokyo, Japan).
Cell culture and treatment
HaCaT cells (immortalized keratinocytes) were
obtained from the Fourth Military Medical University (Shan’xi,
China) and grown in RPMI-1640 (GE Healthcare, Chicago, IL, USA)
with 10% fetal bovine serum (Life Technologies; Thermo Fisher
Scientific, Inc., Waltham, MA, USA) and 1% penicillin-streptomycin
(GE Healthcare). Short tandem repeat profiling was performed by
Shanghai Zhong Qiao Xin Zhou Biotechnology Co., Ltd. (Shanghai,
China) to validate the cell line. The cells were subcultured
following dissociation with 0.25% trypsin/0.05% EDTA (1:1) and
passaged at a ratio of 1:4 every 3 days.
HaCaT cells (5,000 cells/well) were incubated in
96-well plates for 48 h and treated by different concentrations
(0.1, 0.5, 1, 5 and 10 µM) of ATRA at 37°C for a further 36
h. A volume of 20 µl MTT solution (5 mg/ml) was added to
each well and the culture continued for 4 h. Subsequently, the
medium was removed, and 150ul dimethyl sulfoxide (DMSO) was added
to each well. The light absorption value of each well was measured
at optical density 490 nm (570 nm) with a micro-plate reader.
Following determination of the half-maximal inhibitory
concentration using different concentrations of ATRA
(Sigma-Aldrich; Merck KGaA, Darmstadt, Germany), HaCaT cells were
incubated with or without 1 µM ATRA for 36 h at 37°C, which
was chosen for use in the subsequent experiments. Stock solutions
of ATRA (0.01 M) were prepared in DMSO, stored in the dark at
−20°C, and further diluted with RPMI-1640. The concentration of
DMSO was 1‰.
Microarray analysis
Microarray analysis was used primarily to identify
candidates that were later confirmed via reverse
transcription-quantitative polymerase chain reaction (RT-qPCR)
and/or immunohistochemistry. The gene expression profiles in the
skin of mice and in HaCaT cells treated or untreated with ATRA were
compared using NimbleGen Gene Expression analysis (Nimblegen
Systems Inc., Madison, WI, USA). The ds-cDNA samples were washed
and labeled according to the Nimblegen Gene Expression Analysis
protocol (Nimblegen Systems Inc.). A NanoDrop ND-1000 was used to
quantify the cDNA following purification. Cy3 labeling was
conducted using the NimbleGen One-Color DNA labeling kit (NimbleGen
Systems, Inc.), according to the manufacturer’s protocol.
Subsequently, 100 U Klenow fragment (New England Biolabs, Inc.,
Ipswich, MA, USA) and 100 pmol deoxynucleoside triphosphates were
added and incubated at 37°C for 2 h. One-tenth volume of 0.5 M EDTA
was added to stop the reaction. The labeled ds-cDNA was purified
using isopropanol/ethanol precipitation. The microarrays were
immersed in the NimbleGen hybridization buffer/hybridization
component A, which was supplemented with 4 µg ds-cDNA with
Cy3 labeling. The reaction system was kept in a hybridization
chamber (Nimblegen Systems, Inc.) at 42°C for 4 h. The NimbleGen
Wash Buffer kit (Nimblegen Systems, Inc.) was used to wash the
microarrays in an environment without ozone. The Axon GenePix 4000B
microarray scanner was used to scan the microarrays.
RT-qPCR
The RNAeasy Midi kit (Qiagen AB, Sollentuna, Sweden)
was used to isolate the total mRNA, according to the manufacturer’s
protocol. RNA (1 µg) was added in a 20-µl reaction
system (PrimeScript RT Reagent Kit; Takara, Otsu, Japan) at 37°C
for 15 min and 85°C for 5 sec for cDNA synthesis. The SYBR Premix
Ex Taq II amplification kit (Perfect Real Time; Takara
Biotechnology Co., Ltd., Dalian, China) was used for qPCR on a
Bio-Rad IQ5 System (Bio-Rad Laboratories, Inc., Hercules, CA, USA).
The conditions were: i) 95°C denaturation for 10 min; and ii) 40
cycles at 95°C for 10 sec and 60°C for 30 sec. The primers are
listed in Table I. β-actin was
used for normalization. The results were analyzed using the IQ5
software (version 2.5). Gene expression levels were calculated
using the 2−ΔΔCq method (23).
 | Table IPrimers for reverse
transcription-quantitative polymerase chain reaction. |
Table I
Primers for reverse
transcription-quantitative polymerase chain reaction.
| Gene symbol | Primers |
|---|
| β-actin |
F-5′-AGCAGAGAATGGAAGAGTAAA-3′ |
|
R-5′-ATGCTGCTTACATGTCTCGAT-3′ |
| CLDN4 |
F-5′-TATGGATGAACTGCGTGGTG-3′ |
|
R-5′-GATGATGVTGATGATGACGAG-3′ |
| CLDN1 |
F-5′-GAAGTGTATGAAGTGCTTGG-3′ |
|
R-5′-GGGTCATAGGGTCATAGAAT-3′ |
| CLDN2 |
F-5′-GTGAAGGCAGAGATGAGAAGAGG-3′ |
|
R-5′-ATGGGATTTGGGCTTTTGG-3′ |
| FLG |
F-5′-AGACTGGGAGGCAAGCTACAAC-3′ |
|
R-5′-TGGTTTGGAGTGGGATTGCT-3′ |
Western blotting
ATRA-treated and untreated HaCaT cells were lysed in
radioimmunoprecipitation assay buffer [150 mM NaCl, 50 mM Tris-HCl
(pH 8.0), 0.5% deoxycholate, 0.1% SDS, 1% Nonidet P-40 and protease
inhibitor cocktail; Sigma-Aldrich; Merck KGaA] at 4°C for 1 h.
Protein concentration was measured using a bicinchoninic acid
protein assay kit (Beyotime Institute of Biotechnology, Haimen,
China). Equal amounts of proteins (30 µg) were separated on
12% SDS-PAGE gels and transferred to PVDF membranes (EMD Millipore,
Billerica, MA, USA). TBS buffer containing Tween-20 (TBST) and 5%
non-fat milk was used to block non-specific binding at room
temperature for 2 h. Following blocking, primary antibodies were
incubated overnight at 4°C: Rabbit anti-human Claudin-1 (cat. no.
13050-1-AP; ProteinTech Group, Inc., Chicago, IL, USA; 1:200), goat
anti-human Claudin-4 (cat. no. 17664; Santa Cruz Biotechnology,
Inc., Dallas, TX, USA; 1:200) and mouse anti-human β-actin (cat.
no. 47778; Santa Cruz Biotechnology, Inc.; 1:1,000). The membranes
were washed three times with TBST for 5 min. Horseradish peroxidase
(HRP)-conjugated Affinipure Rabbit Anti-Goat IgG (H+L) (cat. no.
SA00001-2; ProteinTech Group, Inc.; 1:3,000), HRP-conjugated
Affinipure Goat Anti-Mouse IgG (H+L) (cat. no. SA00001-1;
ProteinTech Group, Inc.; 1:3,000) and HRP-conjugated Affinipure
Donkey Anti-Goat IgG (H+L) (cat. no. SA00001-3; ProteinTech Group,
Inc.; 1:4,000) were incubated for 1 h at 37°C prior to
visualization with enhanced chemiluminescence (Amersham; GE
Healthcare). Densitometry was used to quantify the signal
intensities using Quantity One 4.5 software (Bio-Rad Laboratories,
Inc.). All measurements were performed in triplicates from three
independent experiments.
Immunofluorescence
HaCaT cells and cryostat sections (4 µm) of
skin from ATRA-treated and untreated mice were fixed in ice-cold 4%
paraformaldehyde in PBS for 30 min. Non-specific binding was
blocked with 10% normal goat serum (OriGene Technologies, Inc.,
Beijing, China) for 20 min at 37°C. Goat anti-human Claudin-4
(1:50) and rabbit anti-human Claudin-1 antibodies (1:50) were
incubated overnight at 4°C. PBS was used as a negative control. The
sections were washed twice for 5 min in PBS. Alexa Fluor
594-labeled secondary antibodies (cat. nos. A32758 and A32740;
Jackson ImmunoResearch Laboratories, Inc., West Grove, PA, USA;
1:200) were incubated for 1 h at room temperature and revealed
using DAPI (1:5,000 in PBS) for 2 min at room temperature. A laser
scanning confocal microscope (LSM510; Zeiss AG, Oberkochen,
Germany) was used to capture images of the cells (×200
magnification).
Statistical analysis
All statistical analyses were conducted using SPSS
16.0 (SPSS, Inc., Chicago, IL, USA). Data are expressed as the mean
± standard deviation. All measurements were performed in triplicate
from three independent experiments. The distribution was tested for
normality using the Kolmogorov-Smirnov test. Statistical
significance was evaluated by independent sample t-test for
normally distributed data and using the Mann-Whitney U test for
non-normally distributed data. P<0.05 was considered to indicate
a statistically significant difference.
For the microarray data, the NimbleScan software
(version 2.5; NimbleGen Systems, Inc.) was used to conduct grid
alignment and analyze the expression profiles. The Robust Multichip
Average (RMA) algorithm and quantile normalization in NimbleScan
software were applied to the normalized expression data. The gene
levels were inputted into the Agilent GeneSpring software (version
12.0; Agilent Technologies, Inc., Santa Clara, CA, USA).
Fold-change filtering was applied for the identification of genes
with differential expression levels. The threshold was set
at-fold-change ≥2.0. The Agilent GeneSpring GX software (version
12.0; Agilent Technologies, Inc.) was used to conduct hierarchical
clustering. The roles of the differentially expressed genes were
determined using Gene Ontology (GO; www.geneontology.org) and pathway analyses (https://www.genome.jp/kegg) conducted on the basis of
the standard enrichment computation method, and using Fisher’s
exact test to determine whether the amount of overlaps between the
GO annotation list and the list of differentially expressed genes
was significant. P≤0.05 indicated that the GO term enrichment was
statistically significant.
Results
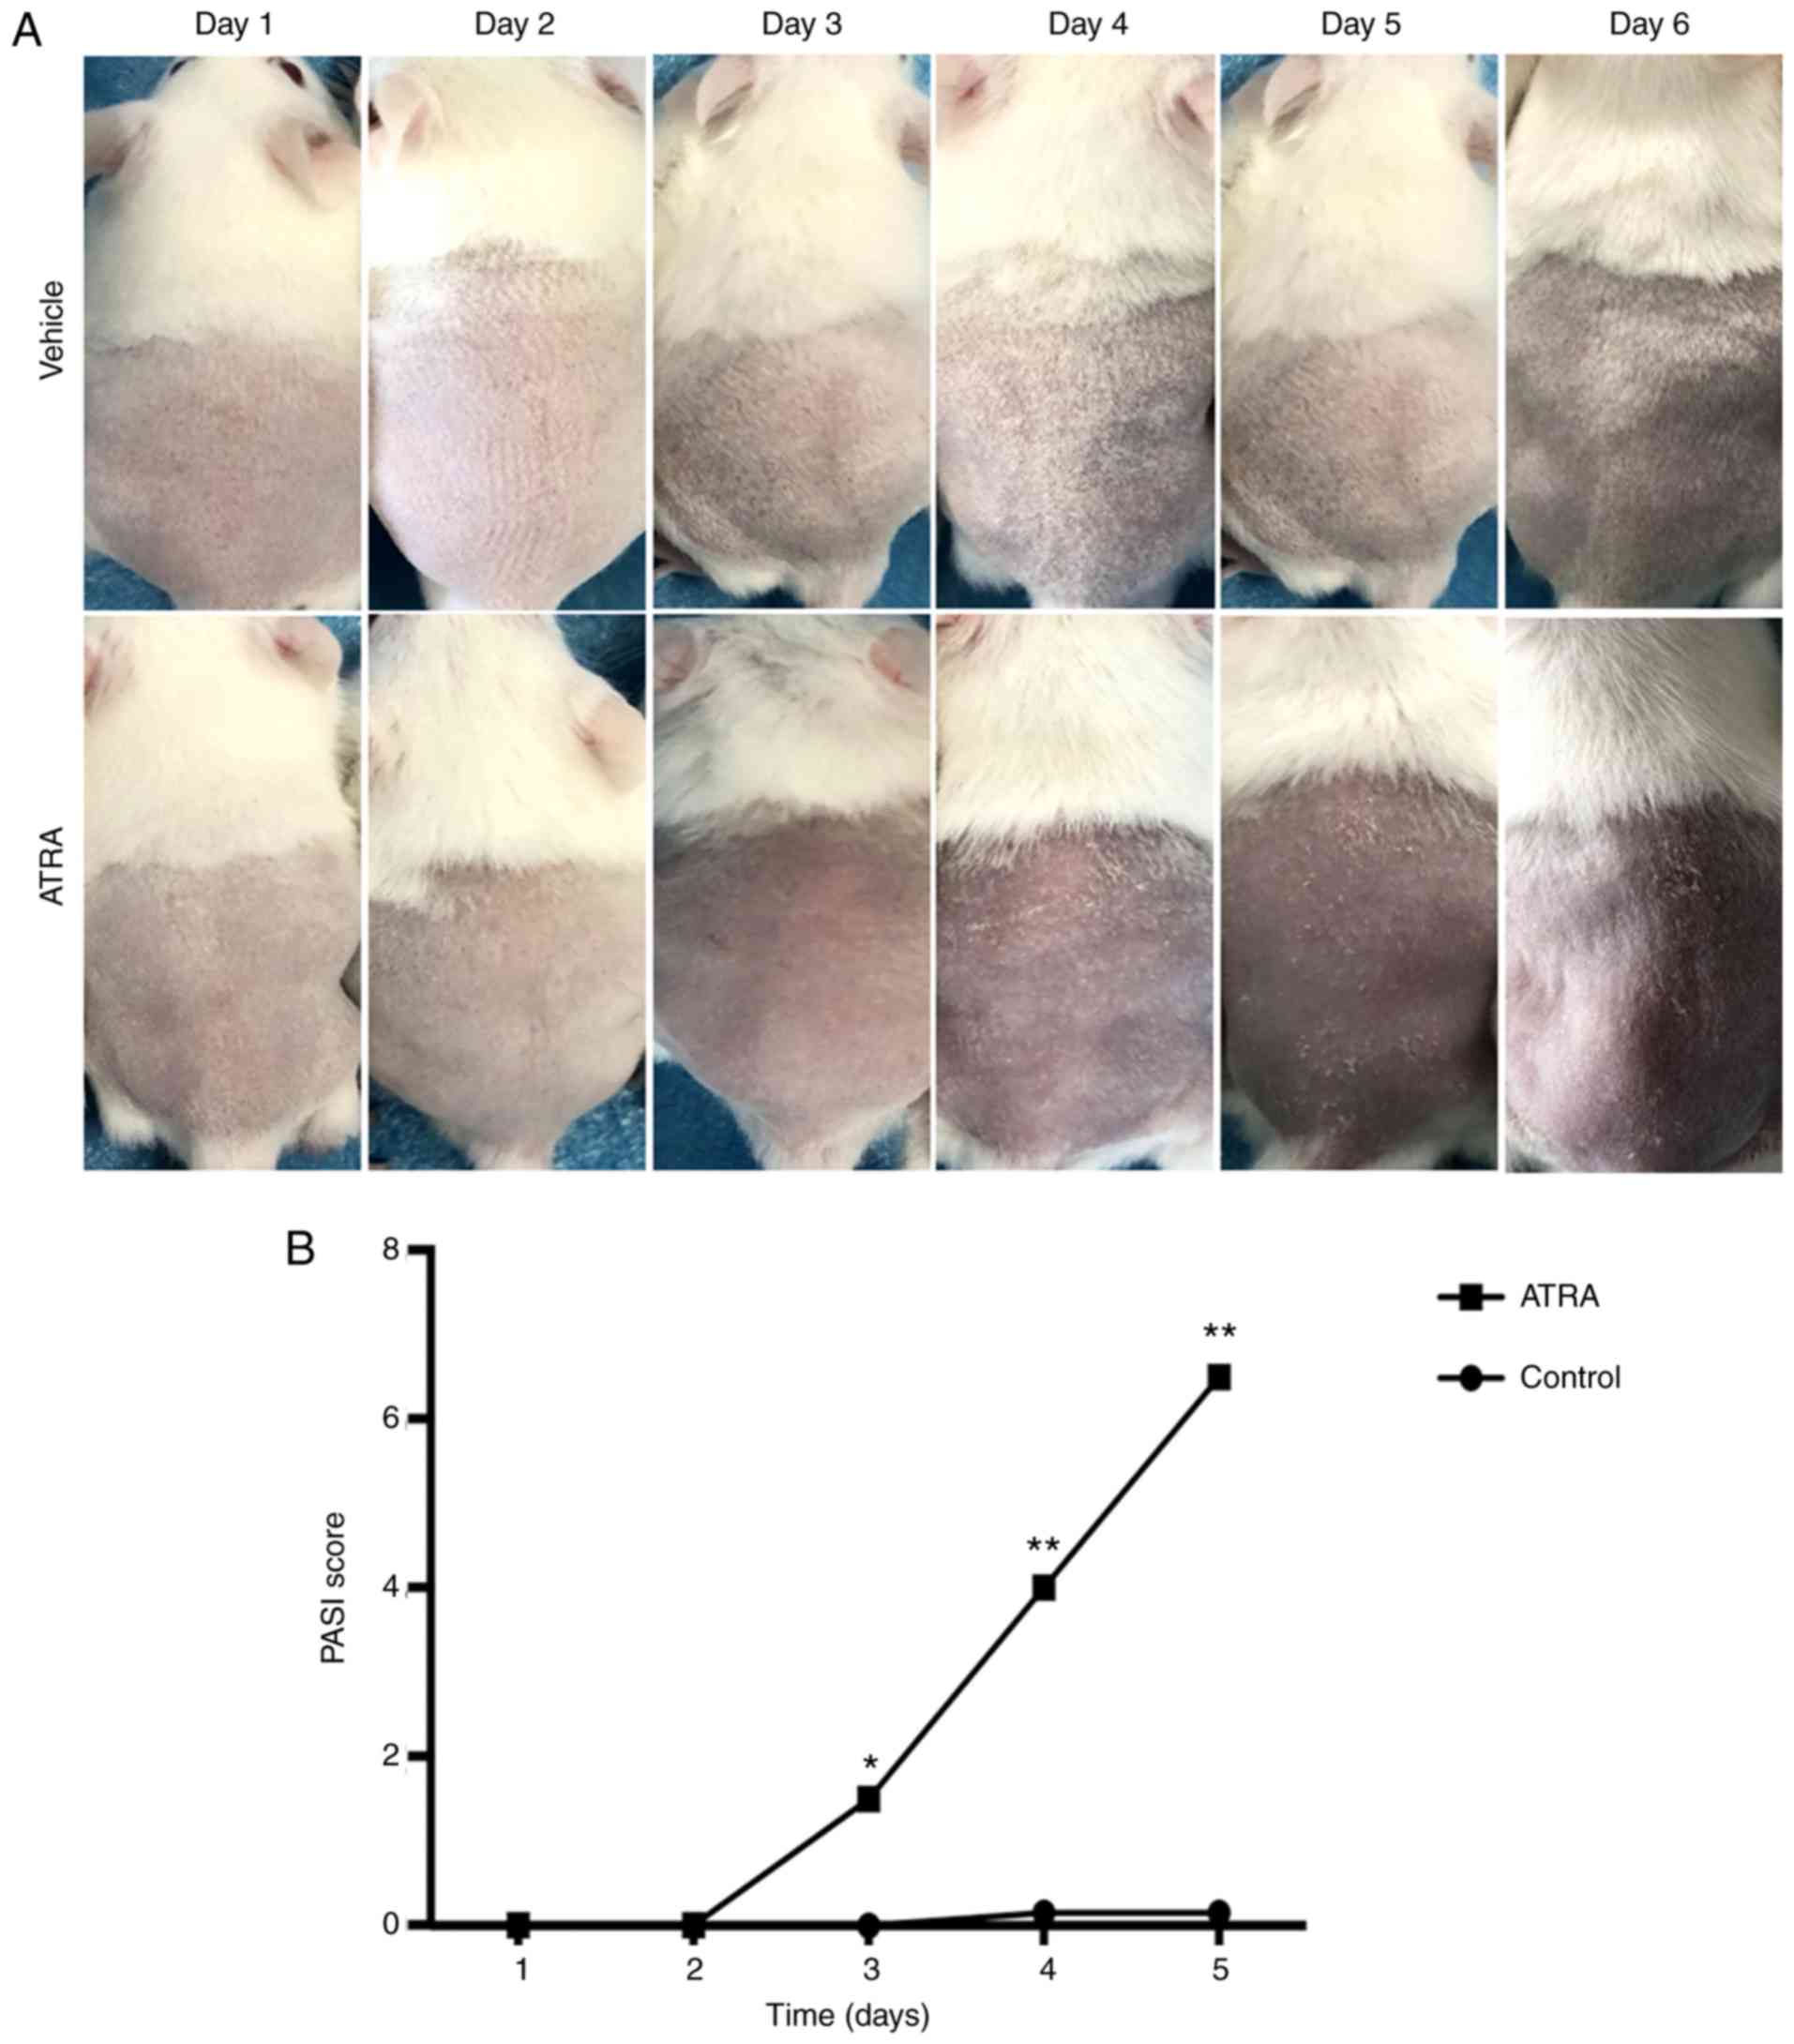
Topical ATRA induces histological
alterations in the skin of treated mice
After 5 days of treatment, no marked alterations
were detected in the control skin. Circumscribed erythema occurred
after 3 days of ATRA application (n=6), with fine flat scales
covering the surface of the erythema that peaked at 5 days
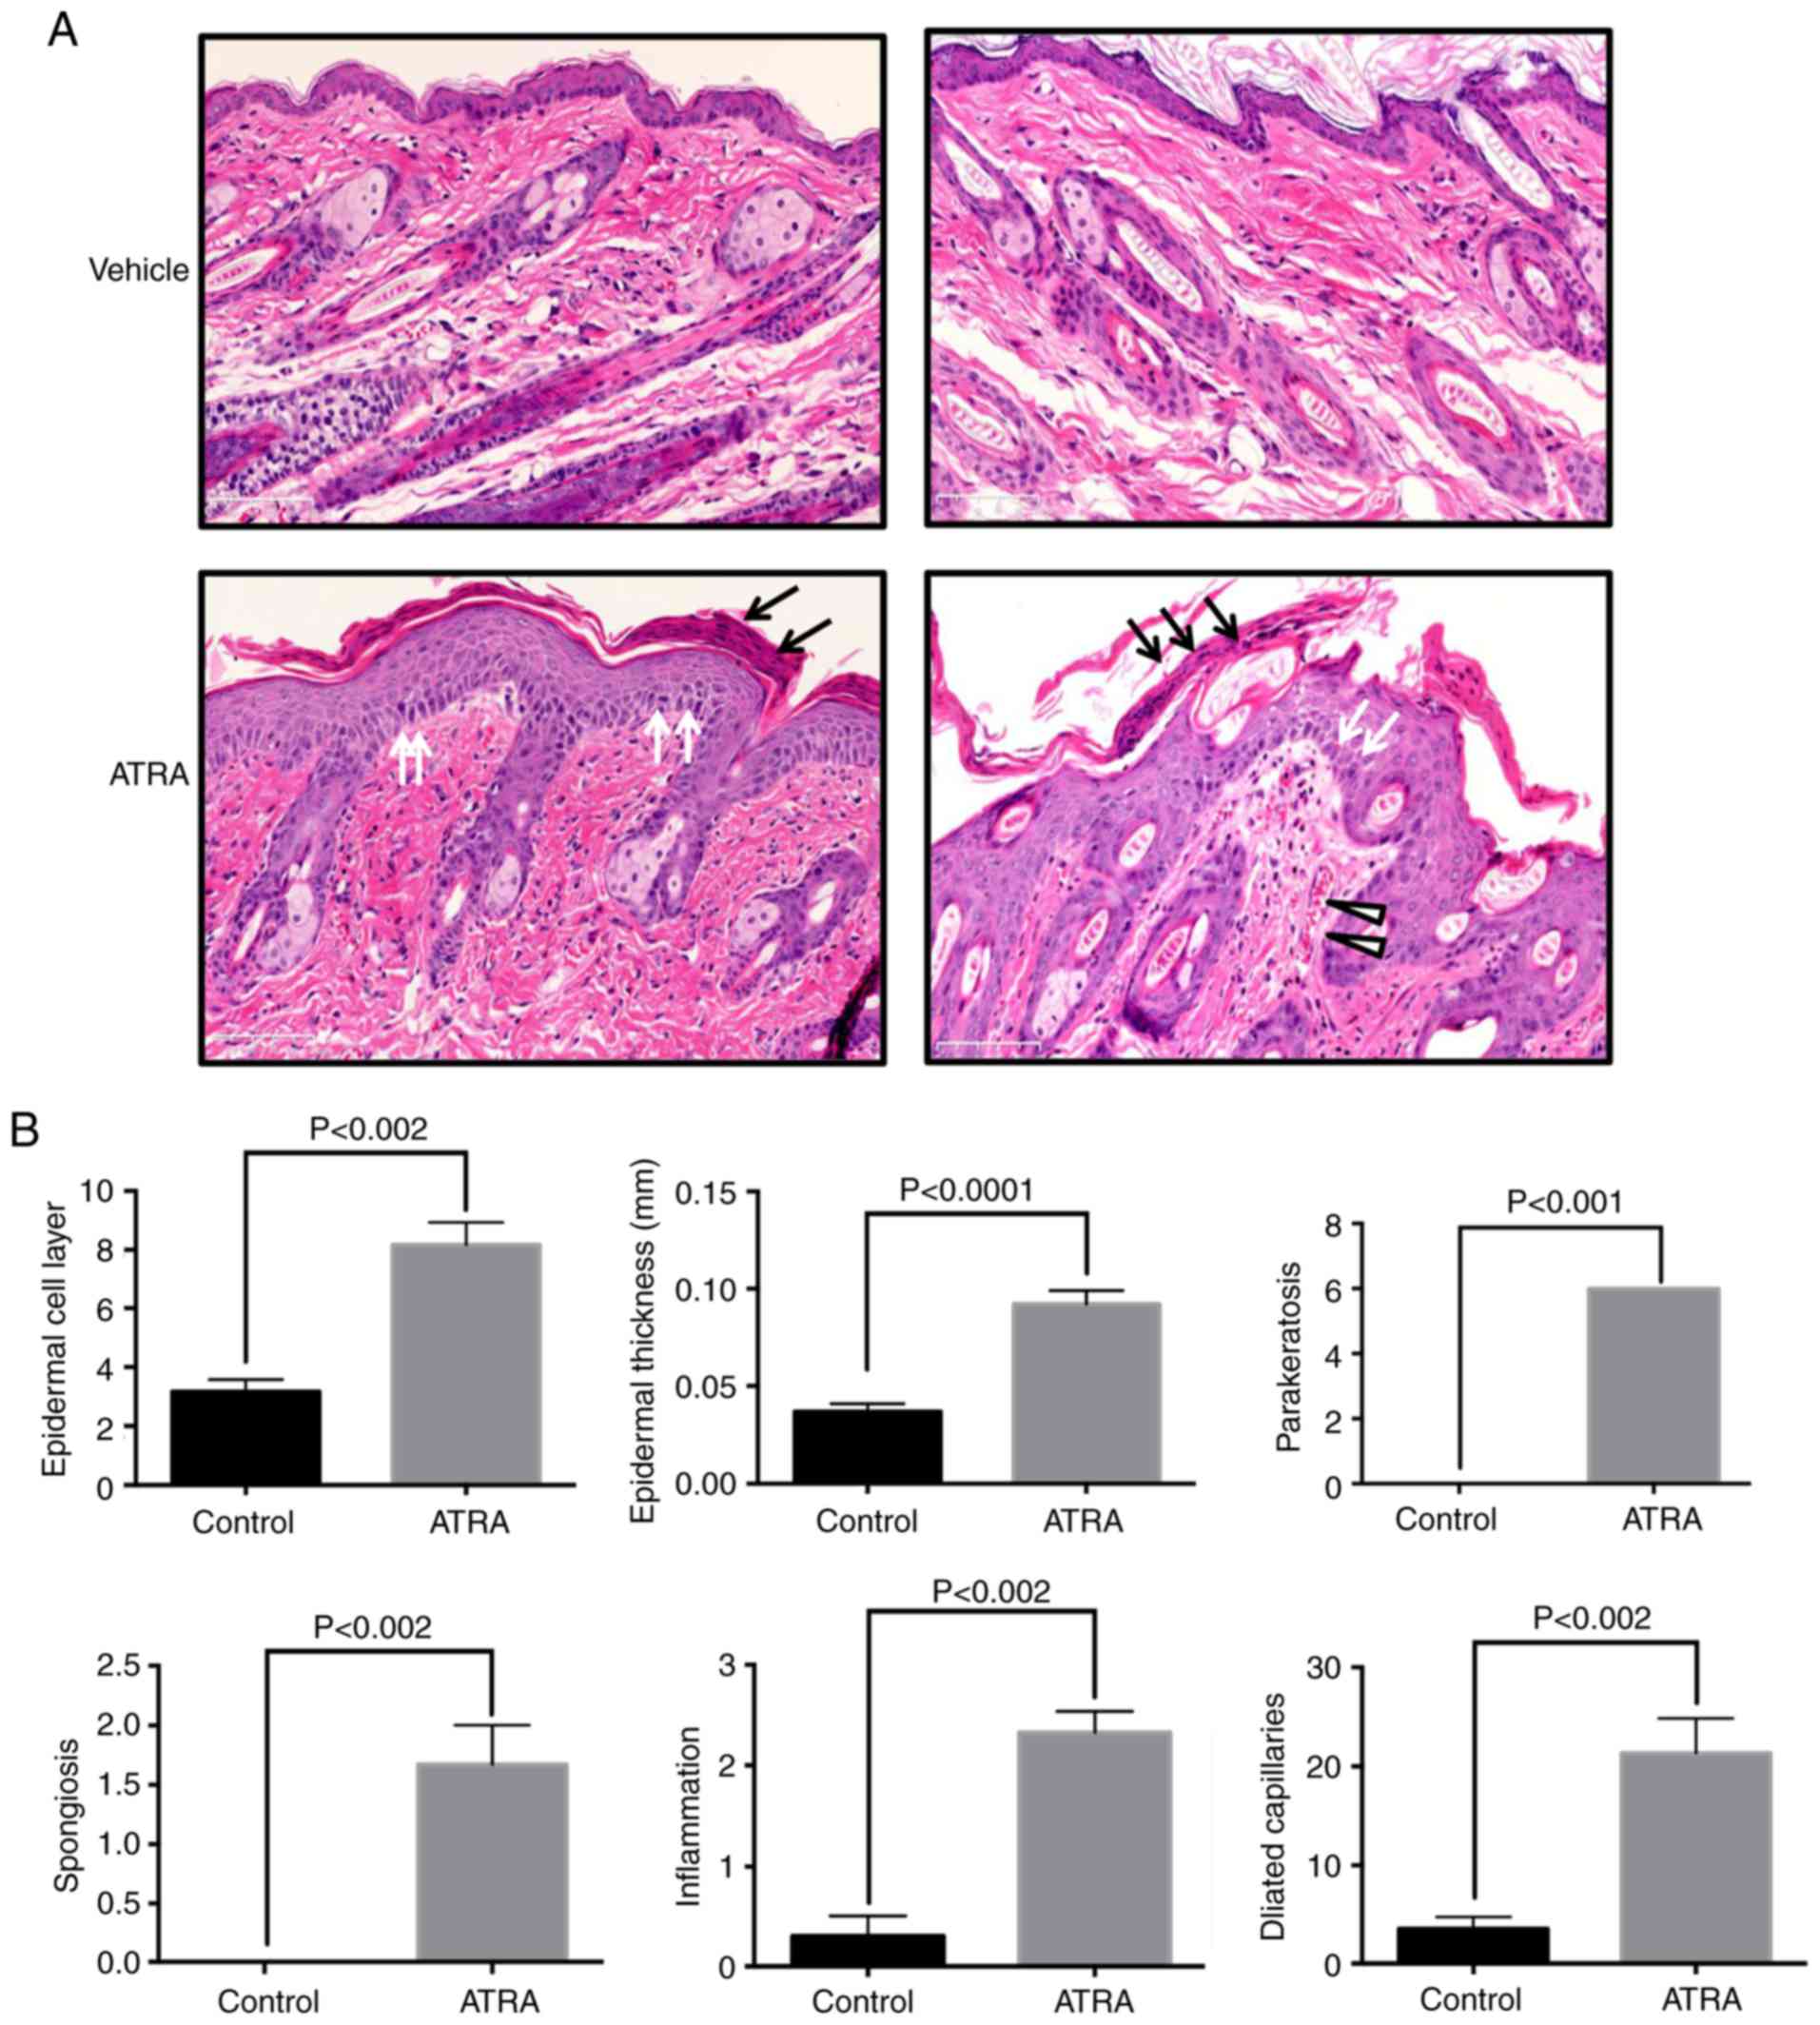
(Fig. 1). Hematoxylin and eosin
staining of ATRA-treated skin demonstrated crust, focal
parakeratosis, hyperproliferation and intercellular edema of the
stratum spinosum (Fig. 2A). In
the ATRA-treated dermis, large amounts of inflammatory cell
infiltration and capillary dilation were observed (Fig. 2A). Epidermal thickness was 2.5
times higher following ATRA intervention compared with that of the
control group (P<0.0001), in addition to increases in
parakeratosis (P<0.001) and spongiosis (P<0.002). In the
dermis, perivascular lymphocytic infiltration (P<0.002) and
telangiectasia (P<0.002) were observed in the dermal papilla and
in the superficial layer (Fig.
2B).
ATRA treatment causes ultrastructural
abnormalities in the epidermis
Compared with control skin, keratohyalin granules
were decreased in number in the SG (n=3; Fig. 3A). TEM also demonstrated that the
keratinocyte cytoskeleton was damaged by ATRA and that the
cytoskeletal network disappeared in the local upper stratum corneum
(Fig. 3A). In the upper stratum
corneum, multiple lipid droplets were observed in the cytoplasm of
corneocytes in the ATRA-treated skin (Fig. 3B). In the epidermis of
ATRA-treated skin, TEM revealed a disordered arrangement of stratum
spinosum cells, in addition to the appearance of significantly
larger nucleoli and wider intercellular spaces (Fig. 3B). Desmosomes were decreased and
disordered in ATRA-treated skin (Fig.
3C). Quantitative analysis of keratohyalin granules, lipid
droplets and desmosomes is presented in Fig. 3D.
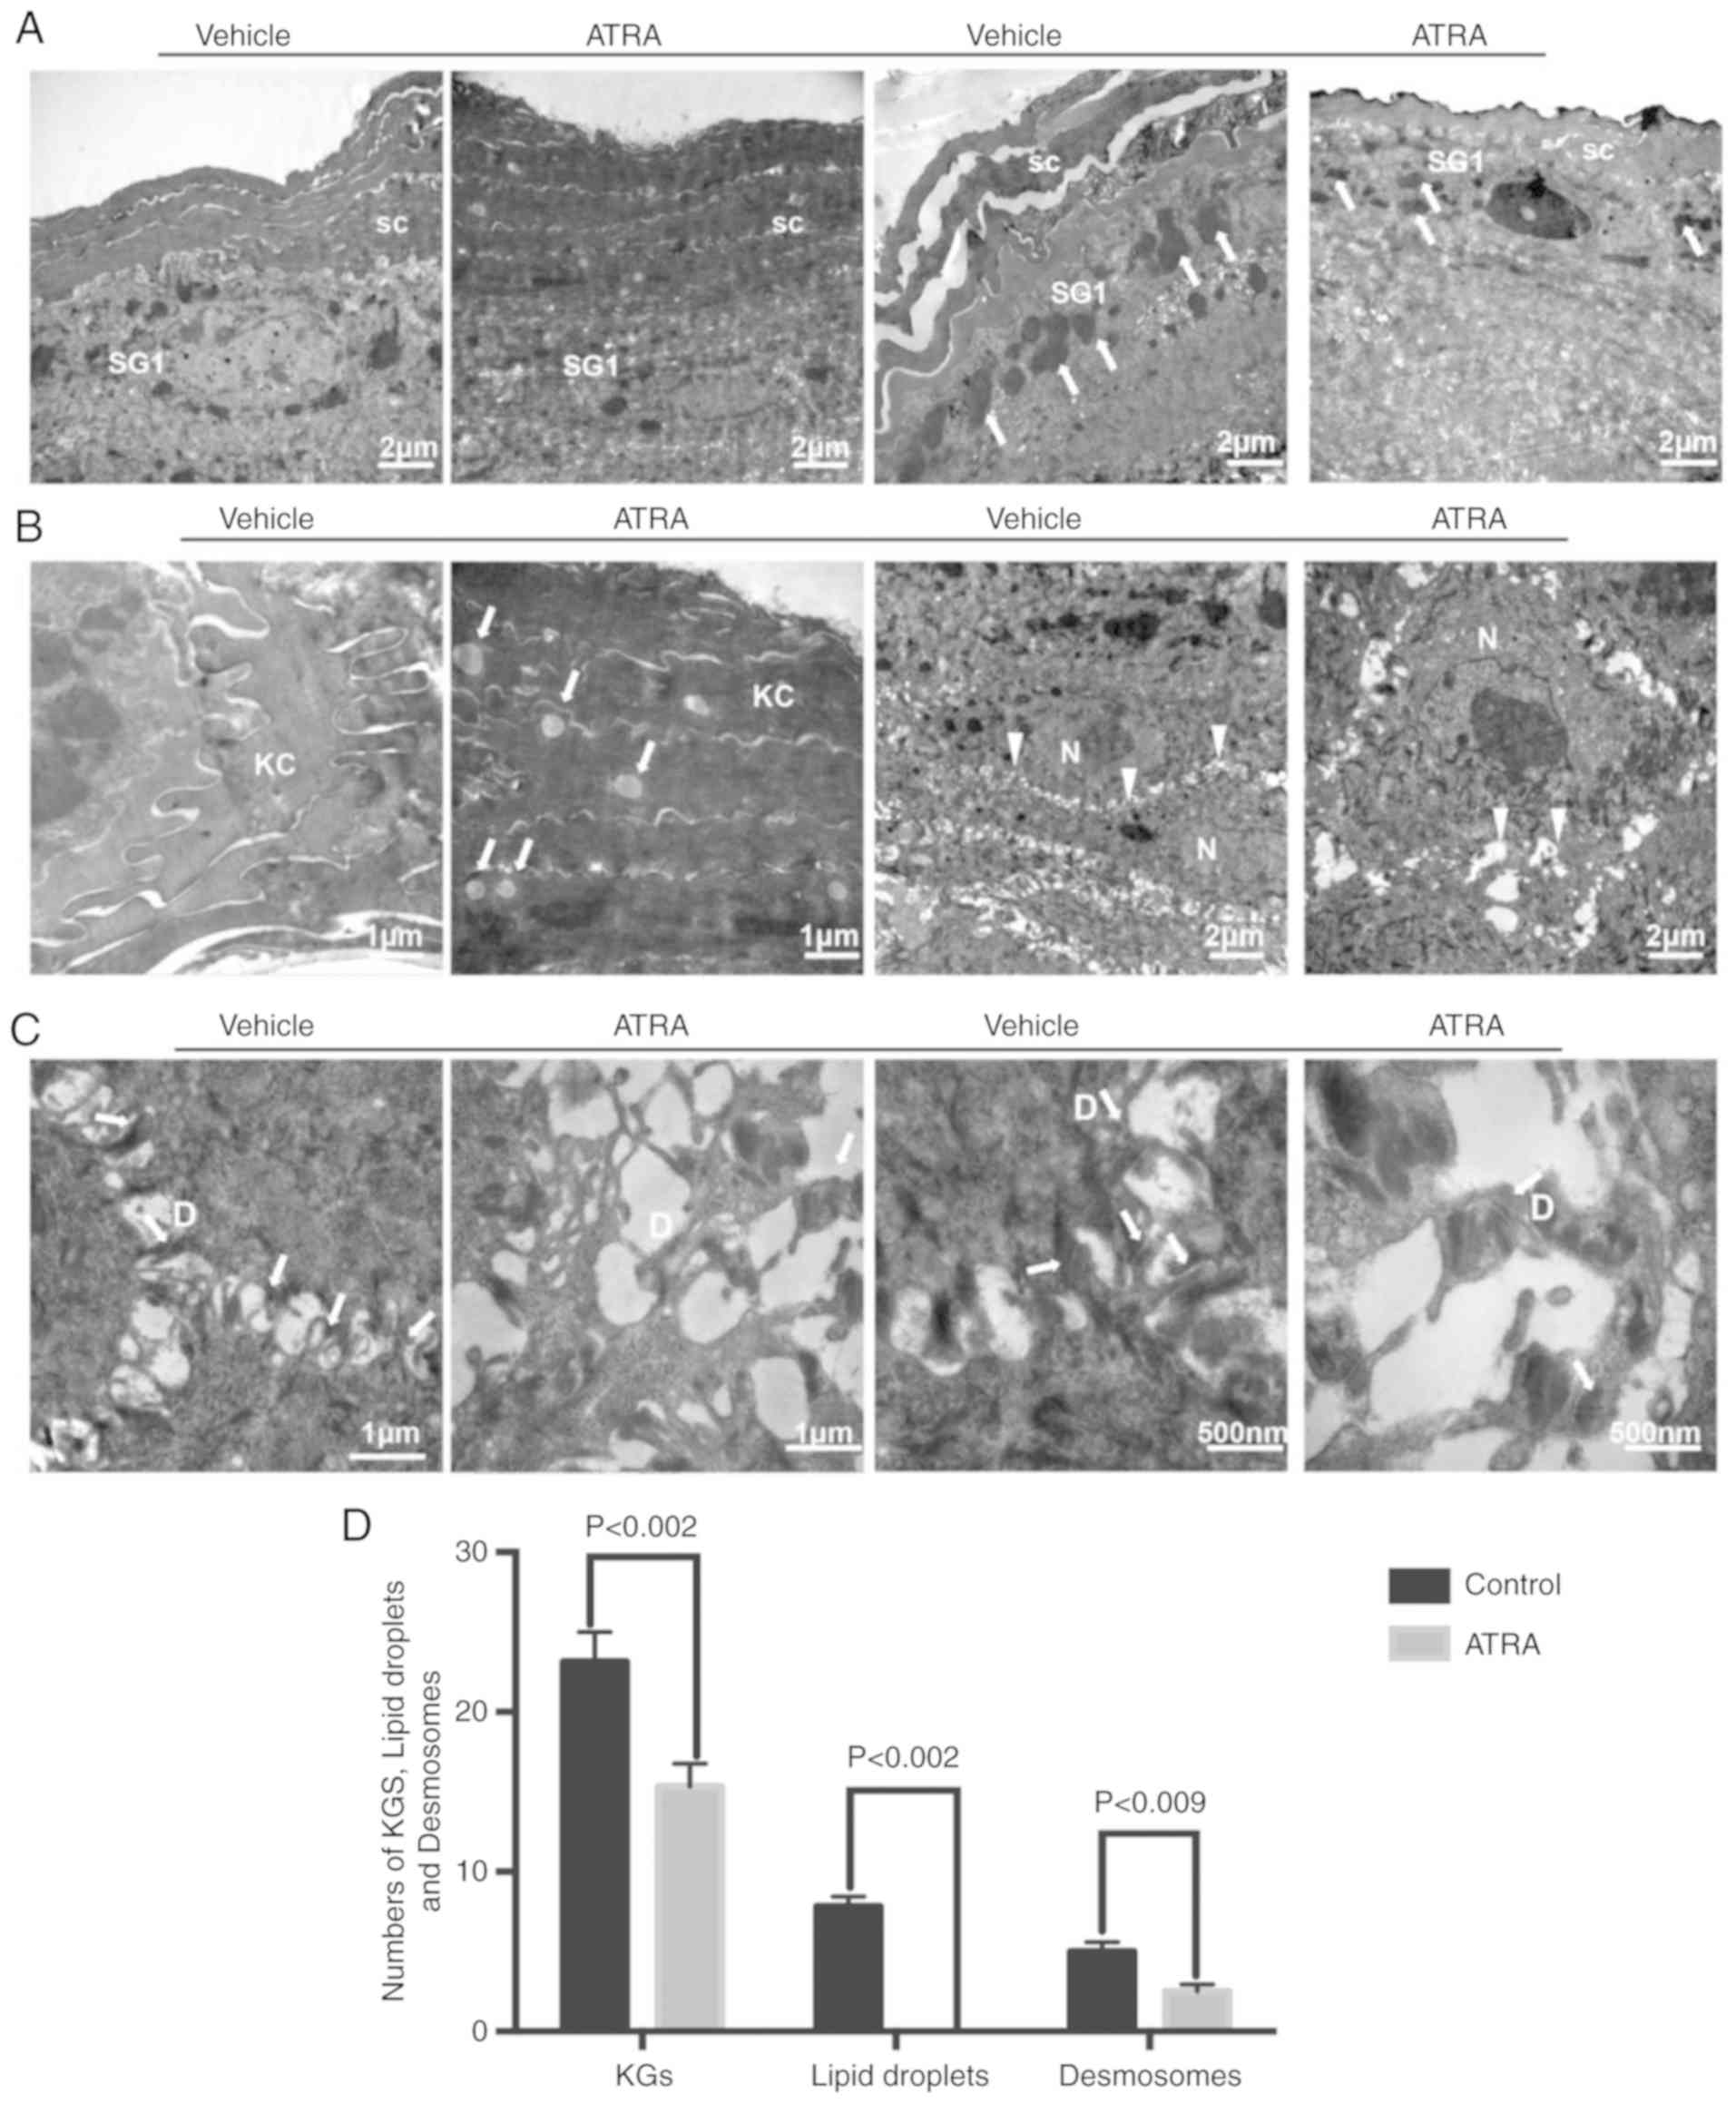 | Figure 3Effect of ATRA on ultrastructural
alterations in the mouse epidermis. (A) The stratum corneum was
impaired and the number of epidermal cell layers and epidermal
thickness were increased. The number of KGs around granular cells
were decreased (arrows). (B) There were multiple lipid droplets in
the corneocytes (arrows). The volume of the spinous layer cells was
increased, the nucleoli were significantly larger, and the
intercellular space was widened (triangles). (C) Desmosomes were
reduced in number and damaged (arrows). n=3/group. A representative
image is presented for each group. (D) The numbers of KGs, lipid
droplets and desmosomes were quantified. KC, keratinocyte; SC,
stratum corneum; SG, stratum granulosum; D, desmosome; N, nucleus;
KGs, keratinocyte granules; ATRA, all-trans retinoic
acid. |
Gene expression profiling reveals
dysregulation of epidermal barrier-associated genes in the mouse
epidermis and HaCaT cells treated with ATRA
With the aim of improving the understanding of the
molecular mechanisms of ATRA-induced barrier dysfunction, gene
expression array analysis (n=1) was used to identify candidate
genes for barrier function in the mouse skin and HaCaT cells. There
were 897 upregulated and 1,087 downregulated genes following
treatment with ATRA in the mouse epidermis. Similarly, there were
1,220 upregulated and 905 downregulated genes following treatment
with ATRA in HaCaT cells. The genes involved in epidermal barrier
function were revealed by gene expression analyses and are
presented in Tables II–Table IIITable IVV. The downregulated epidermal
barrier-associated genes following treatment with ATRA in the mouse
skin included genes involved in ‘cornified envelope components’,
‘intermediate filament’, ‘lipid metabolic process’, ‘gap junction’,
‘tight junction’ and ‘desmosome’ (Table II). The upregulated epidermal
barrier-associated genes following treatment with ATRA in mouse
skin included genes involved in ‘cornified envelope components’,
‘serine protease and protease inhibitors’, ‘lipid metabolic
process’, ‘tight junction’ and ‘transcriptional factors’ (Table III). The downregulated epidermal
barrier-associated genes following treatment with ATRA in HaCaT
cells included genes involved in ‘intermediate filament’,
‘proteases and protease inhibitors’ and ‘tight junction’ (Table IV). The upregulated epidermal
barrier-associated genes following treatment with ATRA in HaCaT
cells included genes involved in ‘intermediate filament’,
‘proteases and protease inhibitors’ and ‘tight junction’ (Table V).
| Table IIDownregulation of epidermal
barrier-associated genes following treatment with all-trans
retinoic acid in mouse skin (n=1 per group;-fold change >2;
P<0.05). |
Table II
Downregulation of epidermal
barrier-associated genes following treatment with all-trans
retinoic acid in mouse skin (n=1 per group;-fold change >2;
P<0.05).
A, Cornified
envelope components
|
|---|
| GenBank accession
no. | Gene name | Gene full name | Fold
downregulation |
|---|
| AF510860 | FLG | Filagrin | 2.13 |
| BC108980 | FOXN1 | Forkhead box
N1 | 2.42 |
| BC107019 | SPRR4 | Small proline-rich
protein 4 | 2.67 |
| BC109181 | LCE1M | Late cornified
envelope 1M | 6.64 |
| BC031486 | PPHLN1 | Periphilin 1 | 2.40 |
| BC119192 | GPRC5D | Protein-coupled
receptor, class C, group 5, member D | 20.66 |
|
| B, Intermediate
filament |
|
| GenBank accession
no. | Gene name | Gene full name | Fold
downregulation |
|
| BC003472 | KRT23 | Keratin 23 | 2.67 |
| BC129847 | KRT24 | Keratin 24 | 2.66 |
| BC018391 | KRT25 | Keratin 25 | 6.56 |
| BC116672 | KRT26 | Keratin 26 | 7.78 |
| AB288231 | KRT28 | Keratin 28 | 4.28 |
| BC117553 | KRT32 | Keratin 32 | 6.04 |
| BC12542 | KRT34 | Keratin 34 | 101.08 |
| BC100542 | KRT35 | Keratin 35 | 6.86 |
| BC119521 | KRT40 | Keratin 40 | 10.11 |
| BC125346 | KRT71 | Keratin 71 | 2.90 |
| BC067067 | KRT73 | Keratin 73 | 4.34 |
| BC107395 | KRT77 | Keratin 77 | 9.12 |
| BC119366 | KRT80 | Keratin 80 | 2.21 |
| AF312018 | KRT81 | Keratin 81 | 30.65 |
| BC10897 | KRT82 | Keratin 82 | 10.18 |
| BC152922 | KRT85 | Keratin 85 | 19.46 |
| BC029257 | KRT33A | Keratin associated
protein 33A | 39.26 |
| NM_013570 | KRT33B | Keratin associated
protein 33B | 4.79 |
| NM_001085526 | KRTAP1-2 | Keratin associated
protein 1-3 | 13.42 |
| XM_894811 | KRTAP3-1 | Keratin associated
protein 3-1 | 29.03 |
| BC156698 | KRTAP4-2 | Keratin associated
protein 4-2 | 19.09 |
| NM_026834 | KRTAP4-6 | Keratin associated
protein 4-6 | 24.72 |
| BC115508 | KRTAP4-7 | Keratin associated
protein 4-7 | 33.02 |
| NM_001085547 | KRTAP4-8 | Keratin associated
protein 4-8 | 43.14 |
| NM_001085548 | KRTAP4-9 | Keratin associated
protein 4-9 | 24.62 |
| BC016249 | KRTAP4-16 | Keratin associated
protein 4-16 | 42.20 |
| NM_015809 | KRTAP5-4 | Keratin associated
protein 5-4 | 19.54 |
| NM_027771 | KRTAP7-1 | Keratin associated
protein 7-1 | 137.50 |
| AK133727 | KRTAP8-1 | Keratin associated
protein 8-1 | 18.92 |
| BC116210 | KRTAP9-1 | Keratin associated
protein 9-1 | 11.56 |
| BC156686 | KRTAP9-3 | Keratin associated
protein 9-3 | 35.46 |
| NM_001085527 | KRTAP9-5 | Keratin associated
protein 9-5 | 12.10 |
| BC116219 | KRTAP15 | Keratin associated
protein 15 | 60.31 |
| BC116200 | KRTAP19-4 | Keratin associated
protein 19-4 | 10.75 |
| BC115545 | KRTAP19-3 | Keratin associated
protein 19-3 | 8.54 |
| BC132612 | KRTAP6-5 | Keratin associated
protein 6-5 | 14.96 |
| BC132658 | KRTAP16-3 | Keratin associated
protein 16-3 | 39.91 |
| BC128283 | KRTAP26-1 | Keratin associated
protein 26-1 | 6.51 |
|
| C, Lipid
metabolic process |
|
| GenBank accession
no. | Gene name | Gene full name | Fold
downregulation |
|
| AK003689 | LYPLA2 | Lysophospholipase
II | 2.00 |
| BC027524 | PLA2G2E | Phospholipase A2,
group IIE | 2.60 |
| BC148434 | PLCH2 | Phospholipase C eta
2 | 2.13 |
| BC047281 | AGPAT4 |
1-acylglycerol-3-phosphate
O-acyltransferase 4 | 3.81 |
| BC031987 | AGPAT5 |
1-acylglycerol-3-phosphate
O-acyltransferase 5 | 3.17 |
| AK019476 | SMPD3 | Sphingomyelin
Phosphodiesterase 3 neutral | 2.15 |
| AK088962 | SMPD2 | Sphingomyelin
phosphodiesterase 2 neutral | 2.10 |
| BC013751 | ALOX12E | Arachidonate
lipoxygenase | 3.90 |
| BC043059 | LASS5/Cers5 | Epidermal ceramide
synthase 5 | 2.82 |
| BC075627 | DGKK | Diacylglycerol
kinase κ | 3.89 |
| BC021597 | APOM | Apolipoprotein
M | 2.58 |
| BC006863 | FAAH | Fatty acid amide
hydrolase | 2.22 |
| BC071266 | FADS3 | Fatty acid
desaturase 3 | 2.53 |
|
| D, Gap
junction |
|
| GenBank accession
no. | Gene name | Gene full name | Fold
downregulation |
|
| AY427554 | GJA1 | Gap junction
protein α1 | 2.00 |
| AY390399 | GJA3 | Gap junction
protein α3 | 2.57 |
| BC024387 | GJB3 | Gap junction
protein β3 | 2.77 |
|
| E, Tight
junction |
|
| GenBank accession
no. | Gene name | Gene full name | Fold
downregulation |
|
| AK165750 | PRKCZ | Protein kinase C
ζ | 2.37 |
| DQ682659 | MARVELD2 | MARVEL domain
containing 2 | 3.81 |
| AK190015 | TJAP1 | Tight junction
associated protein 1 | 2.08 |
| BC049662 | MPP7 | Membrane
palmitoylated protein 7 | 2.11 |
|
| F,
Desmosome |
|
| GenBank accession
no. | Gene name | Gene full name | Fold
downregulation |
|
| BC020144 | DSG2 | Desmoglein 2 | 4.48 |
| Table IIIUpregulation of epidermal
barrier-associated genes following treatment with all-trans
retinoic acid in the mouse skin (n=1 per group;-fold change >2;
P<0.05). |
Table III
Upregulation of epidermal
barrier-associated genes following treatment with all-trans
retinoic acid in the mouse skin (n=1 per group;-fold change >2;
P<0.05).
A, Cornified
envelope components
|
|---|
| GenBank accession
no. | Gene name | Gene full name | Fold
upregulation |
|---|
| BC115788 | LCE3B | Late cornified
envelope 3B | 3.17 |
| BC119239 | LCE3C | Late cornified
envelope 3C | 5.35 |
| BC125542 | SPRR2J | Small proline-rich
protein 2J | 2.38 |
| BC130233 | SPRR2G | Small proline-rich
protein 2G | 3.57 |
| BC078629 | S100A8 | S100 calcium
binding protein A8 (calgranulin A) | 3.31 |
| AK143826 | S100A9 | S100 calcium
binding protein A9 (calgranulin B) | 3.81 |
|
| B, Serine
protease and protease inhibitors |
|
| GenBank accession
no. | Gene name | Gene full name | Fold
upregulation |
|
| BC031119 | KLK6 | Kallikrein
related-peptidase 6 | 3.22 |
| BC002100 | KLK10 | Kallikrein
related-peptidase 10 | 2.90 |
| XM_893506 | KLK12 | Kallikrein
related-peptidase 12 | 2.50 |
| BC054091 | SERPINE1 | Serine (cysteine)
proteinase inhibitor, clade E, member 1 | 2.15 |
| BC010675 | SERPINE2 | Serine (cysteine)
proteinase inhibitor, clade E, member 2 | 2.98 |
|
| C, Lipid
metabolic process |
|
| GenBank accession
no. | Gene name | Gene full name | Fold
upregulation |
|
| BC010829 | ACNAT2 | Acyl-coenzyme A
amino acid N-acyltransferase 2 | 2.03 |
| DQ469311 | ACNAT1 | Acyl-coenzyme A
amino acid N-acyltransferase 1 | 2.94 |
| AK171255 | ACOT11 | Acyl-CoA
thioesterase 11 | 3.73 |
| BC050828 | UGCG | UDP-glucose
ceramide glucosyltransferase | 2.21 |
| BC060600 | PLA2G4E | Phospholipase A2,
group IVE | 2.39 |
| BC003470 | PLA1A | Phospholipase A1
member A | 2.06 |
| BC003943 | DPAGT1 | Dolichyl-phosphate
(UDP-N-acetylglucosamine) glycerol | 2.10 |
|
| D, Tight
junction |
|
| GenBank accession
no. | Gene name | Gene full name | Fold
upregulation |
|
| BC015252 | CLDN2
Claudin-2 | 2.43 | |
|
| E,
Transcriptional factors |
|
| GenBank accession
no. | Gene name | Gene full name | Fold
upregulation |
|
| BC070398 | PPARδ | Peroxisome
proliferator activator receptor δ | 2.00 |
| Table IVDownregulation of epidermal
barrier-associated genes following treatment with all-trans
retinoic acid in HaCaT cells (n=1 per group;-fold change >2;
P<0.05). |
Table IV
Downregulation of epidermal
barrier-associated genes following treatment with all-trans
retinoic acid in HaCaT cells (n=1 per group;-fold change >2;
P<0.05).
A, Intermediate
filament
|
|---|
| GenBank accession
no. | Gene name | Gene full name | Fold
downregulation |
|---|
| NM_181619 | KRTAP21-1 | Keratin associated
protein 21-1 | 2.38 |
| NM_033448 | KRT71 | Keratin 71 | 2.00 |
| BC024292 | KRT5 | Keratin 5 | 2.22 |
|
| B, Proteases and
protease inhibitors |
|
| GenBank accession
no. | Gene name | Gene full name | Fold
downregulation |
|
| BC069417 | SERPINB7 | Serpin family B
member 7 | 3.15 |
| NM_000185 | SERPIND1 | Serpin family D
member 1 | 2.36 |
| NM_007173 | PRSS23 | Serine protease
23 | 4.13 |
| NM_022046 | KLK14 | Kallikrein related
peptidase 10 | 2.29 |
|
| C, Tight
junction |
|
| GenBank accession
no. | Gene name | Gene full name | Fold
downregulation |
|
| AK128686 | PDZD2 | PDZ domain
containing 2 | 2.15 |
| Table VUpregulation of epidermal
barrier-associated genes following treatment with all-trans
retinoic acid in HaCaT cells (n=1 per group;-fold change >2;
P<0.05). |
Table V
Upregulation of epidermal
barrier-associated genes following treatment with all-trans
retinoic acid in HaCaT cells (n=1 per group;-fold change >2;
P<0.05).
A, Intermediate
filament
|
|---|
| GenBank accession
no. | Gene name | Gene full name | Fold
upregulation |
|---|
| NM_002275 | KRT15 | Keratin 15 | 2.07 |
| BC072018 | KRT17 | Keratin 17 | 2.68 |
| AB096945 | KRTAP19-4 | Keratin associated
protein 19-4 | 2.07 |
| BC101555 | KRTAP7-1 | Keratin associated
protein 7-1 (gene/pseudogene) | 2.05 |
| NM_032524 | KRTAP4-4 | Keratin associated
protein 4-4 | 2.16 |
|
| B, Proteases and
protease inhibitors |
|
| GenBank accession
no. | Gene name | Gene full name | Fold
upregulation |
|
| NM_001085 | SERPINA3 | Serpin family A
member 3 | 12.30 |
| NM_000624 | SERPINA5 | Serpin family A
member 5 | 2.03 |
| BC034528 | SERPINB8 | Serpin family B
member 8 | 2.11 |
| NM_000934 | SERPINF2 | Serpin family F
member 2 | 2.06 |
| NM_002575 | SERPINB2 | Serpin family B
member 2 | 2.17 |
| BC009726 | PRSS22 | Serine protease
22 | 4.26 |
| AF335478 | KLK3 | Kallikrein related
peptidase 3 | 2.27 |
| NM_001012964 | KLK6 | Kallikrein related
peptidase 6 | 2.95 |
| NM_002776 | KLK10 | Kallikrein related
peptidase 10 | 2.44 |
| NM_006853 | KLK11 | Kallikrein related
peptidase 11 | 2.43 |
| NM_015596 | KLK13 | Kallikrein related
peptidase 13 | 2.80 |
| NM_017509 | KLK15 | Kallikrein related
peptidase 15 | 2.02 |
|
| C, Tight
junction |
|
| GenBank accession
no. | Gene name | Gene full name | Fold
upregulation |
|
| BC029886 | OCLN Occludin | 2.63 | |
| NM_001305 | CLDN4
Claudin-4 | 2.02 | |
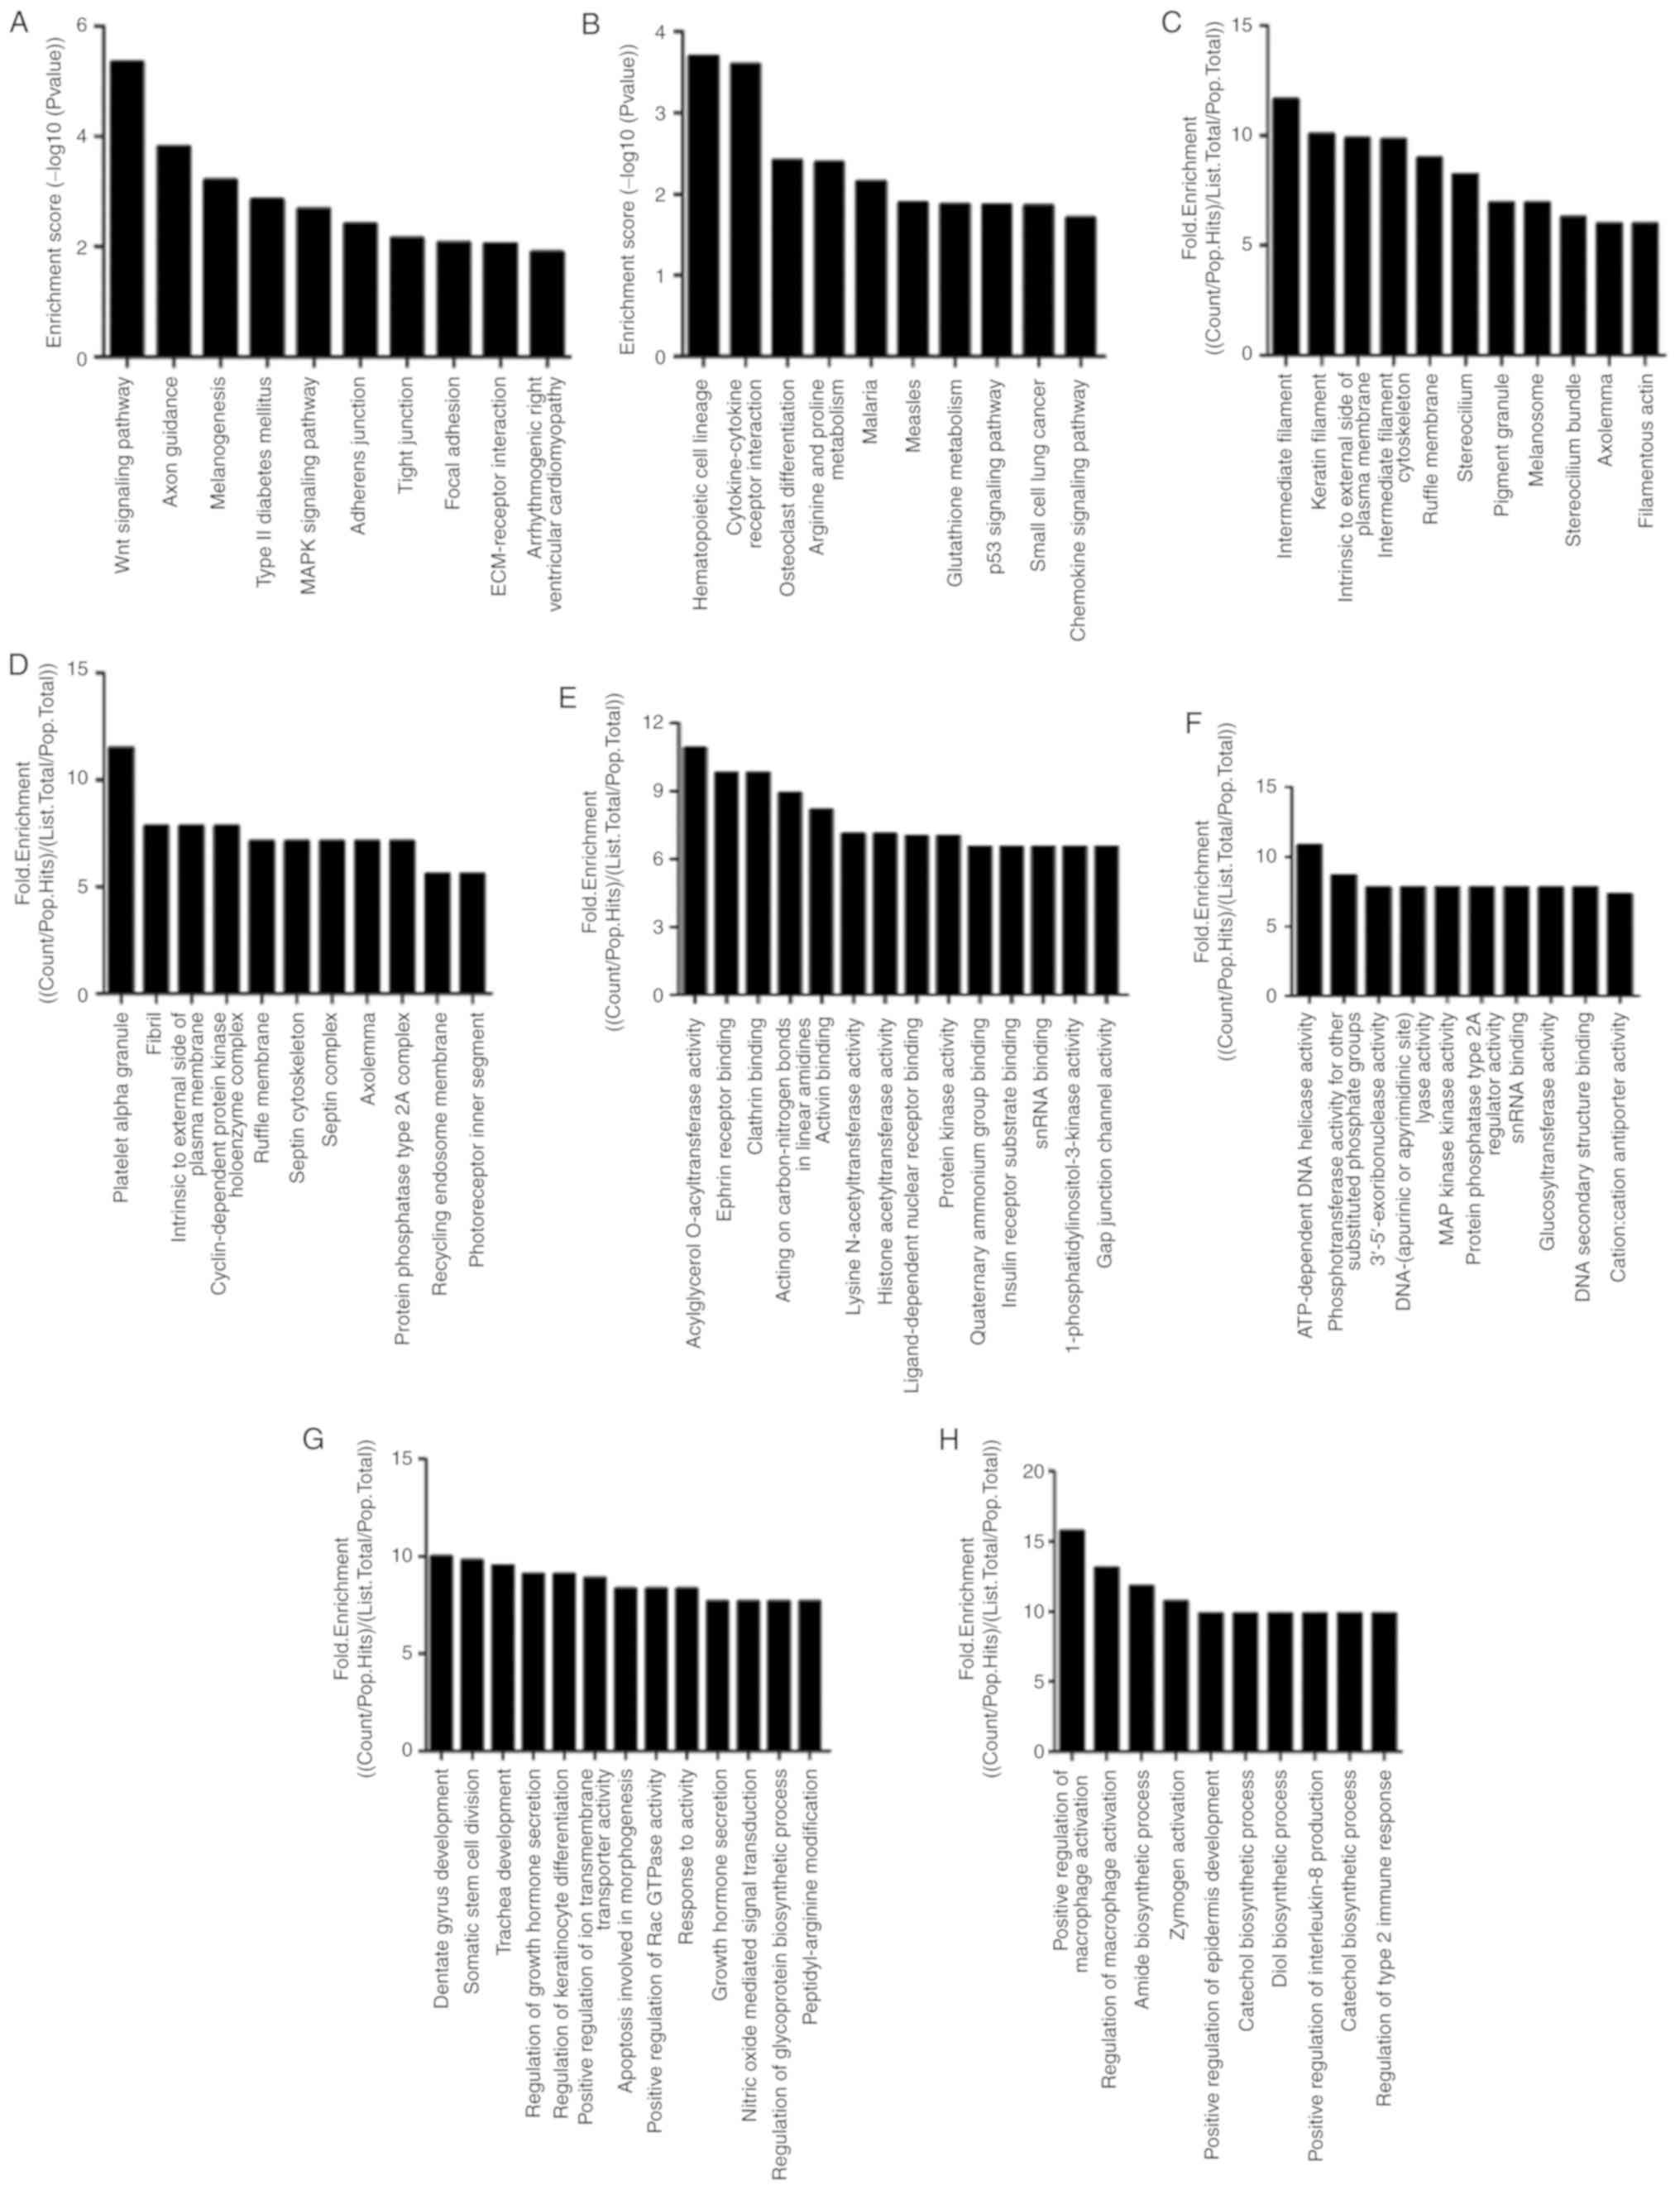
The pathway analyses demonstrated that
differentially expressed genes were significantly associated with
AJs, TJs and focal adhesion in ATRA-treated epidermal tissues. The
top ten pathways of up- and downregulated differentially expressed
genes are presented in Fig. 4A and
B, respectively. The top ten three GO-fold enrichment of
differentially expressed genes revealed significant downregulation
of epidermal barrier function-associated processes, including
‘regulation of keratinocyte differentiation’, ‘keratin filament’
and ‘gap junction’ channel activity (Fig. 4C-H). In ATRA-treated epidermal
tissues, a series of dysregulated genes associated with the
epidermal differentiation complex (EDC) were observed, which
included small proline-rich region proteins (SPRRs), filaggrin
(FLG), loricrin (LOR) and the S100 gene family. These proteins are
essential for the formation of the cell envelope during terminal
differentiation. A number of these genes were members of the SPRR
family: SPRR4 (−2.67-fold), SPRR2J (+2.38-fold) and
SPRR2G (+3.57-fold). The remainder were part of the S100
gene family: S100A8 (+3.31-fold) S100A9 (+3.81-fold)
and FLG (−2.13-fold) (Tables
II and III). During
keratinocyte differentiation, the late cornified envelope protein
(LCE) was induced and had similar functions to the functions of the
SPRR family (cross-linking proteins) in the CE. LCE1M
(6.64-fold) was downregulated, while LCE3C (5.35-fold) and
LCE3B (3.17-fold) were upregulated (Tables II and III). Nevertheless, no notable
abnormalities were observed in the above genes in HaCaT cells. In
ATRA-treated epidermal tissues and HaCaT cells, marked
dysregulation of numerous keratins and keratin-associated proteins
was observed, suggesting abnormal terminal differentiation of
keratinocytes upon ATRA treatment. Serine proteases and serine
protease inhibitors are involved in the differentiation of
keratinocytes and desquamation (24). In ATRA-treated epidermal tissues
and HaCaT cells, the differential expression of serine proteases
and serine protease inhibitors was observed. Among them, it was
observed that KLK6 and KLK10 were consistently expressed in the
mouse chip and HaCaT cells, and all of them were upregulated.
Genes encoding enzymes associated with lipid
metabolism were demonstrated to be induced by ATRA in the mouse
epidermis. Compared with the cells, the mice exhibited significant
downregulation of a subset of enzymes associated with ceramide,
free fatty acids and phospholipid synthesis: i) Sphingomyelin
phosphodiesterase 3 (SMPD3; -2.15-fold) and sphingomyelin
phosphodiesterase 2 (SMPD2, -2.10-folds), which catalyze the
conversion of sphingolipids to ceramides; ii) epidermal ceramide
synthase 5 (LASS5/Cers5; -2.82-fold), which catalyzes the
synthesis of ceramides; iii) lysophospholipase II (LYPLA;
-2.00-fold), phospholipase A2 group IIE2 (PLA2G2E;
-2.60-fold), and phospholipase C eta 2 (PLCH2; -2.13-fold),
which catalyze free fatty acid formation from phospholipids; and
iv) 1-acylglycerol-3-phosphate O-acyltransferase 4 (AGPAT4;
-3.81-fold) and 1-acylglyc-erol-3-phosphate O-acyltransferase 5
(AGPAT5; -3.17-fold), which catalyze the acylation of
lysophosphatidic acid into phosphatidic acid. The latter is the
primary precursor of all types of glycerolipids. Furthermore,
arachidonate lipoxygenase (ALOX12E; a member of the
epidermis-type LOX family that catalyzes the conversion of
polyunsaturated fatty acids into oxygenated products) was
downregulated by ATRA. Conversely, the present results also
demonstrated upregulation of different isoforms of the
aforementioned enzymes (Table
III).
The dysregulation of numerous cell-cell
junction-associated genes was observed in ATRA-treated mouse skin.
Among these genes were components of TJs (TJAP1,
MPP7, MARVELD2 and CLDN2), gap junctions
(GJA, GJA and GJB4) and desmosomes (DSG2).
Compared with the mouse skin specimens, only the TJ protein
molecules Claudin-4 and occludin were upregulated in the cells.
ATRA treatment alters the expression and
localization of TJs in HaCaT cells
In ATRA-treated cells, CLDN1 was
downregulated 0.66-fold, while CLDN4, TJP3 and
GJB4 were upregulated 1.82-, 3.63- and 1.92-fold (Fig. 5A). In mice treated with ATRA,
CLDN1 (0.8-fold) and FLG (0.61-fold) were
downregulated, while CLDN4 (1.47-fold) and CLDN2
(2.49-fold) were upregulated (Fig.
5B). Western blot analysis of CLDN4 and CLDN1 revealed similar
results to those of the RT-qPCR (Fig.
5C).
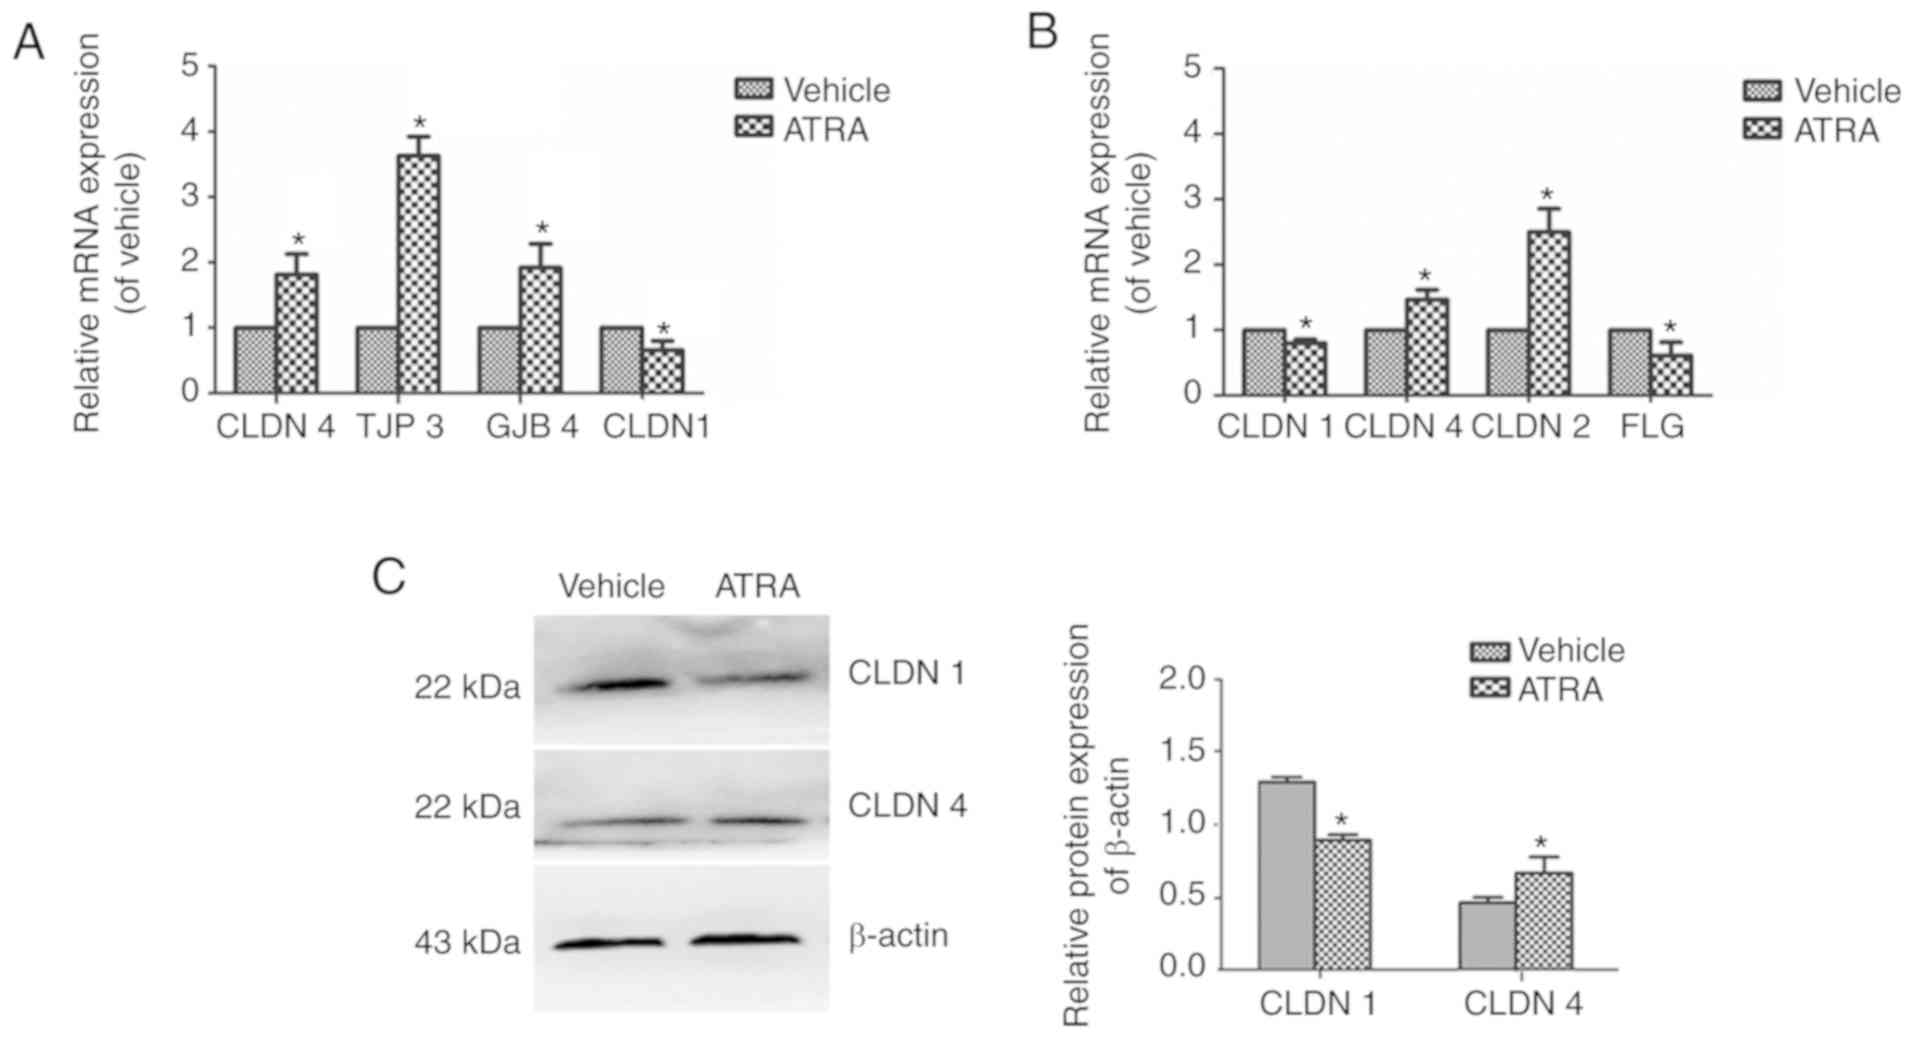 | Figure 5mRNA and protein expression levels of
CLDN1 and CLDN4 in immortalized keratinocyte HaCaT cells treated
with ATRA. HaCaT cells were incubated with or without 1 µM
ATRA for 36 h. (A) In the cells, CLDN-4, TJP3 and JGB4 were
upregulated, while CLDN1 was downregulated. (B) In mice, CLDN1 and
FLG were downregulated, while CLDN4 and CLDN2 were upregulated. (C)
CLDN1 and CLDN4 protein expression levels were determined by
western blotting. β-actin was used as a loading control. Data are
presented as the mean ± standard deviation from three independent
experiments performed in triplicate (n=3). *P<0.05
vs. respective vehicle group. CLDN, Claudin; ATRA, all-trans
retinoic acid; TJP3, tight junction protein 3; GJB4, gap junction
protein β4; FLG, filaggrin. |
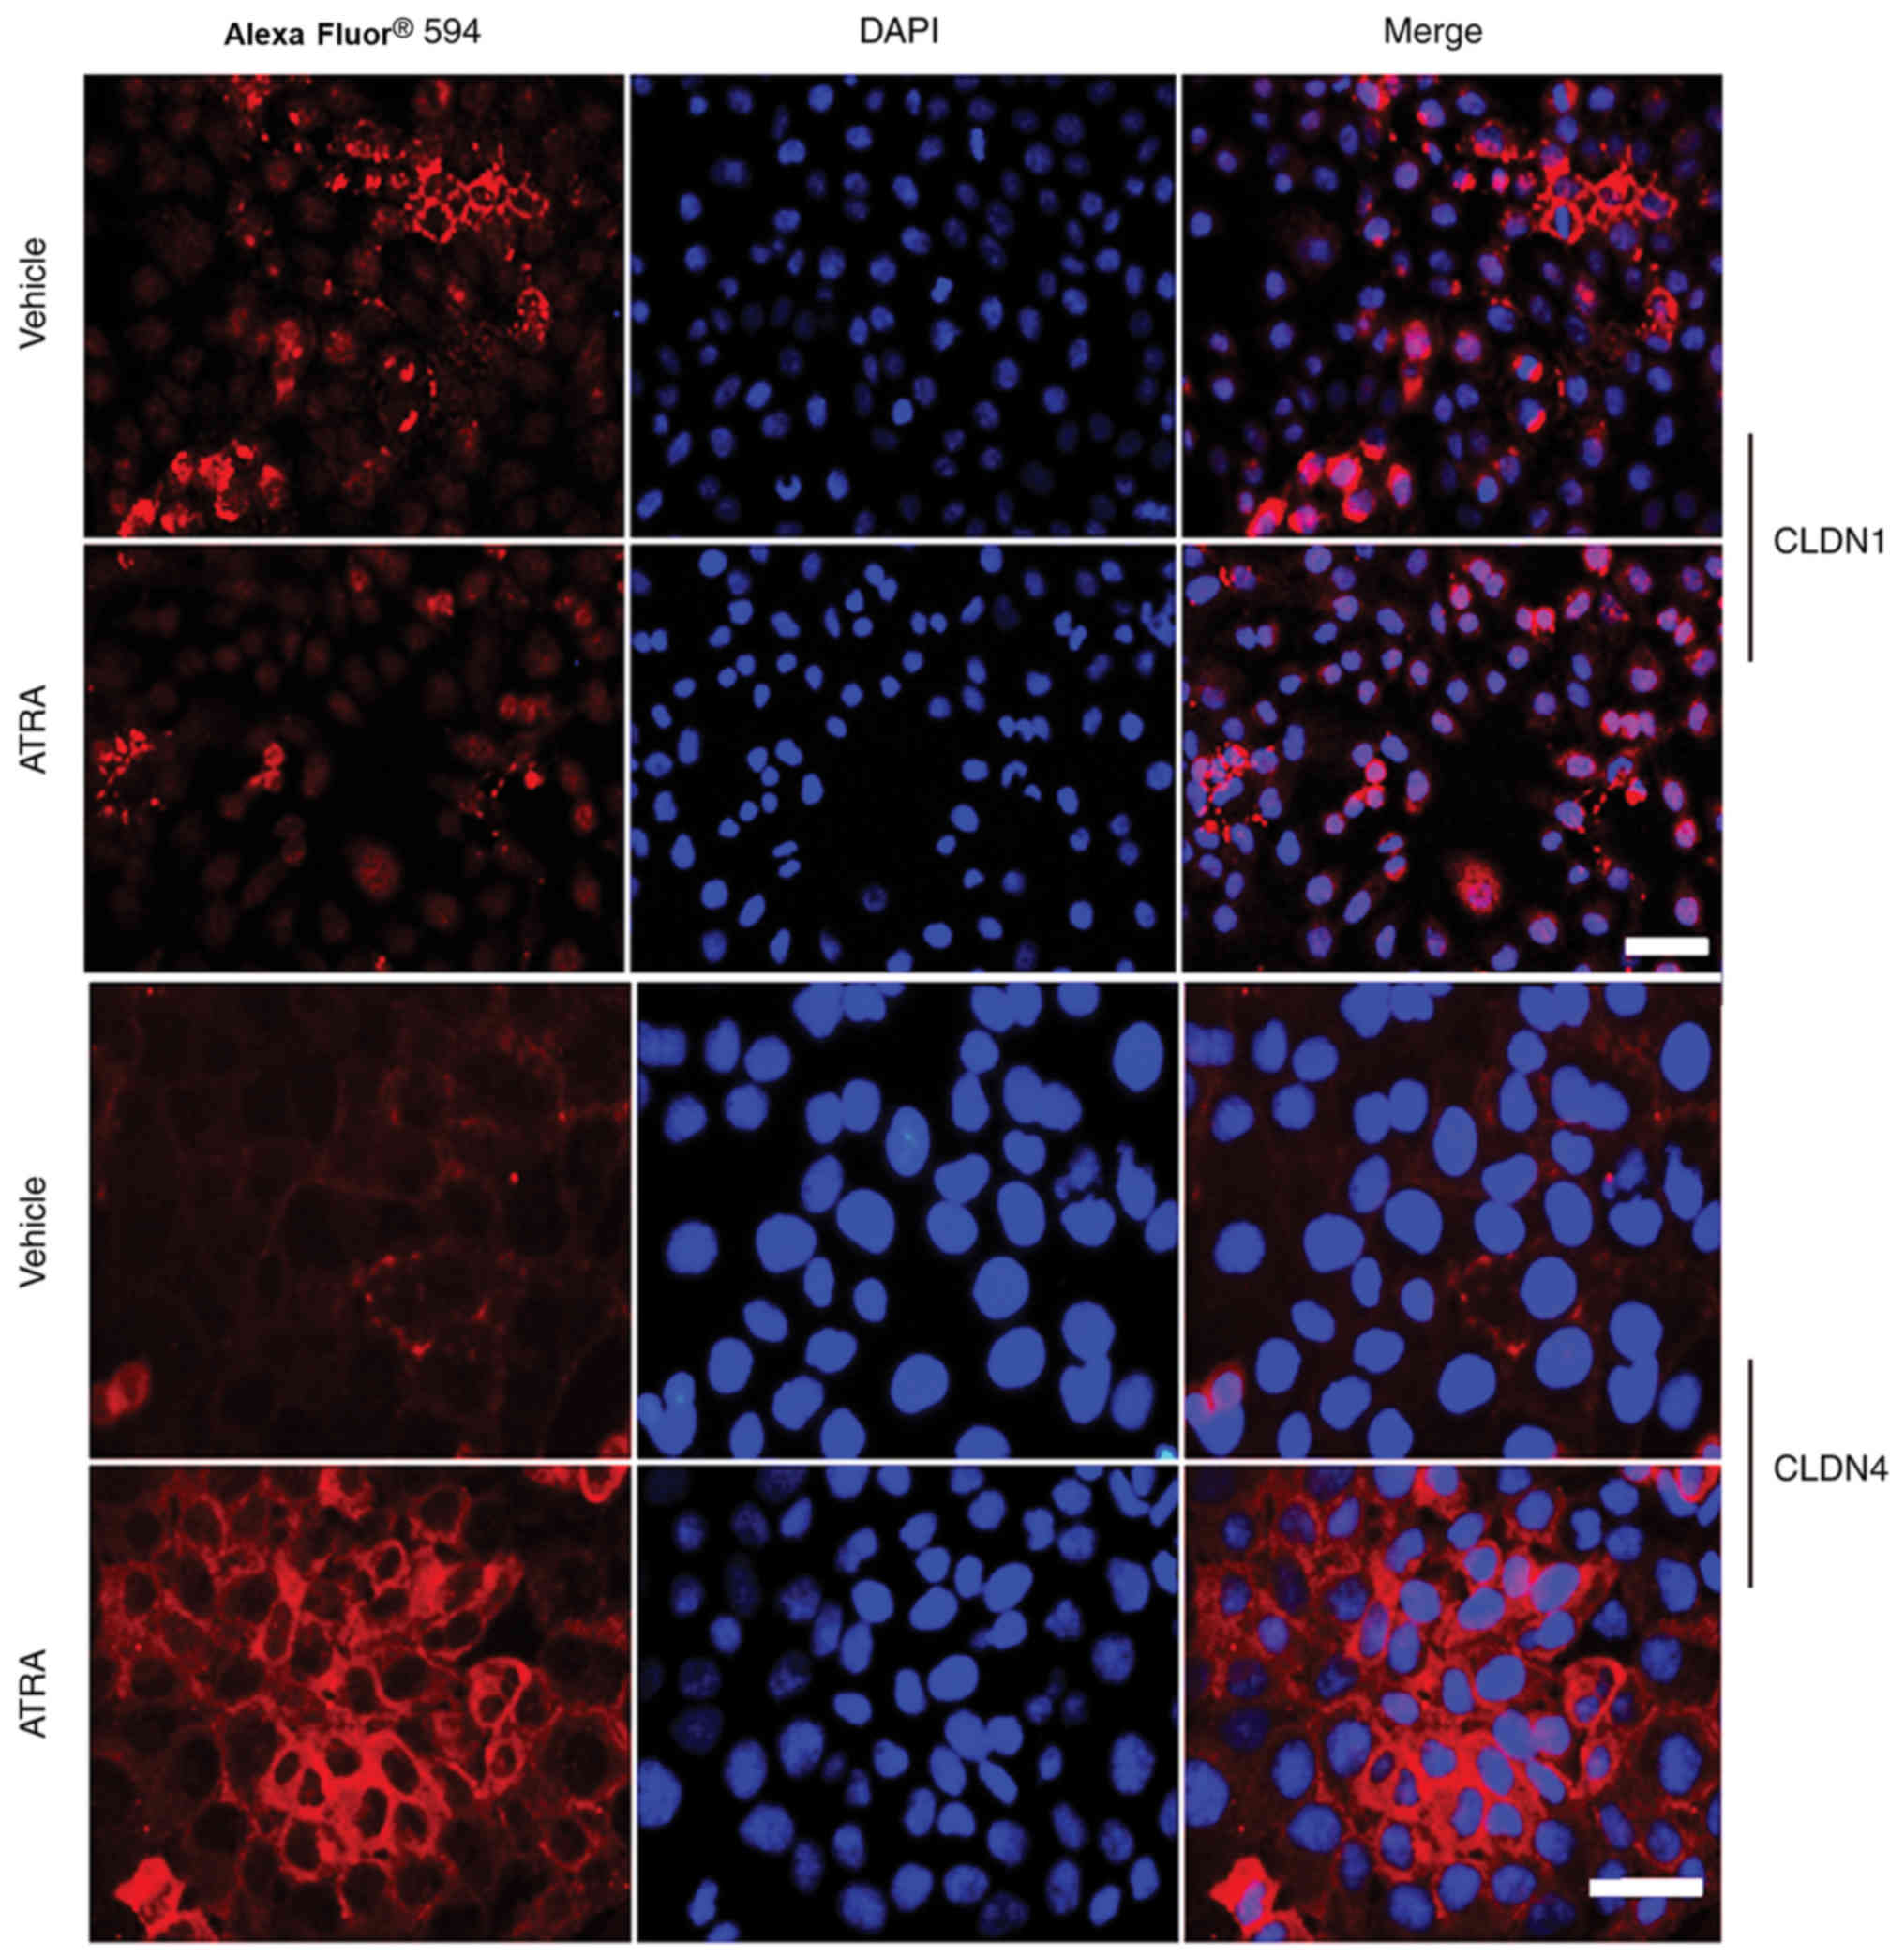
Immunofluorescence revealed that the intensity of
Claudin-1 was not only reduced at the cell-cell contact areas, but
also appeared to be discontinuous along the cell membranes of HaCaT
cells treated with ATRA (Fig. 6).
However, Claudin-4 staining was slightly increased and displayed a
string-like localization pattern (Fig. 6).
ATRA alters the expression and
localization of TJs in mouse epidermis
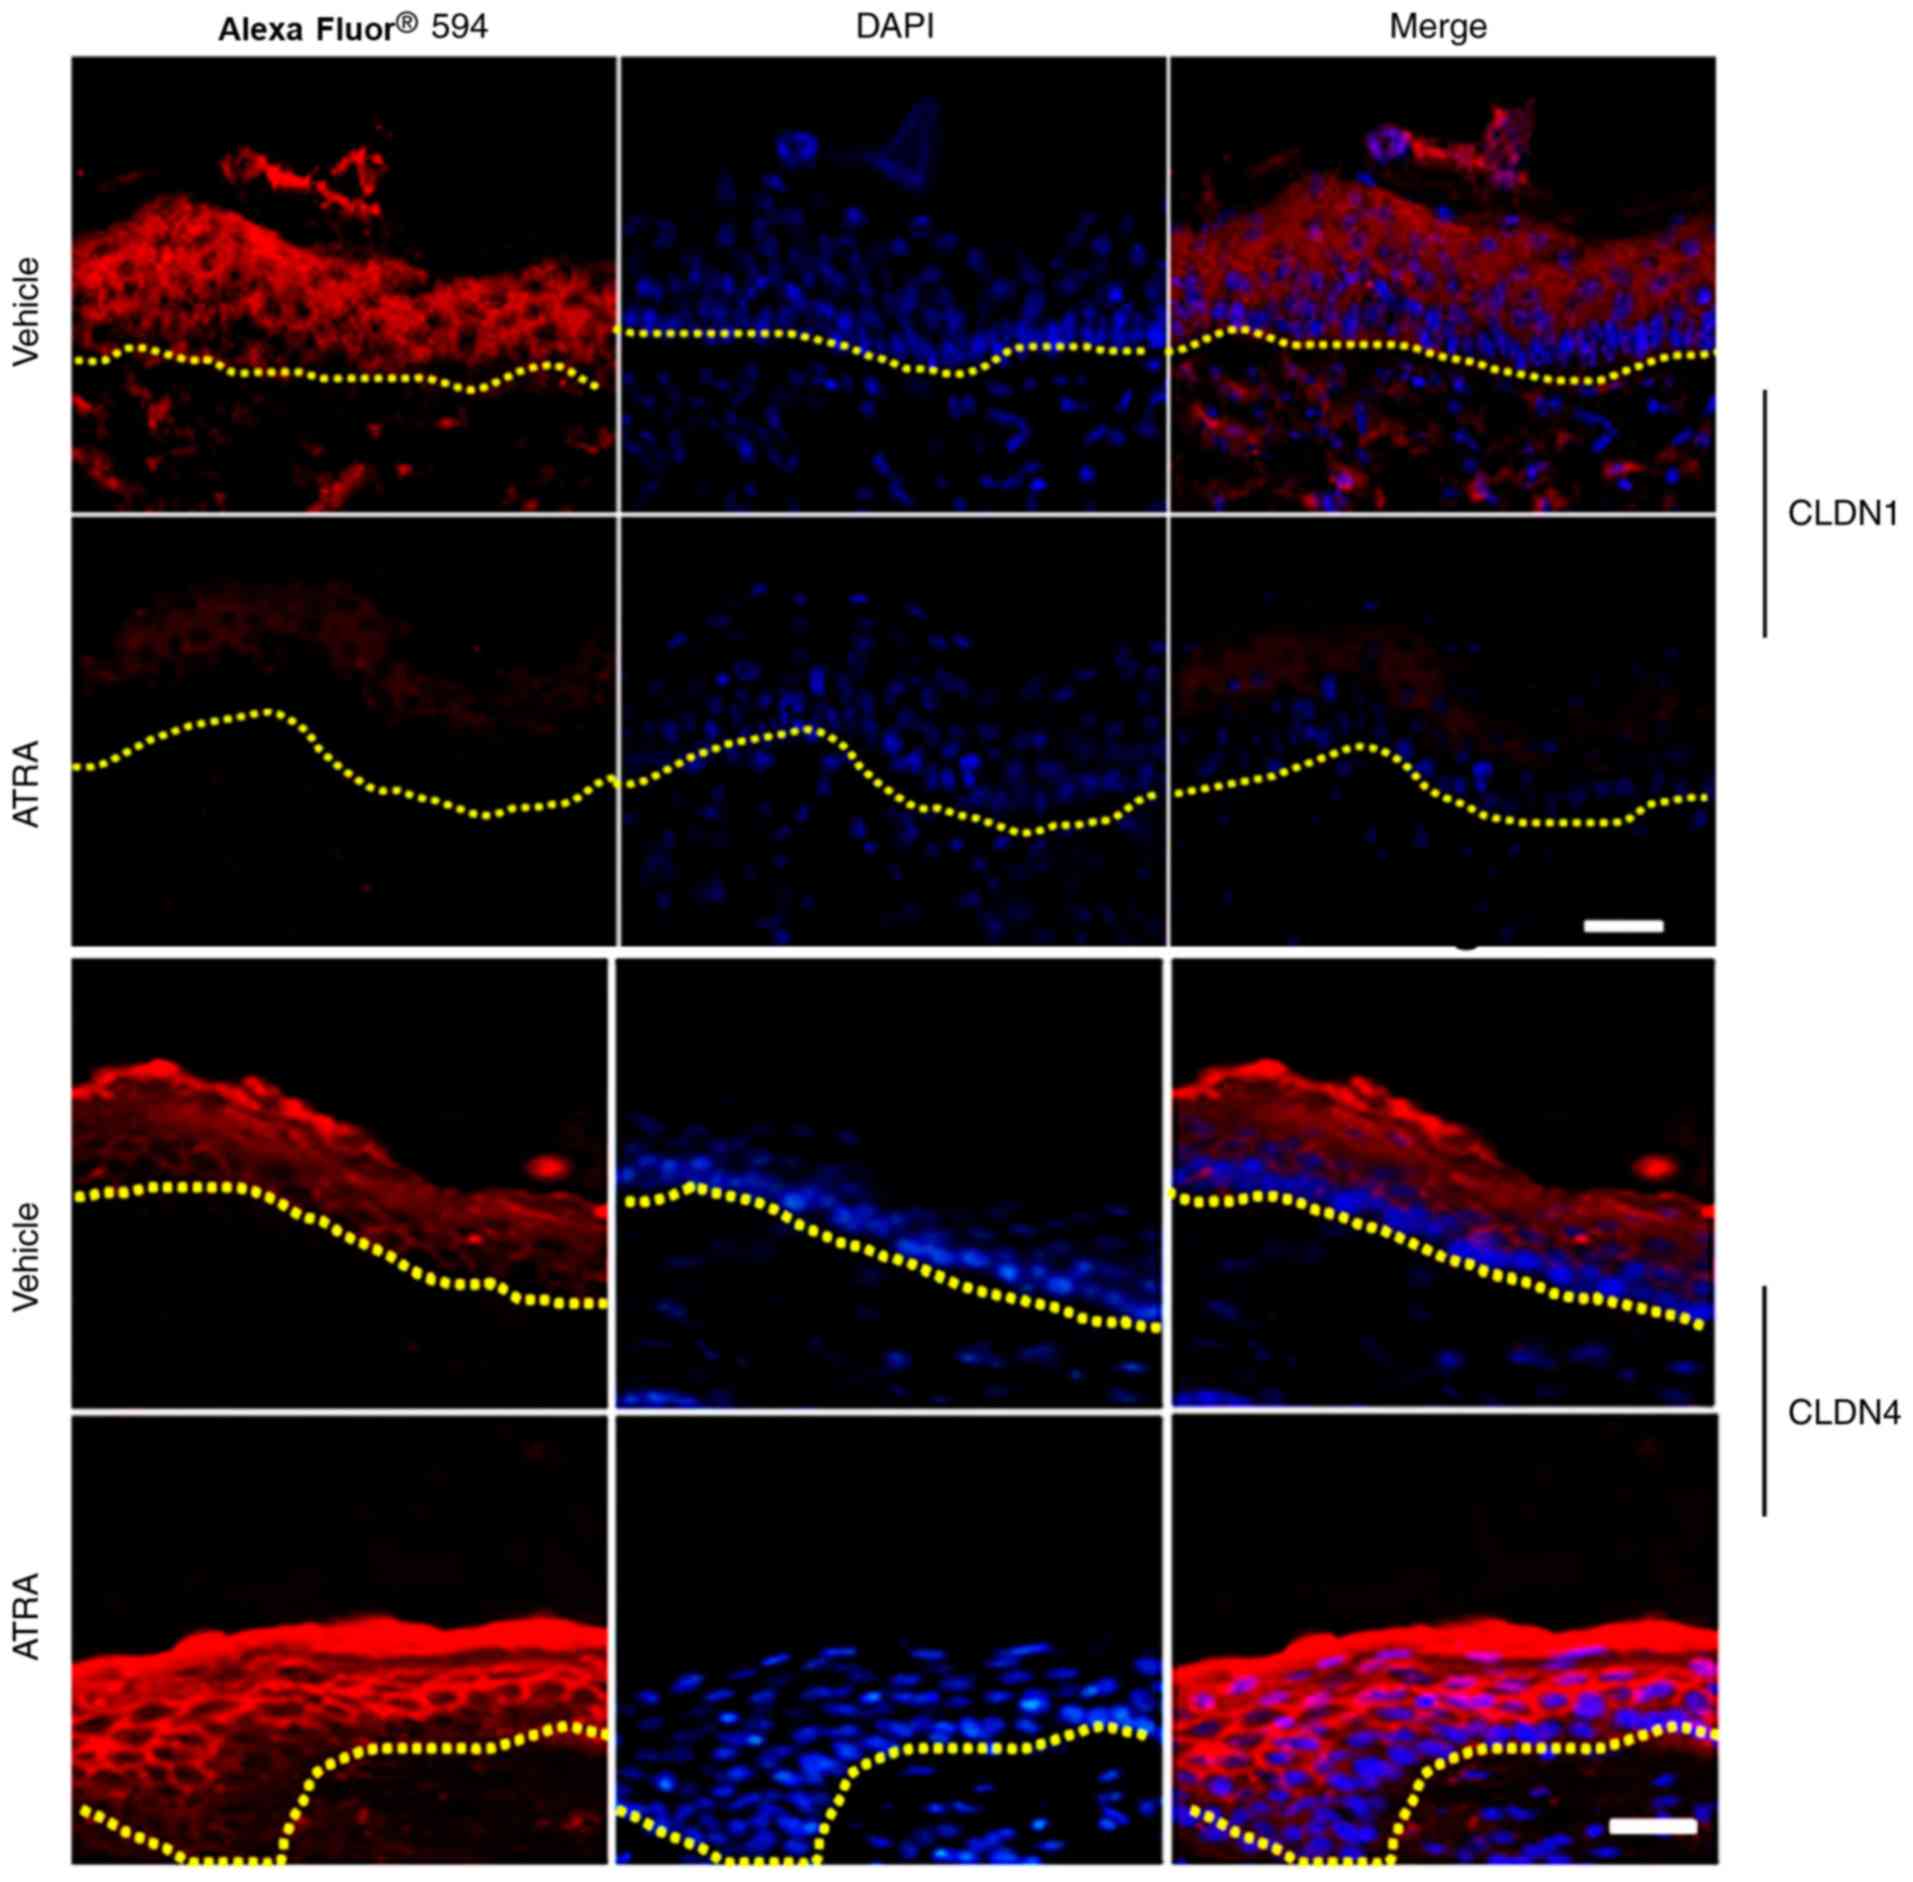
A marked reduction in the staining intensity and
localization of Claudin-1 in the upper epidermal layer of skin
treated with ATRA was discovered compared with control skin (n=3;
Fig. 7). By contrast, Claudin-4
staining was stronger in the ATRA-treated skin compared with
control skin (Fig. 7).
Discussion
In the present study, the ATRA-associated dermatitis
animal model presented erythema, scaling and dryness of the treated
skin, similar to the irritation observed in ATRA-treated human skin
(25,26), indicating that this animal model
is a useful tool to evaluate the effectiveness and side effects of
ATRA. Furthermore, treatment with ATRA altered the normal
morphology and ultrastructure of the mouse epidermis. Microarray
analysis was used, primarily to identify candidates that were later
confirmed via RT-qPCR and/or immunohistochemistry.
In the mouse model of ATRA-stimulated dermatitis,
the epidermis of the mice exhibited obvious scales, while
histopathology revealed parakeratosis of the epidermis, suggesting
that the epidermal differentiation was abnormal, and that the
abnormal differentiation of keratinocytes led to an epidermal
keratinization envelope. In the mouse gene expression profiles, it
was observed that the majority of alterations occurred among EDC
genes, including FLG, SPRR4, SPRR2J,
SPRR2G, LCE3C, LCE3B, LCE1M,
S100A8 and S100A9. The proteins encoded by those
genes, together with LOR, involucrin, trichohyalin and hornerin,
are associated with CE generation via crosslinking of insoluble
membranous proteins (27).
Keratinized proteins act as markers of differentiation in the
epidermis. In the mice and cells, the abnormal expression of
keratins, including KRT15, KRT17 and KRT14,
and keratin-associated proteins, including KRT33A,
KRT33A and KRTAP1-3, was widely observed, further
confirming the abnormal terminal differentiation in the epidermis
following ATRA treatment.
Proteases, together with their inhibitors and
targets, serve an essential role in desquamation (24). In the ATRA-treated mouse epidermis
and HaCaT cells, the upregulation of tissue kallikreins
(KLK6, KLK10, KLK12 and KLK14) and
protease inhibitors (SERPINE 1 and SERPINE 2) was
demonstrated. It is noteworthy that KLK6 and KLK10 were upregulated
in mice and cells following ATRA treatment, which may be closely
associated with the appearance of scales on the mouse skin.
Furthermore, alterations in the balance between proteases and
protease inhibitors in the skin lead to inflammatory reactions,
which causes itching, scaling, redness and other typical clinical
symptoms (28).
Morphologically, the appearance of profilaggrin is
consistent with the formation of keratohyalin granules. The
newly-synthesized profilaggrin accumulates in keratohyalin granules
with high phosphoric acid and histidine following phosphorylation.
The present study demonstrated that the number of keratohyalin
granules decreased significantly following ATRA treatment.
Therefore, it was speculated that decreases in the number of
keratohyalin granules may affect the phosphorylation and
accumulation of newly-synthesized profilaggrin, affecting the
production of FLG. In addition, a number of factors that are
important in controlling FLG expression have been described, such
as transcription factors of the AP1 family (Jun and/or Fos),
POU-domain proteins, transcription factor p63, and the
peroxisome-proliferator-activated-receptor (PPAR) family (29). Aberrant profilaggrin processing
has also been observed in 12R-lipoxygenase (12R-LOX)-deficient mice
(30). In the present study, the
gene chip results revealed that PPAR was upregulated and
ALOX12E was downregulated following ATRA treatment. As
expected, the gene chip analysis and RT-qPCR revealed that the
expression of FLG was downregulated following ATRA treatment
in the mouse skin, as supported by Sybert et al (31), who reported that patients with
ichthyosis vulgaris displayed a reduction or absence of
profilaggrin and FLG along with a morphological reduction in the
amount of keratohyalin. Filaggrin is also involved in the
production of primary natural moisturizing factors in the stratum
corneum (29). Whether these
alterations in expression may affect the expression of FLG and the
specific regulatory mechanism requires further investigation.
Following ATRA treatment, alterations in the
ultrastructure of the epidermis were observed under an electron
microscope. The images revealed that there were numerous circular
vacuolated structures in the stratum corneum, which were similar to
the ultrastructure of lipid droplets. Ponec et al (32) studied the lipid and ultrastructure
of reconstructed skin models by electron microscopy. Their results
indicated that lipid droplets in keratinocytes appeared in all
three skin models, but the extent of the lipid droplets varied. The
structure of the lipid droplets in their images was consistent with
the structure of lipid droplets observed under electron microscopy
in the present study. It was also thought that the different levels
of lipid droplets in keratinocytes were associated with the
hyperproliferative state of reconstructed skin. On the other hand,
the epidermal layers of the mice in the present study were
increased following ATRA treatment, indicating that there was a
degree of proliferation. Therefore, it was speculated that these
structures may be lipid droplets. Nevertheless, this is a
limitation of the present study.
The ATRA-treated mouse skin displayed a large number
of lipid droplets in certain corneocytes [similar in appearance to
the droplets observed by Ponec et al (32)], suggesting that lipid metabolism
was abnormal. Gene expression analysis of skin samples from
ATRA-treated and control skin demonstrated significant induction of
functional proteins associated ceramide, non-esterified fatty acids
and phospholipid synthesis. The present study revealed
down-regulation of SMPD3, SMPD2 and
LASS5/Cers5, which catalyze the synthesis of ceramides,
suggesting decreased ceramide synthesis in ATRA-treated mice.
Conversely, it was observed that ATRA also increased the expression
of UDP-glucose ceramide glucosyltransferase (UGCG). Moreover, Amen
et al (33) reported that
mice with deficiencies in UGCG display an ichthyosis-like skin
phenotype and impairment in the differentiation of keratinocytes,
which is associated with delayed wound healing.
Mao-Qiang et al (34) demonstrated that inhibiting
PLA2 resulted in a defective extracellular lipid membrane
and impaired homeostasis in the permeability barrier (34). In the present study, ATRA not only
downregulated PLA2G2E and other phospholipases including
PLCH2, but also upregulated PLA2G4E, LYPLA and
DEG. Lu et al (35)
demonstrated that the transcription levels of AGPAT-1, -2 and -3
were rapidly increased by ATRA. The present gene expression
analysis of ATRA-treated skin revealed a marked reduction in the
levels of AGPAT4 and AGPAT5.
Previously, lipoxygenases (LOXs) were reported to
exert essential roles in regulating epithelial proliferation and/or
differentiation, maintaining the permeability barrier, skin
inflammation and wound healing (36). In the present study, no marked
alterations in the protein levels of eLOX-3 and
12R-LOX in ATRA-treated skin were detected, but
ATRA-treatment significantly downregulated ALOX12E, which
may have a role in regulating keratinocyte differentiation
(37).
TEM analysis of the mouse skin revealed an increase
in the intercellular space, suggesting that the keratinocytes of
the mice may have had abnormalities in the TJs. TJs function as a
paracellular barrier beneath the stratum corneum (38). In the present study, Claudin-1 was
decreased, but Claudin-4 was increased following ATRA-treatment in
HaCaT cells and the mouse epidermis. Claudin-1-knockout mice
exhibit increased epidermal permeability, severe water loss and
skin wrinkling, and succumb within 24 h after birth (17). Downregulation of Claudin-1 results
in decreased transepithelial electrical resistance (39). In addition, patients with atopic
dermatitis exhibit low levels of Claudin-1 expression (40). Nevertheless, a previous in
vitro study of cultured keratinocytes uncovered barrier defects
resulting from knocking down Claudin-4 (41). The present study revealed that the
expression of Claudin-4 was increased following ATRA treatment in
HaCaT cells and the mouse epidermis, as previously observed in the
oral mucosa (14). Nevertheless,
significant upregulation of Claudin-4 was observed in the
non-lesional skin of patients with atopic dermatitis, which may
indicate a compensatory response to disrupted barrier function
caused by Claudin-1 downregulation that leads to the upregulation
of other Claudins (18,42). Therefore, downregulated Claudin-1
and the alteration of its localization in HaCaT cells and the mouse
epidermis was likely responsible, at least in part, for the
observed disruption of TJ barrier function following ATRA
treatment.
It was observed that Claudin-2 mRNA was upregulated
2.5-fold. Telgenhoff et al (43) studied the regulation of Claudin-2
mRNA and protein expression by ATRA in human keratinocytes, and
discovered that ATRA increases the expression of Claudin-2 in
keratinocytes in a dose-dependent manner. In addition, Claudin-2 is
highly expressed in the TJs of mouse renal proximal tubules, which
possess a leaky epithelium whose unique permeability properties
underlie their high rate of NaCl reabsorption (43,44). On the other hand, the Cldn2-KO
mice display a normal appearance, activity, growth and behavior,
with no abnormalities in the epidermal barrier (44); therefore, it was not included in
the present study as a candidate gene due to funding limitations,
but it may be considered in future studies.
Notably, certain differences were observed between
the in vivo and the in vitro experiments. The
possible causes include the following: i) HaCaT cells are
human-derived immortalized keratin-forming cells, while the skin
tissues were derived from mice, thus the two are different in
species; ii) cells growing in vitro and in vivo are
not completely analogous; and iii) the doses of ATRA in vivo
and in vitro were different. In addition, the present study
is limited since it focused primarily on Claudin-1 and -4, and
additional studies are required to assess the exact contribution to
ATRA-induced dermatitis of all the identified differentially
expressed genes. The microarray experiment would ideally have been
performed in multiple samples, but research funding was very
limited; thus, there was only one sample per group, which is a
limitation. Nevertheless, the microarray experiment only provides
an idea of the potential genes that may be examined in future
studies. Subsequent experiments in vivo and in vitro
will be performed to confirm the results.
In conclusion, the results suggest that ATRA
disrupts the normal morphology and ultrastructure of the mouse
epidermis and exerts an essential role in the function of the
epidermal barrier. Gene expression analyses revealed numerous
dysregulated genes associated with the synthesis/generation of
transcription factors, protease inhibitors, proteases, junctional
proteins, lipids, corneocytes and cornified envelopes. ATRA not
only alters the expression of Claudin-1 and -4, but also alters
their localization in HaCaT cells and the murine epidermis. ATRA
exerts a dual effect on epidermal barrier genes: It downregulates
the expression of Claudin-1 and upregulates the expression of
Claudin-4. Claudin-4 upregulation may be a compensatory response
for the disrupted barrier function caused by Claudin-1
downregulation.
Funding
The present study was supported by the National
Natural Science Foundation of China (grant no. 81171490) and the
Fundamental Research Funds for the Central Universities (grant no.
PY3A0241001016).
Availability of data and materials
The datasets generated and/or analyzed during the
current study are available in the GEO repository (GSE124183):
https://www.ncbi.nlm.nih.gov/geo/query/acc.cgi?acc=GSE124183.
Authors’ contributions
SG and JL designed the experiments. JL conducted the
experiments, performed the statistical analysis and drafted the
manuscript. QL performed the statistical analysis. All authors read
and approved the final manuscript.
Ethics approval and consent to
participate
All experimental procedures were performed in
accordance with the ‘Principles of Laboratory Animal Care’
(National Institutes of Health) and the guidelines of the
laboratory animal care committee of Xi’an Jiaotong University (no.
XJTULAC2017-733).
Patient consent for publication
Not applicable.
Competing interests
All authors declare that they have no competing
interests.
Acknowledgments
Not applicable.
Abbreviations:
|
ATRA
|
all-trans retinoic acid
|
|
TEM
|
transmission electron microscopy
|
|
TJs
|
tight junctions
|
|
GO
|
Gene Ontology
|
|
DMSO
|
dimethyl sulfoxide
|
|
EDC
|
epidermal differentiation complex
|
|
SPRRs
|
small proline-rich region proteins
|
|
FLG
|
filaggrin
|
|
LOR
|
loricrin
|
References
|
1
|
Ahuja HS, Szanto A, Nagy L and Davies PJ:
The retinoid X receptor and its ligands: Versatile regulators of
metabolic function, cell differentiation and cell death. J Biol
Regul Homeost Agents. 17:29–45. 2003.PubMed/NCBI
|
|
2
|
Wilson L, Gale E and Maden M: The role of
retinoic acid in the morphogenesis of the neural tube. J Anat.
203:357–368. 2003. View Article : Google Scholar : PubMed/NCBI
|
|
3
|
Thielitz A and Gollnick H: Topical
retinoids in acne vulgaris: Update on efficacy and safety. Am J
Clin Dermatol. 9:369–381. 2008. View Article : Google Scholar : PubMed/NCBI
|
|
4
|
Torma H, Bergström A, Ghiasifarahani G and
Berne B: The effect of two endogenous retinoids on the mRNA
expression profile in human primary keratinocytes, focusing on
genes causing autosomal recessive congenital ichthyosis. Arch
Dermatol Res. 306:739–747. 2014. View Article : Google Scholar : PubMed/NCBI
|
|
5
|
Zhang ML, Tao Y, Zhou WQ, Ma PC, Cao YP,
He CD, Wei J and Li LJ: All-trans retinoic acid induces cell-cycle
arrest in human cutaneous squamous carcinoma cells by inhibiting
the mitogen-activated protein kinase-activated protein 1 pathway.
Clin Exp Dermatol. 39:354–360. 2014. View Article : Google Scholar : PubMed/NCBI
|
|
6
|
Ale SI, Laugier JP and Maibach HI:
Differential irritant skin responses to tandem application of
topical retinoic acid and sodium lauryl sulphate: Ii. Effect of
time between first and second exposure. Br J Dermatol. 137:226–233.
1997. View Article : Google Scholar : PubMed/NCBI
|
|
7
|
Kirschner N, Houdek P, Fromm M, Moll I and
Brandner JM: Tight junctions form a barrier in human epidermis. Eur
J Cell Biol. 89:839–842. 2010. View Article : Google Scholar : PubMed/NCBI
|
|
8
|
Brandner JM: Importance of tight junctions
in relation to skin barrier function. Curr Probl Dermatol.
49:27–37. 2016. View Article : Google Scholar : PubMed/NCBI
|
|
9
|
Furuse M, Sasaki H, Fujimoto K and Tsukita
S: A single gene product, claudin-1 or -2, reconstitutes tight
junction strands and recruits occludin in fibroblasts. J Cell Biol.
143:391–401. 1998. View Article : Google Scholar : PubMed/NCBI
|
|
10
|
Furuse M and Tsukita S: Claudins in
occluding junctions of humans and flies. Trends Cell Biol.
16:181–188. 2006. View Article : Google Scholar : PubMed/NCBI
|
|
11
|
Turksen K and Troy TC: Permeability
barrier dysfunction in transgenic mice overexpressing claudin 6.
Development. 129:1775–1784. 2002.PubMed/NCBI
|
|
12
|
Troy TC, Rahbar R, Arabzadeh A, Cheung RM
and Turksen K: Delayed epidermal permeability barrier formation and
hair follicle aberrations in inv-cldn6 mice. Mech Dev. 122:805–819.
2005. View Article : Google Scholar : PubMed/NCBI
|
|
13
|
Sugawara T, Iwamoto N, Akashi M, Kojima T,
Hisatsune J, Sugai M and Furuse M: Tight junction dysfunction in
the stratum granulosum leads to aberrant stratum corneum barrier
function in claudin-1-deficient mice. J Dermatol Sci. 70:12–18.
2013. View Article : Google Scholar : PubMed/NCBI
|
|
14
|
Hatakeyama S, Ishida K and Takeda Y:
Changes in cell characteristics due to retinoic acid; specifically,
a decrease in the expression of claudin-1 and increase in claudin-4
within tight junctions in stratified oral keratinocytes. J
Periodontal Res. 45:207–215. 2010. View Article : Google Scholar
|
|
15
|
Anderson JM and Van Itallie CM: Physiology
and function of the tight junction. Cold Spring Harb Perspect Biol.
1:a0025842009. View Article : Google Scholar :
|
|
16
|
Furuse M: Knockout animals and natural
mutations as experimental and diagnostic tool for studying tight
junction functions in vivo. Biochim Biophys Acta. 1788:813–819.
2009. View Article : Google Scholar
|
|
17
|
Furuse M, Hata M, Furuse K, Yoshida Y,
Haratake A, Sugitani Y, Noda T, Kubo A and Tsukita S: Claudin-based
tight junctions are crucial for the mammalian epidermal barrier: A
lesson from claudin-1-deficient mice. J Cell Biol. 156:1099–1111.
2002. View Article : Google Scholar : PubMed/NCBI
|
|
18
|
Gruber R, Börnchen C, Rose K, Daubmann A,
Volksdorf T, Wladykowski E, Vidal-Y-Sy S, Peters EM, Danso M,
Bouwstra JA, et al: Diverse regulation of claudin-1 and claudin-4
in atopic dermatitis. Am J Pathol. 185:2777–2789. 2015. View Article : Google Scholar : PubMed/NCBI
|
|
19
|
Tokumasu R, Yamaga K, Yamazaki Y, Murota
H, Suzuki K, Tamura A, Bando K, Furuta Y, Katayama I and Tsukita S:
Dose-dependent role of claudin-1 in vivo in orchestrating features
of atopic dermatitis. Proc Natl Acad Sci USA. 113:E4061–E4068.
2016. View Article : Google Scholar : PubMed/NCBI
|
|
20
|
Tokumasu R, Tamura A and Tsukita S: Time-
and dose-dependent claudin contribution to biological functions:
Lessons from claudin-1 in skin. Tissue Barriers. 5:e13361942017.
View Article : Google Scholar : PubMed/NCBI
|
|
21
|
Bożek A and Reich A: The reliability of
three psoriasis assessment tools: Psoriasis area and severity
index, body surface area and physician global assessment. Adv Clin
Exp Med. 26:851–856. 2017. View Article : Google Scholar
|
|
22
|
Fisher G, Esmann J, Griffiths CE, Talwar
HS, Duell EA, Hammerberg C, Elder JT, Finkel LJ, Karabin GD,
Nickoloff BJ, et al: Cellular, immunologic and biochemical
characterization of topical retinoic acid-treated human skin. J
Invest Dermatol. 96:699–707. 1991. View Article : Google Scholar : PubMed/NCBI
|
|
23
|
Livak KJ and Schmittgen TD: Analysis of
relative gene expression data using real-time quantitative PCR and
the 2(−Delta Delta C(T)) method. Methods. 25:402–408. 2001.
View Article : Google Scholar
|
|
24
|
Ovaere P, Lippens S, Vandenabeele P and
Declercq W: The emerging roles of serine protease cascades in the
epidermis. Trends Biochem Sci. 34:453–463. 2009. View Article : Google Scholar : PubMed/NCBI
|
|
25
|
Phillips TJ: An update on the safety and
efficacy of topical retinoids. Cutis. 75:14–22. 24discussion 22–23.
2005.PubMed/NCBI
|
|
26
|
Weiss JS, Shavin JS, Nighland M and
Grossman R: Tretinoin microsphere gel 0.1% for photodamaged facial
skin: A placebo-controlled trial. Cutis. 78:426–432. 2006.
|
|
27
|
Marshall D, Hardman MJ, Nield KM and Byrne
C: Differentially expressed late constituents of the epidermal
cornified envelope. Proc Natl Acad Sci USA. 98:13031–13036. 2001.
View Article : Google Scholar : PubMed/NCBI
|
|
28
|
Meyer-Hoffert U: Reddish, scaly, and
itchy: How proteases and their inhibitors contribute to
inflammatory skin diseases. Arch Immunol Ther Exp (Warsz).
57:345–354. 2009. View Article : Google Scholar
|
|
29
|
Sandilands A, Sutherland C, Irvine AD and
McLean WH: Filaggrin in the frontline: Role in skin barrier
function and disease. J Cell Sci. 122:1285–1294. 2009. View Article : Google Scholar : PubMed/NCBI
|
|
30
|
Epp N, Fürstenberger G, Muller K, de
Juanes S, Leitges M, Hausser I, Thieme F, Liebisch G, Schmitz G and
Krieg P: 12r-lipoxygenase deficiency disrupts epidermal barrier
function. J Cell Biol. 177:173–182. 2007. View Article : Google Scholar : PubMed/NCBI
|
|
31
|
Sybert VP, Dale BA and Holbrook KA:
Ichthyosis vulgaris: Identification of a defect in synthesis of
filaggrin correlated with an absence of keratohyaline granules. J
Invest Dermatol. 84:191–194. 1985. View Article : Google Scholar : PubMed/NCBI
|
|
32
|
Ponec M, Boelsma E, Weerheim A, Mulder A,
Bouwstra J and Mommaas M: Lipid and ultrastructural
characterization of reconstructed skin models. Int J Pharm.
203:211–225. 2000. View Article : Google Scholar : PubMed/NCBI
|
|
33
|
Amen N, Mathow D, Rabionet M, Sandhoff R,
Langbein L, Gretz N, Jäckel C, Grone HJ and Jennemann R:
Differentiation of epidermal keratinocytes is dependent on
glucosylceramide: Ceramide processing. Hum Mol Genet. 22:4164–4179.
2013. View Article : Google Scholar : PubMed/NCBI
|
|
34
|
Mao-Qiang M, Jain M, Feingold KR and Elias
PM: Secretory phospholipase A2 activity is required for
permeability barrier homeostasis. J Invest Dermatol. 106:57–63.
1996. View Article : Google Scholar : PubMed/NCBI
|
|
35
|
Lu B, Jiang YJ, Man MQ, Brown B, Elias PM
and Feingold KR: Expression and regulation of 1-acyl-sn-glycerol-
3-phosphate acyltransferases in the epidermis. J Lipid Res.
46:2448–2457. 2005. View Article : Google Scholar : PubMed/NCBI
|
|
36
|
Krieg P and Fürstenberger G: The role of
lipoxygenases in epidermis. Biochim Biophys Acta. 1841.390–400.
2014.
|
|
37
|
Feingold KR: Thematic review series: Skin
lipids. The role of epidermal lipids in cutaneous permeability
barrier homeostasis. J Lipid Res. 48:2531–2546. 2007. View Article : Google Scholar : PubMed/NCBI
|
|
38
|
Yuki T, Haratake A, Koishikawa H, Morita
K, Miyachi Y and Inoue S: Tight junction proteins in keratinocytes:
Localization and contribution to barrier function. Exp Dermatol.
16:324–330. 2007. View Article : Google Scholar : PubMed/NCBI
|
|
39
|
Yamamoto T, Saeki Y, Kurasawa M, Kuroda S,
Arase S and Sasaki H: Effect of RNA interference of tight
junction-related molecules on intercellular barrier function in
cultured human keratinocytes. Arch Dermatol Res. 300:517–524. 2008.
View Article : Google Scholar : PubMed/NCBI
|
|
40
|
De Benedetto A, Rafaels NM, McGirt LY,
Ivanov AI, Georas SN, Cheadle C, Berger AE, Zhang K, Vidyasagar S,
Yoshida T, et al: Tight junction defects in patients with atopic
dermatitis. J Allergy Clin Immunol. 127:773–786. e1–7. 2011.
View Article : Google Scholar
|
|
41
|
Kirschner N, Rosenthal R, Furuse M, Moll
I, Fromm M and Brandner JM: Contribution of tight junction proteins
to ion, macromolecule, and water barrier in keratinocytes. J Invest
Dermatol. 133:1161–1169. 2013. View Article : Google Scholar : PubMed/NCBI
|
|
42
|
Kubo T, Sugimoto K, Kojima T, Sawada N,
Sato N and Ichimiya S: Tight junction protein claudin-4 is
modulated via Δnp63 in human keratinocytes. Biochem Biophys Res
Commun. 455:205–211. 2014. View Article : Google Scholar : PubMed/NCBI
|
|
43
|
Telgenhoff D, Ramsay S, Hilz S,
Slusarewicz P and Shroot B: Claudin 2 mRNA and protein are present
in human keratinocytes and may be regulated by all-trans-retinoic
acid. Skin Pharmacol Physiol. 21:211–217. 2008. View Article : Google Scholar : PubMed/NCBI
|
|
44
|
Muto S, Hata M, Taniguchi J, Tsuruoka S,
Moriwaki K, Saitou M, Furuse K, Sasaki H, Fujimura A, Imai M, et
al: Claudin-2-deficient mice are defective in the leaky and
cation-selective paracellular permeability properties of renal
proximal tubules. Proc Natl Acad Sci USA. 107:8011–8016. 2010.
View Article : Google Scholar : PubMed/NCBI
|