Introduction
Cerebral ischemia-reperfusion injury (CIRI) is a
complex pathophysiological process that occurs early in the
restoration of blood supply following ischemia, and peaks at ~24 h
after reperfusion (1,2). There are several factors that serve
important roles in the pathogenesis of CIRI, including free radical
formation, inflammatory cells infiltration, mitochondrial
dysfunction and blood-brain-barrier disruption (3). These pathological events crucially
rely on alterations in the transcription of various genes induced
by ischemia and reperfusion. Numerous dysregulated genes associated
with apoptosis, inflammation and metabolism were identified in a
variety of ischemic stroke experimental models by high-throughput
microarray or RNA-sequencing approaches (4,5);
however, the underlying regulatory mechanism of gene dysregulation
associated with CIRI requires further investigation.
Studies have reported that the activation of
transcription factors (TFs) induced by different cellular signal
transduction pathways after ischemia serves a pivotal role in
controlling gene expression and is closely associated with ischemic
injury and neuronal survival (6,7).
Therefore, modulating the activity of CIRI-associated TFs, for
example, via the recently reported RP105-phosphatidylinositol
3-kinase (PI3K)/protein kinase B (Akt) pathway (8), may be an effective strategy to
disrupt CIRI. Studies have revealed that several TFs associated
with neuronal injury are transcriptionally upregulated after focal
ischemia, including interferon regulatory factor-1, nuclear
factor-κB (NF-κB), early growth response-1 (Egr1), CCAAT enhancer
binding protein-β (CEBPβ), signal transduction and activator of
transcription 3 (STAT3), and activating transcription factor-2
(9-13). However, additional TFs activities
are thought to be regulated mainly by protein post-translational
modifications, such as phosphorylation, which may not be
investigated in traditional microarray expression analysis or
experimental studies.
Considering that TFs regulate transcription by
binding to specific regulatory elements upstream of the target
genes, large-scale profiling of consensus TF binding sites (TFBS)
from microarray expression data during ischemic brain injury can be
another feasible option to comprehensively investigate the roles of
TFs in cerebral ischemia. Several computational strategies were
developed to predict TFs associated with cerebral ischemia, by
detecting over-represented TFBS in the promoter regions of
differentially expressed genes from microarray expression data
(14-16). Although, to the best of our
knowledge, few studies have focused on the TFs and their associated
functions involved in CIRI after reperfusion via various
pathways.
In the present study, we performed gene set
enrichment analysis (GSEA) to determine the key TFs and their
regulatory mechanisms of the biological pathways associated with
CIRI. GSEA utilizes the whole-distribution testing model to
identify the pre-defined TF-targeted gene-sets that are
statistically enriched in CIRI group samples (17). In addition, the candidate TFs were
re-calculated with Gene Ontology (GO) and Kyoto Encyclopedia of
Genes and Genomes (KEGG) categories associated with CIRI, using the
'Post-Analysis' feature of the EnrichmentMap software (18). Our findings could provide
important insight into the various transcriptional mechanisms
associated with CIRI during ischemic stroke.
Materials and methods
Microarray data
Microarray assays were performed based on a previous
transcriptional study of mouse ischemic tolerance in transient
middle cerebral artery occlusion (tMCAO) stroke model, which
included 224 samples with 6 experimental conditions (19,20). In the present study, we
investigated CIRI in mice suffering 45-min tMCAO or sham surgical
procedure at 3 and 24 h after reperfusion (n=4/treatment/time),
respectively (Table I). The
original CEL files of the 45-min tMCAO group (n=8, I3 and I24
groups) and relevant sham surgery group (n=8, S3 and S24 groups)
were downloaded from the National Center of Biotechnology
Information Gene Expression Omnibus (https://www.ncbi.nlm.nih.gov/geo/) via the accession
number GSE32529, which was based on the platform of the GPL1261
[Mouse430_2] Affymetrix Mouse Genome 430 2.0 Array (Thermo Fisher
Scientific, Inc.). Experimental analysis confirmed infarcts in
tMCAO mice at 3 or 24 h after reperfusion, but not in sham-operated
mice (19). It should be noted
that we performed a bioinformatics study based on the public
microarray data, and no mice were used for experimental analysis in
the present study.
 | Table IDescription of the tMCAO experimental
groups. |
Table I
Description of the tMCAO experimental
groups.
| Group | Sample no. | Treatment | Time point (h) |
|---|
| S3 | GSM805706 | Sham | 3 |
| S3 | GSM805707 | Sham | 3 |
| S3 | GSM805708 | Sham | 3 |
| S3 | GSM805709 | Sham | 3 |
| I3 | GSM805730 | tMCAO | 3 |
| I3 | GSM805731 | tMCAO | 3 |
| I3 | GSM805732 | tMCAO | 3 |
| I3 | GSM805733 | tMCAO | 3 |
| S24 | GSM805714 | Sham | 24 |
| S24 | GSM805715 | Sham | 24 |
| S24 | GSM805716 | Sham | 24 |
| S24 | GSM805717 | Sham | 24 |
| I24 | GSM805741 | tMCAO | 24 |
| I24 | GSM805742 | tMCAO | 24 |
| I24 | GSM805743 | tMCAO | 24 |
| I24 | GSM805744 | tMCAO | 24 |
Data quality control and
preprocessing
Data quality control and preprocessing were
performed by the software packages of Bioconductor (v3.7,
https://www.bioconductor.org/) based on
the R statistical programming language (v3.5.0). Data quality was
evaluated by RNA degradation plots using AffyRNAdeg
algorithm in the affy package (v1.60.0) (21). The dataset showing a high slope of
probe intensities from the 5′ to 3′ end, which serves as the
quantitative indicator of the RNA degradation, was removed from our
analysis prior to data preprocessing (Fig. S1A). For data preprocessing, we
used the GC Robust Multi-array Average (gcRMA) algorithm in gcrma
package (v2.54.0) to normalize raw expression data and generate the
normalized gene expression intensity of the two data-sets with
logarithmic transformation. Following normalization, the
distributions of the normalized probe set intensities were
evaluated by density histograms and boxplot (Fig. S1B and C). In the final step, the
probe ID in normalized expression data was annotated to gene symbol
based on the mouse4302cdf package (v2.18.0), and the data were
exported to a formed text file ready for GSEA.
GSEA and leading-edge analysis
The gene set enrichment analysis and leading-edge
analysis were performed using GSEA desktop application version 3.0
(Broad Institute), which employs predefined gene sets from the Gene
Set Knowledgebase database (http://ge-lab.org/#/data). In the present study, GSEA
was performed using the collected gene-sets of TF target genes
(mm_TF), GO (mm_GO) and metabolic pathways (mm_metabolic), with the
following parameters: 1,000 gene set permutations, weighted
enrichment statistics, gene set size between 15-500, and
signal-to-noise metrics for ranking genes. Regulated gene-sets were
considered statistically significant if false discovery rate
(FDR)≤0.1 and nominal P≤0.01. The GSEA-derived normalized
enrichment score was used to determine the magnitude of up- or
down-regulation of enriched gene-sets. Leading-edge analysis was
performed after each GSEA to determine the core genes that have the
highest impact on the biological process of a given gene-set.
For each database of gene sets, GSEA was
respectively performed across two expression datasets: i) S3I3
dataset, which contains the expression data from the sham and tMCAO
groups 3 h after reperfusion; ii) S24I24 dataset, which contains
the expression data from the sham and tMCAO groups 24 h after
reperfusion; and iii) I3I24 dataset, which contains the expression
data from the tMCAO groups of 3 and 24 h after reperfusion.
Functional enrichment visualization and
annotation
The GSEA results were visualized using EnrichmentMap
(v3.1) plugin based on Cytoscape Desktop program (v3.6.1,
https://cytoscape.org/) (18). The enrichment results were mapped
as a network of gene-sets (nodes) where the nodes represent
statistically significant terms and the links (edges) represent the
degree of gene-set similarity; combined Jaccard (50%) and Overlap
(50%) metrics with the default cutoff of 0.375 were employed. For
gene-sets annotation, the enriched gene-sets were grouped by
AutoAnnotate software (v1.2, http://apps.cytoscape.org/apps/autoannotate) according
to the Markov cluster (MCL) algorithm based on the edge weights of
similarity coefficients and were automatically annotated using the
WordCloud algorithm with the maximum of four words per label
(22).
KEGG (https://www.genome.jp/kegg/) pathway enrichment
analysis was performed using clusterProfiler package (v3.8.1)
(23) and visualized via the
ggplot2 package (v3.0.0) in R (24). The significant KEGG categories
were identified with BH adjusted P<0.01 and FDR q<0.05.
Signature gene-sets post-analysis
Using the 'Post-Analysis' feature of the
EnrichmentMap software, we constructed the transcriptional
regulatory network associated with CIRI. The CIRI-related signature
gene-sets were primarily defined as the gene-sets specifically
enriched in the I24 group by Venn analysis (http://bioinformatics.psb.ugent.be/webtools/Venn/) of
the GSEA results between S3I3 and S24I24 datasets. The gmt file of
I24-specific TFs signature gene-sets (mm_I24_TF) was created from
the mm_TF gene-set database using custom written R code. The
transcriptional regulatory network was constructed based on the
GSEA results of the GO or metabolic pathway network in
EnrichmentMap, followed by post-analysis with CIRI-associated TFs
signature gene-sets (mm_I24_TF), respectively. The edge weights,
which represent the overlap between the signature gene-sets and
enriched gene-sets in the network, were computed by Mann-Whitney U
test with P=0.05, and were visualized as pink edges with thickness
indicating the degree of significance.
Microarray gene-expression analysis
The gene expression analysis of CIRI-associated TFs
and their targeted genes were performed using linear regression
models implanted in limma package (v3.38.2); P-values were
calculated using an empirical Bayesian method, adjusted by
Bonferroni correction (25). The
pheatmap package (v1.0.10) was used to show the expression pattern
of CIRI-associated TFs in the S3I3 and S24I24 data-sets, and the
hierarchical clustering method was selected as 'complete'.
Results
Differentially enriched GO terms
associated with CIRI in tMCAO
Cerebral ischemia/reperfusion induces a cascade of
secondary delayed cell deaths that are partially mediated by
alterations in molecular transcriptional activities during
reperfusion (4,26). To improve understanding into the
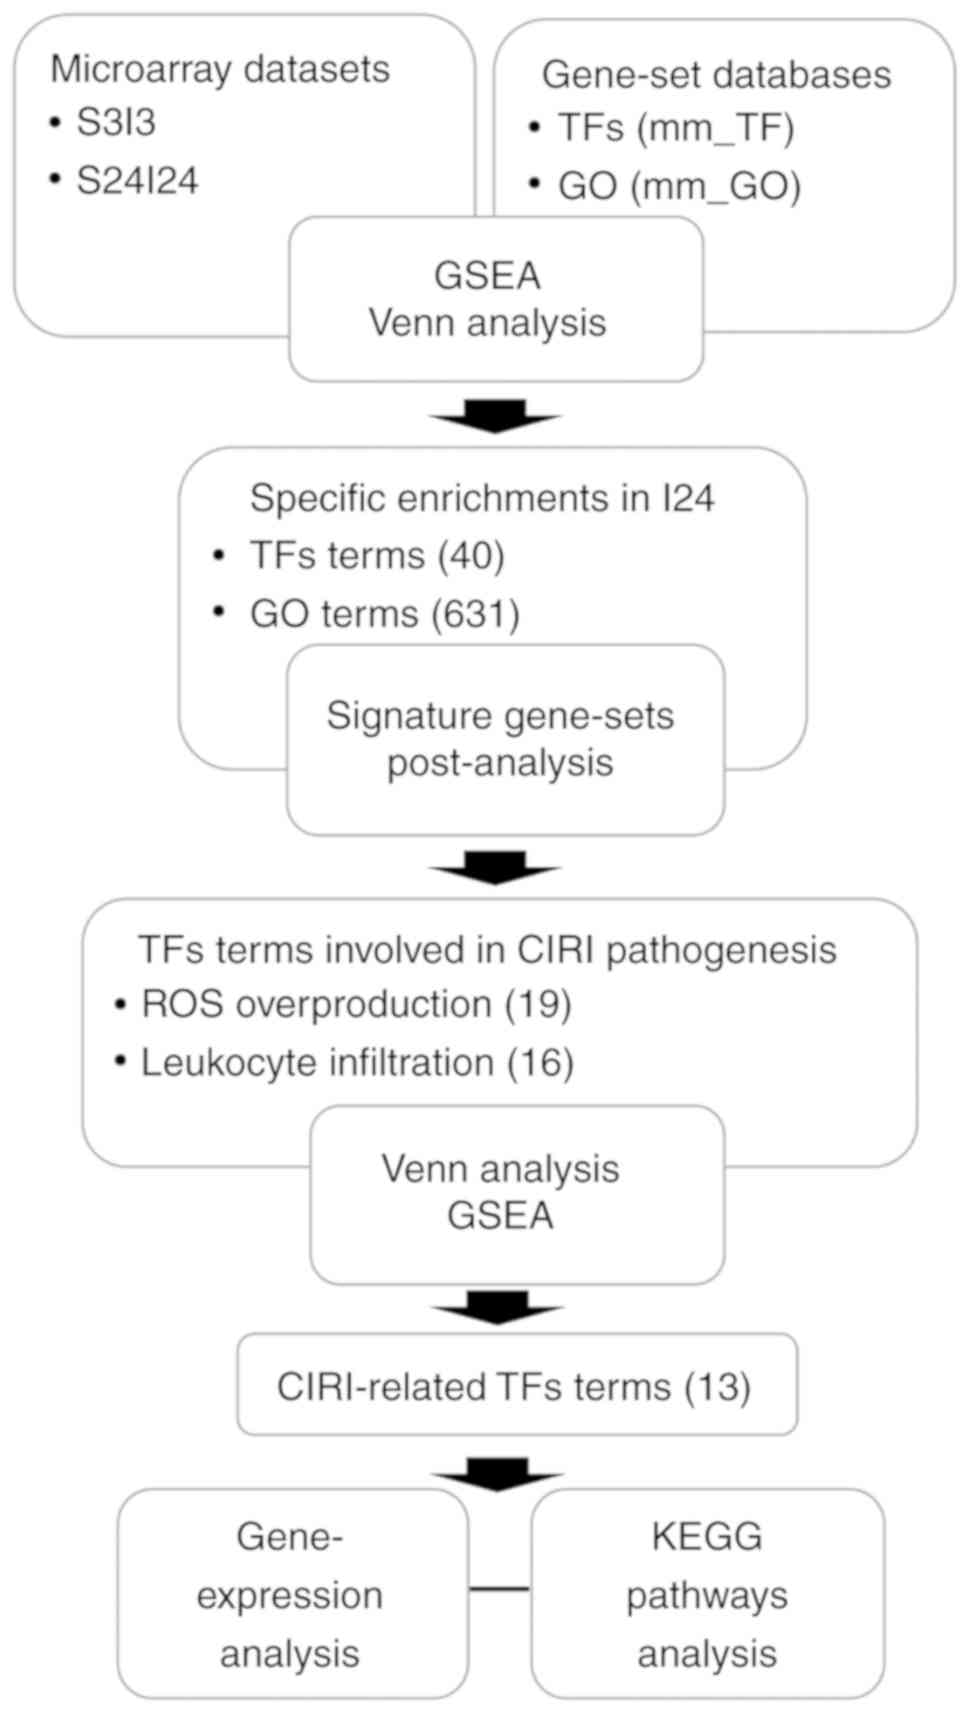
transcriptional mechanisms of CIRI, we performed a computational
analysis workflow to identify candidate CIRI-associated TFs and
their regulatory mechanisms, by combining a statistically
principled GSEA with differentially expressed signature gene-sets
post-analysis (Fig. 1).
GSEA of S3I3 and S24I24 datasets yielded a total of
423 and 953 GO terms that were significantly enriched at 3 and 24 h
after reperfusion in tMCAO mice, respectively (Table II). As CIRI is generally
considered to peak at ~24 h after reperfusion (2,27),
we further identified the GO terms specifically regulated 24 h
after reperfusion by Venn analysis of the enriched GO terms between
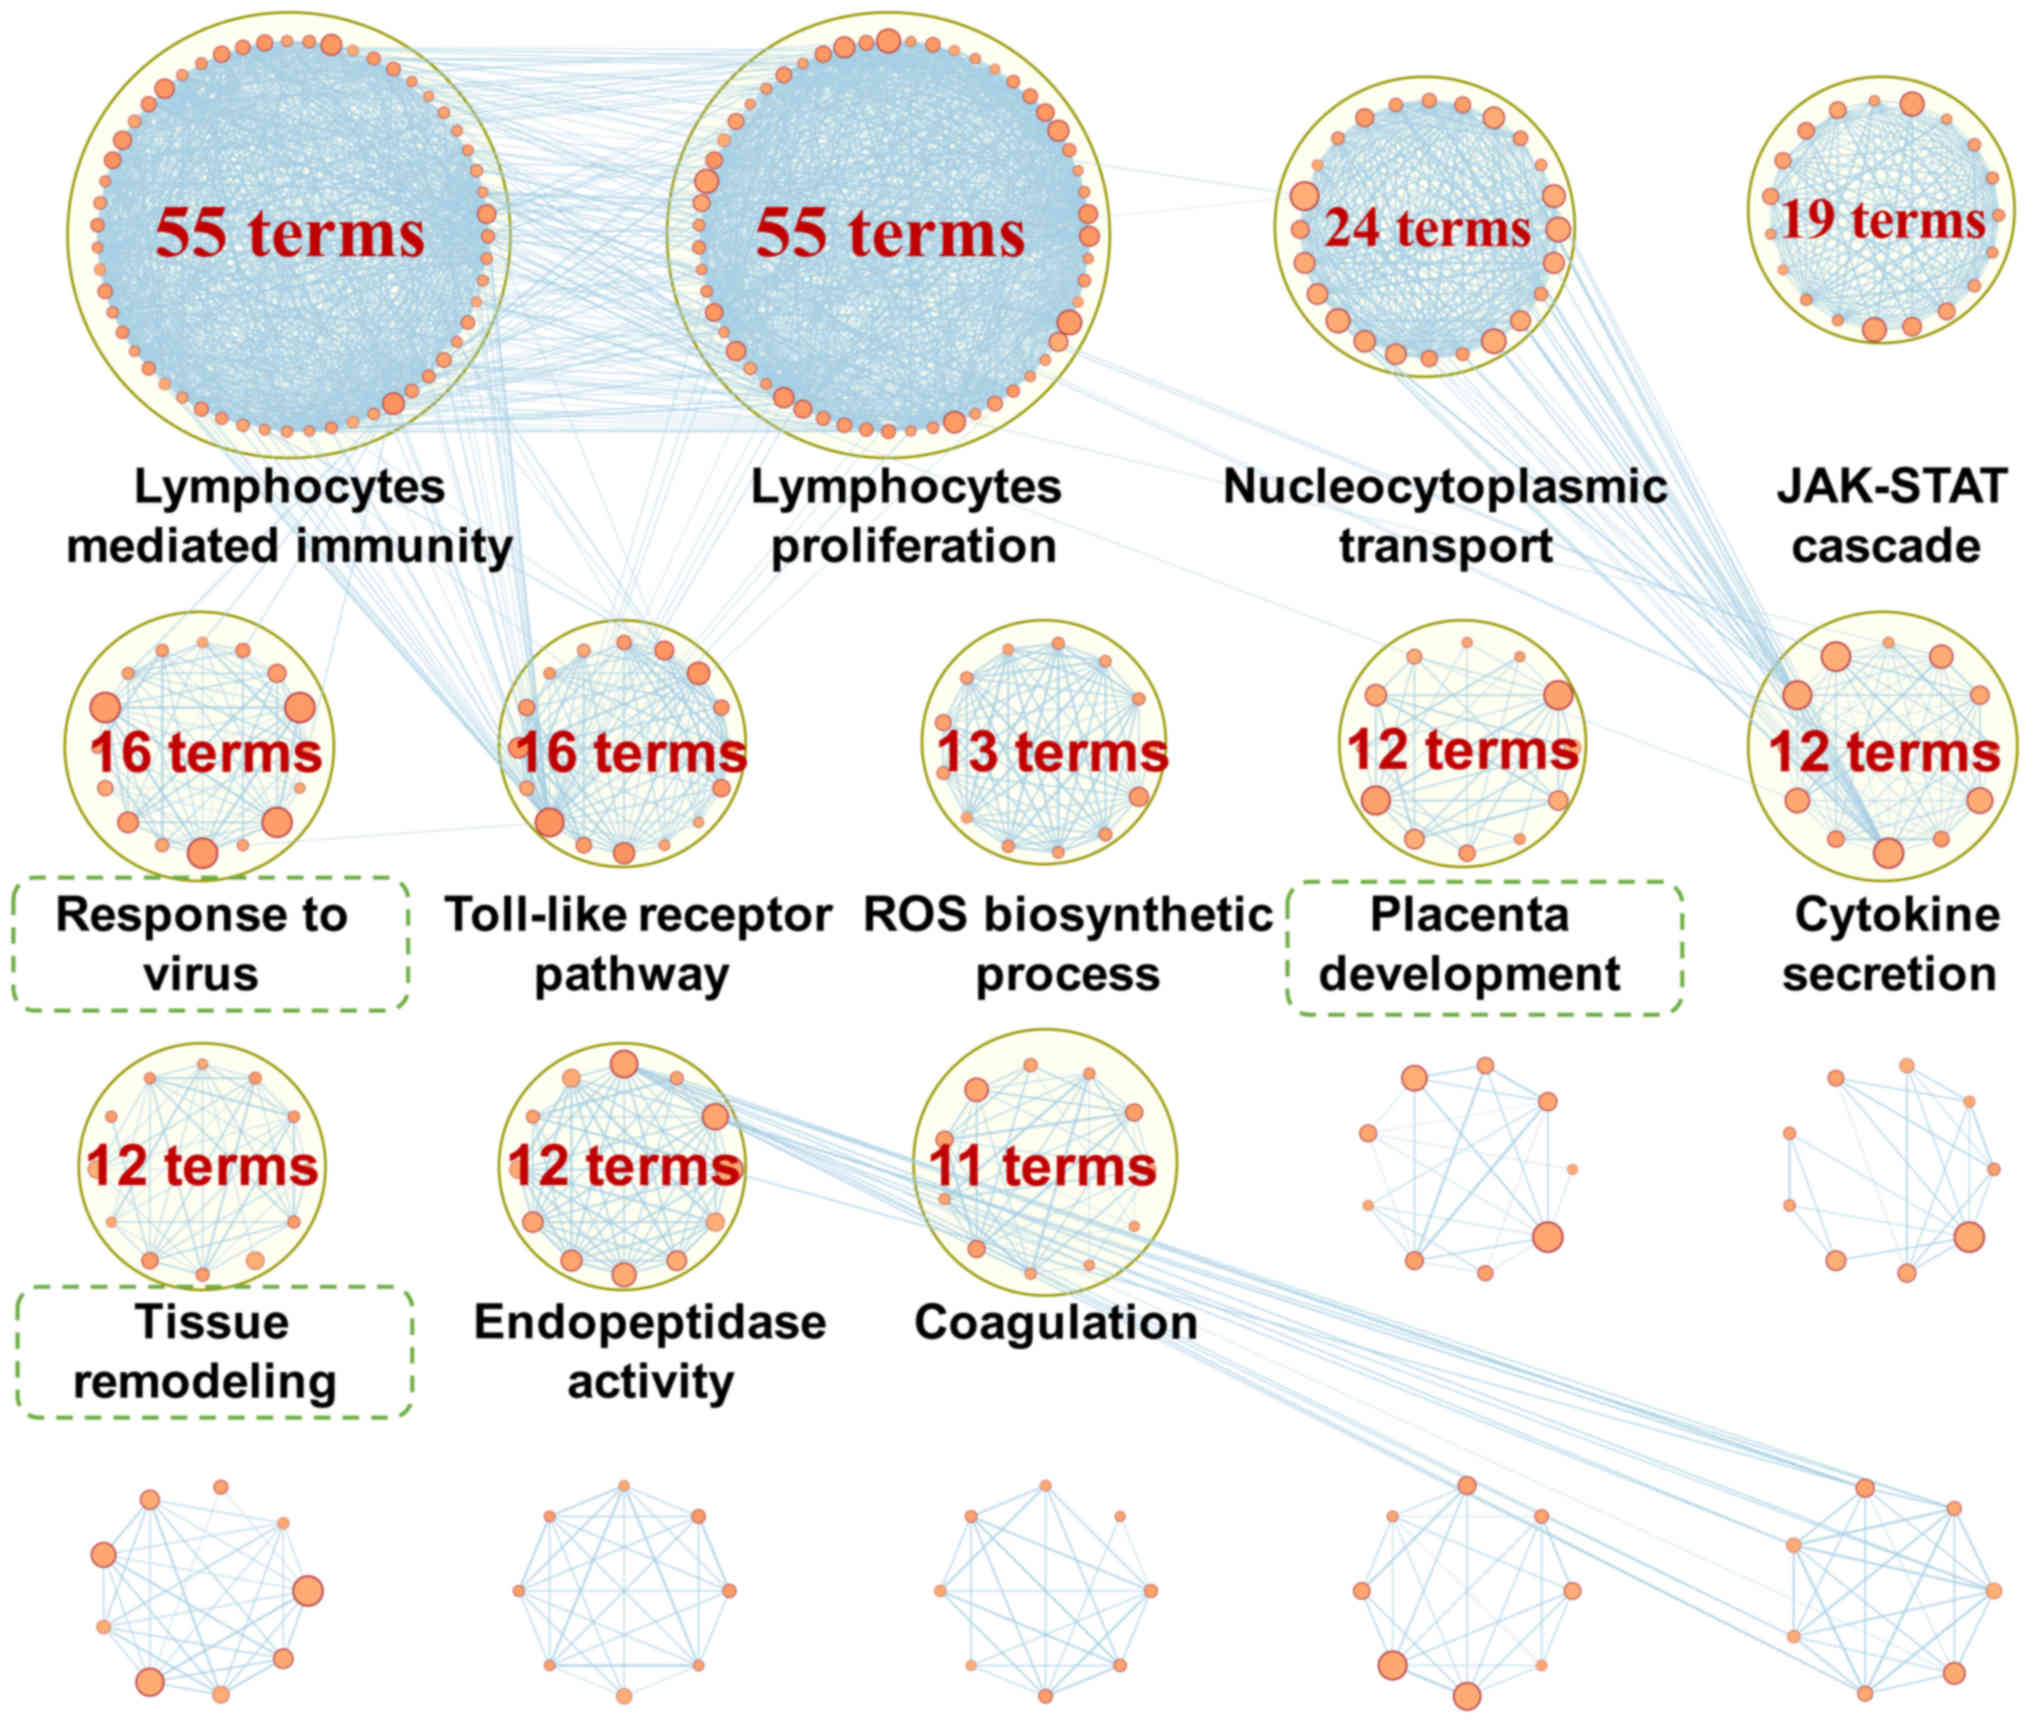
the I3 and I24 groups. To improve understanding of the biological
significance of these I24-specific GO terms, 631 GO terms were
grouped into several major clusters with semantic annotations
(Fig. 2), most of which were
previously reported to be associated with the pathogenesis of CIRI,
including 'lymphocytes mediated immunity' (55 terms), 'lymphocytes
proliferation' (55 terms), 'nucleocytoplasmic transport' (24
terms), 'JAK-STAT cascade' (19 terms), 'Toll-like receptor pathway'
(16 terms), 'reactive oxygen species (ROS) biosynthetic process'
(13 terms), 'cytokine secretion' (12 terms), 'endopeptidase
activity' (12 terms) and 'coagulation' (11 terms). A total of 631
GO terms were specifically enriched 24 h following reperfusion;
four terms were downregulated and 627 terms were upregulated
(Fig. 3A).
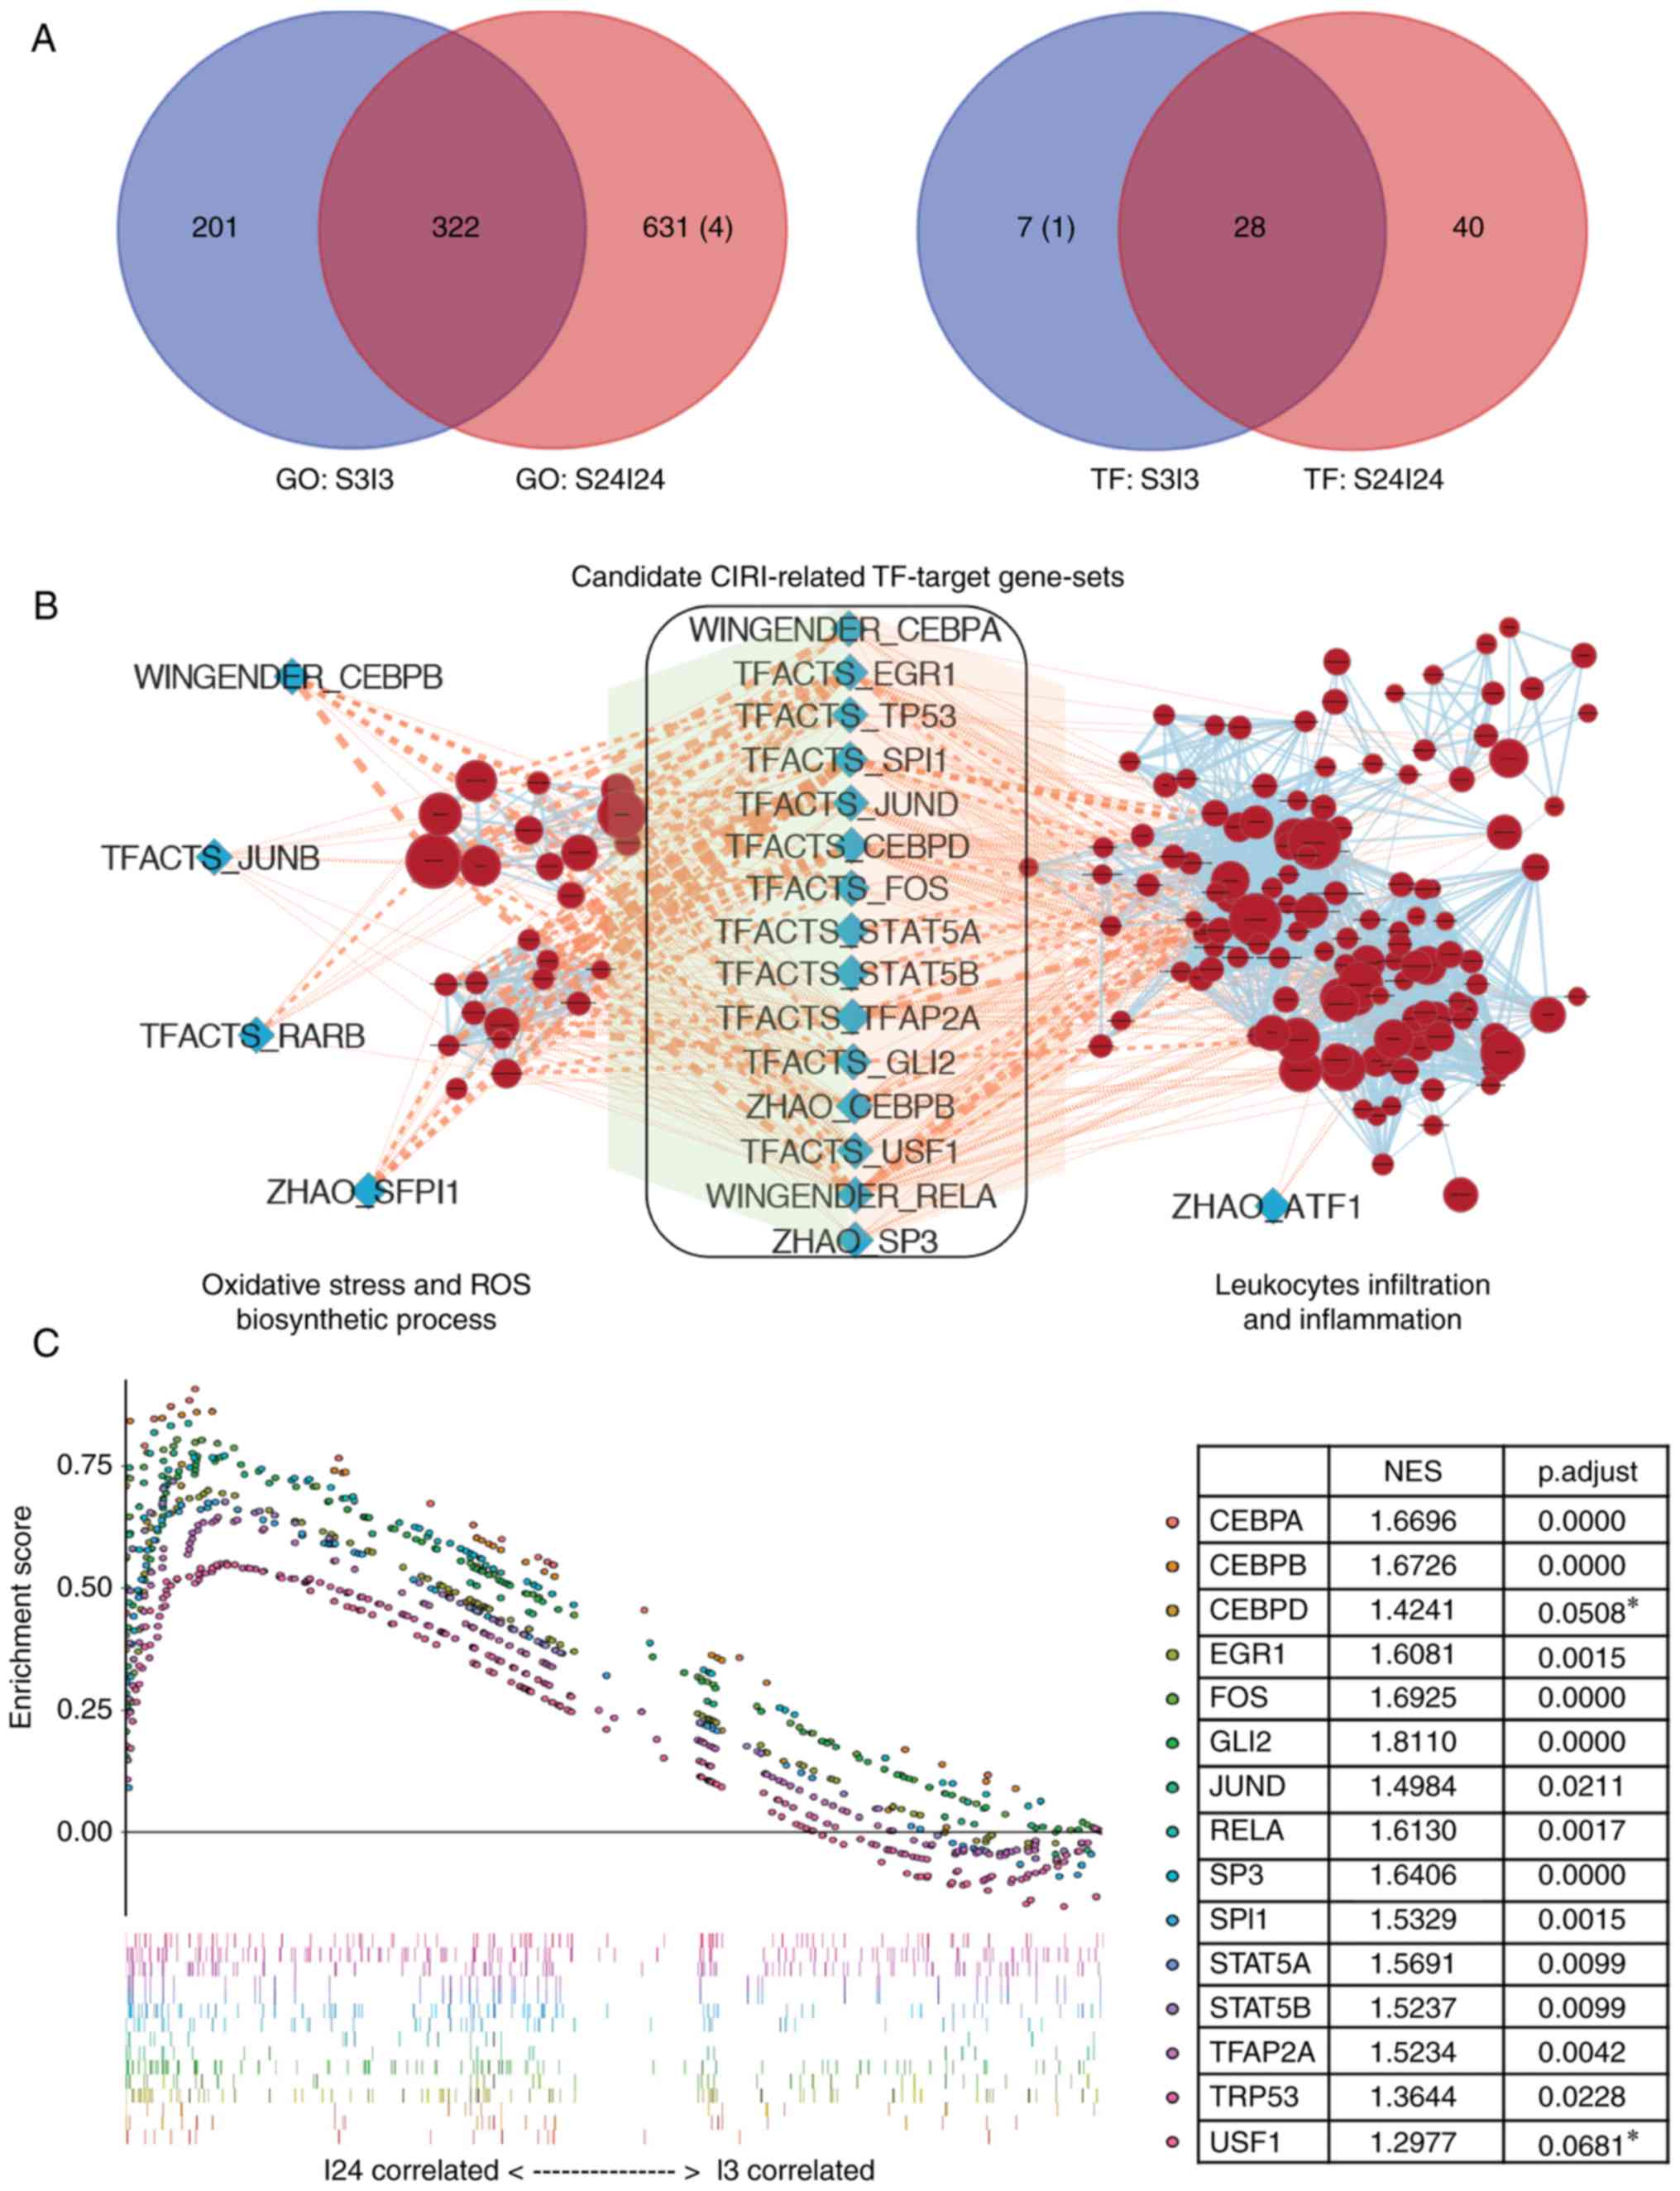 | Figure 3Identification of key transcription
factors associated with CIRI. (A) Venn diagrams of the numbers of
GO terms (left panel) or TF-target gene-sets (right panel)
significantly enriched in the ischemic brains of middle cerebral
artery occlusion mice after 3 h (S3I3) or 24 h (S24I24) of
reperfusion. The number of terms enriched in the sham control group
was shown in parentheses. (B) Enrichment map for CIRI-associated GO
terms and overlap with TF-target gene-sets. The map presented the
specifically enriched GO terms of 'ROS biosynthesis' and
'leukocytes infiltration' process (brick red circles) in I24 group
vs. sham controls. The blue diamonds represented the TF-target
gene-sets that were specifically enriched in the I24 group. Pink
edges indicated overlap between the TF-target gene-sets and
enriched GO terms; thickness represented significance. Only edges
with nominal P<0.05 based on a Mann-Whitney U test were
visualized. (C) Identification of CIRI-related TF-target gene-sets
by gene set enrichment analysis between I3 and I24 groups. A total
of two TFs, Usf1, and Cebpd, with adjusted P>0.05,
were marked with asterisks and excluded for the further study.
CEBP, CCAAT enhancer binding protein; CIRI, cerebral
ischemia-reperfusion injury; GO, gene ontology; ROS, reactive
oxygen species; STAT, signal transduction and activator of
transcription; TF, transcription factor; TRP53, transformation
related protein 53; Usf1, upstream transcription factor 1. |
| Table IINumber of gene-sets differentially
enriched in tMCAO at 3 h (S3I3) and 24 h (S24I24) after
reperfusion. |
Table II
Number of gene-sets differentially
enriched in tMCAO at 3 h (S3I3) and 24 h (S24I24) after
reperfusion.
| Gene-sets | S3I3 dataset
| S24I24 dataset
|
|---|
| Upregulated | Downregulated | Total | Upregulated | Downregulated | Total |
|---|
| Transcription
factor-targets | 34 | 1 | 35 | 65 | 0 | 65 |
| Gene
ontology-terms | 423 | 0 | 423 | 949 | 4 | 953 |
Identification of key transcription
factors associated with CIRI
Oxidative stress and inflammation are the two most
important mechanisms in the pathogenesis of CIRI, in which ROS
overproduction and leukocyte infiltration are key initiation
processes (1). Therefore, TFs
involving both ROS generation and leukocytes infiltration processes
are likely to participate in the pathogenesis of CIRI. Following
GSEA using mm_TF gene-sets database, we identified 35 and 65
TF-target gene-sets that were significantly enriched at 3 and 24 h
after reperfusion in tMCAO mice, with 40 TF-target gene-sets
specifically enriched at 24 h after reperfusion (I24-specific
TF-target gene-sets, Table II
and Fig. 3A). Then, the gene set
similarity of I24-specific TF-target gene-sets to I24-specific GO
terms were determined using the 'Post-Analysis' feature of
EnrichmentMap; 19 and 16 TF-target gene-sets were significantly
associated with 'ROS biosynthetic process' and 'leukocytes
infiltration', respectively (Fig.
3B). Of these TF-target gene-sets, 15 were finally determined
as candidate CIRI-related TF-target gene-sets that were associated
with 'ROS biosynthesis' and 'leukocyte infiltration'. In addition,
we further employed these 15 CIRI-related TF-target gene-sets in
the I3I24 dataset for GSEA to identify CIRI-related TFs that were
significantly induced after 24 h of reperfusion than after 3 h.
From the GSEA results, two TFs, upstream transcription factor 1
(Usf1) and Cebpd were excluded as they were not
significantly enriched in the I24 group under the cutoff adjusted
P≤0.05 (Fig. 3C). An overview of
these 13 candidate CIRI-associated TF-target gene-sets is presented
in Table III.
| Table IIIGeneral description of candidate
cerebral ischemia-reperfusion injury-related TF-target gene-sets
and their target leading edge genes. |
Table III
General description of candidate
cerebral ischemia-reperfusion injury-related TF-target gene-sets
and their target leading edge genes.
| TF gene-sets | Symbol | Name | Description | Leading edge
genes |
|---|
| ZHAO_SP3 | sp3 | SP3 | Trans-acting
transcription factor 3 |
Tgm1/Col1a2/Ccl2/Mmp9/Ucp2/Cdkn1a/Rac2/Tal1/Fbln1/Pcyt1a/Abcc1/Aebp1 |
| ZHAO_CEBPB | cebpb | C/EBP beta | C/EBPβ |
Saa3/Il6/Abcb1b/Cdkn1a/C3/Nupr1/Col1a1 |
| WINGENDER_RELA | rela | P65 | v-rel
reticuloendotheliosis viral oncogene homolog A (avian) |
Il6/Myd88/Tlr13/Tlr2/Ccnd1/Lcn2/Serpine1/Zfp36 |
|
WINGENDER_CEBPA | cebpa | C/EBP alpha | C/EBPα |
Il6/Fabp4/Hmox1/Lcn2/Serpine1/Cebpa/Abcc3/ |
| TFACTS_TP53 | trp53 | P53 | Transformation
related protein 53 |
Bcl3/Upp1/Igfbp3/Casp1/Spp1/Xpc/Eomes/Ccnd1/Brca1/Birc5/Ezh2/Cdkn1a/Myc/Mki67/C1s1/Trp53/Abcc3/Rela/Phlda3/Notch1/Bak1/Abcc1/Rrm1/Afp/Prkab1 |
| TFACTS_TFAP2A | tfap2a | AP-2 alpha | Transcription
factor AP-2 α |
Il6/Timp1/Igfbp3/Nos3/Mmp9/Hk2/Th/Hmox1/Pecam1/Gfap/Cdkn1a/Myc/Plaur/Hook2/Cebpa/Fbln1/Plat/Mcam/Adm/Calb2/Tnpo1/Col1a1/Taf7/Cyp11a1 |
| TFACTS_STAT5B | stat5b | STAT5B | Signal transducer
and activator of transcription 5B |
Socs3/Myd88/Tlr2/Fcgr1/A2m/Cd84/Ccnd1/Klk8/Igf1/Cish |
| TFACTS_STAT5A | stat5a | STAT5A | Signal transducer
and activator of transcription 5A |
Socs3/Myd88/Tlr2/Fcgr1/A2m/Cd84/Ccnd1/Klk8/Igf1/Cish |
| TFACTS_SPI1 | spi1 | PU.1 | Spleen focus
forming virus proviral integration oncogene |
Ncf4/Vav1/Fcgr1/Cd163/Itgb2/Nos3/Ptprc/Prtn3/Tlr4/Msr1/Cd68/Cd72/Ctsk/Tal1/Pdgfrb/Il1b/Chil1/Lsp1/Icam1/Fli1 |
| TFACTS_GLI2 | gli2 | GLI2 | GLI-Kruppel family
member GLI2 |
Il6/Tnc/Tgfbi/Il1r2/Igfbp3/Rapgefl1/Tead1/Ccnd1/Ccl17/Irf9/Fen1/Bmp7/Cdkn1a/Myc/Hpgd/Npy2r/Efna1/Ifngr1/Itga6/Lum/Cks1b/Cflar/Col5a2/Edn1/Lamb3/Mad2l1 |
| TFACTS_FOS | fos | FOS | FBJ osteosarcoma
oncogene |
Mmp3/Il6/Tgm1/Itga5/Timp1/Th/Msr1/Plaur/Nqo1/Trp53 |
| TFACTS_EGR1 | egr1 | EGR1 | Early growth
response 1 |
Il6/Cd44/Col1a2/Spint1/Apoa1/Cebpb/Th/Hmox1/Nudt6/Tfpi2/Pecam1/Twist1/Serpine1/Trp53/Elk1/Cebpa/Rela/Cd9/Icam1 |
| TFACTS_JUND | jund | JUND | Jun D
proto-oncogene |
Il6/Fosl1/Timp1/Spp1/Th/Cdkn1a/Plaur/Nqo1/Plat |
Gene expression analysis of CIRI-related
TFs and their target genes
Although all the CIRI-related TF-target gene-sets
were specifically induced in the injured brain after 24 h of
reperfusion, gene expression analysis demonstrated that these
CIRI-related TFs and their target genes exhibited variable
transcriptional expression patterns in S3I3 or S24I24 dataset. As
presented in Fig. 4A, one group
of TFs including Stat5b, transformation related protein 53
(Trp53), TF AP-2α (Tfap2a), spleen focus forming
virus proviral integration oncogene (Spi1), and Sp3
exhibited no significant difference in expression in the S3I3 and
S24I24 datasets, while another group of TFs with Fos and
Egr1 were significantly upregulated in both datasets. GLI
family zinc finger 2 (Gli2) and Jund exhibited
opposing expression patterns, in which Gli2 was
downregulated in the S24I24 dataset while Jund was
upregulated in the S3I3 dataset. The last group of TFs with
Stat5a, Rela, Cebpb and Cebpa were
overexpressed specifically in the S24I24 dataset but not in
S3I3.
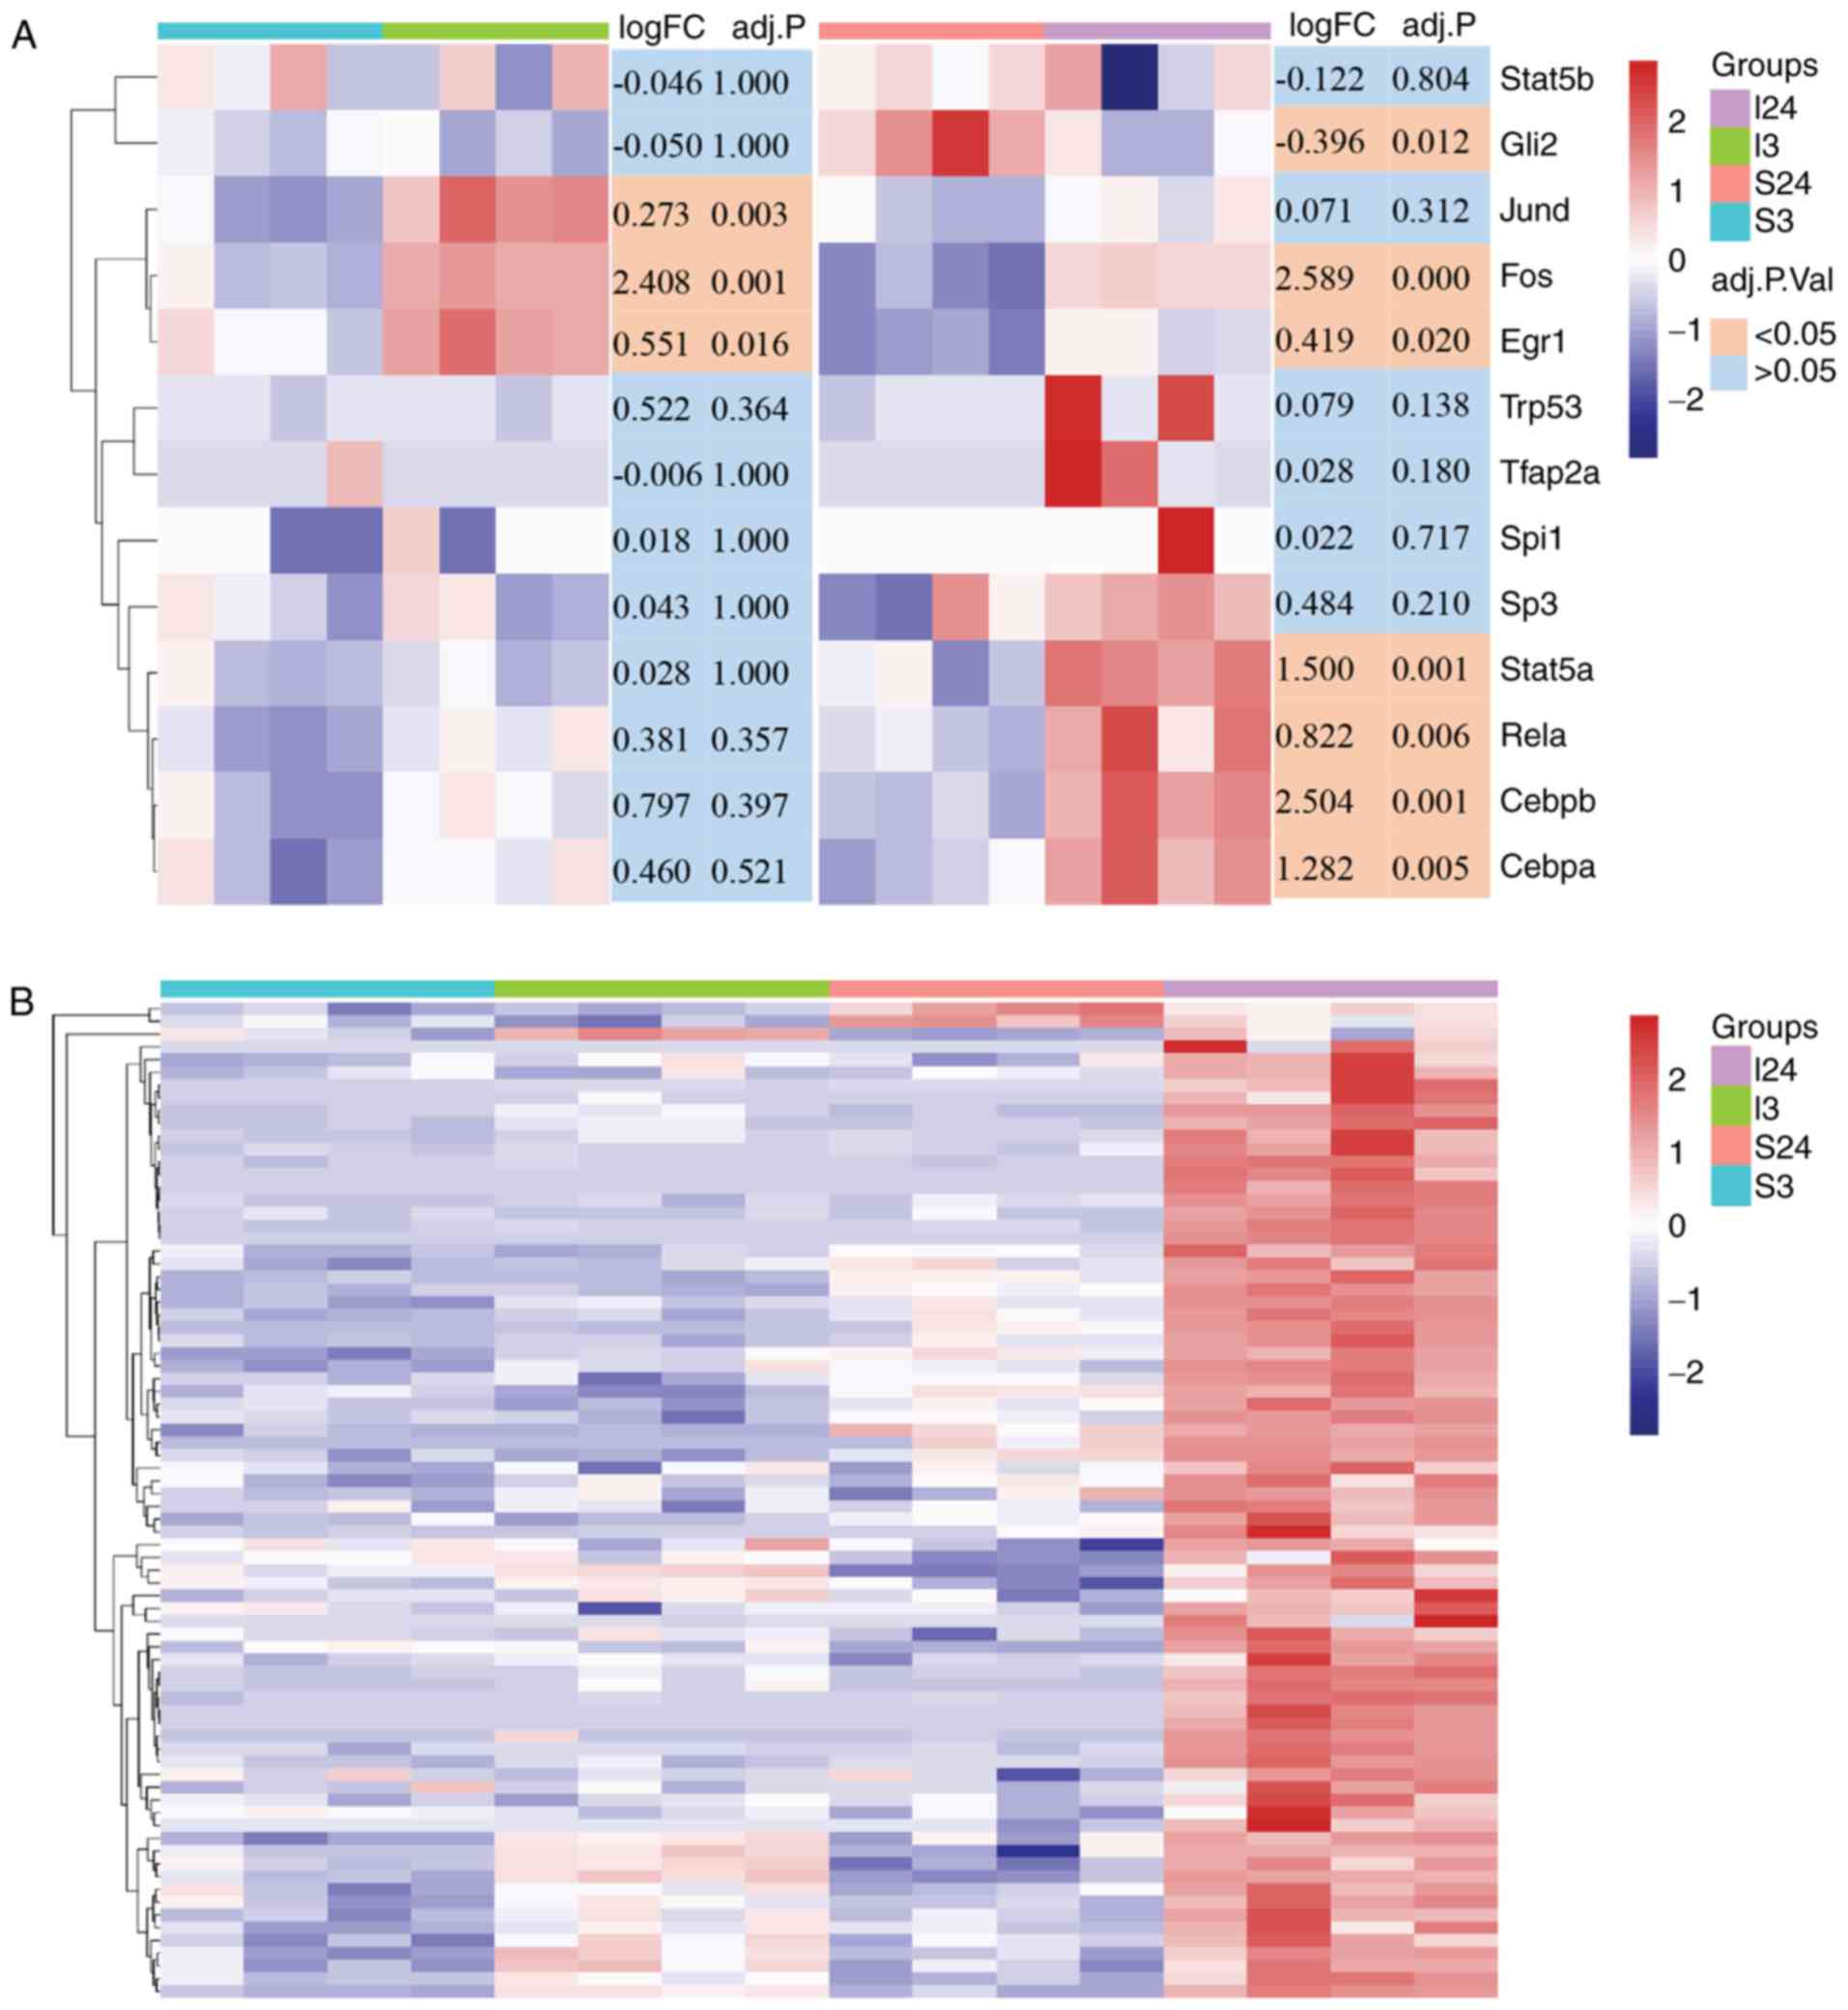 | Figure 4Heatmap analysis of CIRI-related TFs
and their target genes. (A) The transcriptional expression patterns
of CIRI-related TF genes in the ischemic brain after 3 and 24 h of
reperfusion compared with the relevant sham controls. The color
blocks in the lower right of heatmap represent the significance of
the differential expression of CIRI-related TF genes, orange,
adjusted P<0.05; light blue, adjusted P>0.05. (B) Heat map of
CIRI-related TFs target genes (n=78) significantly upregulated
(adjusted P<0.05) in the I24 group as compared with sham control
subjects (S24). These genes were identified by leading-edge
analysis after gene set enrichment analysis between I3 and I24
groups, and the log2 transformed data were used for heatmap
analysis. The y-axis data are individual genes, the color bar in
the heatmap right represents the gene expression level (blue,
downregulation and red, upregulation). The color blocks in the
upper right of the heatmap indicate the experimental groups
(purple, I24 group; green, I3 group; pink, S24 group and cyan, S3
group). CEBP, CCAAT enhancer binding protein; CIRI, cerebral
ischemia-reperfusion injury; Egr1, early growth response-1; Gli2,
GLI family zinc finger 2; Spi1, spleen focus forming virus proviral
integration oncogene; Stat, signal transduction and activator of
transcription; TF, transcription factor. |
In addition, we performed leading-edge analysis with
the 13 CIRI-related TF-target gene-sets following GSEA between the
I3 and I24 groups to identify the target genes regulated by these
CIRI-related TFs. A total of 123 target genes regulated by the 13
CIRI-associated TFs were identified in the I3I24 dataset, of which
78 genes were significantly overexpressed in the I24 group and were
presented as a heatmap (Fig. 4B).
The statistical results of expression of the 78 target genes in the
S3I3 and S24I24 datasets were listed in Table S1.
Enrichment analysis for target genes of
CIRI-associated transcription factors
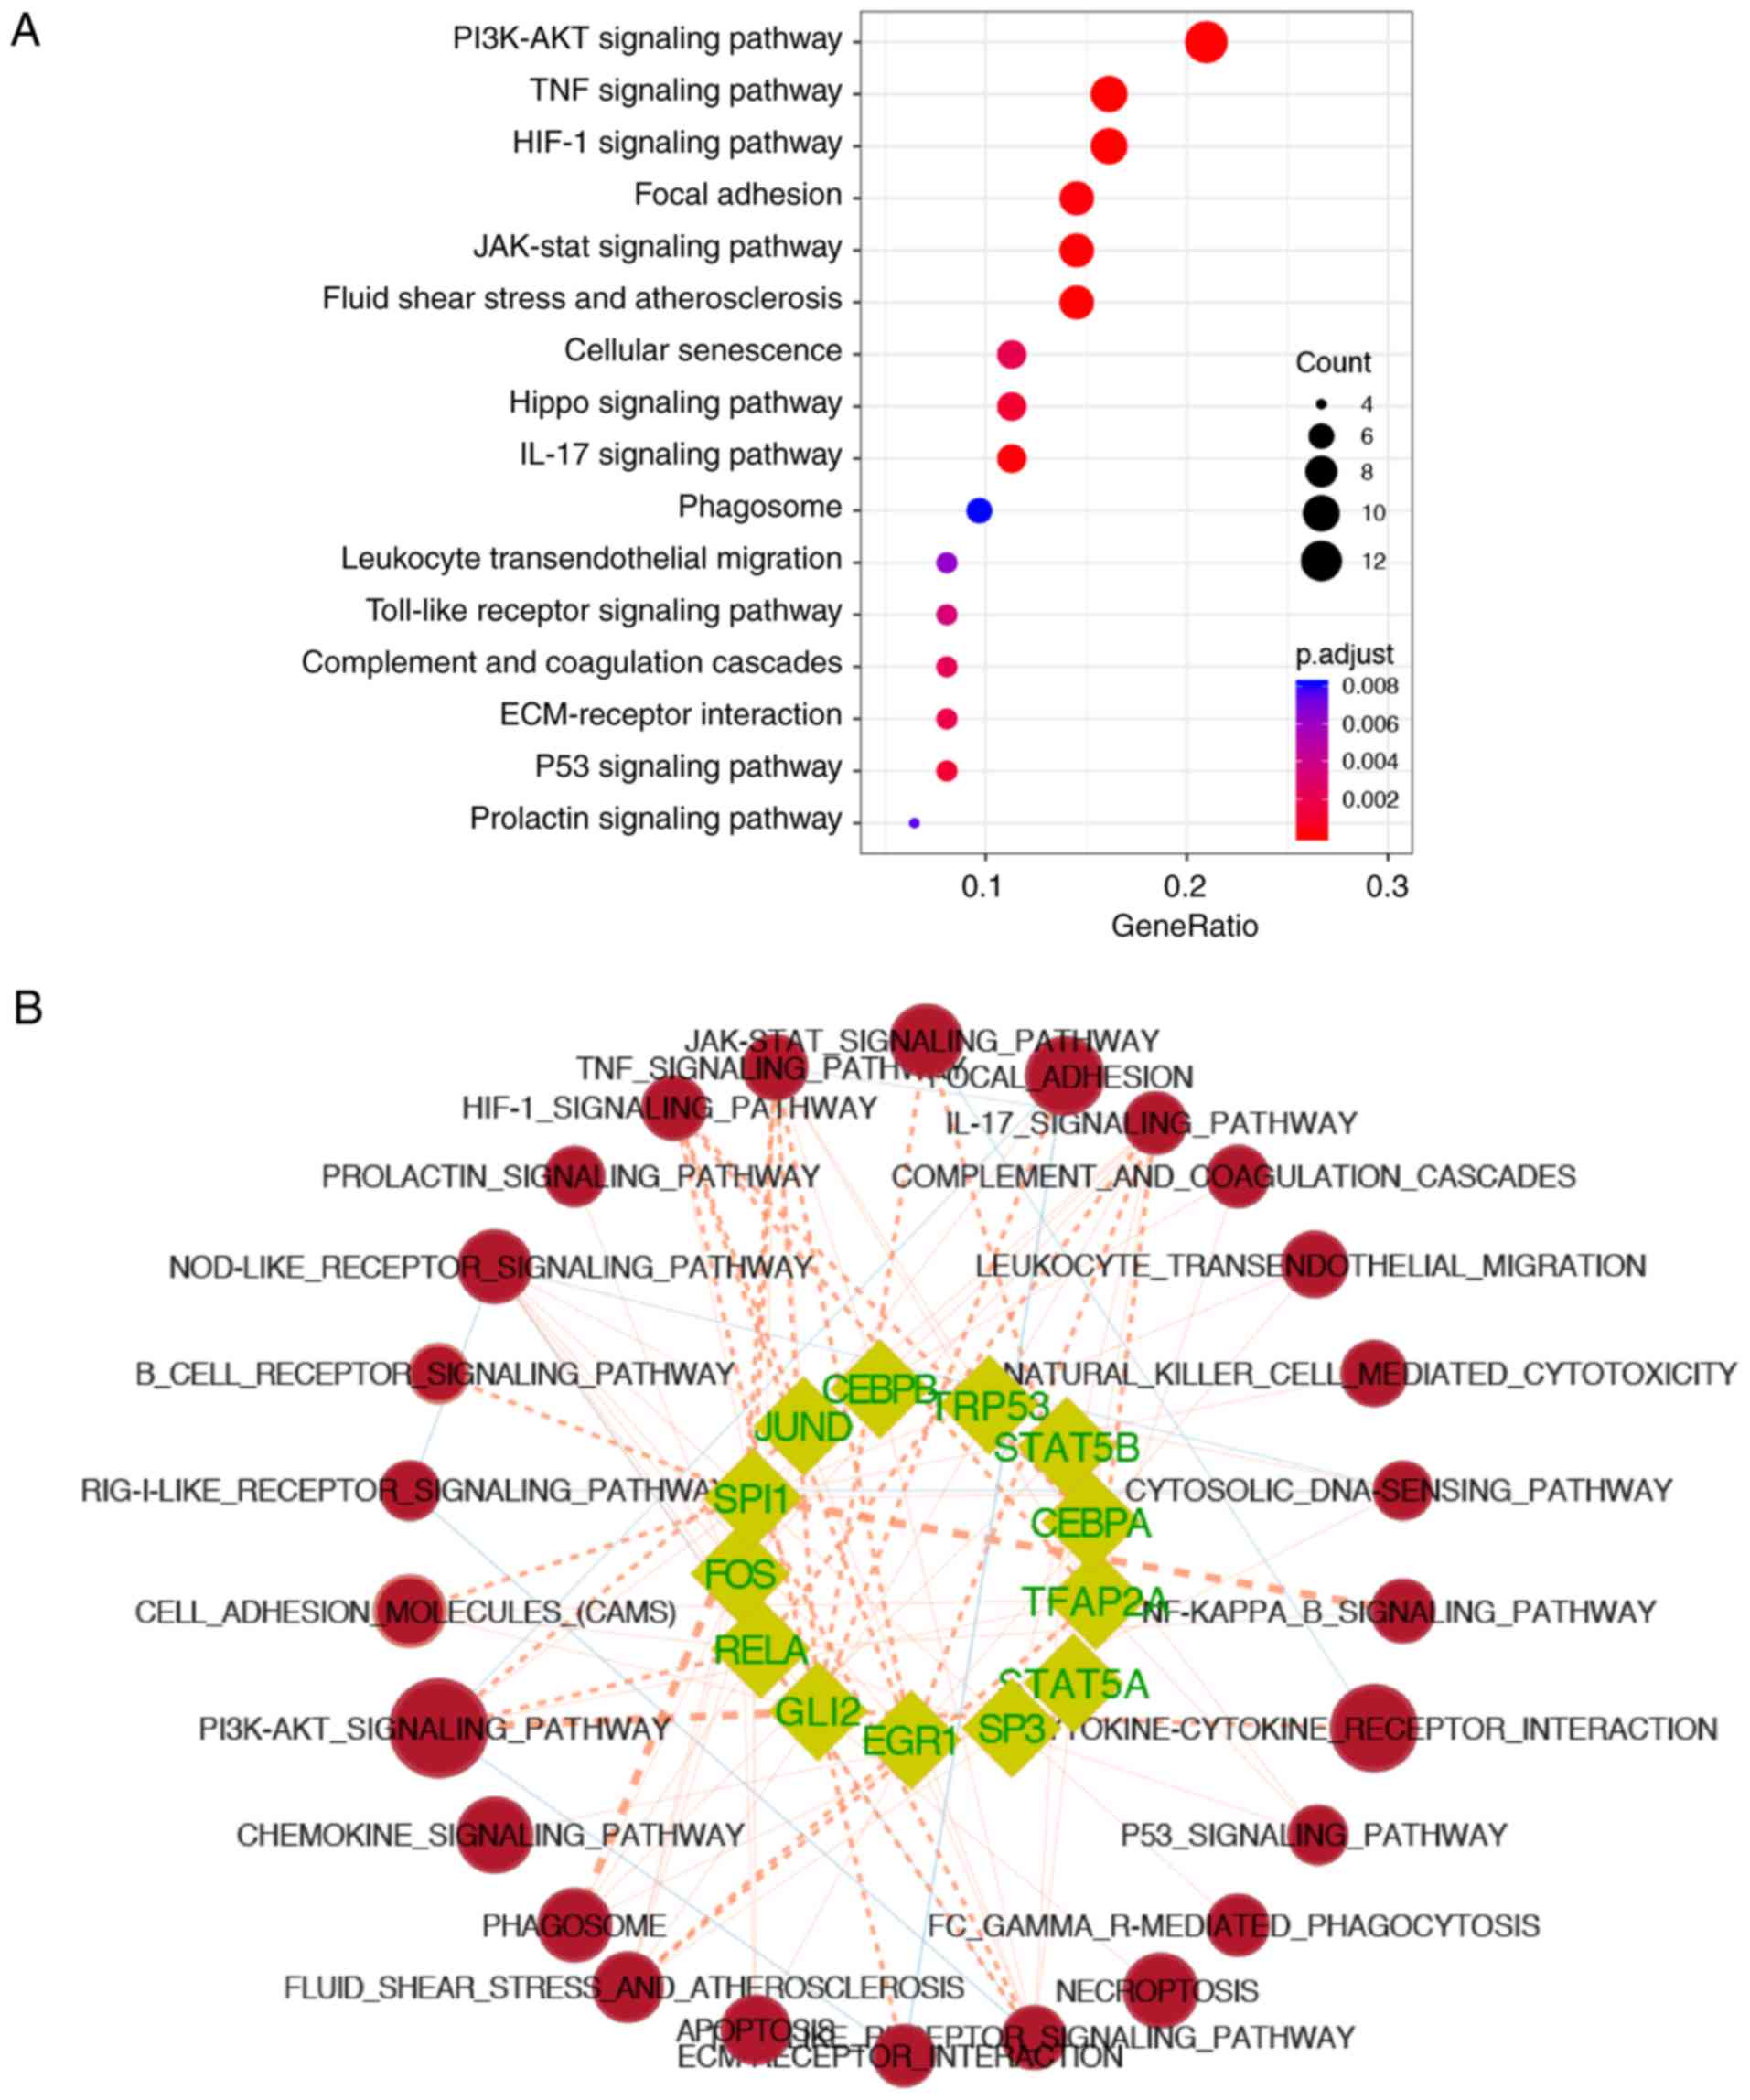
The 78 overexpressed genes in the I24 group were
used for enrichment analysis to determine significant KEGG pathways
in which CIRI-related TFs were involved. The results demonstrated
that these target genes of CIRI-related TFs were mainly involved in
the 'PI3K-Akt signaling pathway' (adjusted P=3.54×10⁻⁵),
'tumor necrosis factor (TNF) signaling pathway' (adjusted
P=4.01×10⁻⁷), 'hypoxia-inducible factor-1 (HIF-1)
signaling pathway' (adjusted P=3.81×10⁻⁷), 'focal
adhesion' (adjusted P=1.55×10⁻⁴) and 'JAK-STAT signaling
pathway' (adjusted P=5.74×10⁻⁵) (Fig. 5A). In addition, the KEGG pathways
involving each CIRI-related TF were further analyzed by calculating
the gene-sets similarity of CIRI-related TFs with the KEGG pathways
enriched in the S24I24 dataset using the 'Post-Analysis' feature of
EnrichmentMap (Fig. 5B and C,
P≤0.05). Of these CIRI-related TFs, 5 TFs (Cebpa,
Gli2, Sp3, Tfap2a and Spi1) were
reported to be associated with CIRI, which were mainly involved in
the pathways related to inflammation and responses to reperfusion,
including the 'TNF signaling pathway' (Gli2, Spi1 and
Tfap2a, P=0.0035, 0.0035 and 0.048,
respectively), 'interleukin (IL)-17 signaling pathway'
(Cebpa, Gli2, Sp3, Spi1 and
Tfap2a, P=0.019, 0.047, 0.019, 0.035 and 0.005,
respectively), and fluid shear stress and atherosclerosis
(Gli2, Sp3, Spi1 and Tfap2a, P=0.047,
0.046, 0.013 and 0.003, respectively). In particular, Spi1
was observed to be significantly involved in the majority of the
enriched KEGG pathways of S24I24, including 'NF-kB signaling
pathway' (P<0.001), 'phagosome' (P<0.001), 'Toll-like
receptor signaling pathway' (P=0.002), 'TNF signaling pathway'
(P=0.004), 'PI3K-Akt signaling pathway' (P=0.010), 'HIF-1 signaling
pathway' (P=0.017), 'apoptosis' (P=0.021), 'cell adhesion
molecules' (P=0.003), 'NOD-like receptor signaling pathway'
(P=0.021), 'cytosolic DNA-sensing pathway' (P=0.050), 'natural
killer cell mediated cytotoxicity' (P=0.005), 'IL-17 signaling
pathway' (P=0.035), 'B cell receptor signaling pathway' (P=0.004),
'FCγR-mediated phagocytosis' (P=0.021), 'leukocyte
trans-endothelial migration' (P=0.013), and 'fluid shear stress and
atherosclerosis' (P=0.013).
Discussion
In the present study, the gene expression profiles
of ischemic stroke were systematically analyzed at different time
points (3 and 24 h) after reperfusion using the GSEA bioinformatics
method to reveal the possible transcriptional regulatory mechanisms
associated with CIRI at various functional levels. We identified 13
key CIRI-related TFs, of which 5 CIRI-related TFs (Cebpa,
Gli2, Sp3, Tfap2a and Spi1) were
reported, and the biological pathways involved following ischemic
stroke were determined. To the best of our knowledge, this is the
first bioinformatics study to characterize CIRI-related TFs in the
context of the pathogenesis of CIRI.
Oh et al (28) investigated genetic alterations in
the peripheral blood after acute ischemic stroke, suggesting the
detrimental effects of peripheral white blood cells on the ischemic
brain after reperfusion. In the present study, the GO terms
specifically enriched at 24 h post-reperfusion in an MCAO rat model
were analyzed to determine the CIRI-related TFs associated with ROS
overproduction and leukocyte infiltration. It has been reported
that differentially expressed genes at 24 h after cerebral
ischemia/reperfusion in MCAO rats are associated with inflammation,
apoptosis, stress and immune responses, and are involved in the
pathogenesis of CIRI (29,30).
Our results from GSEA are consistent with previous findings,
indicating that I24-specific GO terms were mainly enriched in
immune cells activity and inflammation, and their related pathways,
including the Jakstat cascade and the Toll-like receptor pathway.
In addition, GSEA also revealed several functional clusters of
CIRI-related GO terms that have not previously been reported in
high throughput studies (30),
such as 'nucleocytoplasmic transport,' 'endopeptidase activity' and
'coagulation'. Importantly, the enrichment of nucleocytoplasmic
transport-associated genes could reveal the enhancement of
transcriptional activity in the ischemic brain 24 h after
reperfusion, further indicating the pivotal roles of novel
transcripts induced by reperfusion in the pathogenesis of CIRI.
Transcription factors can be induced in ischemic
stroke, and are involved in neuronal injury or neuroprotection at
different stages after reperfusion by regulating post-ischemic
inflammation (6). In the present
study, it was determined that 8 CIRI-related TFs, including
Cebpb, Egr1, Rela, Jund,
Stat5a/b, Fos and Trp53 were functionally
activated at 24 h after reperfusion, as other studies have
previously reported (6,31,32). Of these TFs, the activation of
Jund (31),
Stat5a/b (32), Fos
and Trp53 is known to prevent ischemic neuronal damage,
whereas the induction of Cebpb, Egr1 and Rela
promotes inflammation and neuronal death following cerebral
ischemia (6). KEGG pathway
analysis revealed that these CIRI-related TFs were not only
involved in pro-inflammatory pathways to promote cell death but in
neuroprotective pathways to promote neuron survival. These results
demonstrated that TFs were important endogenous modulators, which
may be actively involved in the balance of brain damage and repair
during the pathogenesis of CIRI, by coordinating numerous
downstream genes that govern inflammation.
Furthermore, the present study reported that three
CIRI-related TFs (Jund, Fos and Egr1),
belonging to the immediate early gene family, were significantly
upregulated as early as 3 h after reperfusion. These TFs could be
rapidly induced at the onset of hypoxic conditions to trigger
(Egr1) or suppress (Jund and Fos) the first
wave of inflammatory responses in the ischemic brain or other
organs (11,33). An additional group of CIRI-related
TFs, including Stat5a, Rela, and Cebpa/b, can
be induced by Fos and Egr1, and were significantly
overexpressed 24 h after reperfusion. These TFs may act in a
positive regulatory loop and promote of CIRI at 24 h after
reperfusion (34).
Other CIRI-related TFs, including Cebpa,
Gli2, Sp3, Tfap2a and Spi1 were first
identified to be associated with CIRI in this study. The TFs
Cebpa and Spi1 are two myeloid-specific proteins
involved in the differentiation of monocyte lineages (35). A previous study revealed that the
decrease in CEBPα/β DNA-binding activity was inevitably associated
with CIRI in a long-term (30 days) global cerebral ischemia model
(36). In addition, the
expression of Cebpa was induced in microglia after
hypoxic-ischemic brain injury (37). In addition, Cebpa can
combine with Spi1 to enhance monocyte-specific promoter
activity and affect NF-κB activity in response to TNF-α signaling
(38). It is well reported that
increased inflammation and inflammatory proteins, such as TNF-α,
serve critical roles in the pathogenesis of CIRI via NF-κB
signaling pathway (34).
Therefore, Spi1 and Cebpa may serve a synergistic
pro-inflammatory role in the pathogenesis of CIRI. Sp3 is a
transcriptional repressor that, in complex with RE1-silencing
transcription factor, inhibits the gene expression of
Na+-Ca2+ exchanger 1 in the tMCAO rat model
(39). Our functional enrichment
analysis demonstrated that Sp3 was activated in the I24
group and was functionally associated with the activation of the
IL-17 signaling pathway. Previous studies have reported that
inhibiting the IL-17 signaling pathway reduced neutrophil
infiltration and protected against ischemic stroke (40). Sp3 activation may promote
neutrophil invasion via the IL-17 signaling pathway, which then
promotes the pathogenesis of CIRI-induced cerebral edema.
Gli2 is generally considered as a potent
oncogene by activating the Sonic hedgehog (Shh) signaling pathway
in embryonal cancer cells (41,42). Previously, the Shh signaling
pathway was shown to serve an important role in neuroprotection and
neurogenesis via a mechanism of anti-oxidative stress in a rodent
stroke model after cerebral ischemia (43). In the present study, the
transcriptional activity of Gli2 was significantly activated
and closely associated with the PI3K-Akt signaling pathway,
suggesting the neuroprotective effect of Gli2 in response to
CIRI. Tfap2a has been considered to be a tumor-related gene
that regulates tumor growth and survival via the HIF-1α signaling
pathway (44). It was previously
demonstrated that Tfap2a served an important role in the
repair of myocardial ischemic injury via an Akt-dependent signaling
pathway (45). The present study
reported that Tfap2a activation was involved in the HIF-1
and PI3K-Akt signaling pathways, suggesting other biological
functions of Tfap2a in the pathogenesis of CIRI in addition
to tumorigenesis. Collectively, these findings indicated that these
CIRI-related TFs served complex and critical roles in the
pathogenesis of CIRI at the level of various pathways following
ischemia/reperfusion. This supports the hypothesis that TFs could
be effective targets for alleviating CIRI.
The lack of further experimental verification of
these CIRI-TFs is the largest limitation of the present study. In
particular, the newly identified CIRI-associated TFs, including
Gli2, Spi1 and Tfap2a require further
investigation to determine their protein expression profiles and
exact roles in the pathogenesis of CIRI.
In summary, the functional gene-sets enriched in
ischemic stroke at different time points (3 and 24 h) after
reperfusion based on microarray expression data were analyzed in
the present study. The results indicated 13 CIRI-related TFs,
including Cebpb, Cebpa, Egr1, Fos,
Rela, Jund, Stat5a/b, Trp53,
Gli2, Sp3, Tfap2a and Spi1, which may
serve significant regulatory roles in the pathogenesis of CIRI.
Although some of these TFs were reported in previous studies, five
TFs including Cebpa, Gli2, Sp3, Tfap2a
and Spi1 have not been reported in CIRI to the best of our
knowledge. These findings may provide insight into the potential
molecular mechanism underlying the pathogenesis of CIRI and aid the
identification of novel targets in the treatment of CIRI; however,
further investigation is required.
Supplementary Materials
Funding
The present study was supported by the National
Natural Science Foundation of China (grant nos. 81471767 and
81871464).
Availability of data and materials
The microarray data used during the current study
can be downloaded from the GEO database (https://www.ncbi.nlm.nih.gov/geo/query/acc.cgi?acc=GSE32529).
The mouse gene-sets of transcription factor target genes (mm_TF),
Gene Ontology (mm_GO) and metabolic pathways (mm_metabolic) used in
the present study can be downloaded from GSKB database (http://ge-lab.org/#/data). The datasets used and/or
analyzed during the current study are available from the
corresponding author on reasonable request.
Authors' contributions
YYZ, JL and WJJ made substantial contributions to
the design of the present study. YEL, KW and AFL conducted data
collection and preprocessing. Data analysis and interpretation was
performed by YYZ, KW, WW, YEL, JZ, CL, YQZ and APZ. YYZ and JL
wrote the manuscript. All authors read and approved the final
manuscript.
Ethics approval and consent to
participate
Not applicable.
Patient consent for publication
Not applicable.
Competing interests
The authors declare that they have no competing
interests.
Acknowledgments
Not applicable.
References
|
1
|
L L, X W and Z Y: Ischemia-reperfusion
injury in the brain: Mechanisms and potential therapeutic
strategies. Biochem Pharmacol (Los Angel). 5:2132016. View Article : Google Scholar
|
|
2
|
Hossmann KA: The two pathophysiologies of
focal brain ischemia: Implications for translational stroke
research. J Cereb Blood Flow Metab. 32:1310–1316. 2012. View Article : Google Scholar : PubMed/NCBI
|
|
3
|
Eltzschig HK and Eckle T: Ischemia and
reperfusion-from mechanism to translation. Nat Med. 17:1391–1401.
2011. View Article : Google Scholar : PubMed/NCBI
|
|
4
|
VanGilder RL, Huber JD, Rosen CL and Barr
TL: The transcriptome of cerebral ischemia. Brain Res Bull.
88:313–319. 2012. View Article : Google Scholar : PubMed/NCBI
|
|
5
|
Lu XC, Williams AJ, Yao C, Berti R,
Hartings JA, Whipple R, Vahey MT, Polavarapu RG, Woller KL,
Tortella FC and Dave JR: Microarray analysis of acute and delayed
gene expression profile in rats after focal ischemic brain injury
and reperfusion. J Neurosci Res. 77:843–857. 2004. View Article : Google Scholar : PubMed/NCBI
|
|
6
|
Yi JH, Park SW, Kapadia R and Vemuganti R:
Role of transcription factors in mediating post-ischemic cerebral
inflammation and brain damage. Neurochem Int. 50:1014–1027. 2007.
View Article : Google Scholar : PubMed/NCBI
|
|
7
|
Cox-Limpens KE, Gavilanes AW, Zimmermann
LJ and Vles JS: Endogenous brain protection: What the cerebral
transcriptome teaches us. Brain Res. 1564:85–100. 2014. View Article : Google Scholar : PubMed/NCBI
|
|
8
|
Sun Y, Liu L, Yuan J, Sun Q, Wang N and
Wang Y: RP105 protects PC12 cells from oxygenglucose
deprivation/reoxygenation injury via activation of the PI3K/AKT
signaling pathway. Int J Mol Med. 41:3081–3089. 2018.PubMed/NCBI
|
|
9
|
Iadecola C, Salkowski CA, Zhang F, Aber T,
Nagayama M, Vogel SN and Ross ME: The transcription factor
interferon regulatory factor 1 is expressed after cerebral ischemia
and contributes to ischemic brain injury. J Exp Med. 189:719–727.
1999. View Article : Google Scholar : PubMed/NCBI
|
|
10
|
Nurmi A, Lindsberg PJ, Koistinaho M, Zhang
W, Juettler E, Karjalainen-Lindsberg ML, Weih F, Frank N,
Schwaninger M and Koistinaho J: Nuclear factor-kappaB contributes
to infarction after permanent focal ischemia. Stroke. 35:987–991.
2004. View Article : Google Scholar : PubMed/NCBI
|
|
11
|
Tureyen K, Brooks N, Bowen K, Svaren J and
Vemuganti R: Transcription factor early growth response-1 induction
mediates inflammatory gene expression and brain damage following
transient focal ischemia. J Neurochem. 105:1313–1324. 2008.
View Article : Google Scholar : PubMed/NCBI
|
|
12
|
Kapadia R, Tureyen K, Bowen KK, Kalluri H,
Johnson PF and Vemuganti R: Decreased brain damage and curtailed
inflammation in transcription factor CCAAT/enhancer binding protein
beta knockout mice following transient focal cerebral ischemia. J
Neurochem. 98:1718–1731. 2006. View Article : Google Scholar : PubMed/NCBI
|
|
13
|
Satriotomo I, Bowen KK and Vemuganti R:
JAK2 and STAT3 activation contributes to neuronal damage following
transient focal cerebral ischemia. J Neurochem. 98:1353–1368. 2006.
View Article : Google Scholar : PubMed/NCBI
|
|
14
|
Ridder DA, Bulashevska S, Chaitanya GV,
Babu PP, Brors B, Eils R, Schneider A and Schwaninger M: Discovery
of transcriptional programs in cerebral ischemia by in silico
promoter analysis. Brain Res. 1272:3–13. 2009. View Article : Google Scholar : PubMed/NCBI
|
|
15
|
Pulliam JV, Xu Z, Ford GD, Liu C, Li Y,
Stovall KC, Cannon VS, Tewolde T, Moreno CS and Ford BD:
Computational identification of conserved transcription factor
binding sites upstream of genes induced in rat brain by transient
focal ischemic stroke. Brain Res. 1495:76–85. 2013. View Article : Google Scholar
|
|
16
|
Camos S, Gubern C, Sobrado M, Rodríguez R,
Romera VG, Moro MA, Lizasoain I, Serena J, Mallolas J and
Castellanos M: The high-mobility group I-Y transcription factor is
involved in cerebral ischemia and modulates the expression of
angiogenic proteins. Neuroscience. 269:112–130. 2014. View Article : Google Scholar : PubMed/NCBI
|
|
17
|
Subramanian A, Tamayo P, Mootha VK,
Mukherjee S, Ebert BL, Gillette MA, Paulovich A, Pomeroy SL, Golub
TR, Lander ES and Mesirov JP: Gene set enrichment analysis: A
knowledge-based approach for interpreting genome-wide expression
profiles. Proc Natl Acad Sci USA. 102:15545–15550. 2005. View Article : Google Scholar : PubMed/NCBI
|
|
18
|
Merico D, Isserlin R, Stueker O, Emili A
and Bader GD: Enrichment map: A network-based method for gene-set
enrichment visualization and interpretation. PLoS One.
5:e139842010. View Article : Google Scholar : PubMed/NCBI
|
|
19
|
Stevens SL, Leung PY, Vartanian KB,
Gopalan B, Yang T, Simon RP and Stenzel-Poore MP: Multiple
preconditioning paradigms converge on interferon regulatory
factor-dependent signaling to promote tolerance to ischemic brain
injury. J Neurosci. 31:8456–8463. 2011. View Article : Google Scholar : PubMed/NCBI
|
|
20
|
Vartanian KB, Stevens SL, Marsh BJ,
Williams-Karnesky R, Lessov NS and Stenzel-Poore MP: LPS
preconditioning redirects TLR signaling following stroke: TRIF-IRF3
plays a seminal role in mediating tolerance to ischemic injury. J
Neuroinflammation. 8:1402011. View Article : Google Scholar : PubMed/NCBI
|
|
21
|
Gautier L, Cope L, Bolstad BM and Irizarry
RA: Affy-analysis of Affymetrix GeneChip data at the probe level.
Bioinformatics. 20:307–315. 2004. View Article : Google Scholar : PubMed/NCBI
|
|
22
|
Kucera M, Isserlin R, Arkhangorodsky A and
Bader GD: AutoAnnotate: A cytoscape app for summarizing networks
with semantic annotations. F1000Res. 5:17172016. View Article : Google Scholar : PubMed/NCBI
|
|
23
|
Yu G, Wang LG, Han Y and He QY:
ClusterProfiler: An R package for comparing biological themes among
gene clusters. OMICS. 16:284–287. 2012. View Article : Google Scholar : PubMed/NCBI
|
|
24
|
Wickham H: Ggplot2: Elegant graphics for
data analysis. Springer New York, Statistics and
Computing/Statistics Programs VIII; pp. 2132009
|
|
25
|
Ritchie ME, Phipson B, Wu D, Hu Y, Law CW,
Shi W and Smyth GK: limma powers differential expression analyses
for RNA-sequencing and microarray studies. Nucleic Acids Res.
43:e472015. View Article : Google Scholar : PubMed/NCBI
|
|
26
|
Kim JB, Piao CS, Lee KW, Han PL, Ahn JI,
Lee YS and Lee JK: Delayed genomic responses to transient middle
cerebral artery occlusion in the rat. J Neurochem. 89:1271–1282.
2004. View Article : Google Scholar : PubMed/NCBI
|
|
27
|
Zhang RL, Chopp M, Chen H and Garcia JH:
Temporal profile of ischemic tissue damage, neutrophil response,
and vascular plugging following permanent and transient (2H) middle
cerebral artery occlusion in the rat. J Neurol Sci. 125:3–10. 1994.
View Article : Google Scholar : PubMed/NCBI
|
|
28
|
Oh SH, Kim OJ, Shin DA, Song J, Yoo H, Kim
YK and Kim JK: Alteration of immunologic responses on peripheral
blood in the acute phase of ischemic stroke: Blood genomic
profiling study. J Neuroimmunol. 249:60–65. 2012. View Article : Google Scholar : PubMed/NCBI
|
|
29
|
Shao X, Bao W, Hong X, Jiang H and Yu Z:
Identification and functional analysis of differentially expressed
genes associated with cerebral ischemia/reperfusion injury through
bioinformatics methods. Mol Med Rep. 18:1513–1523. 2018.PubMed/NCBI
|
|
30
|
Wang C, Liu M, Pan Y, Bai B and Chen J:
Global gene expression profile of cerebral ischemia-reperfusion
injury in rat MCAO model. Oncotarget. 8:74607–74622. 2017.
View Article : Google Scholar : PubMed/NCBI
|
|
31
|
Kamme F and Wieloch T: Induction of junD
mRNA after transient forebrain ischemia in the rat. Effect of
hypothermia. Brain Res Mol Brain Res. 43:51–56. 1996. View Article : Google Scholar : PubMed/NCBI
|
|
32
|
Sola A, Rogido M, Lee BH, Genetta T and
Wen TC: Erythropoietin after focal cerebral ischemia activates the
Janus kinase-signal transducer and activator of transcription
signaling pathway and improves brain injury in postnatal day 7
rats. Pediatr Res. 57:481–487. 2005. View Article : Google Scholar : PubMed/NCBI
|
|
33
|
Marden JJ, Zhang Y, Oakley FD, Zhou W, Luo
M, Jia HP, McCray PB Jr, Yaniv M, Weitzman JB and Engelhardt JF:
JunD protects the liver from ischemia/reperfusion injury by
dampening AP-1 transcriptional activation. J Biol Chem.
283:6687–6695. 2008. View Article : Google Scholar : PubMed/NCBI
|
|
34
|
Harari OA and Liao JK: NF-kappaB and
innate immunity in ischemic stroke. Ann NY Acad Sci. 1207:32–40.
2010. View Article : Google Scholar
|
|
35
|
Koschmieder S, Rosenbauer F, Steidl U,
Owens BM and Tenen DG: Role of transcription factors C/EBPalpha and
PU.1 in normal hematopoiesis and leukemia. Int J Hematol.
81:368–377. 2005. View Article : Google Scholar : PubMed/NCBI
|
|
36
|
Zhang H, Gao W, Qian T, Tang J and Li J:
Transcription factor changes following long term cerebral
ischemia/reperfusion injury. Neural Regen Res. 8:916–921.
2013.PubMed/NCBI
|
|
37
|
Walton M, Saura J, Young D, MacGibbon G,
Hansen W, Lawlor P, Sirimanne E, Gluckman P and Dragunow M:
CCAAT-enhancer binding protein alpha is expressed in activated
microglial cells after brain injury. Brain Res Mol Brain Res.
61:11–22. 1998. View Article : Google Scholar : PubMed/NCBI
|
|
38
|
Jin F, Li Y, Ren B and Natarajan R: PU.1
and C/EBP(alpha) synergistically program distinct response to
NF-kappaB activation through establishing monocyte specific
enhancers. Proc Natl Acad Sci USA. 108:5290–5295. 2011. View Article : Google Scholar : PubMed/NCBI
|
|
39
|
Formisano L, Guida N, Valsecchi V, Cantile
M, Cuomo O, Vinciguerra A, Laudati G, Pignataro G, Sirabella R, Di
Renzo G and Annunziato L: Sp3/REST/HDAC1/HDAC2 Complex represses
and sp1/HIF-1/p300 complex activates ncx1 gene transcription, in
brain ischemia and in ischemic brain preconditioning, by epigenetic
mechanism. J Neurosci. 35:7332–7348. 2015. View Article : Google Scholar : PubMed/NCBI
|
|
40
|
Gelderblom M, Weymar A, Bernreuther C,
Velden J, Arunachalam P, Steinbach K, Orthey E, Arumugam TV,
Leypoldt F, Simova O, et al: Neutralization of the IL-17 axis
diminishes neutrophil invasion and protects from ischemic stroke.
Blood. 120:3793–3802. 2012. View Article : Google Scholar : PubMed/NCBI
|
|
41
|
Tanimura A, Dan S and Yoshida M: Cloning
of novel isoforms of the human Gli2 oncogene and their activities
to enhance tax-dependent transcription of the human T-cell leukemia
virus type 1 genome. J Virol. 72:3958–3964. 1998.PubMed/NCBI
|
|
42
|
Regl G, Kasper M, Schnidar H, Eichberger
T, Neill GW, Philpott MP, Esterbauer H, Hauser-Kronberger C,
Frischauf AM and Aberger F: Activation of the BCL2 promoter in
response to Hedgehog/GLI signal transduction is predominantly
mediated by GLI2. Cancer Res. 64:7724–7731. 2004. View Article : Google Scholar : PubMed/NCBI
|
|
43
|
Zhang L, Chopp M, Meier DH, Winter S, Wang
L, Szalad A, Lu M, Wei M, Cui Y and Zhang ZG: Sonic hedgehog
signaling pathway mediates cerebrolysin-improved neurological
function after stroke. Stroke. 44:1965–1972. 2013. View Article : Google Scholar : PubMed/NCBI
|
|
44
|
Shi D, Xie F, Zhang Y, Tian Y, Chen W, Fu
L, Wang J, Guo W, Kang T, Huang W and Deng W: TFAP2A regulates
nasopha-ryngeal carcinoma growth and survival by targeting
HIF-1alpha signaling pathway. Cancer Prev Res (Phila). 7:266–277.
2014. View Article : Google Scholar
|
|
45
|
Lin HH, Chen YH, Chiang MT, Huang PL and
Chau LY: Activator protein-2alpha mediates carbon monoxide-induced
stromal cell-derived factor-1alpha expression and vascularization
in ischemic heart. Arterioscler Thromb Vasc Biol. 33:785–794. 2013.
View Article : Google Scholar : PubMed/NCBI
|