Introduction
Breast cancer (BC) is the most common female
malignancy and the second leading cause of mortality in women
worldwide (1). According to the
World Health Organization in 2012, one-third of Asian women develop
BC (2,3). Currently, BC treatment includes
partial excision with or without radiotherapy and systemic
therapies such as endocrine therapy, chemotherapy, molecular
targeted therapy, and a combination of them (4). Although advanced therapeutic
techniques based on surgery have considerably improved the survival
of patients with BC and the five-year survival has increased from
75% in 1976 to 91% in 2017, high rates of metastasis and recurrence
remain (1,5,6).
Recently, molecular targeted therapy has been shown to play an
important role in individualized treatment of BC. For instance, a
monoclonal antibody against HER2, trastuzumab, has been
demonstrated to improve survival of patients with BC; however, the
prognosis remains poor (7,8).
Therefore, to improve BC prognosis, effective therapeutic targets
and prognostic biomarkers are needed.
NDC80 kinetochore complex component (NUF2),
also known as CDCA1, is a centromere-related protein (9). It regulates the binding of
centromeres to spindle microtubules, participates in cell cycle
regulation and has important roles in cell proliferation and
apoptosis (10). NUF2 is
overexpressed in a number of cancers, including lung cancer,
cholangiocarcinoma, renal cell carcinoma and bladder cancer
(11). Although the expression
and prognostic significance of NUF2 in BC have been
suggested (12,13), its precise role and underlying
molecular mechanisms of action remain to be investigated.
In the present study, 4 mRNA microarray datasets
were analyzed from the Gene Expression Omnibus (GEO) and The Cancer
Genome Atlas (TCGA) databases to identify differentially expressed
genes (DEGs) between BC tissues and normal breast tissues. The
bioinformatics analysis and literature mining suggested that
NUF2 is a key gene in the progression of BC. The expression
of NUF2 in BC samples and its correlation with clinical
pathological characteristics were then analyzed. In addition, the
prognostic value of NUF2 was analyzed using individual and
pooled methods. In a gene set enrichment analysis (GSEA), it was
demonstrated that NUF2 might be involved in cell-cycle
related pathways. The results of the present study suggest that
NUF2 is a prognostic indicator of BC.
Materials and methods
Microarray data
GSE42568 (14),
GSE45827 (15), GSE65194
(16) and TCGA BC microarray
datasets, downloaded from GEO (17) and TCGA (18), were used to screen DEGs in BC. The
TCGA dataset was used for analyses of clinical pathological
characteristics associated with NUF2 in patients with BC.
The following 5 additional BC microarray datasets were selected for
prognostic analyses: GSE1456 (19), GSE22220 (20), NKI (21), GSE4299 (22) and GSE20685 (23). To normalize mRNA levels, patients
for each dataset were reclassified into four subsets (X1, X2, X3
and X4) based on the quartile for expression values. The datasets
were then reclassified into a new dataset for a pooled
analysis.
DEG identification
BC-related microarray data downloaded from the GEO
and TCGA databases were processed using R software (version 3.4.3;
https://cran.r-project.org/). DEGs
between BC tissues and normal breast tissues were identified using
the limma package in R. Fold-change (FC) values were calculated and
the DEGs were further selected based on the following cutoff
criteria: P<0.01 and log |FC|>2. Overlapping DEGs among the
four datasets were identified using Funrich (version 3.1.3;
http://www.funrich.org).
Functional and pathway enrichment
analyses of DEGs
Gene Ontology (GO) is used to identify enriched
functions of genes in three independent categories: Biological
process (BP), molecular function (MF) and cellular component (CC)
(24). Kyoto Encyclopedia of
Genes and Genomes (KEGG) was used to identify relevant pathways for
the genes (25). GO BP and KEGG
signaling pathway analyses of the DEGs were performed using the
Database for Annotation Visualization and Integrated Discovery
(DAVID) online tool (https://david.ncifcrf.gov/) (26) with P<0.05 as the threshold for
significance.
Protein-protein interaction (PPI) network
analysis
The Search Tool for the Retrieval of Interacting
Genes (STRING; https://string-db.org/) was used to
develop a PPI network. Using the STRING database, DEGs with a
combined score ≥0.4 were chosen to construct the network, which was
visualized using Cytoscape (version 3.6.1) (27). Molecular Complex Detection
(MCODE), a plugin for Cytoscape, was used to construct functional
modules in the PPI network.
Gene set enrichment analysis (GSEA)
A GSEA was conducted based on protocols obtained
from the website (http://software.broadinstitute.org/gsea/index.jsp) and
a previous study (28). GSEA
(version 3.0) was run for the KEGG gene sets
(c2.cp.kegg.v.6.0.symbols.gmt). The number of permutations was set
to 1,000 and the phenotype labels were NUF2-high and
NUF2-low. FDR <0.25 and NOM P<0.05 indicated
statistical significance.
Oncomine analysis
Oncomine (https://www.oncomine.org/) is an online cancer
microarray database, aiming to facilitate the discovery of novel
biomarkers from genome-wide expression analyses. In the present
study, the mRNA expression differences of NUF2 between BC
and normal breast tissues were explored using the Oncomine
database.
Patients and samples
BC and matched adjacent tissues were collected from
the Pathology Department of Shaoxing People's Hospital (Shaoxing,
China). Samples were obtained from 42 patients at initial diagnosis
and were immediately frozen in liquid nitrogen. The present study
was authorized by the Hospital Ethics Committee and informed
consent was obtained from all patients.
Reverse transcription (RT)-quantitative
(q)PCR
Total RNA was isolated from the BC and matched
adjacent tissues using TRIzol (Invitrogen; Thermo Fisher
Scientific, Inc., Waltham, MA, USA). The Nanodrop 2000 (Thermo
Fisher Scientific, Inc.) was used to detect the purity and
concentration of the total RNA. According to the manufacturer's
protocol, RT-qPCR was performed using the LightCycler®
480 PCR apparatus (Roche Diagnostics, Basel, Switzerland) and the
One Step SYBR® PrimeScript™ RT-PCR kit II (Takara Bio,
Inc., Otsu, Japan). Amplification was performed under the following
conditions: 42°C for 5 min, 95°C for 10 sec; 40 cycles of 95°C for
5 sec and 60°C for 20 sec; and 65°C for 15 sec. The primers used
were as follows: NUF2 forward primer
5′-TACCATTCAGCAATTTAGTTACT-3′ and reverse primer
5′-TAGAATATCAGCAGTCTCAAAG-3′; and β-actin forward primer
5′-CATGTACGTTGCTATCCAGGC-3′ and reverse primer
5′-CTCCTTAATGTCACGCACGAT-3′. The relative levels of NUF2
expression were evaluated by the 2−ΔΔCq (29) method using β-actin as the
control.
Statistical analyses
All statistical analyses were performed using SPSS
20.0 (IBM Corps., Armonk, NY, USA). An independent t-test was used
for analyzing the continuous data. The χ2 test and
χ2 test with continuity correction were performed to
analyze the association of NUF2 with clinical pathological
characteristics. Bonferroni's post hoc test was used to analyze the
clinical pathological characteristics between more than 2 groups.
Survival curves were generated by the Kaplan-Meier method and
significance was determined using the log-rank test. Bonferroni's
post hoc test was used for pairwise comparisons. Multivariable
survival analysis was performed using the Cox proportional hazards
regression model and significance was determined using the
likelihood ratio test. P<0.05 was considered to indicate
statistically significant differences, while for Bonferroni's test,
P<0.05/N was considered to indicate statistically significant
differences, where N=the number of pairwise comparisons.
Results
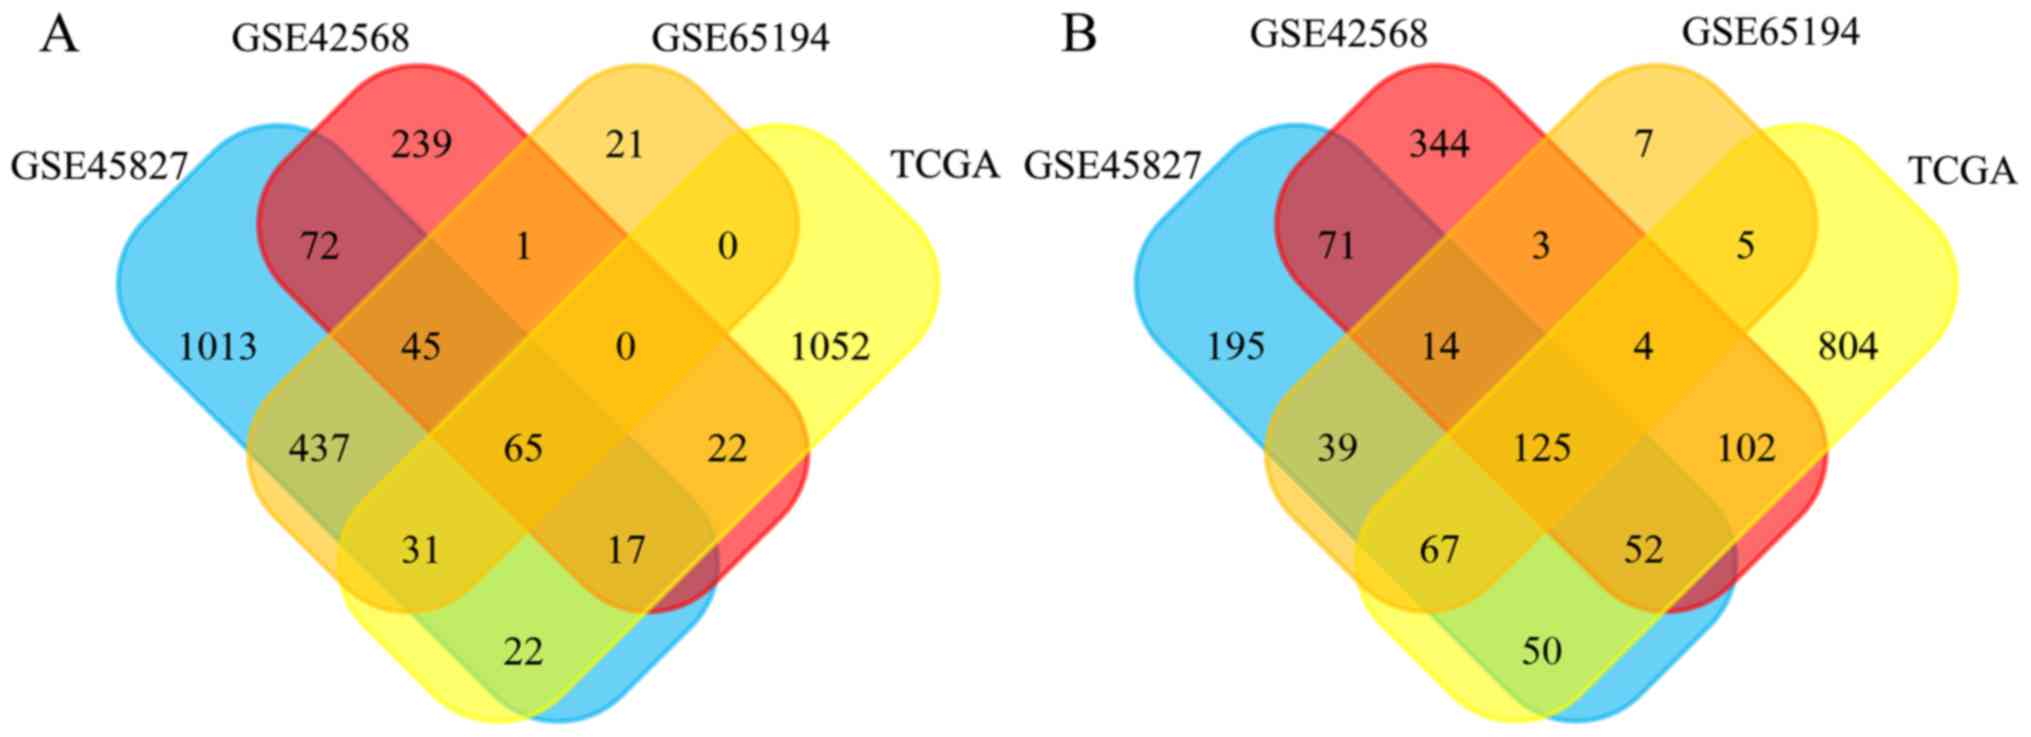
Identification of DEGs in BC
DEGs between the BC and normal breast tissues were
screened using the GEO and TCGA databases. As shown in Fig. 1A, 1,702, 461, 600 and 337 DEGs
were upregulated in the GSE45827, GSE42568, GSE65194, and TCGA
datasets, and 613, 715, 264, and 872 DEGs were downregulated,
respectively (Fig. 1B). In total,
190 DEGs exhibited the same expression trends in all datasets,
including 65 upregulated and 125 downregulated genes.
Functional and pathway enrichment for the
DEGs
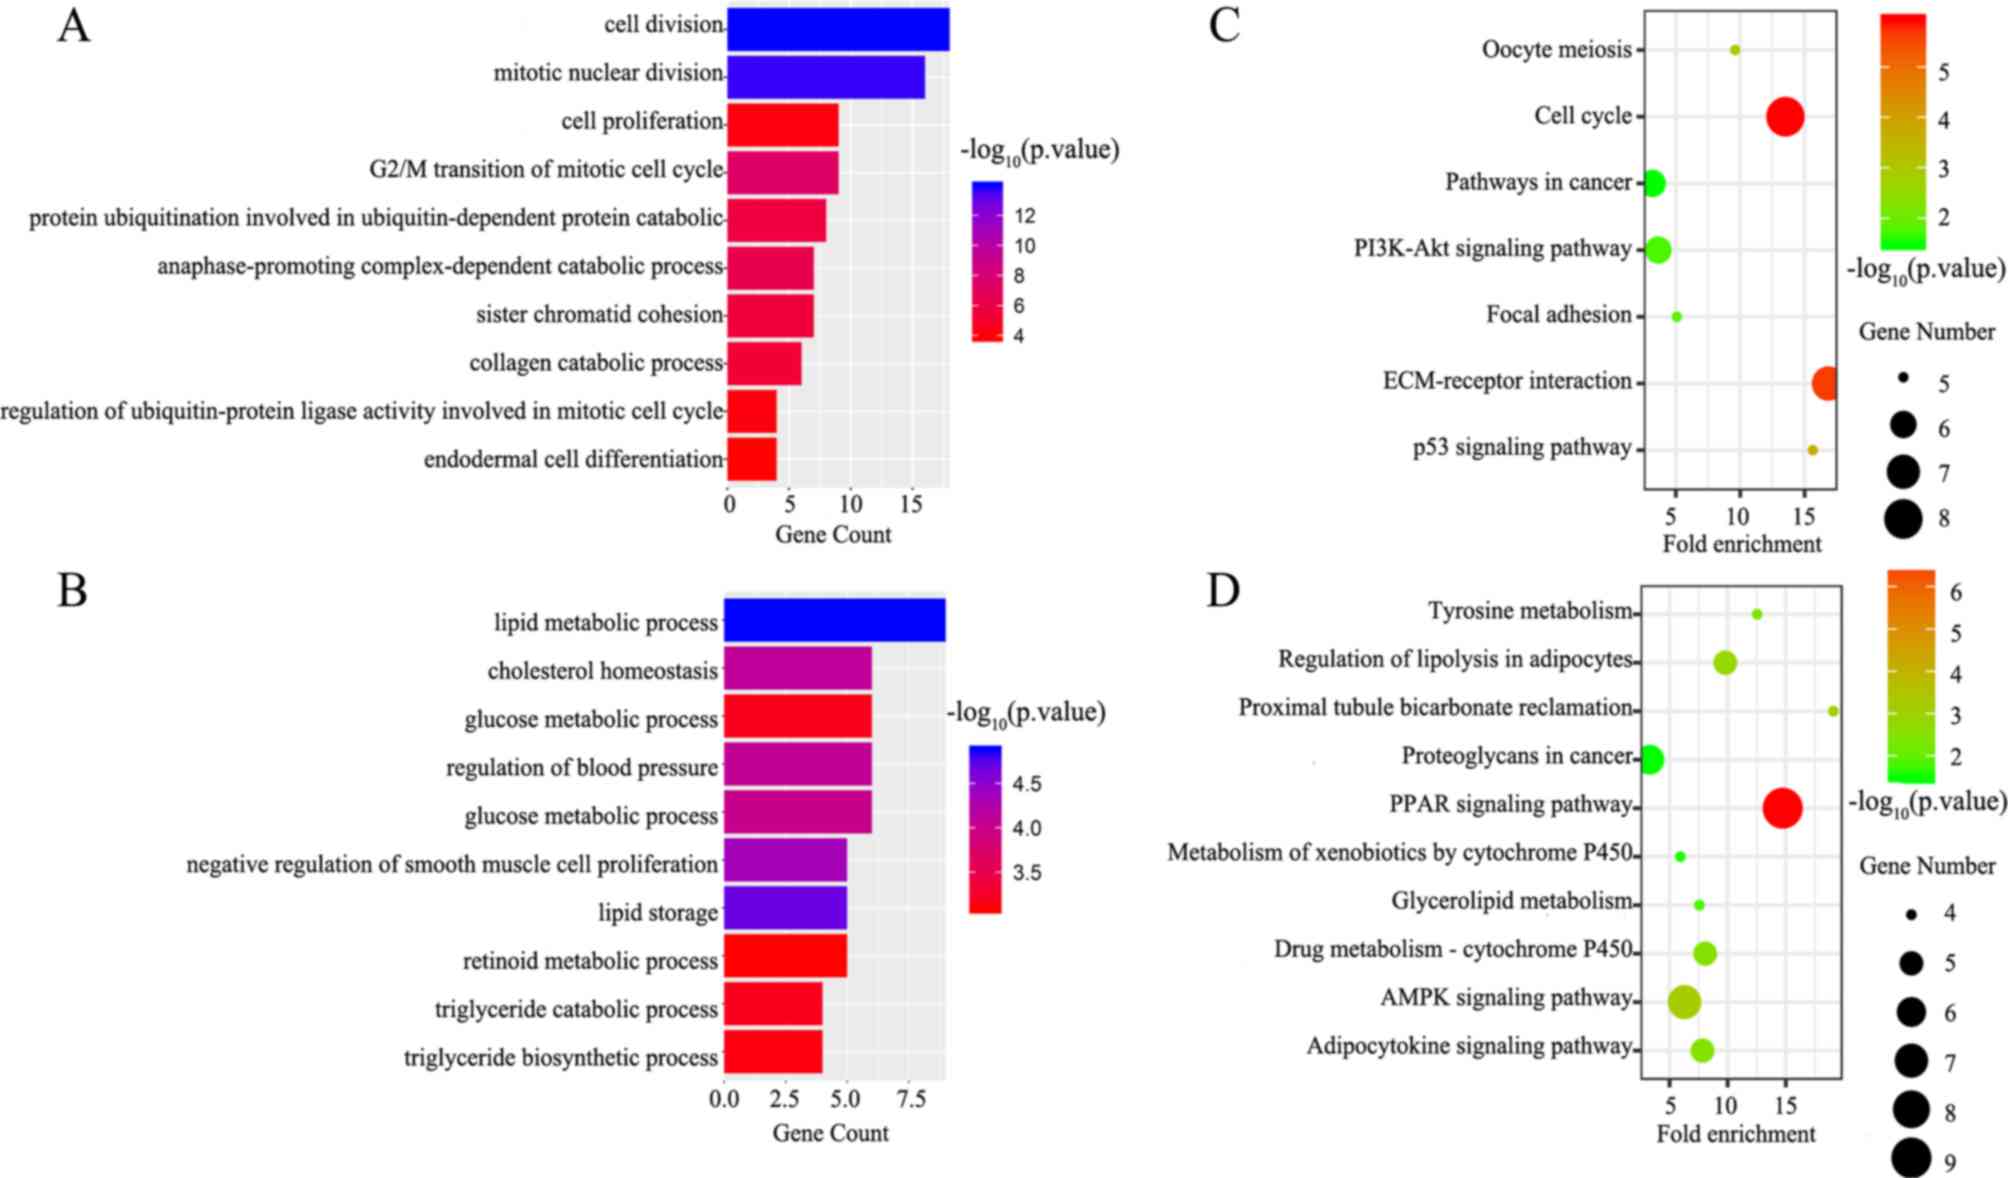
GO BP and KEGG signaling pathway analyses of the
DEGs were performed using DAVID. The upregulated DEGs were mainly
enriched for the BP terms cell division, mitotic nuclear division
and G2/M transition of mitotic cell cycle (Fig. 2A), while downregulated DEGs were
significantly associated with lipid metabolic process, cholesterol
homeostasis, and glucose metabolic process (Fig. 2B). Additionally, seven KEGG
pathways were identified for the upregulated genes, including the
p53 signaling pathway, cell cycle and extracellular matrix
(ECM)-receptor interaction (Fig.
2C). The peroxisome proliferator-activated receptor (PPAR)
signaling pathway, AMP-activated protein kinase (AMPK) signaling
pathway and proximal tubule bicarbonate reclamation were associated
with the downregulated DEGs (Fig.
2D). The detailed results are presented in Table I.
 | Table ISignificantly enriched GO biological
process terms and KEGG pathways. |
Table I
Significantly enriched GO biological
process terms and KEGG pathways.
A, Upregulated
|
|---|
| Terms | Description | Number of
genes | P-value |
|---|
| GO Terms |
| GO:0051301 | Cell division | 18 |
1.02×10⁻¹⁴ |
| GO:0007067 | Mitotic nuclear
division | 16 |
1.90×10⁻¹⁴ |
| GO:0000086 | G2/M transition of
mitotic cell cycle | 9 |
4.82×10−08 |
| GO:0031145 | Anaphase-promoting
complex-dependent catabolic process | 7 |
5.40×10−07 |
| GO:0042787 | Protein
ubiquitination involved in Ubiquitin-dependent protein catabolic
process | 8 |
1.83×10−06 |
| GO:0007062 | Sister chromatid
cohesion | 7 |
2.58×10−06 |
| GO:0030574 | Collagen catabolic
process | 6 |
4.40×10−06 |
| GO:0008283 | Cell
proliferation | 9 |
7.20×10−05 |
| GO:0051439 | Regulation of
ubiquitin-protein ligase activity involved in mitotic cell
cycle | 4 |
8.86×10−05 |
| GO:0035987 | Endodermal cell
differentiation | 4 |
1.45×10−04 |
| KEGG pathways |
| hsa04110 | Cell cycle | 8 |
1.17×10−06 |
| hsa04512 | ECM-receptor
interaction | 7 |
2.33×10−06 |
| hsa04115 | p53 signaling
pathway | 5 | 0.000237 |
| hsa04114 | Oocyte meiosis | 5 | 0.001499 |
| hsa04510 | Focal adhesion | 5 | 0.014347 |
| hsa04151 | PI3K-Akt signaling
pathway | 6 | 0.019962 |
| hsa05200 | Pathways in
cancer | 6 | 0.032832 |
B, Downregulated
|
| Terms | Description | Number of
genes | P-value |
GO Terms |
| GO:0006629 | Lipid metabolic
process | 9 |
1.32×10−05 |
| GO:0019915 | Lipid storage | 5 |
2.06×10−05 |
| GO:0048662 | Negative regulation
of smooth muscle cell proliferation | 5 |
4.49×10−05 |
| GO:0042632 | Cholesterol
homeostasis | 6 |
7.95×10−05 |
| GO:0008217 | Regulation of blood
pressure | 6 |
8.56×10−05 |
| GO:0006006 | Glucose metabolic
process | 6 |
9.90×10−05 |
| GO:0019433 | Triglyceride
catabolic process | 4 |
6.61×10−04 |
| GO:0042593 | Glucose
homeostasis | 6 |
6.74×10−04 |
| GO:0019432 | Triglyceride
biosynthetic process | 4 |
7.44×10−04 |
| GO:0001523 | Retinoid metabolic
process | 5 |
8.33×10−04 |
| KEGG pathways |
| hsa03320 | PPAR signaling
pathway | 9 |
1.14×10−07 |
| hsa04152 | AMPK signaling
pathway | 7 |
7.34×10−04 |
| hsa04964 | Proximal tubule
bicarbonate reclamation | 4 | 0.001072 |
| hsa04923 | Regulation of
lipolysis in adipocytes | 5 | 0.001523 |
| hsa00982 | Drug
metabolism-cytochrome P450 | 5 | 0.003116 |
| hsa04920 | Adipocytokine
signaling pathway | 5 | 0.003462 |
| hsa00350 | Tyrosine
metabolism | 4 | 0.00367 |
| hsa00561 | Glycerolipid
metabolism | 4 | 0.014956 |
| hsa00980 | Metabolism of
xenobiotics by cytochrome P450 | 4 | 0.028412 |
| hsa05205 | Proteoglycans in
cancer | 6 | 0.033006 |
PPI network analysis and the selection of
NUF2
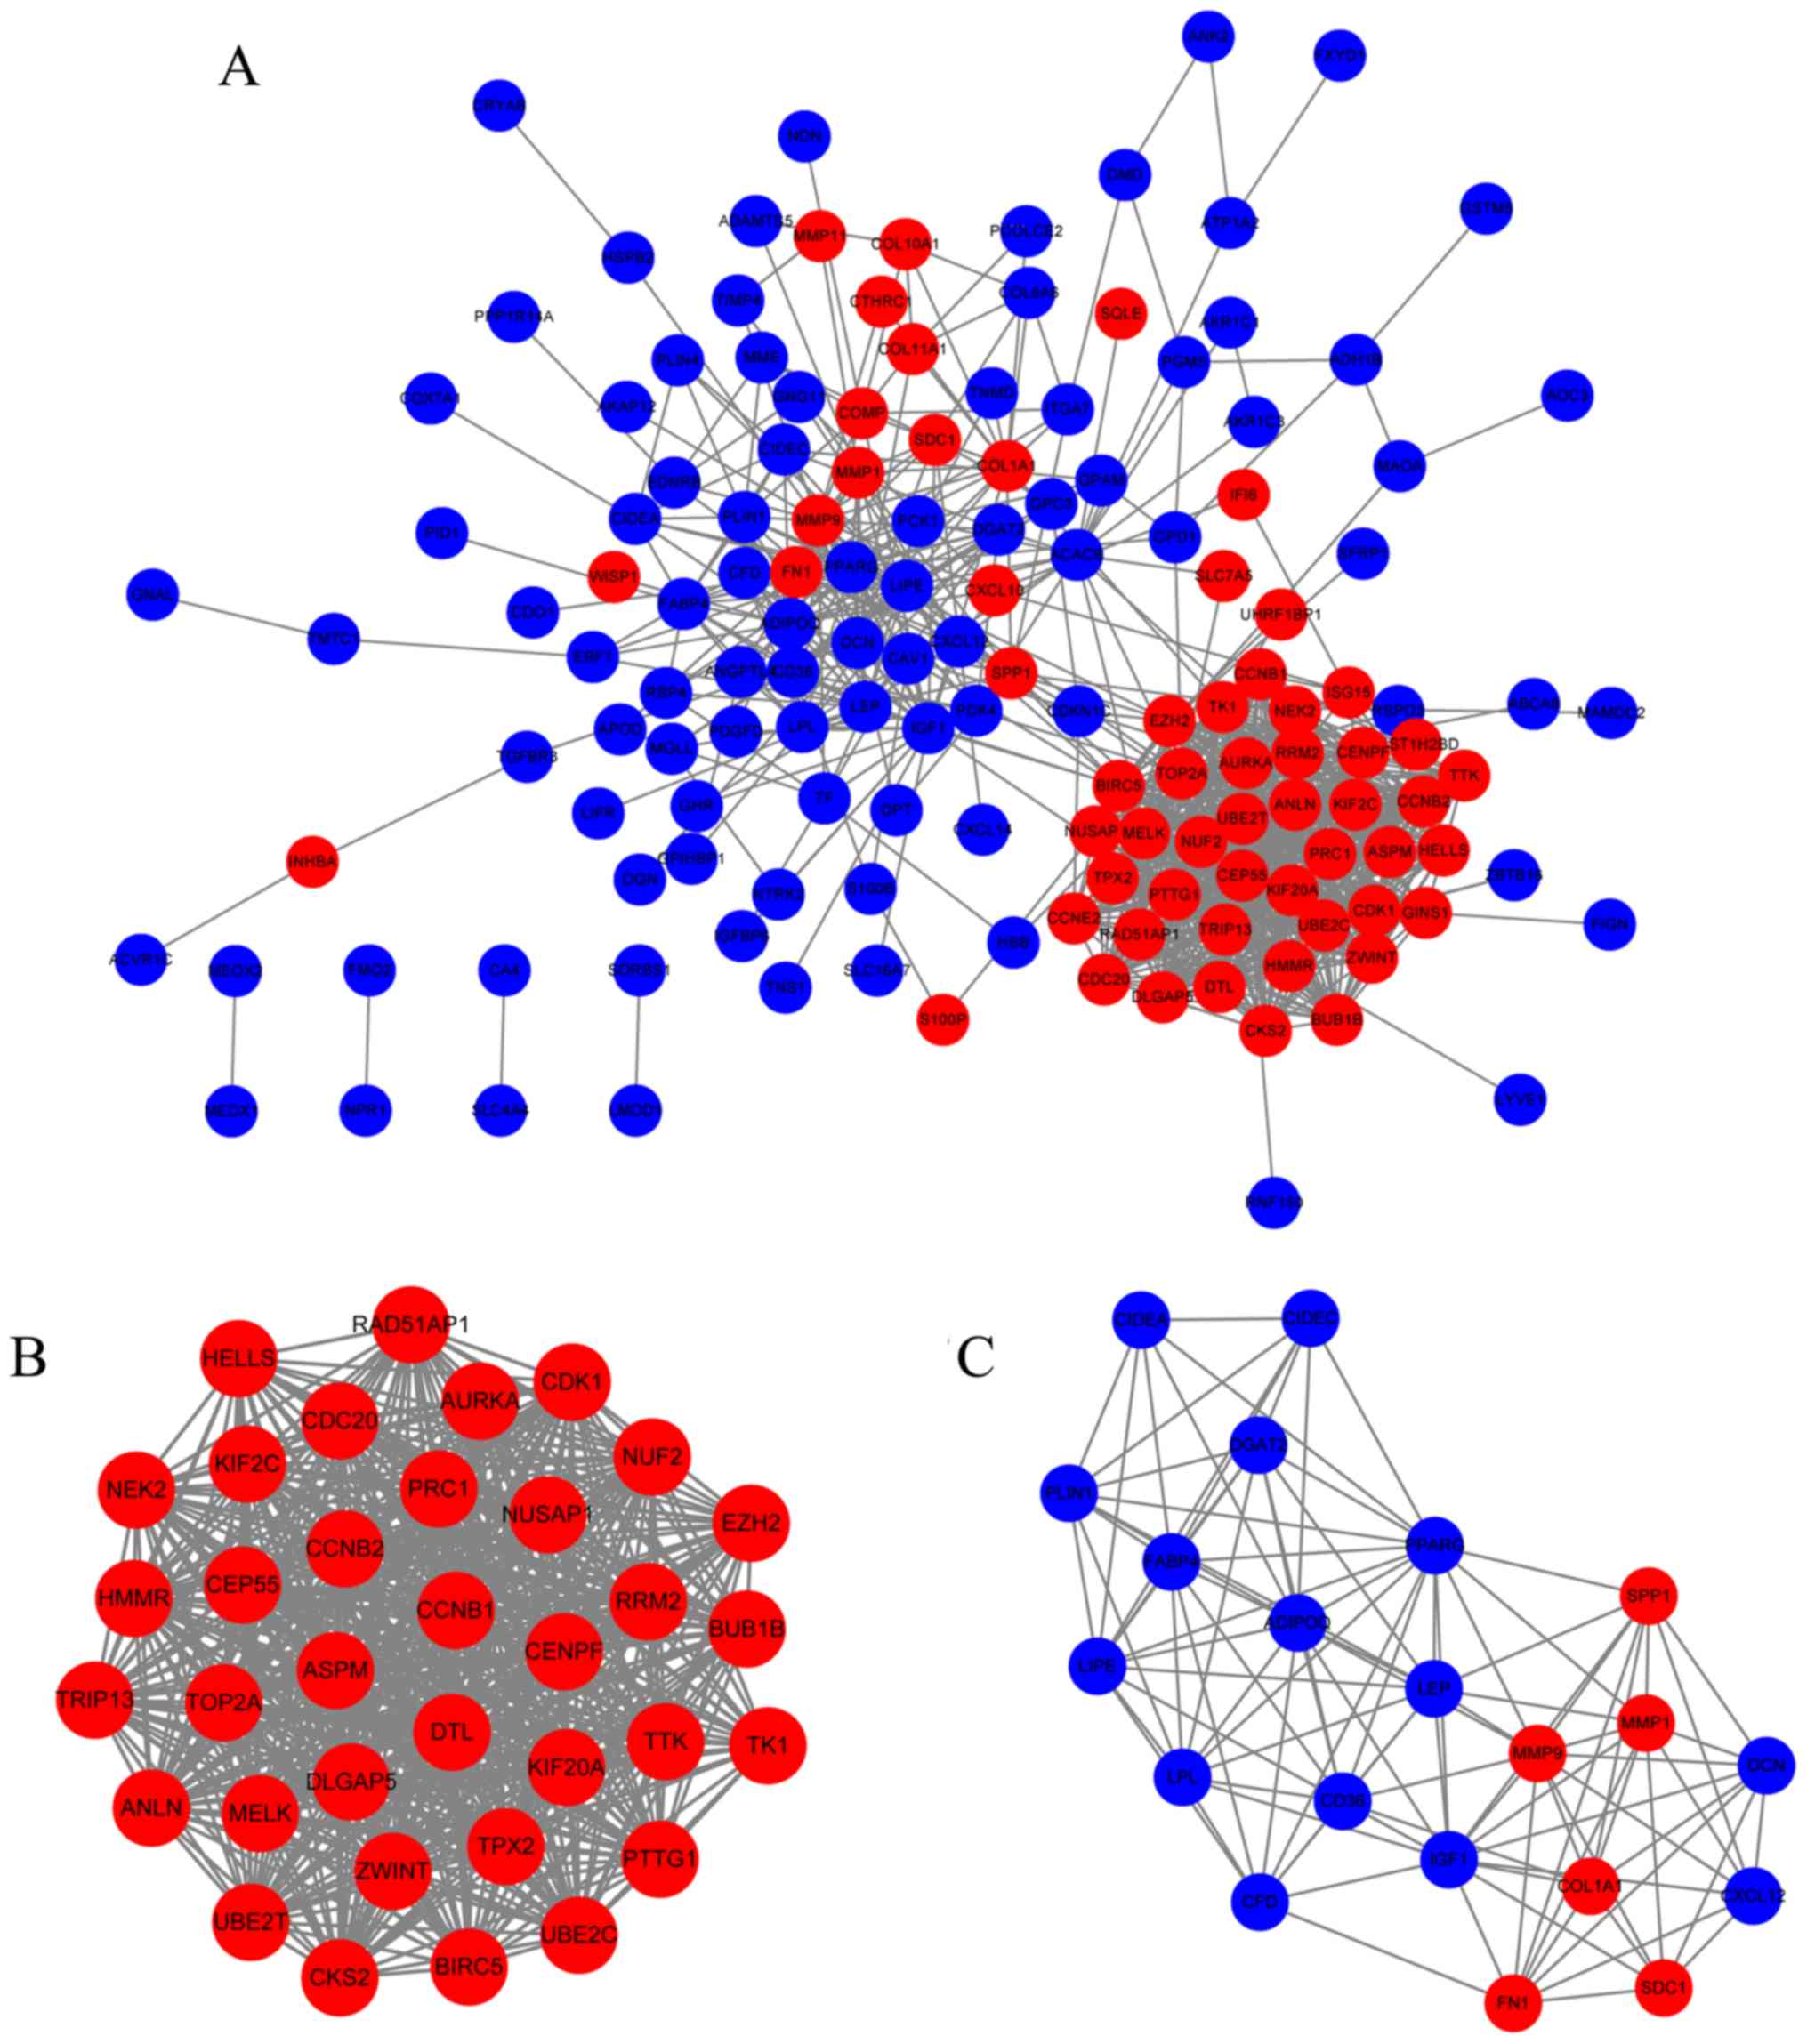
Protein interactions often play important roles in
cancer progression. A PPI network analysis was performed using the
STRING database and Cytoscape. The PPI network was constructed
using 149 DEGs (57 upregulated and 92 downregulated DEGs) with
combined scores ≥0.4, and contained 149 nodes and 930 edges
(Fig. 3A). A total of two
functional modules were identified using the MCODE plugin. Module 1
consisted of 35 nodes and 573 edges including NUF2, TOP2A,
ASPM, and CCNB1 (Fig.
3B). Module 2 included 21 nodes and 104 edges including
COL1A1, MMP1, MMP9, and LPL (Fig. 3C). Based on the degree of
importance, module 1 was chosen for further analysis.
The 35 genes in module 1 were ranked based on log
|FC| values in the TCGA database and selected the top 10 hub genes
for further analysis. The expression levels of the 10 hub genes in
the BC tissues were >10-fold (log |FC|≥3.42) increased compared
with those in the normal breast tissues. Through literature mining,
it was identified that UBE2C, ASPM, BIRC5, TOP2A, KIF20A, CEP55,
TPX2, NEK2 and ANLN, but not NUF2, have been
reported extensively in BC-related studies. Therefore, NUF2
was selected as the focus of subsequent analyses.
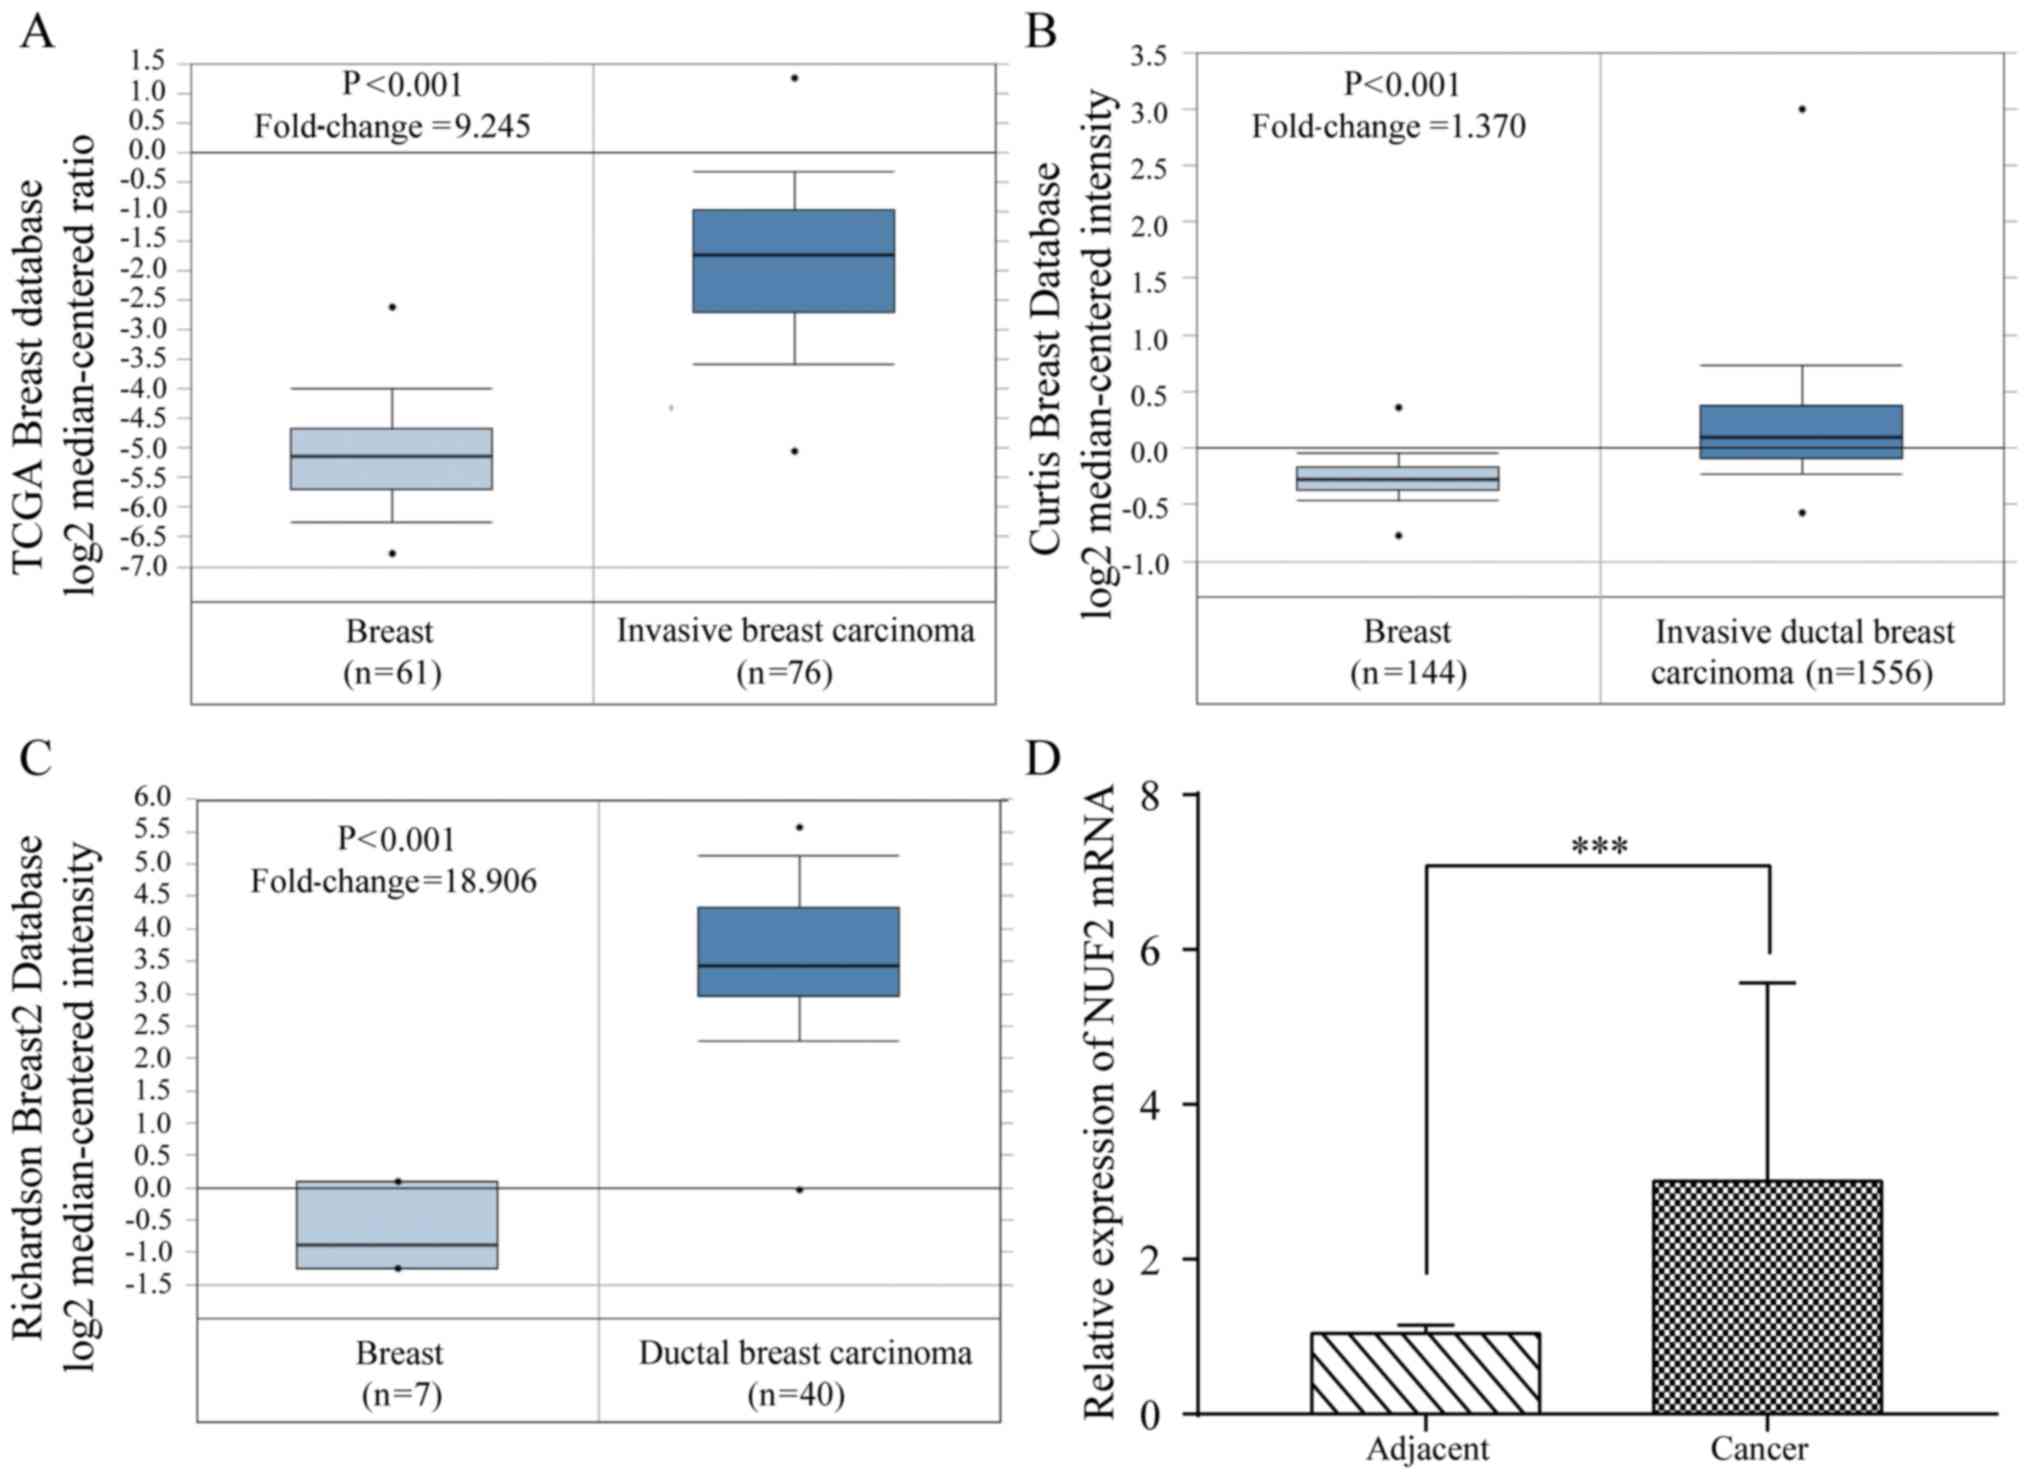
NUF2 expression in BC
The expression of NUF2 mRNA in the BC tissues
was evaluated using Oncomine (https://www.oncomine.org/) (30). The results indicated that the
NUF2 expression level is significantly increased in the BC
tissues compared with in the normal breast tissues (P<0.01;
Fig. 4A-C). To further verify
these results, 42 pairs of BC tissues and adjacent tissues were
analyzed by RT-qPCR. Consistent with the results of the database
analysis, the expression of NUF2 mRNA in the BC tissues was
significantly increased (P<0.001) compared with in the adjacent
tissues (Fig. 4D).
Association of NUF2 with clinical
pathological characteristics and survival of patients with BC
To further validate the clinical value of
NUF2, the association between its expression and the
clinical pathological characteristics of the 42 patients with BC
recruited from Shaoxing People's Hospital were assessed. The
expression of NUF2 was only significantly associated with
age (P<0.05). Using the data in the TCGA database (contains data
on 1,090 patients with BC), NUF2 expression was found to be
significantly associated with age (P<0.001), estrogen receptor
(ER) status (P<0.001), progesterone receptor (PR) status
(P<0.001), histological type (P<0.001), TNM stage
(P<0.05), and molecular subtype (P<0.001). The results are
shown in Tables II and III. Furthermore, the clinical
pathological characteristics that have multiple groups (>2) need
a post hoc test to determine exactly what groups exhibit a
difference. Therefore, Bonferroni's post hoc test was used for
pairwise comparison. The results showed that NUF2 expression
is statistically different between TNM stage 1 and 2 (P<0.01),
and tumor stage T1 and T2 (P<0.001). In terms of molecular
subtype, NUF2 expression was also significantly different in
all pairwise comparisons (P<0.001) except between luminal A and
normal-like, and luminal B and basal-like. The detailed results are
shown in Tables IV and V.
| Table IIAssociation of NUF2 with
clinical pathological characteristics of breast cancer patients
from Shaoxing People's Hospital. |
Table II
Association of NUF2 with
clinical pathological characteristics of breast cancer patients
from Shaoxing People's Hospital.
| Pathological
characteristics | Number of patients
(%) | NUF2 (%)
| P-valuea |
|---|
| Low | High |
|---|
| Age | | | | 0.031 |
| <60 | 21 (50.0) | 14 (66.7) | 7 (33.3) | |
| ≥60 | 21 (50.0) | 7 (33.3) | 14 (66.7) | |
| HER2 status | | | | 0.05 |
| Positive | 14 (33.3) | 10 (71.4) | 4 (29.6) | |
| Negative | 28 (66.7) | 11 (39.3) | 17 (60.7) | |
| ER status | | | | 0.679b |
| Positive | 35 (83.3) | 17 (48.6) | 18 (51.4) | |
| Negative | 7 (16.7) | 4 (57.1) | 3 (42.9) | |
| PR status | | | | 0.107 |
| Positive | 27 (64.3) | 11 (40.7) | 16 (59.3) | |
| Negative | 15 (35.7) | 10 (66.7) | 5 (33.3) | |
| TNM stage | | | | 0.751 |
| 1 | 12 (28.6) | 5 (41.7) | 7 (58.3) | |
| 2 | 25 (59.5) | 13 (52.0) | 12 (48.0) | |
| 3 | 5 (11.9) | 3 (60.0) | 2 (40.0) | |
| Tumor stage | | | | 0.333 |
| T1 | 19 (45.2) | 8 (42.1) | 11 (57.9) | |
| T2 | 22 (52.4) | 13 (59.1) | 9 (40.9) | |
| T3 | 1 (2.4) | 0 (0.0) | 1 (100.0) | |
| Lymph node
stage | | | | 0.946 |
| N0 | 27 (64.3) | 13 (48.1) | 14 (51.9) | |
| N1 | 10 (23.8) | 5 (50.0) | 5 (50.0) | |
| N2 | 3 (7.1) | 2 (66.7) | 1 (33.3) | |
| N3 | 2 (4.3) | 1 (50.0) | 1 (50.0) | |
| Node
metastasis | | | | 0.533 |
| Yes | 18 (42.9) | 10 (55.6) | 8 (44.4) | |
| No | 24 (57.1) | 11 (45.8) | 13 (54.2) | |
| Table IIIAssociation of NUF2 with
clinical pathological characteristics of breast cancer patients
derived from TCGA database. |
Table III
Association of NUF2 with
clinical pathological characteristics of breast cancer patients
derived from TCGA database.
| Pathological
characteristics | Number of patients
(%) | NUF2 (%)
| P-valuea |
|---|
| Low | High |
|---|
| Age | | | | <0.001 |
| <60 | 579 (53.2) | 255 (44.0) | 324 (66.0) | |
| ≥60 | 510 (46.8) | 289 (56.7) | 221 (43.3) | |
| HER2 status | | | | 0.296 |
| Positive | 90 (21.4) | 39 (43.3) | 51 (56.7) | |
| Negative | 331 (78.6) | 164 (49.5) | 167 (50.5) | |
| ER status | | | | <0.001 |
| Positive | 803 (77.2) | 467 (58.2) | 336 (41.8) | |
| Negative | 237 (22.8) | 60 (25.3) | 177 (74.7) | |
| PR status | | | | <0.001 |
| Positive | 694 (66.9) | 415 (60.0) | 279 (40.0) | |
| Negative | 343 (33.1) | 110 (32.1) | 233 (67.9) | |
| Histology type | | | | <0.001 |
| IDC | 779 (79.3) | 326 (41.8) | 453 (58.2) | |
| ILC | 203 (20.7) | 156 (76.8) | 47 (23.2) | |
| TNM stage | | | | 0.032 |
| 1 | 181 (17.0) | 108 (59.7) | 73 (40.3) | |
| 2 | 619 (58.0) | 293 (47.3) | 326 (52.7) | |
| 3 | 247 (23.1) | 119 (48.2) | 128 (51.8) | |
| 4 | 20 (1.9) | 10 (50.0) | 10 (50.0) | |
| Tumor stage | | | | <0.001 |
| T1 | 279 (25.7) | 171 (61.3) | 108 (38.7) | |
| T2 | 631 (58.0) | 283 (44.8) | 348 (55.2) | |
| T3 | 137 (12.6) | 71 (51.8) | 66 (48.2) | |
| T4 | 40 (3.7) | 19 (47.5) | 21 (52.5) | |
| Lymph node
stage | | | | 0.095 |
| N0 | 514 (48.0) | 255 (49.6) | 259 (50.4) | |
| N1 | 360 (33.6) | 185 (51.4) | 175 (48.6) | |
| N2 | 120 (11.2) | 48 (40.0) | 72 (60.0) | |
| N3 | 76 (7.2) | 43 (56.6) | 33 (43.4) | |
| Metastasis
stage | | | | 0.82 |
| M0 | 906 (97.6) | 434 (47.9) | 472 (52.1) | |
| M1 | 22 (2.4) | 10 (45.5) | 12 (54.5) | |
| Molecular
subtype | | | | <0.001 |
| Luminal A | 419 (0.5) | 305 (72.8) | 114 (27.2) | |
| Luminal B | 190 (0.23) | 26 (13.7) | 164 (86.3) | |
| HER2+ | 67 (0.08) | 26 (38.8) | 41 (61.2) | |
| Basal-like | 139 (0.16) | 14 (10.1) | 125 (89.9) | |
| Normal-like | 23 (0.03) | 21 (91.3) | 2 (8.7) | |
| Table IVComparison of clinical pathological
characteristics of breast cancer patients from Shaoxing People's
Hospital among multiple groups. |
Table IV
Comparison of clinical pathological
characteristics of breast cancer patients from Shaoxing People's
Hospital among multiple groups.
| Pathological
characteristics | Pairwise
comparisons (P-values) |
|---|
| TNM stage | 1 | 2 | 3 | |
| 1 | N/A | 0.556 | 0.620 | |
| 2 | 0.556 | N/A | 1.000 | |
| 3 | 0.620 | 1.000 | N/A | |
| Tumor stage | T1 | T2 | T3 | |
| T1 | N/A | 0.278 | 1.000 | |
| T2 | 0.278 | N/A | 0.435 | |
| T3 | 1.000 | 0.435 | N/A | |
| Lymph node
stage | N0 | N1 | N2 | N3 |
| N0 | N/A | 1.000 | 1.000 | 1.000 |
| N1 | 1.000 | N/A | 1.000 | 1.000 |
| N2 | 1.000 | 1.000 | N/A | 1.000 |
| N3 | 1.000 | 1.000 | 1.000 | N/A |
| Table VComparison of clinical pathological
characteristics of breast cancer patients in The Cancer Genome
Atlas database among multiple groups. |
Table V
Comparison of clinical pathological
characteristics of breast cancer patients in The Cancer Genome
Atlas database among multiple groups.
| Pathological
characteristics | Pairwise
comparisons (P-values) |
|---|
| TNM stage | 1 | 2 | 3 | 4 | |
| 1 | N/A | 0.004a | 0.019 | 0.405 | |
| 2 | 0.004a | N/A | 0.822 | 0.814 | |
| 3 | 0.019 | 0.822 | N/A | 0.875 | |
| 4 | 0.405 | 0.814 | 0.875 | N/A | |
| Tumor stage | T1 | T2 | T3 | T4 | |
| T1 | N/A | 0.000a | 0.066 | 0.097 | |
| T2 | 0.000a | N/A | 0.138 | 0.744 | |
| T3 | 0.066 | 0.138 | N/A | 0.630 | |
| T4 | 0.097 | 0.744 | 0.630 | N/A | |
| Lymph node
stage | N0 | N1 | N2 | N3 | |
| N0 | N/A | 0.605 | 0.058 | 0.257 | |
| N1 | 0.605 | N/A | 0.031 | 0.410 | |
| N2 | 0.058 | 0.031 | N/A | 0.023 | |
| N3 | 0.257 | 0.410 | 0.023 | N/A | |
| Molecular
subtype | Luminal A | Luminal B | HER2+ | Basal-like | Normal-like |
| Luminal A | N/A | 0.000a | 0.000a | 0.000a | 0.049 |
| Luminal B | 0.000a | N/A | 0.000a | 0.322 | 0.000a |
| HER2+ | 0.000a | 0.000a | N/A | 0.000a | 0.000a |
| Basal-like | 0.000a | 0.322 | 0.000a | N/A | 0.000a |
| Normal-like | 0.049 | 0.000a | 0.000a | 0.000a | N/A |
Furthermore, to elucidate the correlation between
the expression of NUF2 and patient survival, 5 GEO datasets
were used. Samples from each dataset were reclassified into four
subsets (X1, X2, X3 and X4) according to the quartile of
NUF2 expression. The X1 subset was set with the lowest
expression as the reference to calculate the hazard ratio (HR).
Each dataset was analyzed by Kaplan-Meier analysis and Cox
proportional hazard analysis. High NUF2 expression was
associated with shorter overall survival (OS) and progression-free
survival (PFS) compared with low NUF2 expression in the
GSE1456 dataset (Fig. 5A and B)
and NKI dataset (Fig. 5C and D).
Similar results were obtained in the GEO pooled analysis, as shown
in Fig. 5E and F. Based on a
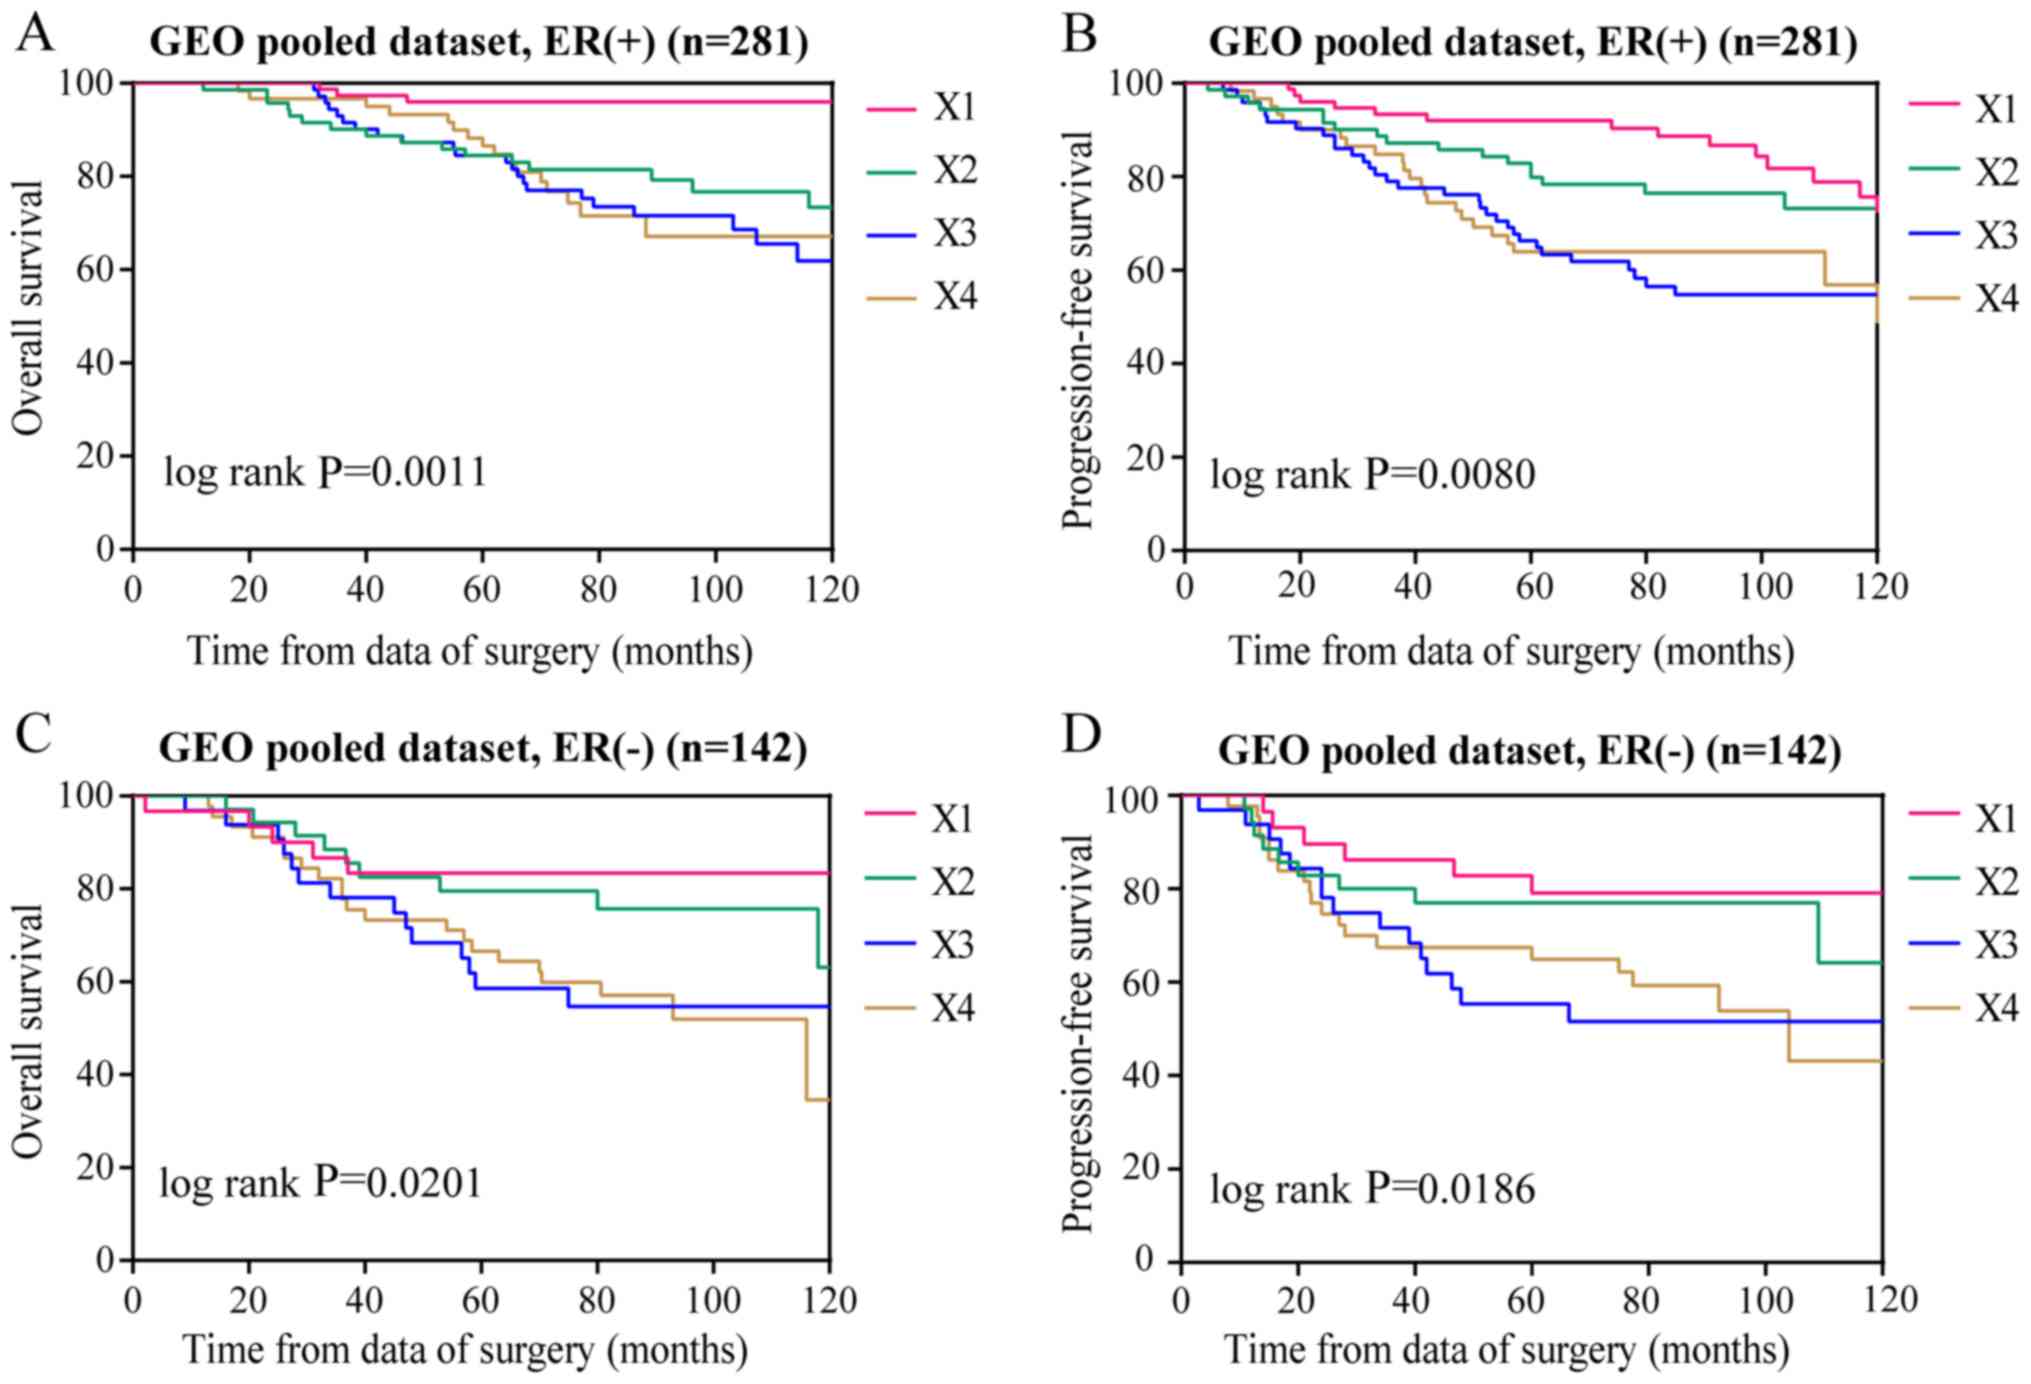
further GEO pooled analysis, it was demonstrated that NUF2
expression levels are significantly associated with poor OS and PFS
in both ER-positive (P<0.01; Fig.
6A and B) and ER-negative (P<0.01; Fig. 6C and D) BC, and the association is
more obvious in ER-positive BC. The results of Cox proportional
hazards analysis are shown in Table
VII. In addition, the results of the Bonferroni's post hoc
tests used to compare the Kaplan-Meier survival curves
corresponding to >2 groups are shown in Table VI. These results indicated that
NUF2 might be a prognostic factor for BC.
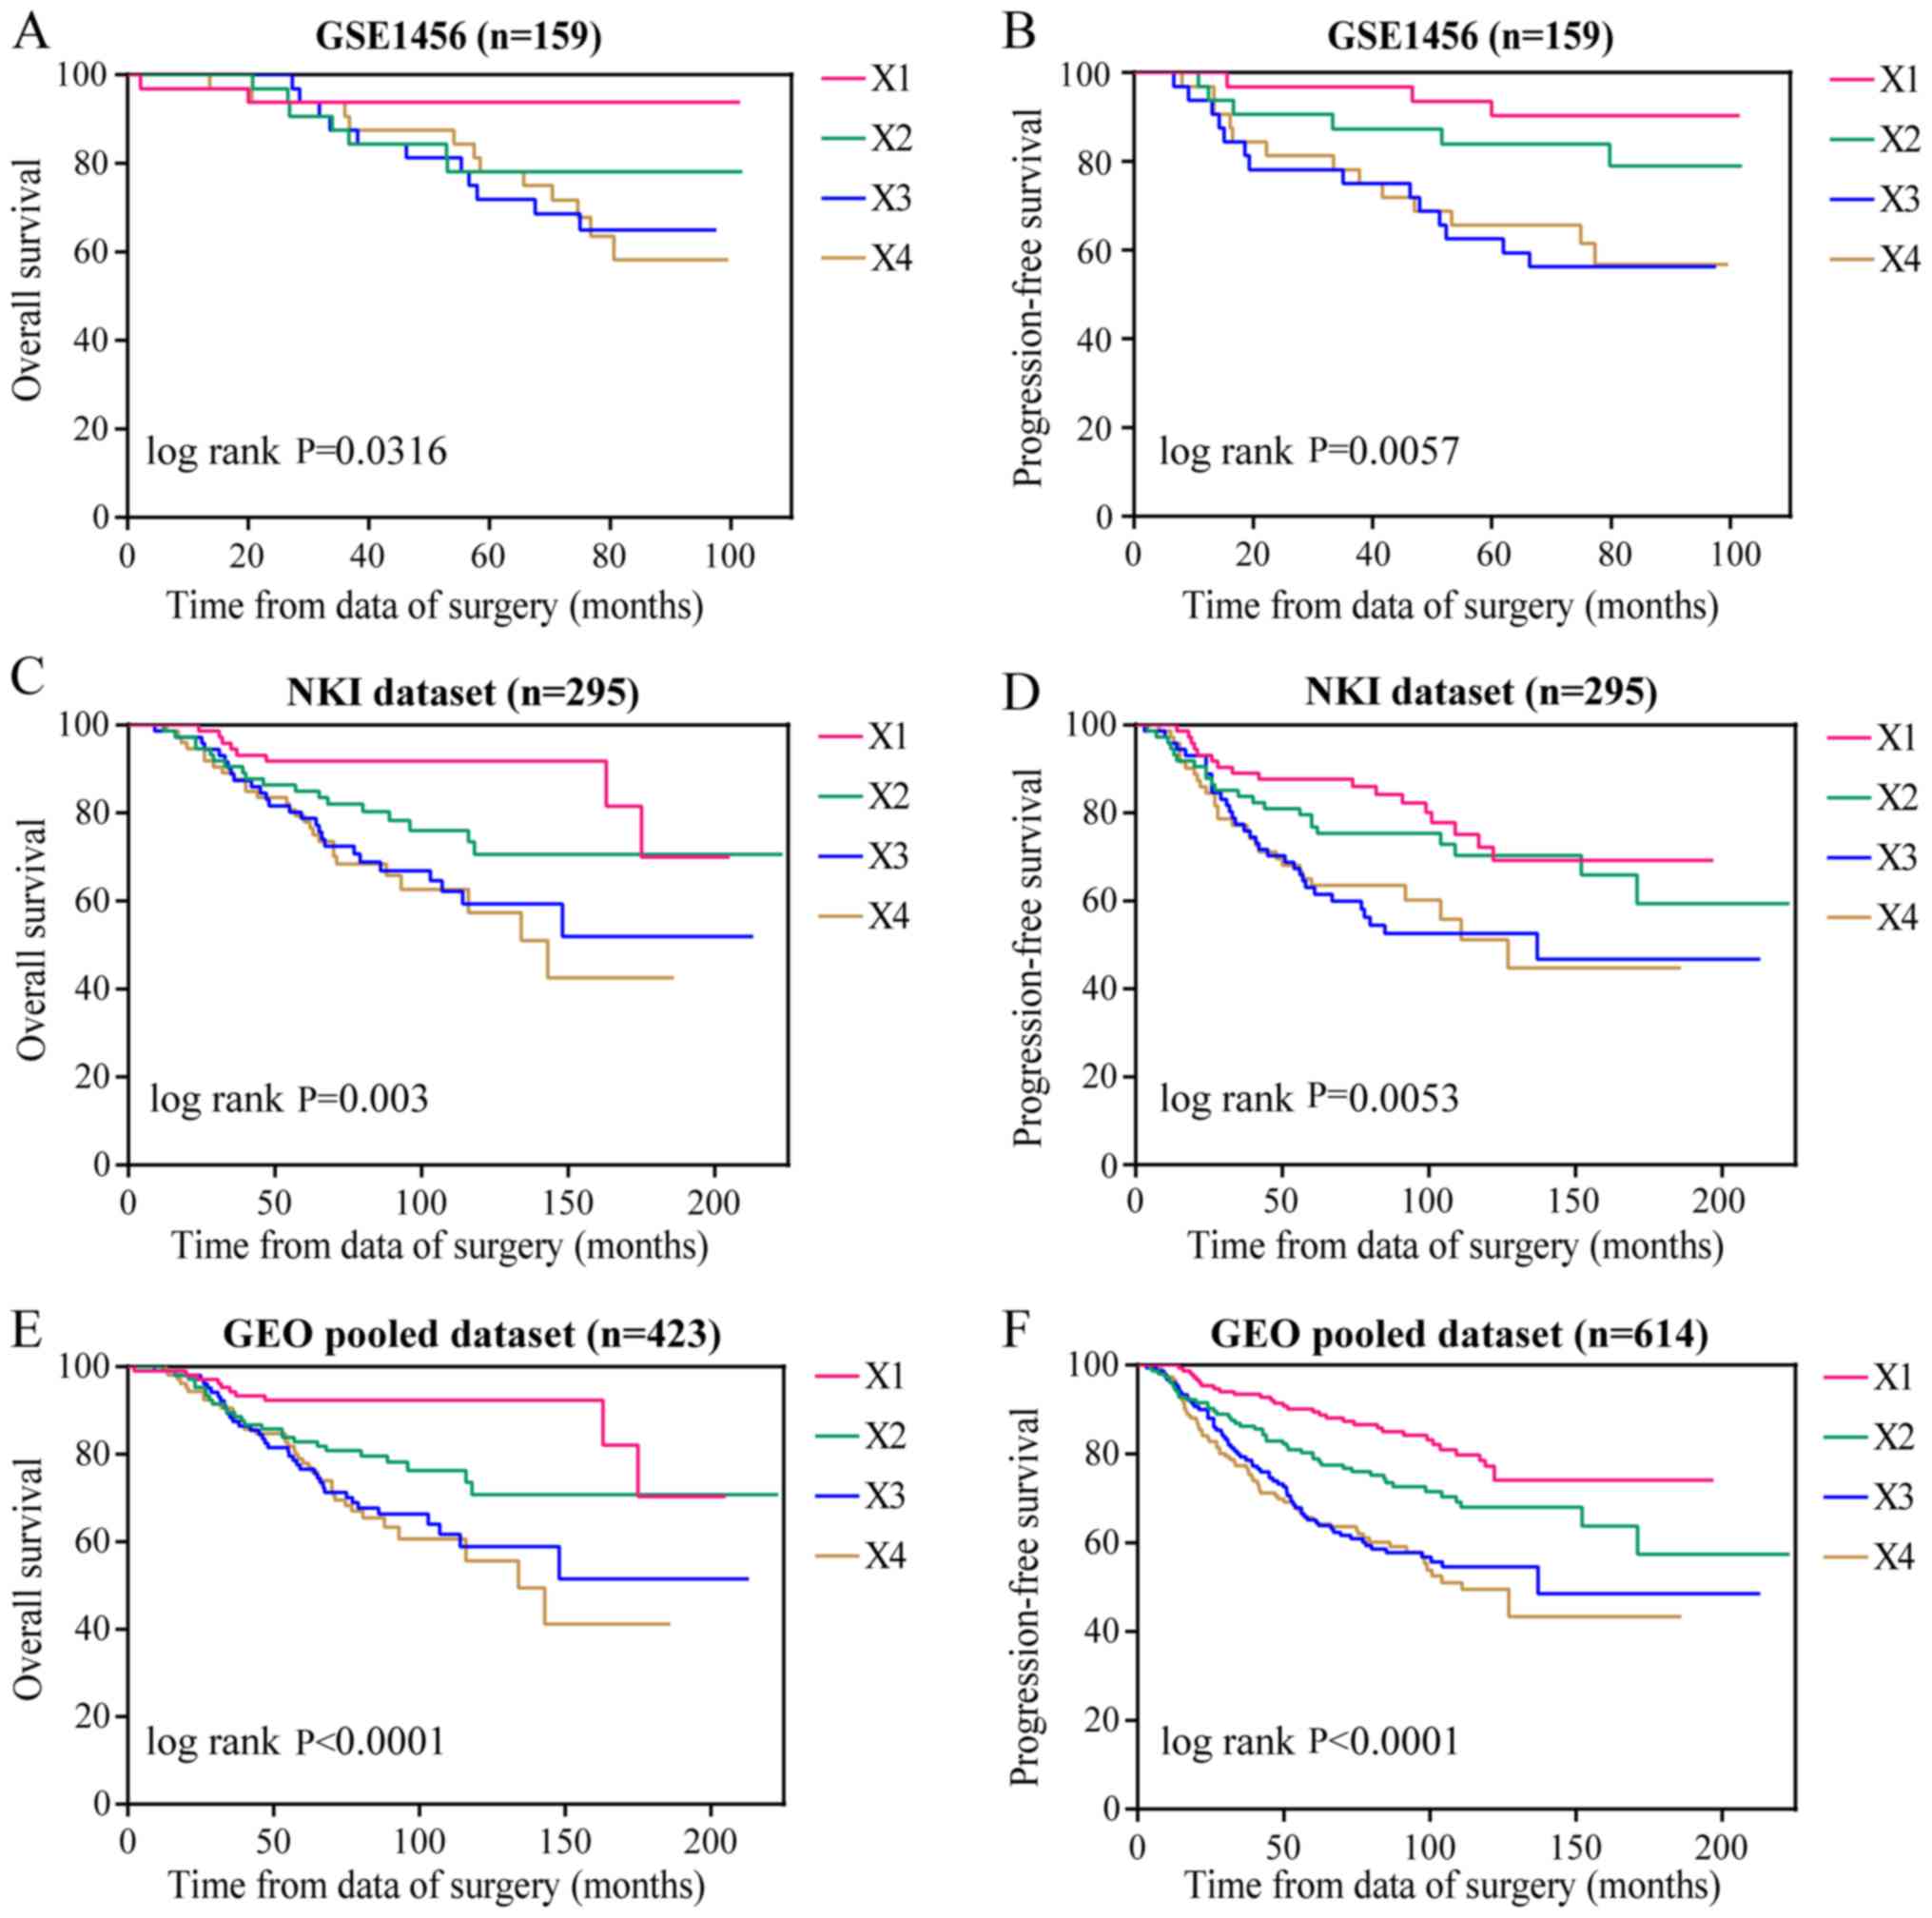 | Figure 5Role of NUF2 in the prognosis
of BC patients. (A) NUF2 expression was significantly
associated with OS of BC patients in the GSE1456 dataset, (C) NKI
dataset, and (E) GEO pooled dataset. NUF2 expression was
significantly associated with PFS of BC patients in the (B) GSE1456
dataset, (D) NKI dataset and (F) GEO pooled dataset. GEO, gene
expression omnibus; BC, breast cancer; OS, overall survival; PFS,
progression free survival; ER, estrogen receptor; PR, progesterone
receptor; NUF2, NDC80 kinetochore complex component. |
| Table VIIUnivariate and multivariate analyses
of NUF2 and survival in GEO datasets. |
Table VII
Univariate and multivariate analyses
of NUF2 and survival in GEO datasets.
| Dataset | Overall survival
| Progression-free
survival
|
|---|
| HR (95% CI) | Adjusted HR (95%
CI) | HR (95% CI) | Adjusted HR (95%
CI) |
|---|
| GSE1456 | | | | |
| X1 | Reference | Reference | Reference | Reference |
| X2 | 3.94
(0.82-18.95) | 3.66
(0.75-17.75) | 2.19
(0.55-8.74) | 1.99
(0.49-8.05) |
| X3 | 6.18
(1.37-27.90)a | 4.6
(0.91-23.28) | 5.7
(1.64-19.83)b | 3.94
(1.00-15.45)a |
| X4 | 6.69
(1.50-29.91)a | 5.11
(1.03-25.24)a | 5.21
(1.48-18.29)b | 3.76
(0.97-14.57) |
| GSE22220 | | | | |
| X1 | N/A | N/A | Reference | Reference |
| X2 | N/A | N/A | 2.05
(0.95-4.43) | 1.69
(0.77-3.69) |
| X3 | N/A | N/A | 2.31
(1.07-4.96)a | 1.79
(0.82-3.92) |
| X4 | N/A | N/A | 3.34
(1.60-6.95)b | 2.30
(1.05-5.02)a |
| NKI dataset | | | | |
| X1 | Reference | Reference | Reference | Reference |
| X2 | 2.39
(1.04-5.51)a | 2.01
(0.87-4.68) | 1.35
(0.72-2.54) | 1.29
(0.68-2.46) |
| X3 | 3.97
(1.80-8.77)b | 2.88
(1.28-6.48)a | 2.39
(1.33-4.30)b | 1.97
(1.07-3.61)a |
| X4 | 4.48
(2.03-9.89)c | 2.63
(1.13-6.12)a | 2.31
(1.27-4.21)b | 1.84
(0.96-3.52) |
| GSE4299 | | | | |
| X1 | N/A | N/A | Reference | Reference |
| X2 | N/A | N/A | 1.95
(0.99-3.85) | 1.93
(0.97-3.81) |
| X3 | N/A | N/A | 2.16
(1.09-4.27)a | 2.13
(1.07-4.24)a |
| X4 | N/A | N/A | 2.11
(1.07-4.17)a | 2.09
(1.04-4.19)a |
| GSE20685 | | | | |
| X1 | Reference | Reference | Reference | Reference |
| X2 | 1.11
(0.57-2.14) | 1.1
(0.57-2.14) | 1.17
(0.67-2.05) | 1.16
(0.66-2.03) |
| X3 | 1.58
(0.85-2.95) | 1.58
(0.85-2.95) | 1.12
(0.64-1.98) | 1.13
(0.64-2.00) |
| X4 | 1.59
(0.85-2.96) | 1.58
(0.84-2.97) | 1.46
(0.84-2.52) | 1.42
(0.82-2.48) |
| GEO pooled | | | | |
| X1 | Reference | Reference | Reference | Reference |
| X2 | 2.69
(1.29-5.60)b | 2.18
(1.04-4.57)a | 1.67
(1.05-2.65)a | 1.5
(0.95-2.39) |
| X3 | 4.43
(2.20-8.91)c | 3
(1.46-6.15)b | 2.72
(1.77-4.19)c | 2.13
(1.36-3.32)b |
| X4 | 4.94
(2.46-9.92)c | 2.87
(1.38-5.94)b | 2.98
(1.94-4.59)c | 2.1
(1.33-3.32)b |
| GEO pooled
ER(+) | | | | |
| X1 | Reference | Reference | Reference | Reference |
| X2 | 3.84
(1.41-10.48)b | 3.23
(1.18-8.88)a | 1.57
(0.79-3.13) | 1.39
(0.70-2.79) |
| X3 | 5.48
(2.08-14.49)b | 3.93
(1.46-10.61)b | 3.03
(1.62-5.69)b | 2.32
(1.22-4.44)a |
| X4 | 5.60
(2.06-15.23)b | 3.74
(1.34-10.46)a | 2.83
(1.45-5.52)b | 2.09
(1.04-4.16)a |
| GEO pooled
ER(−) | | | | |
| X1 | Reference | Reference | Reference | Reference |
| X2 | 1.40
(0.46-4.20) | 1.19
(0.39-3.61) | 1.28
(0.46-3.62) | 1.09
(0.38-3.11) |
| X3 | 2.96
(1.07-8.20)a | 1.88
(0.65-5.45) | 2.60
(1.01-6.72)a | 1.58
(0.58-4.34) |
| X4 | 3.23
(1.22-8.54)a | 1.96
(0.70-5.52) | 2.44
(0.97-6.10) | 1.46
(0.54-3.91) |
| Table VIComparison of Kaplan-Meier curves
among multiple groups. |
Table VI
Comparison of Kaplan-Meier curves
among multiple groups.
| Datasets | Pairwise
comparisons (P-values) |
|---|
| GSE1456 OS | Subsets | X1 | X2 | X3 | X4 |
| X1 | N/A | 0.088 | 0.008a | 0.003a |
| X2 | 0.088 | N/A | 0.356 | 0.253 |
| X3 | 0.008a | 0.356 | N/A | 0.851 |
| X4 | 0.003a | 0.253 | 0.851 | N/A |
| GSE1456 PFS | Subsets | X1 | X2 | X3 | X4 |
| X1 | N/A | 0.259 | 0.002a | 0.004a |
| X2 | 0.259 | N/A | 0.044 | 0.068 |
| X3 | 0.002a | 0.044 | N/A | 0.800 |
| X4 | 0.004a | 0.068 | 0.800 | N/A |
| NKI OS | Subsets | X1 | X2 | X3 | X4 |
| X1 | N/A | 0.036 | 0.000a | 0.000a |
| X2 | 0.036 | N/A | 0.113 | 0.041 |
| X3 | 0.000a | 0.113 | N/A | 0.663 |
| X4 | 0.000a | 0.041 | 0.663 | N/A |
| NKI PFS | Subsets | X1 | X2 | X3 | X4 |
| X1 | N/A | 0.361 | 0.002a | 0.003a |
| X2 | 0.361 | N/A | 0.034 | 0.057 |
| X3 | 0.002a | 0.034 | N/A | 0.840 |
| X4 | 0.003a | 0.057 | 0.840 | N/A |
| GEO pooled OS | Subsets | X1 | X2 | X3 | X4 |
| X1 | N/A | 0.007a | 0.000a | 0.000a |
| X2 | 0.007a | N/A | 0.063 | 0.017 |
| X3 | 0.000a | 0.063 | N/A | 0.630 |
| X4 | 0.000a | 0.017 | 0.630 | N/A |
| GEO pooled PFS | Subsets | X1 | X2 | X3 | X4 |
| X1 | N/A | 0.027 | 0.000a | 0.000a |
| X2 | 0.027 | N/A | 0.010 | 0.002a |
| X3 | 0.000a | 0.010 | N/A | 0.639 |
| X4 | 0.000a | 0.002a | 0.639 | N/A |
| GEO pooled ER(+)
OS | Subsets | X1 | X2 | X3 | X4 |
| X1 | N/A | 0.006a | 0.000a | 0.000a |
| X2 | 0.006a | N/A | 0.307 | 0.314 |
| X3 | 0.000a | 0.307 | N/A | 0.925 |
| X4 | 0.000a | 0.314 | 0.925 | N/A |
| GEO pooled ER(+)
PFS | Subsets | X1 | X2 | X3 | X4 |
| X1 | N/A | 0.197 | 0.000a | 0.001a |
| X2 | 0.197 | N/A | 0.022 | 0.065 |
| X3 | 0.000a | 0.022 | N/A | 0.730 |
| X4 | 0.001a | 0.065 | 0.730 | N/A |
| GEO pooled ER(−)
OS | Subsets | X1 | X2 | X3 | X4 |
| X1 | N/A | 0.495 | 0.031 | 0.016 |
| X2 | 0.495 | N/A | 0.079 | 0.028 |
| X3 | 0.031 | 0.079 | N/A | 0.762 |
| X4 | 0.016 | 0.028 | 0.762 | N/A |
| GEO pooled ER(−)
PFS | Subsets | X1 | X2 | X3 | X4 |
| X1 | N/A | 0.679 | 0.029 | 0.055 |
| X2 | 0.679 | N/A | 0.095 | 0.106 |
| X3 | 0.029 | 0.095 | N/A | 0.834 |
| X4 | 0.055 | 0.106 | 0.834 | N/A |
Signaling pathways associated with
NUF2
Single-gene differential expression analyses in the
study of biological processes are limited (28). To effectively reveal the
biological significance of microarray datasets, a GSEA was
performed to predict gene sets and signaling pathways associated
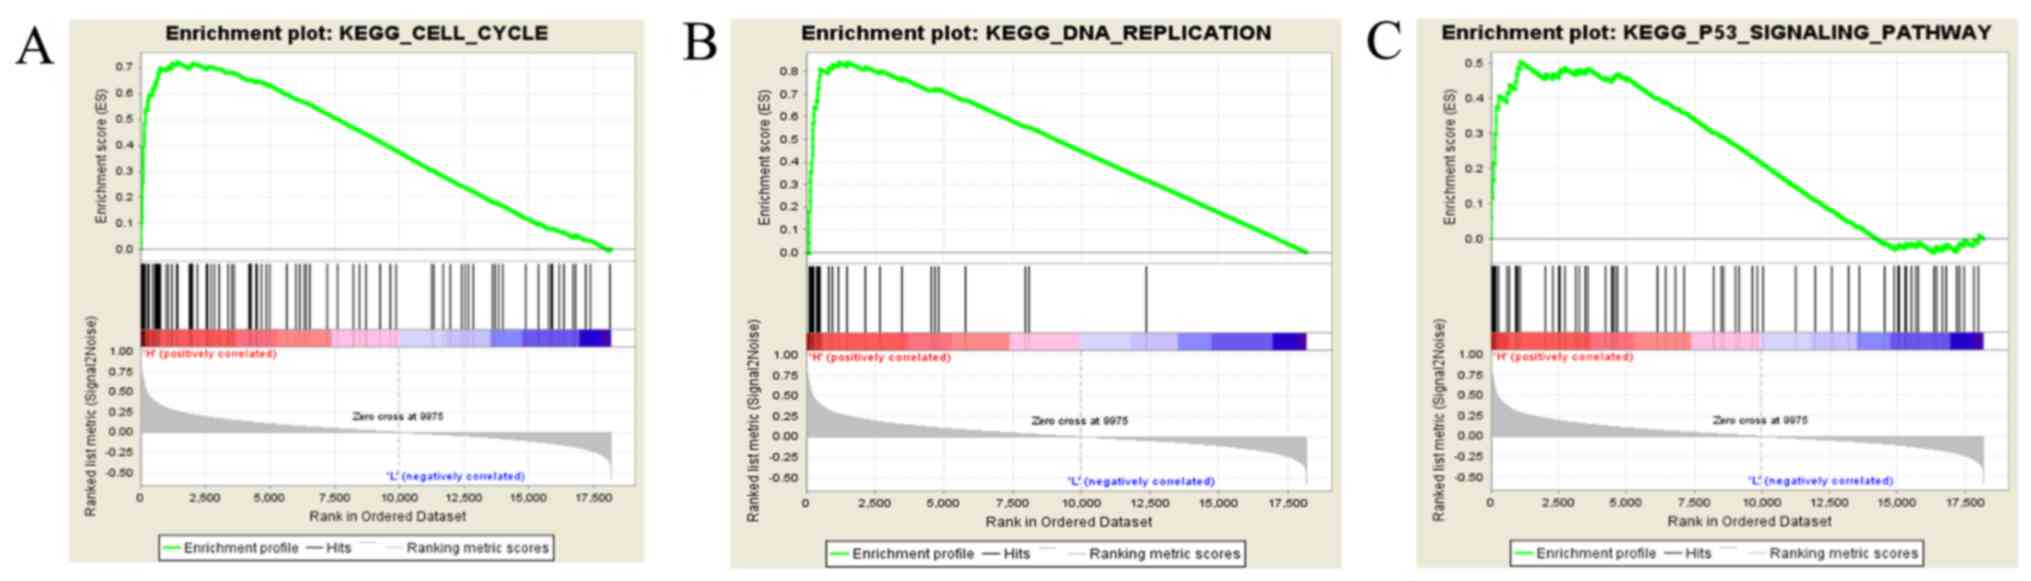
with NUF2 using the data obtained from the TCGA database. As
shown in Fig. 7A-C, NUF2
may function in cell cycle-related pathways, including the cell
cycle, DNA replication, and p53 signaling pathway.
Discussion
BC is the most common malignant tumor in women,
accounting for 25% of female tumors (3). Despite advanced treatment
techniques, BC remains the leading cause of death among women
(31). Therefore, there is a
pressing need for more effective molecular biomarkers to prevent,
diagnose, and treat BC. With the development of microarray
technology, hundreds of molecules have been found to be abnormally
expressed during breast carcinogenesis and progression. The TCGA
and GEO databases provide a large number of publicly available
microarray datasets for biomarker identification.
In this study, 190 DEGs with the same expression
trends were identified in four datasets, and a GO BP analysis
showed that the upregulated DEGs were mainly enriched in the
biological processes of cell division, mitotic nuclear division,
and G2/M transition of mitotic cell cycle, while the downregulated
DEGs were related to lipid metabolic process, cholesterol
homeostasis, and glucose metabolic process. Cell division and cell
cycle are the basic processes in cell proliferation, and their
abnormalities contribute to carcinogenesis and tumor progression
(32). Furthermore, the
activation of key regulators of lipid and cholesterol metabolism
drives the estrogen-independent growth of invasive lobular breast
carcinoma cells (33). A KEGG
signaling pathway analysis of the DEGs in this study revealed the
importance of the cell cycle, ECM-receptor interaction, PPAR
signaling pathway, and AMPK signaling pathway in BC. Previous
studies have reported that ECM could regulate tissue homeostasis,
and its dysregulation could promote tumor progression by affecting
adhesion, migration, differentiation, proliferation, and apoptosis
of tumor cells (34,35). In addition, an increase in the
rigidity of the ECM due to the local accumulation of crosslinked
collagen matrix is associated with cancer progression (36). Yao et al (37) found that the PPAR signaling
pathway is involved in breast carcinogenesis. Song et al
(38) suggested that activation
of the AMPK signaling pathway may be beneficial for the promotion
of tumor necrosis factor-related apoptosis-inducing ligand-mediated
anti-BC treatment. a PPI network was constructed in this study and
two functional modules were identified. According to the MCODE
scores, which represent importance, module 1 was found to play a
major role in the PPI network. By combining the log |FC| values of
the DEGs in the TCGA database and literature mining, NUF2
was selected for further research as a key gene in BC.
Although Xiang et al (12) found that NUF2 is
upregulated in BC, using cDNA microarray data of BC patients,
further experiments have not been performed to verify this finding.
In this study, by Oncomine analysis and RT-qPCR assay, it was
verified that NUF2 is overexpressed in BC tissues, further
confirming the results obtained by data mining. Shiraishi et
al (39) found that
NUF2 expression is significantly associated with prostate
cancer recurrence, and patients with high NUF2 expression
have significantly shorter survival times without biochemical
recurrence. Hu et al (10)
showed that the overexpression of NUF2 could be related to
poor prognosis in pancreatic cancer. Zhang et al (13) found that NUF2 expression
has prognostic values for BC patients, by simply using the
BC-GenExMiner online analysis tool. However, further analysis has
not been conducted. To this end, the present study analyzed the
precise roles and underlying molecular mechanisms of NUF2 in
BC. By stratified analysis and pooled analysis of five GEO
datasets, it was found that patients with BC and high NUF2
expression had worse prognosis than patients with low NUF2
expression in both ER-positive and ER-negative BC. Using clinical
data for 42 patients, it was demonstrated that NUF2
expression was only associated with age. Small sample size,
erroneous tissue sampling, RNA degradation, and fluctuating
efficiency of RT-qPCR may affect the results of the analysis. This
hypothesis can be tested through the following methods: Increasing
sample size, determining the type of tissue with pathological
examination, detecting RNA degradation by RNA electrophoresis, and
verifying amplification efficiency of RT-qPCR by the standard curve
method. The lack of additional experiments to test these
possibilities is a limitation to the present study. Therefore, the
relationship was further analyzed using clinical data for patients
with BC in the TCGA database. The expression of NUF2 was
positively correlated with tumor stage and negatively correlated
with ER status, consistent with the results from a number of
studies showing that advanced tumors and ER-negative tumors are
probably related to poor survival (40-42), suggesting that NUF2 plays
an important role in tumor progression and prognosis. To elucidate
the molecular mechanisms by which NUF2 mediates breast
carcinogenesis and progression, GSEA was performed in this study.
The results revealed that NUF2 is involved in cell
cycle-related pathways.
In conclusion, the present data analysis and RT-qPCR
validation indicated that NUF2 is highly expressed in BC and
is associated with its multiple pathological features and
prognosis. NUF2 is therefore a potential therapeutic target
and prognostic indicator of BC. However, this study had several
limitations. First, only mRNA data were obtained from the databases
and RT-qPCR, and this single-gene-level analysis cannot fully
capture the expression of NUF2 in BC. Second, experimental
validation of the results was not performed. Therefore, further
research is required to determine the roles of NUF2 in
BC.
NUF2 is overexpressed in BC and is associated
with its multiple pathological features. More importantly,
NUF2 may play an important role in predicting the clinical
outcomes of different BC subgroups.
Acknowledgments
Not applicable.
Funding
This study was supported by the Public Technology
Research Project of Zhejiang Province (grant no. LGF18H200006) and
the Medicines Health Technology Plan Project of Zhejiang Province
(grant no. 2018PY073).
Availability of data and materials
The datasets analyzed during the current study are
available in the TCGA (https://cancergenome.nih.gov/) and GEO (https://www.ncbi.nlm.nih.gov/geo/) databases.
Authors' contributions
WJX, YNW, and XJD participated in the study design.
WJX, YNW, and XPX contributed to data collection and analysis. WJX,
YZW, and SML were involved in the collection of samples and
RT-qPCR. All authors were involved in the writing of the article.
XJD critically reviewed the manuscript. All authors have read and
approved the final manuscript.
Ethics approval and consent to
participate
The present study was approved and supervised by the
Ethics Committee of Shaoxing People's Hospital (Shaoxing, China).
Written informed consent was obtained from all participants.
Patient consent for publication
Not applicable.
Competing interests
The authors declare that they have no competing
interests.
References
|
1
|
Siegel RL, Miller KD and Jemal A: Cancer
Statistics, 2017. CA Cancer J Clin. 67:7–30. 2017. View Article : Google Scholar : PubMed/NCBI
|
|
2
|
Donepudi MS, Kondapalli K, Amos SJ and
Venkanteshan P: Breast cancer statistics and markers. J Cancer Res
Ther. 10:506–511. 2014.PubMed/NCBI
|
|
3
|
Torre LA, Bray F, Siegel RL, Ferlay J,
Lortet-Tieulent J and Jemal A: Global cancer statistics, 2012. CA
Cancer J Clin. 65:87–108. 2015. View Article : Google Scholar : PubMed/NCBI
|
|
4
|
Tan W, Yang M, Yang H, Zhou F and Shen W:
Predicting the response to neoadjuvant therapy for early-stage
breast cancer: Tumor-, blood-, and imaging-related biomarkers.
Cancer Manag Res. 10:4333–4347. 2018. View Article : Google Scholar : PubMed/NCBI
|
|
5
|
Salem Y, Yacov N, Propheta-Meiran O,
Breitbart E and Mendel I: Newly characterized motile sperm
domain-containing protein 2 promotes human breast cancer
metastasis. Int J Cancer. 144:125–135. 2019. View Article : Google Scholar
|
|
6
|
Kinsella MD, Nassar A, Siddiqui MT and
Cohen C: Estrogen receptor (ER), progesterone receptor (PR), and
HER2 expression pre- and post-neoadjuvant chemotherapy in primary
breast carcinoma: A single institutional experience. Int J Clin Exp
Pathol. 5:530–536. 2012.
|
|
7
|
Piao J, Chen L, Jin T, Xu M, Quan C and
Lin Z: Paip1 affects breast cancer cell growth and represents a
novel prognostic biomarker. Hum Pathol. 73:33–40. 2018. View Article : Google Scholar
|
|
8
|
Sandoo A, Kitas GD and Carmichael AR:
Breast cancer therapy and cardiovascular risk: Focus on
trastuzumab. Vasc Health Risk Manag. 11:223–228. 2015. View Article : Google Scholar : PubMed/NCBI
|
|
9
|
Nabetani A, Koujin T, Tsutsumi C,
Haraguchi T and Hiraoka Y: A conserved protein, Nuf2, is implicated
in connecting the centromere to the spindle during chromosome
segregation: A link between the kinetochore function and the
spindle checkpoint. Chromosoma. 110:322–334. 2001. View Article : Google Scholar : PubMed/NCBI
|
|
10
|
Hu P, Chen X, Sun J, Bie P and Zhang LD:
siRNA-mediated knockdown against NUF2 suppresses pancreatic cancer
proliferation in vitro and in vivo. Biosci Rep. 35:
pii:e001702015.
|
|
11
|
Fu HL and Shao L: Silencing of NUF2
inhibits proliferation of human osteosarcoma Saos-2 cells. Eur Rev
Med Pharmacol Sci. 20:1071–1079. 2016.PubMed/NCBI
|
|
12
|
Xiang YJ, Fu Q, Ma ZB, Gao DZ, Zhang Q, Li
YY, Li L, Liu L, Ye CM, Yu ZG and Guo MM: Screening for candidate
genes related to breast cancer with cDNA microarray analysis.
Chronic Dis Transl Med. 1:65–72. 2015. View Article : Google Scholar : PubMed/NCBI
|
|
13
|
Zhang W, Mao JH, Zhu W, Jain AK, Liu K,
Brown JB and Karpen GH: Centromere and kinetochore gene
misexpression predicts cancer patient survival and response to
radiotherapy and chemotherapy. Nat Commun. 7:126192016. View Article : Google Scholar : PubMed/NCBI
|
|
14
|
Clarke C, Madden SF, Doolan P, Aherne ST,
Joyce H, O'Driscoll L, Gallagher WM, Hennessy BT, Moriarty M, Crown
J, et al: Correlating transcriptional networks to breast cancer
survival: A large-scale coexpression analysis. Carcinogenesis.
34:2300–2308. 2013. View Article : Google Scholar : PubMed/NCBI
|
|
15
|
Gruosso T, Mieulet V, Cardon M, Bourachot
B, Kieffer Y, Devun F, Dubois T, Dutreix M, Vincent-Salomon A,
Miller KM and Mechta-Grigoriou F: Chronic oxidative stress promotes
H2AX protein degradation and enhances chemosensitivity in breast
cancer patients. EMBO Mol Med. 8:527–549. 2016. View Article : Google Scholar : PubMed/NCBI
|
|
16
|
Maubant S, Tesson B, Maire V, Ye M,
Rigaill G, Gentien D, Cruzalegui F, Tucker GC, Roman-Roman S and
Dubois T: Transcriptome analysis of Wnt3a-treated triple-negative
breast cancer cells. PLoS One. 10:e01223332015. View Article : Google Scholar : PubMed/NCBI
|
|
17
|
Lee GY, Haverty PM, Li L, Kljavin NM,
Bourgon R, Lee J, Stern H, Modrusan Z, Seshagiri S, Zhang Z, et al:
Comparative oncogenomics identifies PSMB4 and SHMT2 as potential
cancer driver genes. Cancer Res. 74:3114–3126. 2014. View Article : Google Scholar : PubMed/NCBI
|
|
18
|
Tomczak K, Czerwińska P and Wiznerowicz M:
The cancer genome atlas (TCGA): An immeasurable source of
knowledge. Contemp Oncol (Pozn). 19:A68–A77. 2015.
|
|
19
|
Pawitan Y, Bjohle J, Amler L, Borg AL,
Egyhazi S, Hall P, Han X, Holmberg L, Huang F, Klaar S, et al: Gene
expression profiling spares early breast cancer patients from
adjuvant therapy: Derived and validated in two population-based
cohorts. Breast Cancer Res. 7:R953–R964. 2005. View Article : Google Scholar : PubMed/NCBI
|
|
20
|
Buffa FM, Camps C, Winchester L, Snell CE,
Gee HE, Sheldon H, Taylor M, Harris AL and Ragoussis J:
microRNA-associated progression pathways and potential therapeutic
targets identified by integrated mRNA and microRNA expression
profiling in breast cancer. Cancer Res. 71:5635–5645. 2011.
View Article : Google Scholar : PubMed/NCBI
|
|
21
|
van de Vijver MJ, He YD, van't Veer LJ,
Dai H, Hart AA, Voskuil DW, Schreiber GJ, Peterse JL, Roberts C,
Marton MJ, et al: A gene-expression signature as a predictor of
survival in breast cancer. N Engl J Med. 347:1999–2009. 2002.
View Article : Google Scholar : PubMed/NCBI
|
|
22
|
Jones SB, DePrimo SE, Whitfield ML and
Brooks JD: Resveratrol-induced gene expression profiles in human
prostate cancer cells. Cancer Epidemiol Biomarkers Prev.
14:596–604. 2005. View Article : Google Scholar : PubMed/NCBI
|
|
23
|
Kao KJ, Chang KM, Hsu HC and Huang AT:
Correlation of microarray-based breast cancer molecular subtypes
and clinical outcomes: Implications for treatment optimization. BMC
Cancer. 11:1432011. View Article : Google Scholar : PubMed/NCBI
|
|
24
|
Ashburner M, Ball CA, Blake JA, Botstein
D, Butler H, Cherry JM, Davis AP, Dolinski K, Dwight SS, Eppig JT,
et al: Gene ontology: Tool for the unification of biology. The gene
ontology consortium. Nat Genet. 25:25–29. 2000. View Article : Google Scholar : PubMed/NCBI
|
|
25
|
Kanehisa M and Goto S: KEGG: Kyoto
encyclopedia of genes and genomes. Nucleic Acids Res. 28:27–30.
2000. View Article : Google Scholar
|
|
26
|
Dennis G Jr, Sherman BT, Hosack DA, Yang
J, Gao W, Lane HC and Lempicki RA: DAVID: Database for annotation,
visualization, and integrated discovery. Genome Biol. 4:P32003.
View Article : Google Scholar : PubMed/NCBI
|
|
27
|
Doerks T, Copley RR, Schultz J, Ponting CP
and Bork P: Systematic identification of novel protein domain
families associated with nuclear functions. Genome Res. 12:47–56.
2002. View Article : Google Scholar : PubMed/NCBI
|
|
28
|
Subramanian A, Tamayo P, Mootha VK,
Mukherjee S, Ebert BL, Gillette MA, Paulovich A, Pomeroy SL, Golub
TR, Lander ES and Mesirov JP: Gene set enrichment analysis: A
knowledge-based approach for interpreting genome-wide expression
profiles. Proc Natl Acad Sci USA. 102:15545–15550. 2005. View Article : Google Scholar : PubMed/NCBI
|
|
29
|
Livak KJ and Schmittgen TD: Analysis of
relative gene expression data using real-time quantitative PCR and
the 2(−Delta Delta C(T)) method. Methods. 25:402–408. 2001.
View Article : Google Scholar
|
|
30
|
Rhodes DR, Kalyana-Sundaram S, Mahavisno
V, Varambally R, Yu J, Briggs BB, Barrette TR, Anstet MJ,
Kincead-Beal C, Kulkarni P, et al: Oncomine 3.0: Genes, pathways,
and networks in a collection of 18,000 cancer gene expression
profiles. Neoplasia. 9:166–180. 2007. View Article : Google Scholar : PubMed/NCBI
|
|
31
|
Xue D, Cheng P, Han M, Liu X, Xue L, Ye C,
Wang K and Huang J: An integrated bioinformatical analysis to
evaluate the role of KIF4A as a prognostic biomarker for breast
cancer. OncoTargets Ther. 11:4755–4768. 2018. View Article : Google Scholar
|
|
32
|
Chen L, Yuan L, Qian K, Qian G, Zhu Y, Wu
CL, Dan HC, Xiao Y and Wang X: Identification of biomarkers
associated with pathological stage and prognosis of clear cell
renal cell carcinoma by co-expression network analysis. Front
Physiol. 9:3992018. View Article : Google Scholar : PubMed/NCBI
|
|
33
|
Du T, Sikora MJ, Levine KM, Tasdemir N,
Riggins RB, Wendell SG, Van Houten B and Oesterreich S: Key
regulators of lipid metabolism drive endocrine resistance in
invasive lobular breast cancer. Breast Cancer Res. 20:1062018.
View Article : Google Scholar : PubMed/NCBI
|
|
34
|
Kaushik N, Kim S, Suh Y and Lee SJ:
Proinvasive extracellular matrix remodeling for tumor progression.
Arch Pharm Res. 42:40–47. 2019. View Article : Google Scholar
|
|
35
|
Walker C, Mojares E and Del Rio Hernández
A: Role of extracellular matrix in development and cancer
progression. Int J Mol Sci. 19:pii: E3028. 2018. View Article : Google Scholar : PubMed/NCBI
|
|
36
|
Tilghman RW, Cowan CR, Mih JD, Koryakina
Y, Gioeli D, Slack-Davis JK, Blackman BR, Tschumperlin DJ and
Parsons JT: Matrix rigidity regulates cancer cell growth and
cellular phenotype. PLoS One. 5:e129052010. View Article : Google Scholar : PubMed/NCBI
|
|
37
|
Yao PL, Morales JL, Zhu B, Kang BH,
Gonzalez FJ and Peters JM: Activation of peroxisome
proliferator-activated receptor-β/δ (PPAR-β/δ) inhibits human
breast cancer cell line tumorigenicity. Mol Cancer Ther.
13:1008–1017. 2014. View Article : Google Scholar : PubMed/NCBI
|
|
38
|
Song W, Yan CY, Zhou QQ and Zhen LL:
Galangin potentiates human breast cancer to apoptosis induced by
TRAIL through activating AMPK. Biomed Pharmacother. 89:845–856.
2017. View Article : Google Scholar : PubMed/NCBI
|
|
39
|
Shiraishi T, Terada N, Zeng Y, Suyama T,
Luo J, Trock B, Kulkarni P and Getzenberg RH: Cancer/testis
antigens as potential predictors of biochemical recurrence of
prostate cancer following radical prostatectomy. J Transl Med.
9:1532011. View Article : Google Scholar : PubMed/NCBI
|
|
40
|
Bagaria SP, Ray PS, Sim MS, Ye X, Shamonki
JM, Cui X and Giuliano AE: Personalizing breast cancer staging by
the inclusion of ER, PR, and HER2. JAMA Surg. 149:125–129. 2014.
View Article : Google Scholar
|
|
41
|
Ryu JM, Choi HJ, Kim I, Lee SK, Yu J, Kim
JE, Kang BI, Lee JE, Nam SJ and Kim SW: Only estrogen receptor
'positive' is not enough to predict the prognosis of breast cancer.
Breast Cancer Res Treat. 172:627–636. 2018. View Article : Google Scholar : PubMed/NCBI
|
|
42
|
Dunnwald LK, Rossing MA and Li CI: Hormone
receptor status, tumor characteristics, and prognosis: A
prospective cohort of breast cancer patients. Breast Cancer Res.
9:R62007. View Article : Google Scholar : PubMed/NCBI
|