Introduction
Esophageal cancer (EC) is one of the most common
types of malignant tumor and was the sixth most common cause of
cancer-associated mortality worldwide in 2018 (1). EC has the highest prevalence rate
and was the fourth most common cause of cancer-associated mortality
in China in 2015 (2,3). Esophageal squamous cell carcinoma
(ESCC) is the main histological type of EC, accounting for 88% of
EC cases worldwide (4). Although
a combination of surgery, radiotherapy and chemotherapy has
demonstrated good results for ESCC treatment, the prognosis of
patients remains unsatisfactory and the 5-year survival rate was
20.9% in China in 2015 (5). The
etiology of EC includes tobacco smoking, alcohol drinking, low
intake of fruits and vegetables, gastroesophageal reflux and an
involvement of susceptibility-related genes (6,7).
Despite advancements in the search for diagnostic and prognostic
markers, no specific biomarker has regularly been used for ESCC
diagnosis (8,9). Therefore, it is imperative to
identify reliable therapeutic and prognostic molecular targets for
patients with ESCC as a guide for further adjuvant treatment.
Spindle and kinetochore-associated protein 1 (SKA1)
belongs to the family of spindle- and centromere-binding proteins
and is a microtubule-binding protein (10). The complex is essential for
stabilizing the kinetochore-spindle microtubule attachment during
mitosis (11). The absence of
SKA1 protein may result in severe chromosomal separation defects
(11). Previously, numerous
studies have highlighted the association between high SKA1
expression and poor prognosis in cancer (12,13). However, the prognostic value and
functions of SKA1 in ESCC remain unclear. The present study aimed
to verify the expression of SKA1 in 110 patients with ESCC through
immunohistochemistry (IHC), and investigate the role and functions
of SKA1 in ESCC.
Materials and methods
Patients and tissues
A total of 110 patients with complete clinical
records who were treated at the Department of Thoracic Surgery,
Provincial Hospital Affiliated to Shandong University (Jinan,
China) between January 2011 and January 2013 were enrolled for this
retrospective study. The patients included 89 males and 21 females,
with a mean age of 61 years (range, 31-79 years). The clinical
information of all patients is presented in Table I. The inclusion criteria were as
follows: i) Patients subjected to Ivor-Lewis esophagogastrectomy
with thoracic and abdominal two-field lymph node dissection
(14) to achieve complete tumor
resection as per the 2009 Union for International Cancer Control
(UICC) standard for midthoracic ESCC; ii) patients restaged
according to the 2009 UICC tumor-node-metastasis (TNM) staging
guidelines for EC; iii) no residual cancer cells under the upper
and lower cutting edge, and a lateral margin without residual
focus, as demonstrated by pathological examination; iv) >12
lymph node dissections; v) no preoperative chemotherapy or
radiotherapy; vi) no severe preoperative complications; and vii) at
least a complete 3-year follow-up review and first specific
recurrence location recorded. ESCC tissue and corresponding healthy
esophageal mucosa (CHEM) tissue samples were collected from each
patient. The CHEM tissue samples were obtained 5 cm from the edge
of the ESCC tissues, and they were examined by light microscopy to
confirm the absence of necrosis, deterioration or tumor.
 | Table IAssociation of SKA1 expression with
clinicopathological features of patients with ESCC. |
Table I
Association of SKA1 expression with
clinicopathological features of patients with ESCC.
| Characteristic | Total (n=110) | SKA1 expression level
| P-value |
|---|
| Low (n=42) | High (n=68) |
|---|
| Age, years | | | | 0.152 |
| <50 | 23 | 12 | 11 | |
| ≥50 | 87 | 30 | 57 | |
| Sex | | | | 0.322 |
| Male | 89 | 32 | 57 | |
| Female | 21 | 10 | 11 | |
| Tumor size, mm | | | | 0.576 |
| <30 | 20 | 8 | 12 | |
| 30-50 | 52 | 22 | 30 | |
| >50 | 38 | 12 | 26 | |
| Differentiation
degree | | | | 0.018a |
| High | 16 | 11 | 5 | |
| Moderate | 52 | 19 | 33 | |
| Low | 42 | 12 | 30 | |
| Pathological T
stage | | | | 0.527 |
| T1 | 4 | 2 | 2 | |
| T2 | 26 | 12 | 14 | |
| T3+T4 | 80 | 28 | 52 | |
| Pathological N
stage | | | | 0.017a |
| N0 | 28 | 16 | 12 | |
| N1+N2 | 82 | 26 | 56 | |
| Pathological TNM
stage | | | | 0.045a |
| I+II | 30 | 16 | 14 | |
| III+IV | 80 | 26 | 54 | |
IHC analysis
IHC analysis was conducted as described previously
(15). Briefly, ESCC and CHEM
tissues were fixed with 4% paraformaldehyde at 4°C for 24 h,
paraffin-embedded and cut into 5-μm sections. Following
blocking with goat serum for 30 min at 25°C for 40 min, sections
were incubated with anti-SKA1 primary antibody (1:50; cat. no.
ab91550; Abcam) at 37°C for 1 h. After three washes with PBS, the
sections incubated with a biotin goat anti-rabbit IgG H&L
secondary antibody (1:2,000; cat. no. ab6720; Abcam) for 30 min at
37°C, followed by incubation with streptavidin-horseradish
peroxidase for 5 min at 37°C. Subsequently, 3,3'-diaminobenzidine
was added for visualization after washing with PBS three times.
Finally, the sections were counterstained with hematoxylin at 25°C
for 1 min, air-dried and mounted on a cover slip. SKA1 expression
was observed under a light microscope at three magnifications
(x100, x200 and x400).
The immunohistochemical score (IHS) consisted of the
proportion score (percentage of positively stained cells) and the
staining intensity score. The proportion score was described as
follows: 0 (<5%), 1 (5-24%), 2 (25-49%), 3 (50-74%) and 4
(75-100%). The staining intensity score was calculated as follows:
0 (negative), 1 (weak), 2 (moderate) and 3 (strong). The proportion
score was multiplied by the staining intensity score to obtain an
IHS for each section. SKA1 expression was rated as follows: High
expression, HIS ≥4; and low expression, HIS <4. Two experienced
pathologists blinded to the patient data independently scored the
samples and agreed on a result through reanalysis and
discussion.
Follow-up after surgery
All patients were regularly followed-up every 3-6
months after surgery for a general physical examination, abdominal
ultrasound, chest and upper abdominal contrast-enhanced computed
tomography scan, and positron emission tomography. Biopsies were
used based on specific imaging and clinical examinations. The
follow-up was completed in January 2017 with a maximum follow-up
period of 60 months.
Cell culture
The human ESCC cell lines TE-1, EC9706 and Eca-109,
a human esophageal epithelial cell line HET-1A and 293T cells were
purchased from the Cell Bank of Chinese Academy of Sciences. ESCC
cell lines and HET-1A were cultured in RPMI-1640 medium (Gibco;
Thermo Fisher Scientific, Inc.), and 293T cells were cultured in
Dulbecco's modified Eagle's medium (Gibco; Thermo Fisher
Scientific, Inc.), which were both supplemented with 10% fetal
bovine serum (Gibco; Thermo Fisher Scientific, Inc.), 100 U/ml
penicillin G and 100 μg/ml streptomycin (Sigma-Aldrich;
Merck KGaA). All cell lines were incubated at 37°C in 5%
CO2.
Construction of recombinant lentivirus
and infection
A short hairpin RNA (shRNA) targeting human SKA1
(SKA1-shRNA; 5'-GGA GAT GAG ATC ATT GTA A-3') was inserted into the
lentivirus expression plasmid pFH-L (Genechem, Inc.). Non-silencing
shRNA (5'-GGA GAT GAG ATC ATT GTA A-3') was used as a control
(control-shRNA). Recombinant pFH-L plasmids (20 μg) and two
other helper plasmids [pVSVG-I (15 μg) and pCMV-R8.92 (10
μg)] (Shanghai Hollybio) were transfected into 293T cells
using Lipofectamine® 2000 (Invitrogen; Thermo Fisher
Scientific, Inc.) to package lenti-virus expressing SKA1-shRNA or
control-shRNA. After 48 h, the supernatant was collected and the
concentrated supernatant was used to infect TE-1 cells
(multiplicity of infection, 10) following titer determination. TE-1
cells infected with lentivirus expressing SKA1-shRNA or
control-shRNA were termed shSKA1 or shCtrl, respectively.
RNA extraction and reverse
transcription-quantitative polymerase chain reaction (RT-qPCR)
TE-1 cells of the shSKA1 or shCtrl groups were
cultured for 48 h and cells were then collected for RNA extraction.
TRIzol® (Invitrogen; Thermo Fisher Scientific, Inc.) was
used according to the manufacturer's protocol to extract total RNA
from tumor tissues and cultured cells. Complementary DNA (cDNA) was
prepared using superscript III reverse transcriptase (Invitrogen;
Thermo Fisher Scientific, Inc.), according to the manufacturer's
protocol. qPCR was performed using SYBR Green qPCR SuperMix
(Invitrogen; Thermo Fisher Scientific, Inc.) to detect mRNA
expression with the following conditions: 95°C for 2 min; 40 cycles
of 95°C for 15 sec and 60°C for 1 min. GAPDH cDNA was amplified and
used as an internal standard. The primers used were as follows:
SKA1 forward, 5'-TTC CCA TTT GCC TCA AGT AAC AG-3' and reverse,
5'-GGA ACA CCA TTG AAC TCA TCA CAA G-3'; and GAPDH forward, 5'-GCA
CCG TCA AGG CTG AGA AC-3' and reverse, 5'-TGG TGA AGA CGC CAG TGG
A-3'. Relative expression was calculated using the
2-ΔΔCq method (16).
Western blot analysis
TE-1 cells of the shSKA1 or shCtrl groups were
cultured for 48 h and cells were then collected for total protein
extraction. Total protein was extracted using ice-cold
radioimmunoprecipitation assay extraction and lysis buffer (Takara
Bio, Inc.) containing a proteinase inhibitor cocktail (Takara Bio,
Inc.). The concentration of total protein was determined using a
BCA Protein assay kit (Nanjing KeyGen Biotech Co., Ltd.), according
to the manufacturer's protocol. The extracted proteins (30
μg) were separated by 10% SDS-PAGE and the separated protein
bands were transferred onto nitrocellulose membranes. The membranes
were incubated with rabbit anti-SKA1 antibody (1:500; cat. no.
ab91550; Abcam) and rabbit anti-GAPDH antibody (1:10,000; cat. no.
ab181602; Abcam) at 4°C overnight, followed by treatment with
horseradish peroxidase-conjugated goat anti-rabbit IgG H&L
secondary antibody (1:10,000; SouthernBiotech) for 40 min at 25°C.
The protein bands were visualized using enhanced chemiluminescence
substrate (Thermo Scientific Inc.). The expression of all proteins
was normalized against that of GAPDH.
Cell count assay
TE-1 cells of the shSKA1 and shCtrl groups were
seeded into 96-well plates (1,500 cells/well) and incubated at 37°C
under 5% CO2 for 4 days. The cell count assay was
performed using a Celigo Imaging Cytometer (Nexcelom Bioscience),
according to the manufacturer's protocol. The captured cell images
were analyzed using Celigo software (Nexcelom Bioscience).
Cell viability assay
CellTiter 96® AQueous One Solution assay
kit was used to detect cell viability. Briefly, TE-1 cells
(2x10³/well) of the shSKA1 and
shCtrl groups were seeded in 96-well plates. After 1, 2 or 3 days
of incubation, the cells were treated with 5 mg/ml MTS reagent and
incubated for 4 h at 37°C. Following incubation, the supernatant
was used to measure the optical density (OD) at a wavelength of 490
nm using a microplate reader. All experiments were performed in
triplicate. Cell viability was calculated using the following
equation: Cell viability (%)=(OD value of tested group/OD value of
shCtrl group) x100%.
Cell cycle analysis
TE-1 cells of the shSKA1 and shCtrl groups were
seeded in six-well plates (4x10⁵/well). After 2 days, the cell cycle was
analyzed using propidium iodide (Sigma-Aldrich; Merck KGaA)
staining for 30 min at 37°C and flow cytometry (Cytomics FC 500
MPL, Beckman Coulter, Inc.). Results were analyzed using ModfitLT,
version 2.0 (Verity Software House Inc.). All experiments were
performed in triplicate.
Apoptotic assay
The ApoScreen Annexin V Apoptosis kit (Southern
Biotech) was used to label apoptotic cells, according to the
manufacturer's protocol. Following culture for 48 h, TE-1 cells of
the shSKA1 or shCtrl groups were harvested and stained with Annexin
V-APC, followed by flow cytometry analysis (FACSCalibur; Becton,
Dickinson and Company) after 15 min of incubation at 25°C. Results
were analyzed using BD FACSDiva software (version 8.0; Becton,
Dickinson and Company). All experiments were performed in
triplicate.
Migration assay
TE-1 cells (4x10⁴)
of the shSKA1 and shCtrl groups were seeded onto the upper chamber
of a Transwell plate in serum-free RPMI-1640 medium. RPMI-1640
medium (600 μl) with 20% fetal bovine serum (Gibco; Thermo
Fisher Scientific, Inc.) was added to the lower chamber of the
Transwell plate. After 48 h, the migration of cells to the lower
chamber of the Transwell plate was determined. Cells were stained
with 0.1% crystal violet in 20% ethanol for 10 min at 25°C, and the
number of cells was counted in five independent fields under a
light microscope (magnification, x200). All experiments were
performed in triplicate.
Statistical analysis
SPSS 19.0 software (SPSS, Inc.) was used for all
statistical analyses. The significant difference in SKA1 expression
between tumor and paratumor samples was evaluated using a χ2 test.
The Kaplan-Meier method was used to analyze the survival rate and
the significance of the survival difference was calculated using a
log-rank test. Independent prognostic factors were determined
through Cox regression multivariate analysis. Statistical
comparisons between two groups were analyzed using an unpaired
Student's t-test. Statistical analysis for more than two groups was
performed using one-way ANOVA followed by a post-hoc least
significant difference test. P<0.05 was considered to indicate a
statistically significant difference.
Results
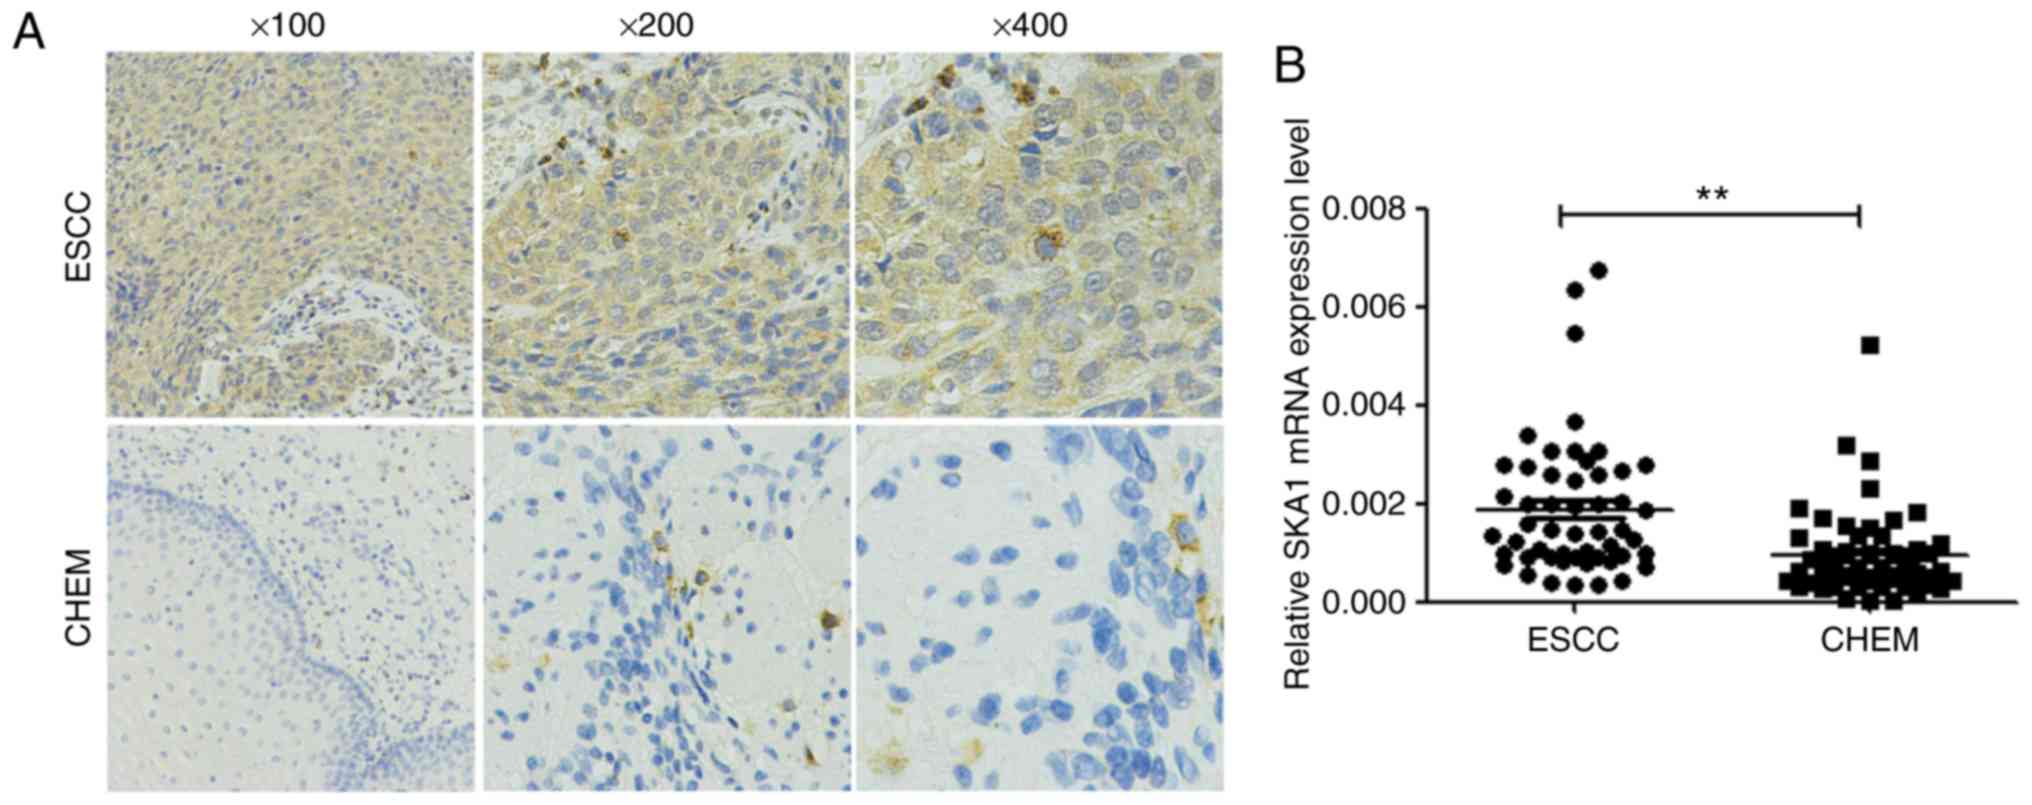
SKA1 is significantly overexpressed in
ESCC tissues
As presented in Fig.
1A, SKA1 expression was predominantly detected in the cytoplasm
of tumor cells. SKA1 protein expression was markedly higher in ESCC
tissues compared with in CHEM tissues (Fig. 1A). Of the 110 samples, 68 (61.8%)
tumor samples and only 29 (26.4%) CHEM samples exhibited a high
SKA1 expression. In addition, SKA1 mRNA expression was
significantly higher in ESCC tissues compared with in CHEM tissues
(Fig. 1B).
SKA1 overexpression is associated with
clinicopathological parameters
The association between SKA1 expression and
clinicopathological parameters is presented in Table I. No significant associations were
identified between SKA1 expression and age, sex, tumor size or
pathological T stage. However, SKA1 overexpression was
significantly associated with differentiation, pathological N stage
and pathological TNM stage (Table
I).
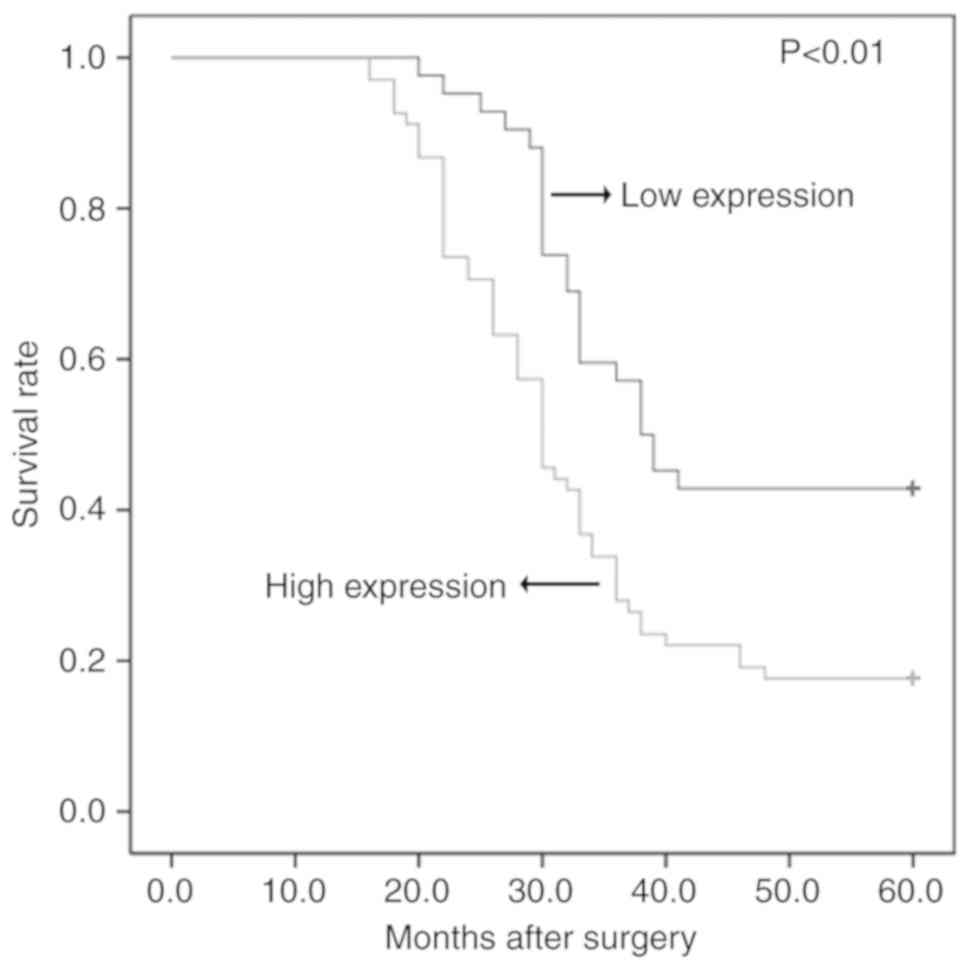
SKA1 protein overexpression is associated
with the prognosis of patients with ESCC
Follow-up data were available for all patients
included in the present study. The results of Kaplan-Meier analysis
indicated that the overall 5-year survival rate was 27.27%.
Patients with high SKA1 protein expression had a 5-year survival
rate of 17.64%, compared with a survival rate of 42.85% for
patients with low SKA1 expression (P<0.01; Fig. 2). The results of multivariate
analysis revealed that pathological TNM stage and SKA1 protein
overexpression were independent prognostic factors for ESCC
(Table II).
| Table IIResults of multivariate Cox
regression analysis. |
Table II
Results of multivariate Cox
regression analysis.
| Variable | B | SE | Wald | P-value | HR | 95% CI |
|---|
|
Differentiation | 0.103 | 0.185 | 0.310 | 0.578 | 1.109 | 0.771-1.594 |
| Pathological N
stage | 0.484 | 0.349 | 1.921 | 0.166 | 1.622 | 0.819-3.215 |
| Pathological TNM
stage | 0.823 | 0.323 | 6.476 | 0.011 | 2.278 | 1.208-4.293 |
| SKA1
expression | 0.553 | 0.255 | 4.724 | 0.030 | 1.739 | 1.056-2.864 |
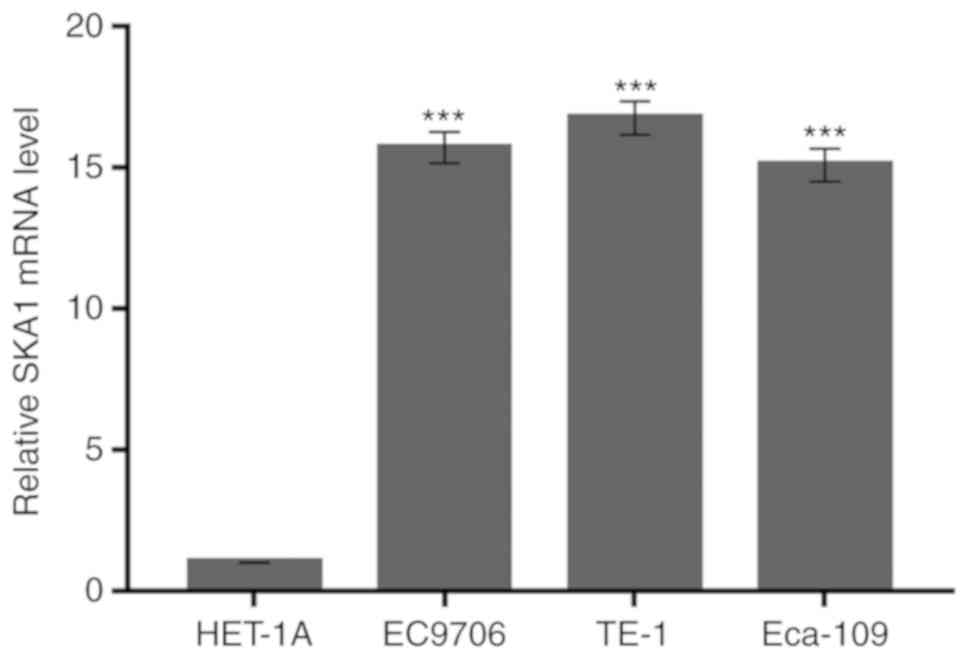
SKA1 is significantly overexpressed in
ESCC cells
The mRNA expression of SKA1 in the human ESCC cell
lines TE-1, EC9706 and Eca-109, and a human esophageal epithelial
cell line HET-1A was investigated through RT-qPCR analysis. It was
identified that the expression of SKA1 mRNA was significantly
higher in TE-1, EC9706 and Eca-109 cells compared with in HET-1A
cells (Fig. 3). Among the ESCC
cell lines, the SKA1 mRNA level was highest in TE-1 cells.
Therefore, TE-1 cells were selected for the following assays.
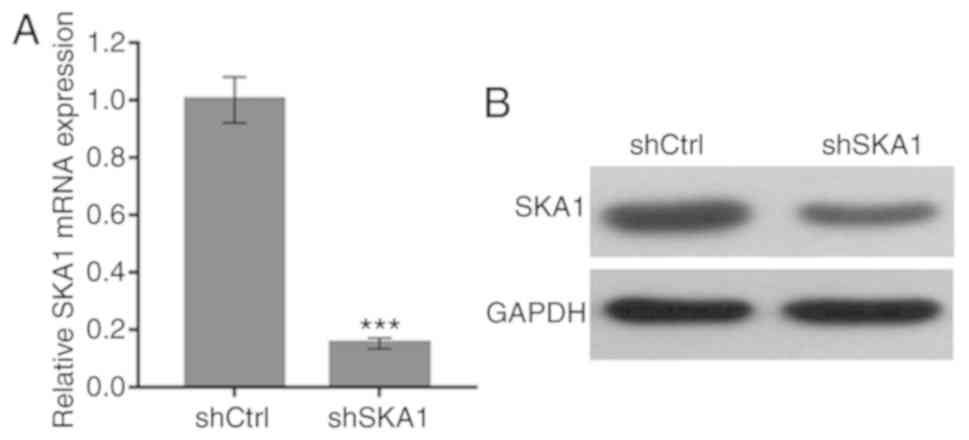
Expression of SKA1 is downregulated in
TE-1 cells following transfection with lentivirus-mediated
shRNA
To evaluate the functions of SKA1 in ESCC cells,
SKA1 expression was knocked-down by lentivirus-mediated shRNA
transfection. The mRNA and protein expression levels of SKA1 were
evaluated using RT-qPCR and western blot analysis, respectively. In
comparison with the shCtrl group, the cells transfected with shSKA1
demonstrated a marked reduction in the mRNA and protein expression
levels of SKA1 (Fig. 4).
Therefore, lentivirus-mediated shRNA knockdown was demonstrated to
serve as an effective strategy to knockdown SKA1 expression in EC
cells.
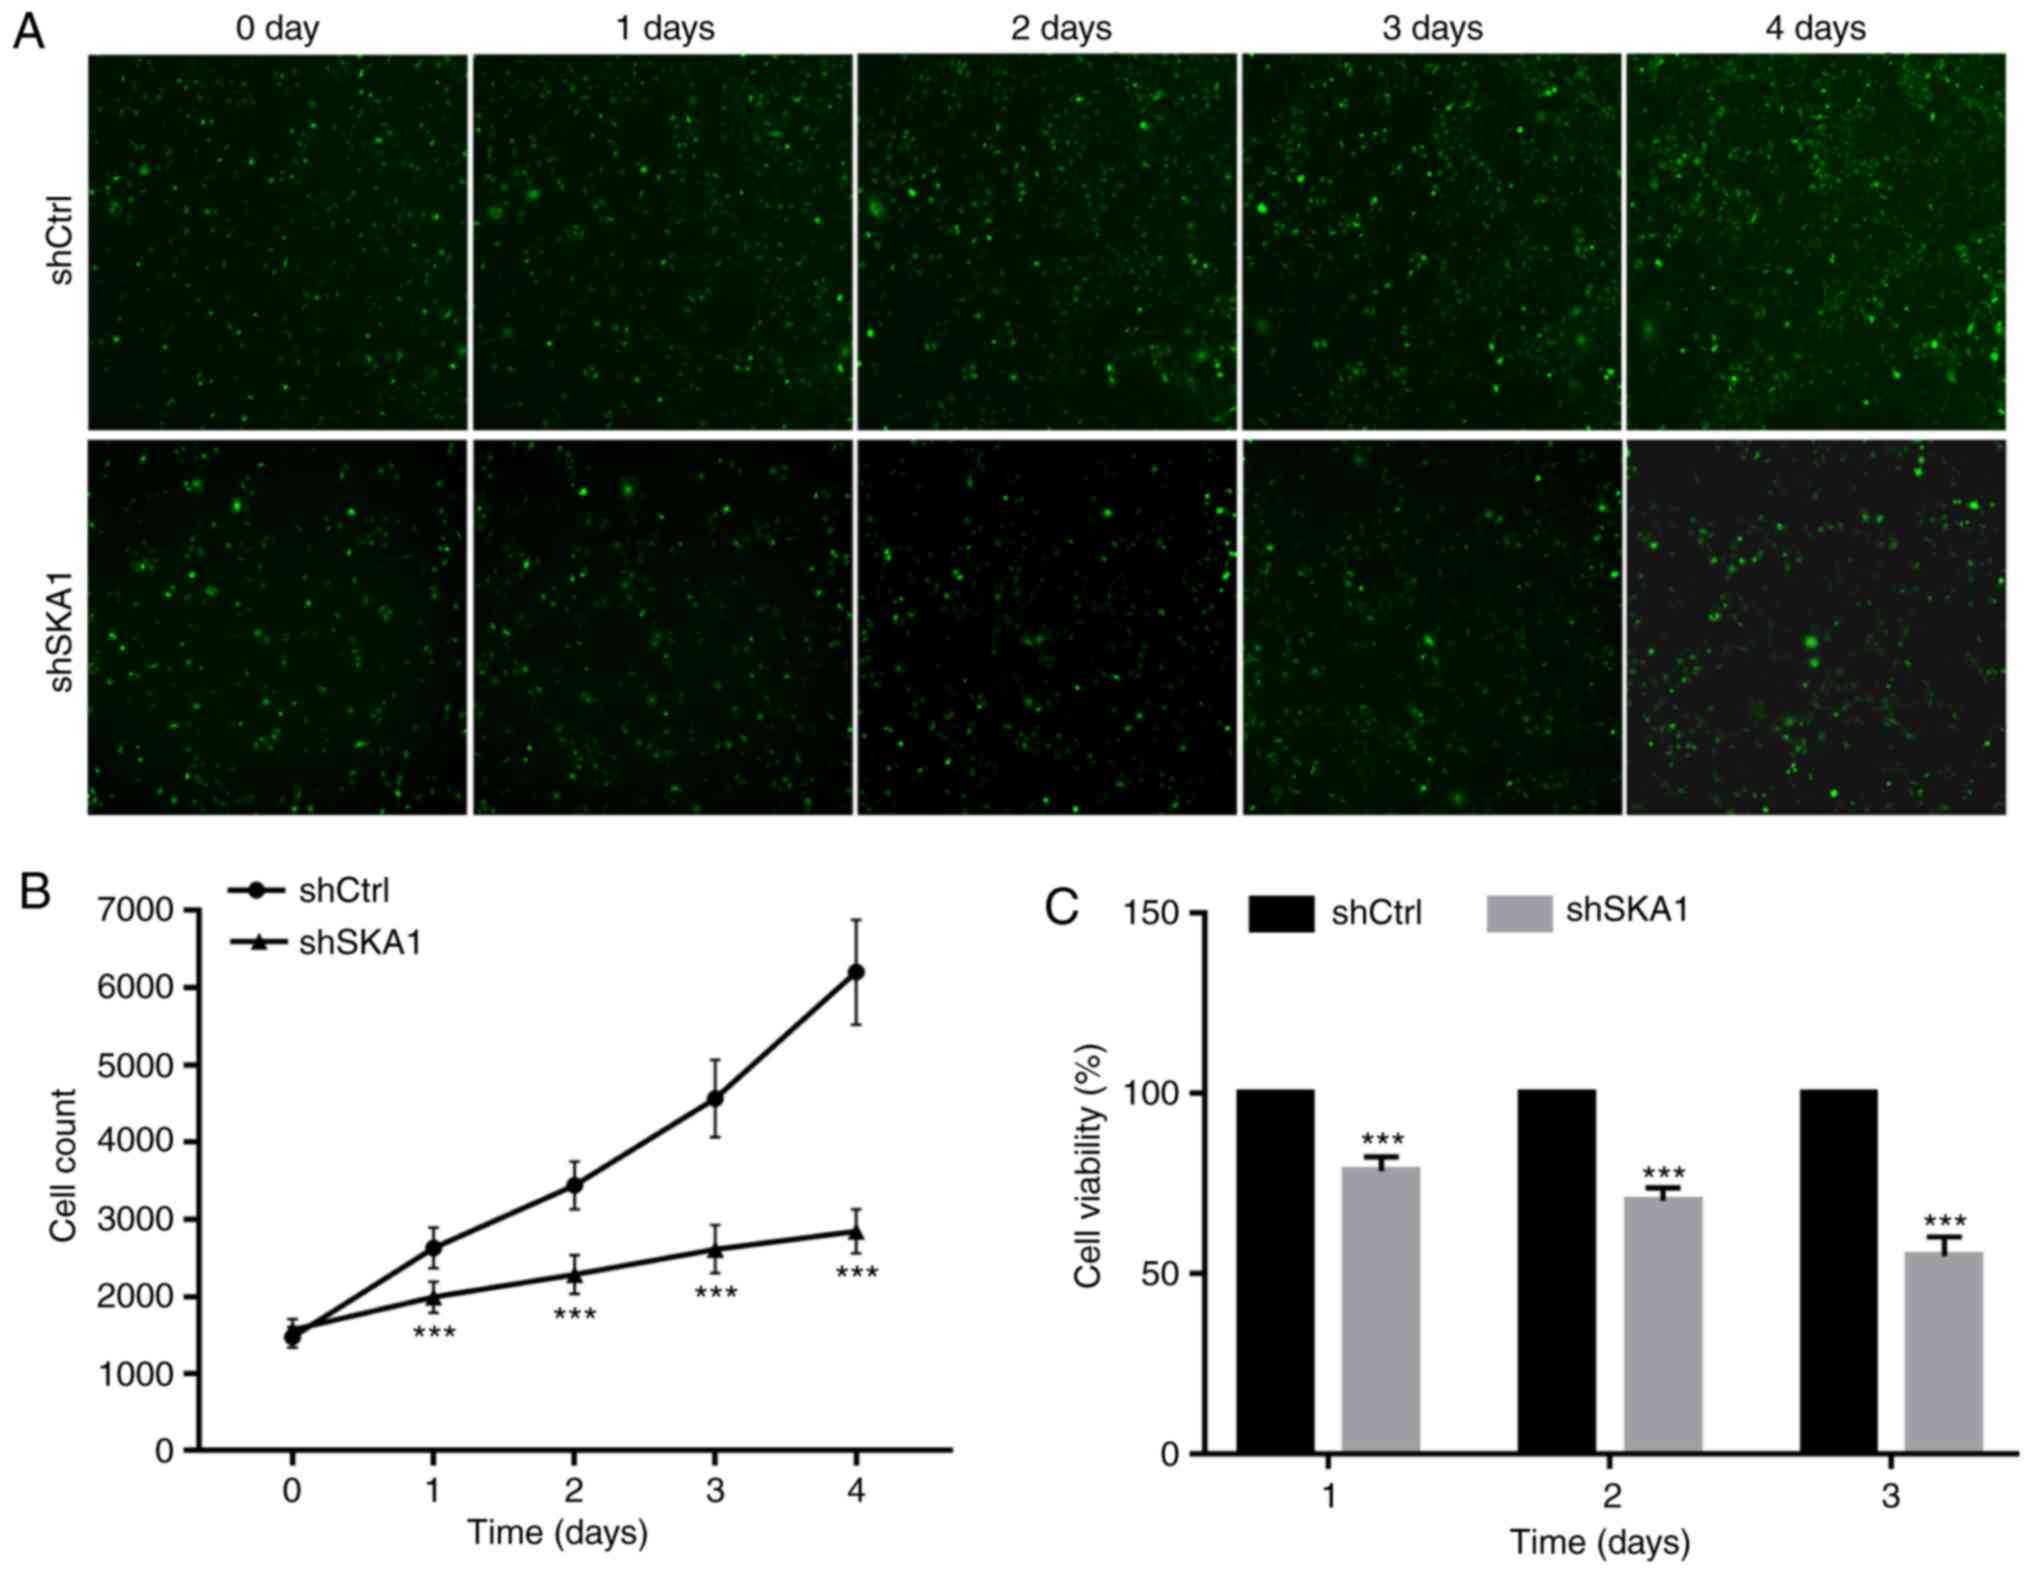
SKA1-knockdown suppresses the
proliferation of TE-1 cells
Celigo image cytometry analysis and an MTS assay
were used to evaluate the effect of SKA1-knockdown on the
proliferation ability of TE-1 cells. As presented in Fig. 5A and B, the cell number in the
shSKA1 group was significantly lower compared with that in the
shCtrl group at days 1-4. In addition, the results of the MTS
assays demonstrated that the percentage of cell viability in the
shSKA1 group was significantly lower compared with that of the
shCtrl group at days 1, 2 and 3 (Fig.
5).
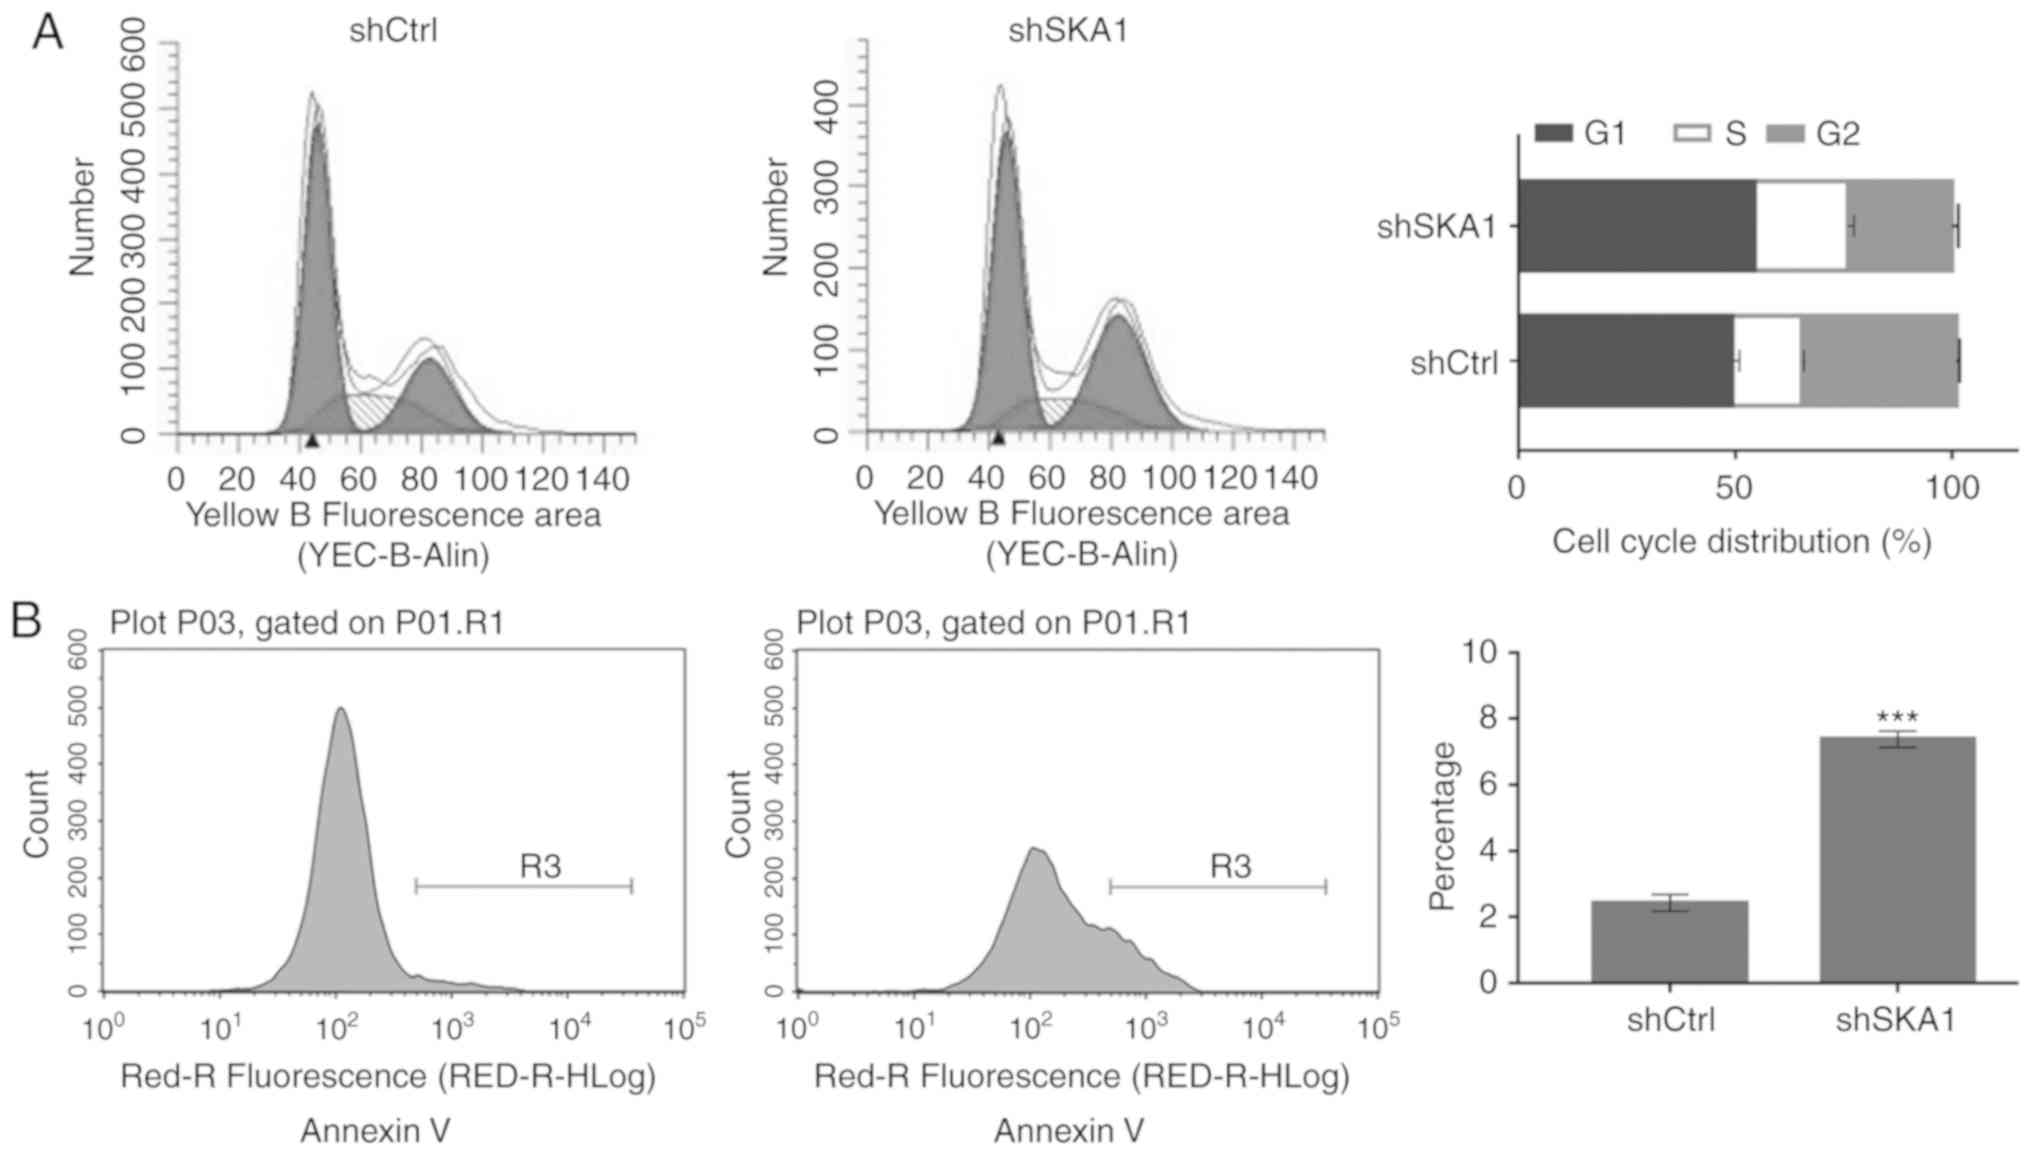
SKA1-knockdown arrests cell cycle
progression and induces the apoptosis of TE-1 cells
It was identified that the proportion of cells in
the G1 and S phases was significantly higher in the shSKA1 group
compared with in the shCtrl group (Fig. 6A). In addition, apoptosis analysis
revealed that the apoptosis rate was significantly higher in the
shSKA1 group compared with in the shCtrl group (Fig. 6B). In summary, these results
suggest that silencing SKA1 expression in TE-1 cells may lead to
cell cycle arrest at the G1/S phase and promote apoptosis.
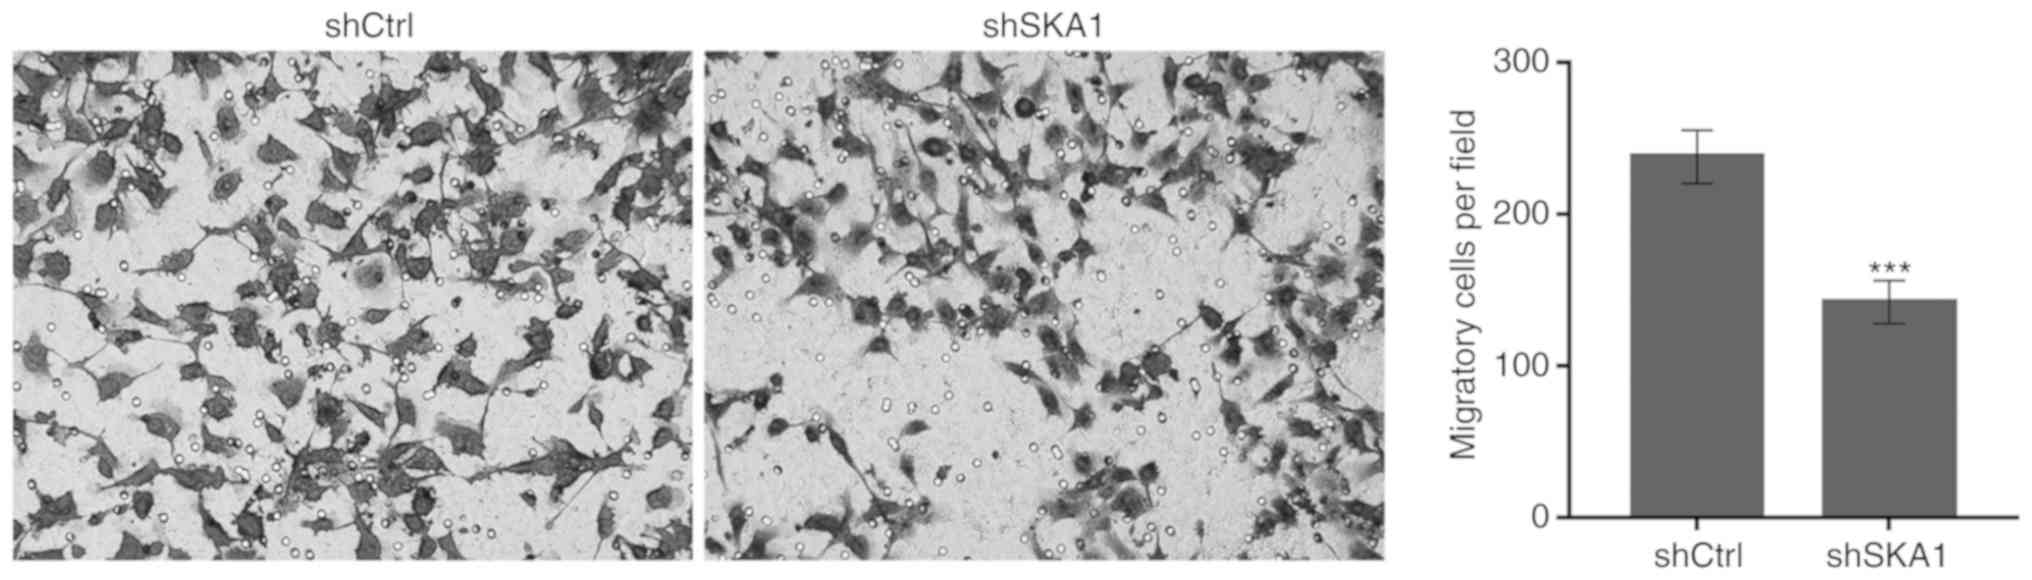
SKA1-knockdown suppresses the migration
ability of TE-1 cells
To determine the role of SKA1 expression in ESCC
metastasis, the present study investigated the association between
SKA1 expression and TE-1 cell migration ability. The results
demonstrated that the number of migratory cells per field was
significantly lower in the shSKA1 group compared with in the shCtrl
group, indicating that the migration ability was significantly
reduced in the cells lacking SKA1 expression compared with the
control cells (Fig. 7).
Discussion
ESCC is a highly invasive type of malignant tumor
with a high probability of lymph node metastasis. The incidence
rate of ESCC is high worldwide, particularly in China (4). The identification of ESCC-associated
oncogenes and the evaluation of their molecular and biological
functions are critical to understand the molecular mechanism
underlying the carcinogenesis of ESCC.
The present study identified that SKA1 expression
was upregulated in ~61.82% of ESCC tissues compared with CHEM
tissues, as demonstrated by an IHC assay. In comparison with CHEM
tissues, ESCC tissues demonstrated an increase in the mRNA
expression of SKA1. SKA1 is local-ized on chromosome 18q21.1, is
~30 kDa in size and consists of 255 amino acid residues (17). SKA1 is an indispensable component
essential for the stable binding of the kinetochore and
microtubule. The formation of the SKA complex ensures the correct
positioning of the spindle and kinetochore, and promotes transition
throughout the process of mitosis (18-20). Evidence suggests that SKA1 may
serve as a diagnostic molecular marker or independent prognostic
factor for various malignant tumors. SKA1 expression is positively
associated with recurrence, perineural invasion and poor survival
in primary salivary adenoid cystic carcinoma (13). Furthermore, the expression of SKA1
has been reported to be increased in hepatocellular carcinoma and
can serve as a prognostic marker (21). Consistent with the results of
previous studies, the present study identified that SKA1
overexpression is associated with cancer cell differentiation,
pathological N stage and pathological TNM stage in ESCC. These
findings suggest that SKA1 overexpression may serve as an
independent prognostic factor for ESCC.
SKA1 acts as an oncogene and is closely associated
with the proliferation, apoptosis and migration of tumor cells.
SKA1 regulates tumor development and knockdown of SKA1 expression
results in inhibition of cell proliferation, induction of cell
cycle arrest and promotion of apoptosis in hepatocellular carcinoma
(22) and bladder cancer
(23). Furthermore, knockdown of
SKA1 expression also reduces the proliferation and migration of
non-small cell lung cancer (24)
and adenoid cystic carcinoma (25) cells. SKA1 promotes prostate
tumorigenesis by enhancing centriole over-duplication and
centrosome amplification (26).
However, to the best of our knowledge, no study has reported the
function of SKA1 in ESCC. The present study identified that SKA1
expression is significantly increased in ESCC cells and that
SKA1-silencing can inhibit cell proliferation and migration, arrest
cell cycle progression, and promote cell apoptosis. These results
suggest that SKA1 is an oncogene and that the downregulation of
SKA1 expression may markedly inhibit tumorigenicity, which is
consistent with the results of previous studies (22-25). In summary, these results suggest
that SKA1 may be a potential therapeutic target for the targeted
treatment of ESCC.
The present study had certain limitations. Firstly,
in vivo experiments were not performed to further confirm
the effect of SKA1-knockdown on the growth of subcutaneous tumors
and lung metastasis. Secondly, the regulatory mechanism of SKA1 in
ESCC was not studied. Future studies are required to further
confirm the potential of SKA1 as a therapeutic target for the
targeted treatment of ESCC.
In conclusion, the present study identified that
SKA1 is overexpressed and serves as a prognostic marker in ESCC.
SKA1-silencing suppressed the development of ESCC, suggesting that
it could be a potential therapeutic target for the treatment of
ESCC. However, further research is required to determine the
mechanism underlying the upregulated expression of SKA1 in ESCC and
its involvement in the generation and development of ESCC. Taken
together, our findings indicate that SKA1 is a potential
therapeutic target and a prognostic biomarker for ESCC.
Funding
The present study was supported by the Nature
Science Foundation of Shandong Province (grant no.
ZR2019PH034).
Availability of data and materials
Datasets analyzed during the current study are
available from the corresponding author on reasonable request.
Authors' contributions
DH and MZ made substantial contributions to the
conception and design of the study. DH, ZL and XL made substantial
contributions to acquisition of data. DH and HF made substantial
contributions to the analysis and interpretation of data. DH was
involved in drafting the manuscript. MZ was involved in critically
revising the manuscript for important intellectual content. All of
authors have given final approval for the present version of the
manuscript to be published.
Ethics approval and consent to
participate
The Research Ethics Committee of Shandong Provincial
Hospital Affiliated to Shandong University (Jinan, China) approved
the study protocol, and all participants provided written informed
consent.
Patient consent for publication
Not applicable.
Competing interests
The authors declare that they have no competing
interests.
Acknowledgements
Not applicable.
Abbreviations:
|
SKA1
|
spindle and kinetochore-associated
protein 1
|
|
ESCC
|
esophageal squamous cell carcinoma
|
|
TNM
|
tumor-node-metastasis
|
|
EC
|
esophageal cancer
|
References
|
1
|
Bray F, Ferlay J, Soerjomataram I, Siegel
RL, Torre LA and Jemal A: Global cancer statistics 2018: GLOBOCAN
estimates of incidence and mortality worldwide for 36 cancers in
185 countries. CA Cancer J Clin. 68:394–424. 2018. View Article : Google Scholar : PubMed/NCBI
|
|
2
|
Chen W, Zheng R, Zeng H, Zhang S and He J:
Annual report on status of cancer in China, 2011. Chin J Cancer
Res. 27:2–12. 2015. View Article : Google Scholar : PubMed/NCBI
|
|
3
|
Chen W, Zheng R, Baade PD, Zhang S, Zeng
H, Bray F, Jemal A, Yu XQ and He J: Cancer statistics in China,
2015. CA Cancer J Clin. 66:115–132. 2016. View Article : Google Scholar : PubMed/NCBI
|
|
4
|
Arnold M, Soerjomataram I, Ferlay J and
Forman D: Global incidence of oesophageal cancer by histological
subtype in 2012. Gut. 64:381–387. 2015. View Article : Google Scholar
|
|
5
|
Zeng H, Zheng R, Guo Y, Zhang S, Zou X,
Wang N, Zhang L, Tang J, Chen J, Wei K, et al: Cancer survival in
China, 2003-2005: A population-based study. Int J Cancer.
136:1921–1930. 2015. View Article : Google Scholar
|
|
6
|
Yang CS, Chen X and Tu S: Etiology and
prevention of esophageal cancer. Gastrointest Tumors. 3:3–16. 2016.
View Article : Google Scholar : PubMed/NCBI
|
|
7
|
Abnet CC, Arnold M and Wei WQ:
Epidemiology of esophageal squamous cell carcinoma.
Gastroenterology. 154:360–373. 2018. View Article : Google Scholar :
|
|
8
|
Wang M, Smith JS and Wei WQ: Tissue
protein biomarker candidates to predict progression of esophageal
squamous cell carcinoma and precancerous lesions. Ann N Y Acad Sci.
1434:59–69. 2018. View Article : Google Scholar : PubMed/NCBI
|
|
9
|
Zulfiqar M, Bluth MH and Bhalla A:
Molecular diagnostics in esophageal and gastric neoplasms: 2018
update. Clin Lab Med. 38:357–365. 2018. View Article : Google Scholar : PubMed/NCBI
|
|
10
|
Welburn JP, Grishchuk EL, Backer CB,
Wilson-Kubalek EM, Yates JR III and Cheeseman IM: The human
kinetochore Ska1 complex facilitates microtubule
depolymerization-coupled motility. Dev Cell. 16:374–385. 2009.
View Article : Google Scholar : PubMed/NCBI
|
|
11
|
Schmidt JC, Arthanari H, Boeszoermenyi A,
Dashkevich NM, Wilson-Kubalek EM, Monnier N, Markus M, Oberer M,
Milligan RA, Bathe M, et al: The kinetochore-bound Ska1 complex
tracks depolymerizing microtubules and binds to curved
protofilaments. Dev Cell. 23:968–980. 2012. View Article : Google Scholar : PubMed/NCBI
|
|
12
|
Dong C, Wang XL and Ma BL: Expression of
spindle and kinetochore-associated protein 1 is associated with
poor prognosis in papillary thyroid carcinoma. Dis Markers.
2015:6165412015. View Article : Google Scholar : PubMed/NCBI
|
|
13
|
Zhao L, Jiang L, Du P, Zhang D, Liu Z, Li
K and Zhang B: Expression of SKA1 and MMP-9 in primary salivary
adenoid cystic carcinoma: Correlation with tumor progression and
patient prognosis. Acta Otolaryngol. 136:575–579. 2016. View Article : Google Scholar : PubMed/NCBI
|
|
14
|
Wu J, Chai Y, Zhou XM, Chen QX and Yan FL:
Ivor Lewis esophagectomy with two-field lymph node dissection for
squamous cell carcinoma of the lower thoracic esophagus. Ai Zheng.
26:307–311. 2007.PubMed/NCBI
|
|
15
|
Shi M, Wang Z, Liu XY and Chen D:
Inactivation of RUNX3 predicts poor prognosis in esophageal
squamous cell carcinoma after Ivor-Lewis esophagectomy. Med Oncol.
31:3092014. View Article : Google Scholar : PubMed/NCBI
|
|
16
|
Livak KJ and Schmittgen TD: Analysis of
relative gene expression data using real-time quantitative PCR and
the 2(-Delta Delta C(T)) method. Methods. 25:402–408. 2001.
View Article : Google Scholar
|
|
17
|
Sauer G, Körner R, Hanisch A, Ries A, Nigg
EA and Silljé HH: Proteome analysis of the human mitotic spindle.
Mol Cell Proteomics. 4:35–43. 2005. View Article : Google Scholar
|
|
18
|
Park JE, Song H, Kwon HJ and Jang CY: Ska1
cooperates with DDA3 for spindle dynamics and spindle attachment to
kineto-chore. Biochem Biophys Res Commun. 470:586–592. 2016.
View Article : Google Scholar : PubMed/NCBI
|
|
19
|
Thomas GE, Bandopadhyay K, Sutradhar S,
Renjith MR, Singh P, Gireesh KK, Simon S, Badarudeen B, Gupta H,
Banerjee M, et al: EB1 regulates attachment of Ska1 with
microtubules by forming extended structures on the microtubule
lattice. Nat Commun. 7:116652016. View Article : Google Scholar : PubMed/NCBI
|
|
20
|
Abad MA, Zou J, Medina-Pritchard B, Nigg
EA, Rappsilber J, Santamaria A and Jeyaprakash AA: Ska3 ensures
timely mitotic progression by interacting directly with
microtubules and Ska1 microtubule binding domain. Sci Rep.
6:340422016. View Article : Google Scholar : PubMed/NCBI
|
|
21
|
Chen Y, Zhao J, Jiao Z, Wang W, Wang D, Yu
X, Shi Z, Ge N, Pan Q, Xia J, et al: SKA1 overexpression is
associated with poor prognosis in hepatocellular carcinoma. BMC
Cancer. 18:12402018. View Article : Google Scholar : PubMed/NCBI
|
|
22
|
Qin X, Yuan B, Xu X, Huang H and Liu Y:
Effects of short interfering RNA-mediated gene silencing of SKA1 on
proliferation of hepatocellular carcinoma cells. Scand J
Gastroenterol. 48:1324–1332. 2013. View Article : Google Scholar : PubMed/NCBI
|
|
23
|
Tian F, Xing X, Xu F, Cheng W, Zhang Z,
Gao J, Ge J and Xie H: Downregulation of SKA1 gene expression
inhibits cell growth in human bladder cancer. Cancer Biother
Radiopharm. 30:271–277. 2015. View Article : Google Scholar : PubMed/NCBI
|
|
24
|
Shen L, Yang M, Lin Q, Zhang Z, Miao C and
Zhu B: SKA1 regulates the metastasis and cisplatin resistance of
non-small cell lung cancer. Oncol Rep. 35:2561–2568. 2016.
View Article : Google Scholar : PubMed/NCBI
|
|
25
|
Zhao LJ, Yang HL, Li KY, Gao YH, Dong K,
Liu ZH, Wang LX and Zhang B: Knockdown of SKA1 gene inhibits cell
proliferation and metastasis in human adenoid cystic carcinoma.
Biomed Pharmacother. 90:8–14. 2017. View Article : Google Scholar : PubMed/NCBI
|
|
26
|
Li J, Xuan JW, Khatamianfar V, Valiyeva F,
Moussa M, Sadek A, Yang BB, Dong BJ, Huang YR and Gao WQ: SKA1
over-expression promotes centriole over-duplication, centrosome
amplification and prostate tumourigenesis. J Pathol. 234:178–189.
2014.PubMed/NCBI
|