Introduction
Huntington's disease (HD) (1) is an autosomal dominant lethal
neurodegenerative disorder that causes a wide range of symptoms
including: Involuntary movements, clumsiness, lack of
concentration, memory lapses, mood swings and depression. It is
caused by an abnormal expansion (>35 copies) of a CAG triplet
located in exon 1 of the gene encoding the huntingtin protein
(Htt), with consequent expansion of a polyglutamine repeat in the
protein (2). The expansion of the
CAG-rich region makes mutant Htt (mHtt) very unstable and able to
aggregate with itself and/or other proteins, forming clumps.
However, cytotoxicity and neurodegeneration has been shown to
correlate with the amount of soluble, monomeric mHtt levels but not
with mHtt aggregates and oligomers, which are thought to be
neuroprotective, at least at some stages (3-6).
Although several symptomatic treatments are available, no cure for
this serious neurological disease is available (1). Furthermore, neither Htt function has
been entirely understood, nor have the molecular mechanisms
underlying mHtt cytotoxicity been clarified yet (3,7).
While Htt and mHtt are ubiquitously expressed
throughout the brain and peripheral tissues, HD is characterized by
highly selective degradation of the corpus striatum (8), with no notable alterations in
peripheral tissues. The corpus striatum is a brain region that
regulates the tuning and planning of movements, emotion, and higher
brain function (9). Therefore,
the cardinal symptoms of HD include a choreiform involuntary
movement disorder, clumsiness, concentration deficiency, memory
lapses, mood swings and depression (10).
Screening for mRNAs preferentially expressed in
rodent striatum led to the discovery of a gene encoding for a GTP
binding protein with similarity to Ras family members (11). Due to these features, i.e.,
enrichment in the striatum and homology with Ras proteins, the
newly discovered protein was termed Ras homolog enriched in
striatum (RHES). The striatal high expression levels suggest that
RHES is likely to play an important role in striatal physiology and
pathology, and in particular in HD. Indeed, RHES has been shown to
physiologically bind mHtt to a larger extent that wild-type Htt,
and greatly increase mHtt sumoylation in a time- and
concentration-dependent manner, while decreasing ubiquitination.
This results in a decrease of mHtt degradation and increase in the
levels of the cytotoxic, soluble mHtt form (12). While RHES can sumoylate other
substrates, like Ran guanosine triphosphatase (GTPase)-activating
protein, mHtt sumoylation is highly specific with respect to both
wild-type Htt (that RHES does not sumoylate) and ataxin, another
protein containing a poly-Q stretch (that RHES does not bind)
(12). RHES plays several roles
in the sumoylation process: It acts as a SUMO-E3 ligase,
significantly enhancing the ability of the ubiquitin carrier
protein 9 (Ubc9), the only known SUMO-E2 ligase, to sumoylate mHtt
(preferentially on lysine residues at positions 6, 9, 15 and 91).
Additionally, it enhances cross-sumoylation between SUMO-activating
enzyme subunits 1 (SAE1) and 2 (SAE2), the only known SUMO-E1
ligase, and Ubc9, in a bidirectional fashion (13). As expected on the basis of these
RHES activities, RHES deletion by RNA interference was
neuro-protective in HD cellular models (5,14);
additionally, motor symptoms were either delayed or reduced in two
different RHES knock-out HD mouse models (15,16). Intriguingly, a conflicting result
was also reported according to which RHES silencing by inhibitory
RNA did not improve motor function in HD mouse models and even
increased anxiety and striatal atrophy (17). A possible explanation for this
result lies in the fact that RHES has other activities, in addition
to SUMO-E3 ligase, which are protective towards HD symptoms. In
fact, in addition to the SUMO-E3 ligase activity, RHES exerts a
dual role on autophagy by acting on two different pathways. On the
one hand, it reduces autophagy by activating the mammalian target
of rapamycin (mTOR) autophagy inhibitor (18,19). On the other, it enhances autophagy
independent of mTOR, by directly interacting with autophagy
activator Beclin-1 and freeing it from its interaction with B-cell
lymphoma 2 protein (20).
Autophagy is a lysosomal degradation process implicated in both
aging and neurodegeneration, which has been demonstrated to have a
protective role in both cellular and animal HD models. The result
of RHES dual activity is autophagy activation (20), which explains both the delayed
onset of symptoms in HD and the reported worsening of HD symptoms
upon RHES knocking-out in mouse models (17).
The SUMO-E3 ligase activity on mHtt, bidirectional
regulation of autophagy induction and specific expression in the
corpus striatum, make RHES an intriguing regulator of cell survival
and metabolism through different pathways, as well as an attractive
target for HD treatment. In spite of these intriguing features,
essential information about RHES structure and function are still
missing. As an example, determination of 3D structure or
identification of interactors in human cells have not been
performed so far.
With the aim of shedding light on RHES structural
features, assessing the potential role of RHES as a target for HD
therapy and setting the basis for the development of new treatments
against HD, a 3D model of the RHES region homologous to the Ras
domain was built by homology modelling and analysed. The model was
accurately compared with the experimentally determined 3D
structures of representative members of the Ras family to identify
conserved and variable regions, which correspond to those of higher
and lower reliability in the model, respectively. Since structures
of RHES homologs in complex with molecular partners required to
carry out the SUMO-E3 ligase activity are not available, models of
RHES in complex with either the Htt target or the SUMO-E2 ligase
Ubc9 were built by molecular docking. Analysis of the interfaces
involved in these complexes allowed identification of RHES regions
that can be targeted by either peptides mapping on the RHES surface
or small molecules identified by in silico screenings of
virtual compound libraries.
The identification of compounds able to interfere
with RHES interactions required for mHtt sumoylation and able to
revert the HD phenotype in available cellular and animal HD models
(7,21-23), would represent an important step
towards the development of novel therapeutic strategies against
HD.
Materials and methods
The amino acid sequences and 3D structures (Table I) of proteins analysed in this
study were downloaded from the UniProt (http://www.uniprot.org/) (24) and Protein Data Bank (PDB;
http://www.rcsb.org/pdb/home/home.do)
(25) databases, respectively.
The UniProt and PDB Identifiers (IDs) of the proteins analysed in
the present study are listed in Table
I.
 | Table ISequence and 3D structure identifiers
of the proteins analysed in this work. RHES UniProt ID is:
RHES_HUMAN (Q96D21). |
Table I
Sequence and 3D structure identifiers
of the proteins analysed in this work. RHES UniProt ID is:
RHES_HUMAN (Q96D21).
| Protein name | UniProt ID | PDB ID | Chain | GTP/GDP ligand | Resolution (Å) |
|---|
| DiRas1 | DIRA1_HUMAN
(O95057) | 2GF0 | B | GDP | 1.9 |
| DiRas2 | DIRA2_HUMAN
(Q96HU8) | 2ERX | A | GDP | 1.65 |
| K-Ras | RASK_HUMAN
(P01116) | 5F2E | A | GDP | 1.4 |
| H-Ras | RASH_HUMAN
(P01112) | 2CE2 | A | GDP | 1.0 |
| H-Ras | RASH_HUMAN
(P01112) | 2CL7 | A | GTP | 1.25 |
| Rap1A | RAP1A_HUMAN
(P62834) | 1C1Y | A | GTP | 1.9 |
| Htt | HD_HUMAN
(P42858) | 6EZ8 | A | - | 4.0 |
| Ubc9 | UBC9_HUMAN
(P63279) | 5F6E | A | - | 1.12 |
The BLASTp algorithm (https://blast.ncbi.nlm.nih.gov/Blast.cgi) (26) was used to search the NCBI
databases for homologous protein sequences. Multiple Sequence
Alignments (MSAs) of homologous protein sequences were obtained
using ClustalO (http://www.clustal.org) (27).
Visual inspections and structure analyses were
performed using several programs: SwissPDBViewer (http://spdbv.vital-it.ch/) (28), PyMol (Schrödinger LLC; http://www.pymol.org/), UCSF Chimera package (29) and InsightII (Accelrys Inc.).
Pairwise structural comparisons were performed using
PDBeFOLD (30), as well as tools
provided by the aforementioned programs. The initial
superimpositions provided by these automated methods were manually
refined by including the highest possible number of residues whose
Cα-Cα distance was ≤3.0 Å and discarding those whose Cα-Cα distance
was >3.0 Å, to produce optimal Structure-Based MSAs
(SB-MSAs).
Complete lists of Ras family members and proteins
homologous to the Ubc9 E2-ligase whose 3D structure has been
experimentally determined, were obtained from the Pfam (http://pfam.xfam.org) (31) and Superfamily 2 (32) databases.
Homology modelling of RHES in the GTP- or GDP-bound
conformation was performed using the following programs: I-TASSER
(http://zhanglab.ccmb.med.umich.edu/I-TASSER/)
(33), HHPred (https://toolkit.tuebingen.mpg.de/hhpred)
(34), Phyre2 (http://www.sbg.bio.ic.ac.uk/phyre2/html/page.cgi?id=index)
(35) and Swiss-Model (https://swissmodel.expasy.org/) (28).
Secondary structure predictions were provided by the
JPRED (36) and PSIPRED (37) servers. Short Linear Motifs were
annotated by the ELM resource (38). Signal peptide predictions were
obtained from several servers: SignalP 4.1 (39), Signal-CF (40), Signal-BLAST (41) and Signal-3L 2.0 (42).
Overall, polar and non-polar solvent accessible
surface areas were calculated using the program Naccess (http://wolf.bms.umist.ac.uk/naccess/).
Docking simulations of the interaction between Htt
(Table I) and RHES, and between
RHES and Ubc9 (Table I) were
performed using the protein-protein docking program ZDOCK
(http://zdock.umassmed.edu/; version
3.0.2) (43). ZDOCK implements a
Fast Fourier Transform algorithm and a scoring system based on a
combination of shape complementarity, electrostatics and
statistical potential terms. The 2000 complexes generated by ZDOCK
were re-ranked using ZRANK (44),
which uses a more detailed potential including electrostatics, van
der Waals and desolvation terms. In both cases, the best ranking
complexes obtained by ZRANK are described and discussed in the
following sections. RHES residues were defined to be at the
interface if they have at least one atom within 4.0 Å from any atom
of the Htt or Ubc9 interaction partner in the respective
complexes.
Sumoylation sites on Htt sequence were predicted by
Jassa (http://www.jassa.fr/), a tool that uses
a scoring system based on a Position Frequency Matrix derived from
the alignment of experimental sumoylation sites or SUMO-interacting
motifs (SIMs) (45).
All software and databases used in this study are
publicly available. For all software, default parameters and
thresholds were used. Databases were last queried on January 15th,
2019.
Images were generated using either PyMol (http://www.pymol.org/) or the UCSF Chimera package
(29).
Results
RHES homology models building and
expected accuracy
The results of a BLASTp search in the NCBI database
of sequences of known 3D structures (pdb) (46) using RHES sequence as input,
indicate that the two closest homologues of known structure are the
distinct subgroup of the Ras family member 1 and 2 (DiRas1 and
DiRas2) human proteins (Table I),
both of which were determined in the inactive GDP bound state.
These proteins match RHES regions comprised between residues 18-191
and 13-189 with E-values of 5x10-36 and
5x10-42, respectively. The closest RHES homologue
determined in the GTP-bound conformation is Ras-related protein 1A
(Rap1A; Table I), which matches
RHES region 20-186 with an E-value of 8x10-32.
Conversely, neither the N-terminal (residues 1-12)
nor the C-terminal (residues 192-253) region matches any protein of
known structure with significant E-values (i.e., below
10-2), either when the whole RHES sequence or the
sequence of these regions alone is given as input to BLASTp.
Several automated methods were exploited to build 3D
models of RHES in the active or 'on' GTP-bound (RHES-GTP) and
inactive or 'off' GDP-bound (RHES-GDP) conformations (see Materials
and methods). These programs were chosen because of their ability
to consistently provide accurate protein structure predictions in
blind tests, i.e., in the absence of information about the
experimental structure, in several rounds of the Critical
Assessment of Structure Prediction experiment (http://predictioncenter.org/) (47).
Automated structure comparisons indicated that in
the Ras domain region, the best RHES models provided by the
different structure prediction methods for each conformation were
highly similar to one another and to the main templates used in the
modelling procedure. Based on their highest structural similarity
with the main templates, the best models provided by Swiss-Model
were selected for further studies.
To obtain models of complexes with GTP and GDP
ligands, RHES-GTP and RHES-GDP models were optimally superimposed
to the experimentally determined structures of the closest
homologues determined in each conformation, i.e., Rap1A and DiRas2,
respectively. Once optimal model-to-structure superimpositions had
been obtained (Fig. 1), GTP and
GDP ligands were docked to the RHES-GTP and RHES-GDP models,
respectively, by importing their coordinates from the structure of
Rap1A-GTP and DiRas2-GDP complexes and performing small manual
adjustments to relieve unfavourable van der Waals contacts.
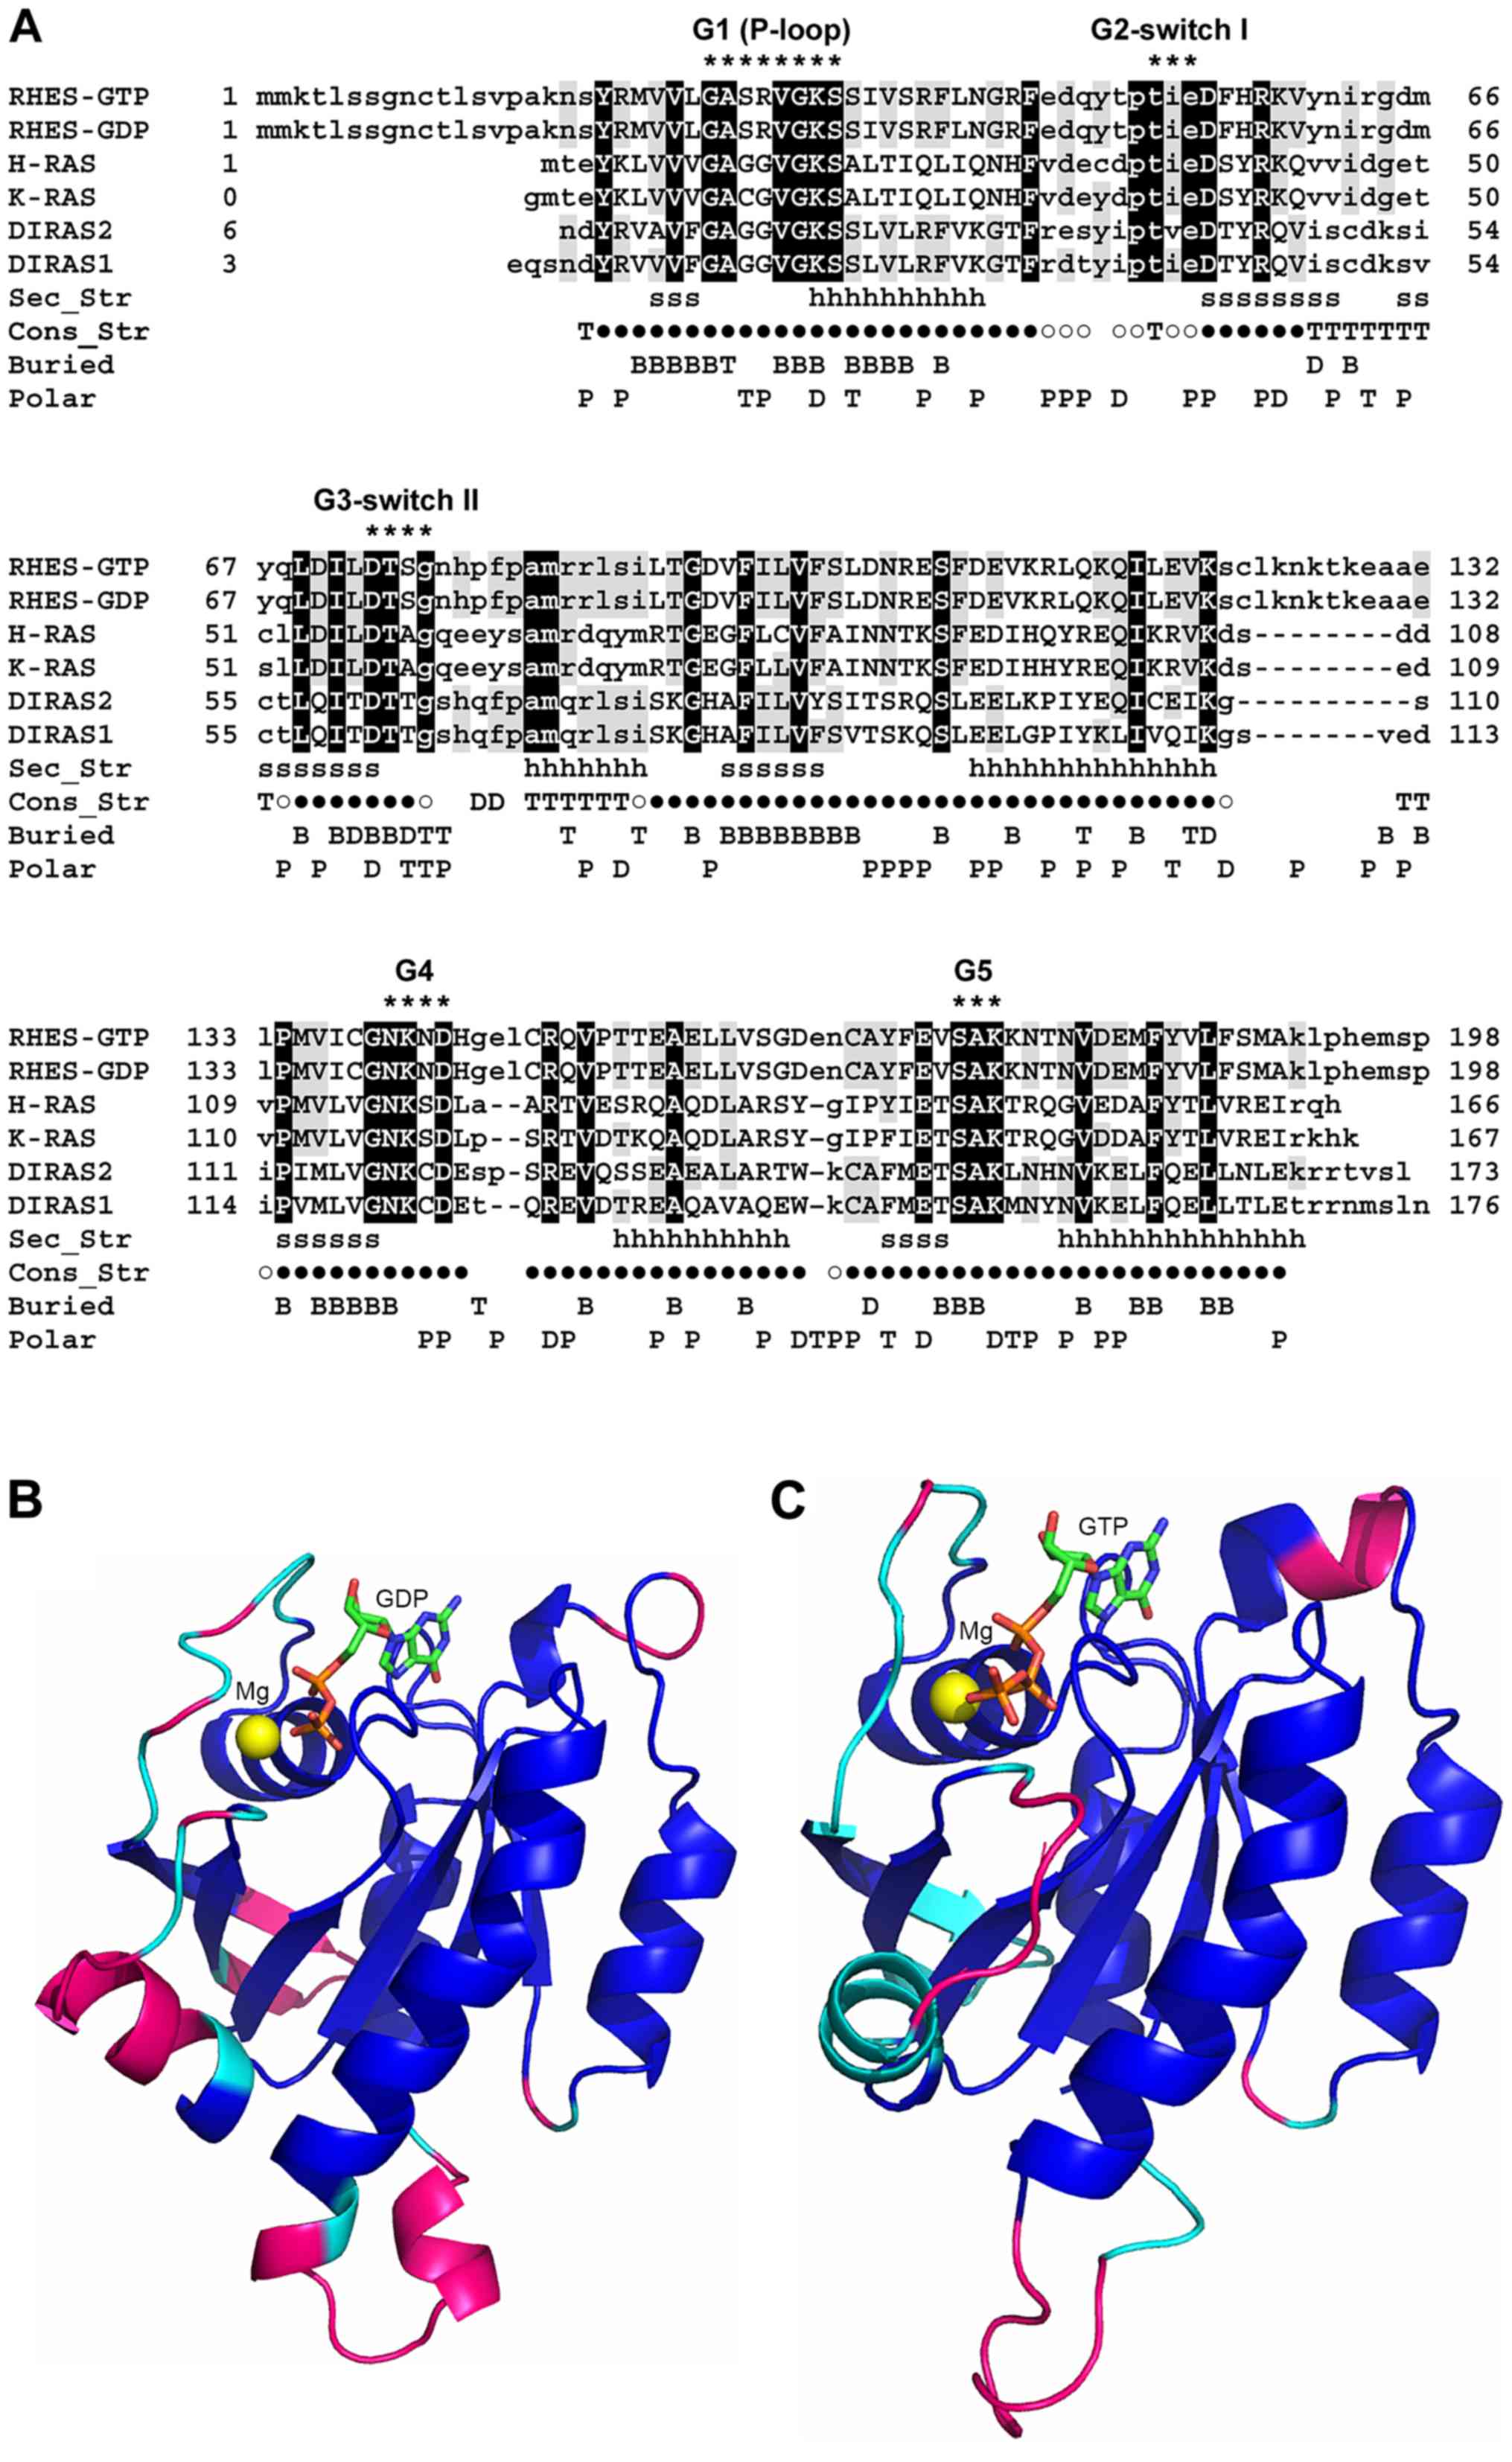 | Figure 1Sequence and structure comparison
between RHES and homologous proteins belonging to the Ras family.
(A) SB-MSA of RHES 3D models with proteins of known structure bound
to either GTP or GDP. Both RHES-GTP and RHES-GDP models were
included in the SB-MSA. RHES sequence is truncated at residue 198,
since the remaining C-terminal region (199-253) does not have
homologs of known structure. Other sequences comprise only residues
that are visible in the experimentally determined 3D structures
(Table I). Upper- and lower-case
letters indicate residues that are and are not structurally
aligned, respectively. Black and grey background shows RHES
residues whose identity is conserved in all or at least one
template, respectively. Sec_Str: Secondary structure elements,
i.e., β strands and α-helices, which are present in both GTP and
GDP-binding H-Ras structures, are marked with 's' and 'h' letters,
respectively. Con_Str: Residues that are structurally conserved
between all the experimentally determined structures are indicated
by '●' symbols; 'T', 'D' and '○' symbols indicate residues that are
structurally conserved between GTP-bound H-Ras and Rap1A, GDP-bound
H-Ras and DiRas2, and both the aforementioned pairs of structures,
respectively. Buried: Residues whose SASA is ≤20 Å in RHES-GTP
model, RHES-GDP model and both models are indicated with 'T', 'D'
and 'B', respectively. Polar: Residues whose SASA in RHES-GTP
model, RHES-GDP model and both models are predominantly polar, are
indicated with 'P', 'T' and 'D', respectively. Residues belonging
to conserved RAS family motifs G1-G5 are indicated by '*'. The
consensus sequences of these motifs are: G1 (P-loop) =
GXXXXGK(S/T); G2 switch I = XTX; G3 switch II = DXXG; G4 =
(N/T)(K/Q)XD; G5 = (T/G/C)(C/S)A. (B) Molecular model of RHES-GDP.
The model is represented as a ribbon and colour coded as follows.
Blue: Residues that are structurally conserved among GTP- and
GDP-bound structures, indicated by a '●' symbol in panel (A). Cyan:
Additional residues that are structurally conserved between
GDP-bound structures, indicated by '○' and 'D' symbols in panel
(A). Magenta: Residues that are not structurally conserved in
either of the aforementioned groups of structures. GDP is shown as
sticks and coloured by atom type (C, green; N, blue; O, red; P,
orange). The magnesium ion is shown as a sphere and coloured
yellow. (C) Molecular model of RHES-GTP. The model is represented
as a ribbon and colour coded as follows. Blue: Same as in panel
(B). Cyan: Additional residues that are structurally conserved
between GTP-bound structures, indicated by '○' and 'T' symbols in
panel (A). Magenta: Residues that are not structurally conserved in
either of the aforementioned groups of structures. GTP is shown as
sticks and coloured by atom type (C, green; N, blue; O, red; P,
orange). The magnesium ion is shown as a sphere and coloured
yellow. RHES, Ras Homolog Enriched in Striatum; SB-MSA,
Structure-Based-Multiple Sequence Alignments; GTP, guanosine
triphosphate; GDP, guanosine diphosphatase. |
To provide an estimate of the accuracy of RHES
models, hand-curated SB-MSAs were produced comprising: i) GTP-bound
RHES, Rap1A and H-Ras; ii) GDP-bound RHES, DiRas2 and H-Ras; iii)
both GTP-bound and GDP-bound RHES models and experimental
structures (Fig. 1).
The structurally conserved regions (SCRs) among the
experimentally determined structures of GTP- and GDP-bound Ras
family members comprise 122 residues (Fig. 1A). In agreement with previous
assignment of Ras family members to different subfamilies (48), the values of percentage sequence
identity (%_ID) and root mean square deviation (RMSD) value in the
SCRs reported in Table II
indicate that GTP- and GDP-bound H-Ras and GDP-bound K-Ras (all of
which were assigned to the Ras subfamily) have higher sequence
identity (%_ID=93%) and structure similarity (RMSD=0.62-0.80 Å)
with one another than each of them with either DiRas1 or DiRas2
(both of which were assigned to the Ras-extended subfamily).
Similarly, in the SCRs, DiRas1 and DiRas2 have higher sequence
identity (83%) and structure similarity (RMSD: 0.67 Å) with each
other than each of them with either GTP- or GDP-bound H-Ras, or
K-Ras. Comparison of structures from different subfamilies, namely:
GTP-bound or GDP-bound H-Ras, or K-Ras vs. DiRas1 or DiRas2 yields
%_ID in the range 40-43% and RMSD values in the range 1.06-1.17 Å.
Based on the established relationship between the percentage of
sequence identity and structure similarity in the core regions of
homologous proteins (49), it is
possible to infer the accuracy that RHES models are expected to
have in the SCRs. The %_ID between RHES and experimentally
determined GTP-bound or GDP-bound structures is 42% (with
H-Ras-GTP) and 48% (with DiRas2), respectively, which is comparable
to or better than the %_IDs calculated between members of the
different (i.e., Ras and Ras-extended) subfamilies. As a
consequence, the main-chain co-ordinates of both RHES-GTP and
RHES-GDP models in the SCRs are expected to have RMSD values with
the real structures ≤1.2 Å, which is the highest value calculated
after optimal pair-wise superimpositions between members of
different subfamilies.
| Table IISequence and structure similarity of
Ras family members in the SCRs indicated in Fig. 1A. Each Ras family member is
indicated by the name of the protein (see Table I); in the case of H-Ras, the bound
ligand is also shown in parenthesis. The lower and upper part of
the matrix contain the percentage of sequence identity and the RMSD
values (Å) calculated after optimal pair-wise structure
superimposition of the main-chain atoms in the SCRs,
respectively. |
Table II
Sequence and structure similarity of
Ras family members in the SCRs indicated in Fig. 1A. Each Ras family member is
indicated by the name of the protein (see Table I); in the case of H-Ras, the bound
ligand is also shown in parenthesis. The lower and upper part of
the matrix contain the percentage of sequence identity and the RMSD
values (Å) calculated after optimal pair-wise structure
superimposition of the main-chain atoms in the SCRs,
respectively.
| H-RAS (GTP) | H-RAS (GDP) | K-RAS | DIRAS1 | DIRAS2 |
|---|
| H-RAS (GTP) | - | 0.80 | 0.78 | 1.12 | 1.17 |
| H-RAS (GDP) | 100 | - | 0.62 | 1.08 | 1.06 |
| K-RAS | 93 | 93 | - | 1.13 | 1.11 |
| DIRAS1 | 40 | 40 | 42 | - | 0.67 |
| DIRAS2 | 42 | 42 | 43 | 83 | - |
The SCRs described above are conserved in both GTP-
and GDP-bound RHES conformations. However, the regions where
RHES-GTP and RHES-GDP models are reliable are more extended than
the SCRs (Fig. 1). i) The optimal
structure alignment between the GDP-bound structures of H-Ras and
DiRas2 comprises 138 residues (SCRs-GDP) whose %_ID and RMSD value
of the main chain atoms are 53% and 1.06 Å, respectively. The %_ID
between RHES and the two structures in the SCRs-GDP is 40 and 45%,
respectively. Optimal structure superimposition between the
GTP-bound structures of H-Ras and Rap1A comprise 154 residues whose
%_ID and RMSD value of the main chain atoms after optimal structure
superimposition are 57% and 0.96 Å, respectively. The %_ID between
RHES and each of the two structures in the SCRs-GTP is 40%. Based
on sequence-structure relationships previously defined for pairs of
homologous proteins with different folds (49) and on those reported above for
members of the Ras family, RHES-GDP and RHES-GTP models are
expected to have RMSD values not higher than 1.2 Å in the SCR-GDP
and SCR-GTP, respectively.
Analysis of RHES
sequence-structure-function relationships
Based on sequence and structure analyses described
in the previous section, RHES comprises three distinct regions,
namely an N-terminal sequence, RAS domain and C-terminal region,
which are predicted to encompass residues 1-18, 19-190 and 191-266,
respectively.
The Ras domain is homologous to members of the
globular Ras-like small G protein family and has highest similarity
to the DiRas members of the Ras-extended subfamily members
(48). The Ras domain comprises
the signatures of the conserved GTP-binding motifs G1-G5, all of
which are fully conserved in RHES (Fig. 1). The G1 motif or 'P-loop'
(residues 26-33) interacts with the oxygen atoms of β and γ
phosphate groups and is crucial for nucleotide binding. The G2
motif (residues 50-52) comprises a threonine residue (T35 in
H-Ras), which is responsible for GTP γ phosphate sensing and is
part of the 'Switch I' region (residues 48-52) that undergoes a
conformational change after GTP hydrolysis. The G3 motif (residues
73-76) partially overlaps with the 'Switch II' site (residues 75-83
in H-Ras) and comprises a conserved glycine residue (G76), which is
involved in the interaction with effector molecules and plays a
role in guanine nucleotide exchange factors-catalysed nucleotide
exchange and GTPase activating proteins-mediated GTP hydrolysis.
The G4 and G5 motifs encompass RHES residues 140-143 and 172-174,
respectively. Based on the conservation of G1-G5 motifs, as well as
of the SCRs-GTP and SCRs-GDP (see above), the mode of GTP- and
GDP-binding by RHES is expected to be conserved with respect to
homologous GTP- and GDP-bound structures. As a consequence, these
structures have been used as templates to dock the co-ordinates of
GTP and GDP to RHES-GTP and RHES-GDP models, respectively.
According to the ELM resource, the Ras domain comprises a
LIG_SUMO_SIM_par_1 motif for non-covalent SUMO binding in the
115-121 region (Table SI).
The N-terminal sequence is predicted by several
methods not to be a signal peptide, nor to assume a regular
secondary structure. Interestingly, the ELM resource identifies in
the 16-20 region the DOC_USP7_MATH_1 binding motif for USP7, a
deubiquitinating enzyme that cleaves ubiquitin moieties from its
substrates (Table SI).
The C-terminal tail (residues 193-266) has been
termed the 'cationic region' due to its enrichment in positively
charged residues (50). A
C-terminal tail of the same length or longer is present in RHES
proteins from other species, whereas it is not conserved in other
Ras homologs. The C-terminal CAAX motif comprises one cysteine
residue that undergoes farnesylation, a post-translational
modification that allows G-proteins to be localized at the level of
plasma and intracellular membranes. It is predicted to contain one
α-helix in the 240-250 region. A slightly longer C-terminal region
of RHES has been shown to be both required and sufficient for
Beclin-1 binding (20), and is
therefore responsible for RHES autophagy activating activity.
Modelling of RHES complexes with Htt and
Ubc9 by molecular docking
To identify RHES regions required for mHtt
sumoylation, molecular models of RHES complexes were built with the
Htt target and with the E2-ligase Ubc9.
Extensive searches in sequence and structure
databases could not detect any 3D structure of complexes between
proteins homologous to RHES and to either Htt or Ubc9, to be used
as templates for modelling RHES-Htt or RHES-Ubc9 interaction by
homology, respectively. Therefore, a model of each of these
complexes was built by molecular docking, using: i) The 3D model of
RHES-GTP, which is in the GTP-bound, active ('on') conformation;
and ii) the 3D structure of Htt or Ubc9 (Table I), which have been experimentally
determined by cryoelectron microscopy and X-ray crystallography,
respectively.
The putative Htt domain responsible for the
interaction with GTP-binding proteins has been previously
identified (51). For this
reason, molecular docking simulations have been focused only on
this domain, corresponding to Htt residues 1223-2324. Accordingly,
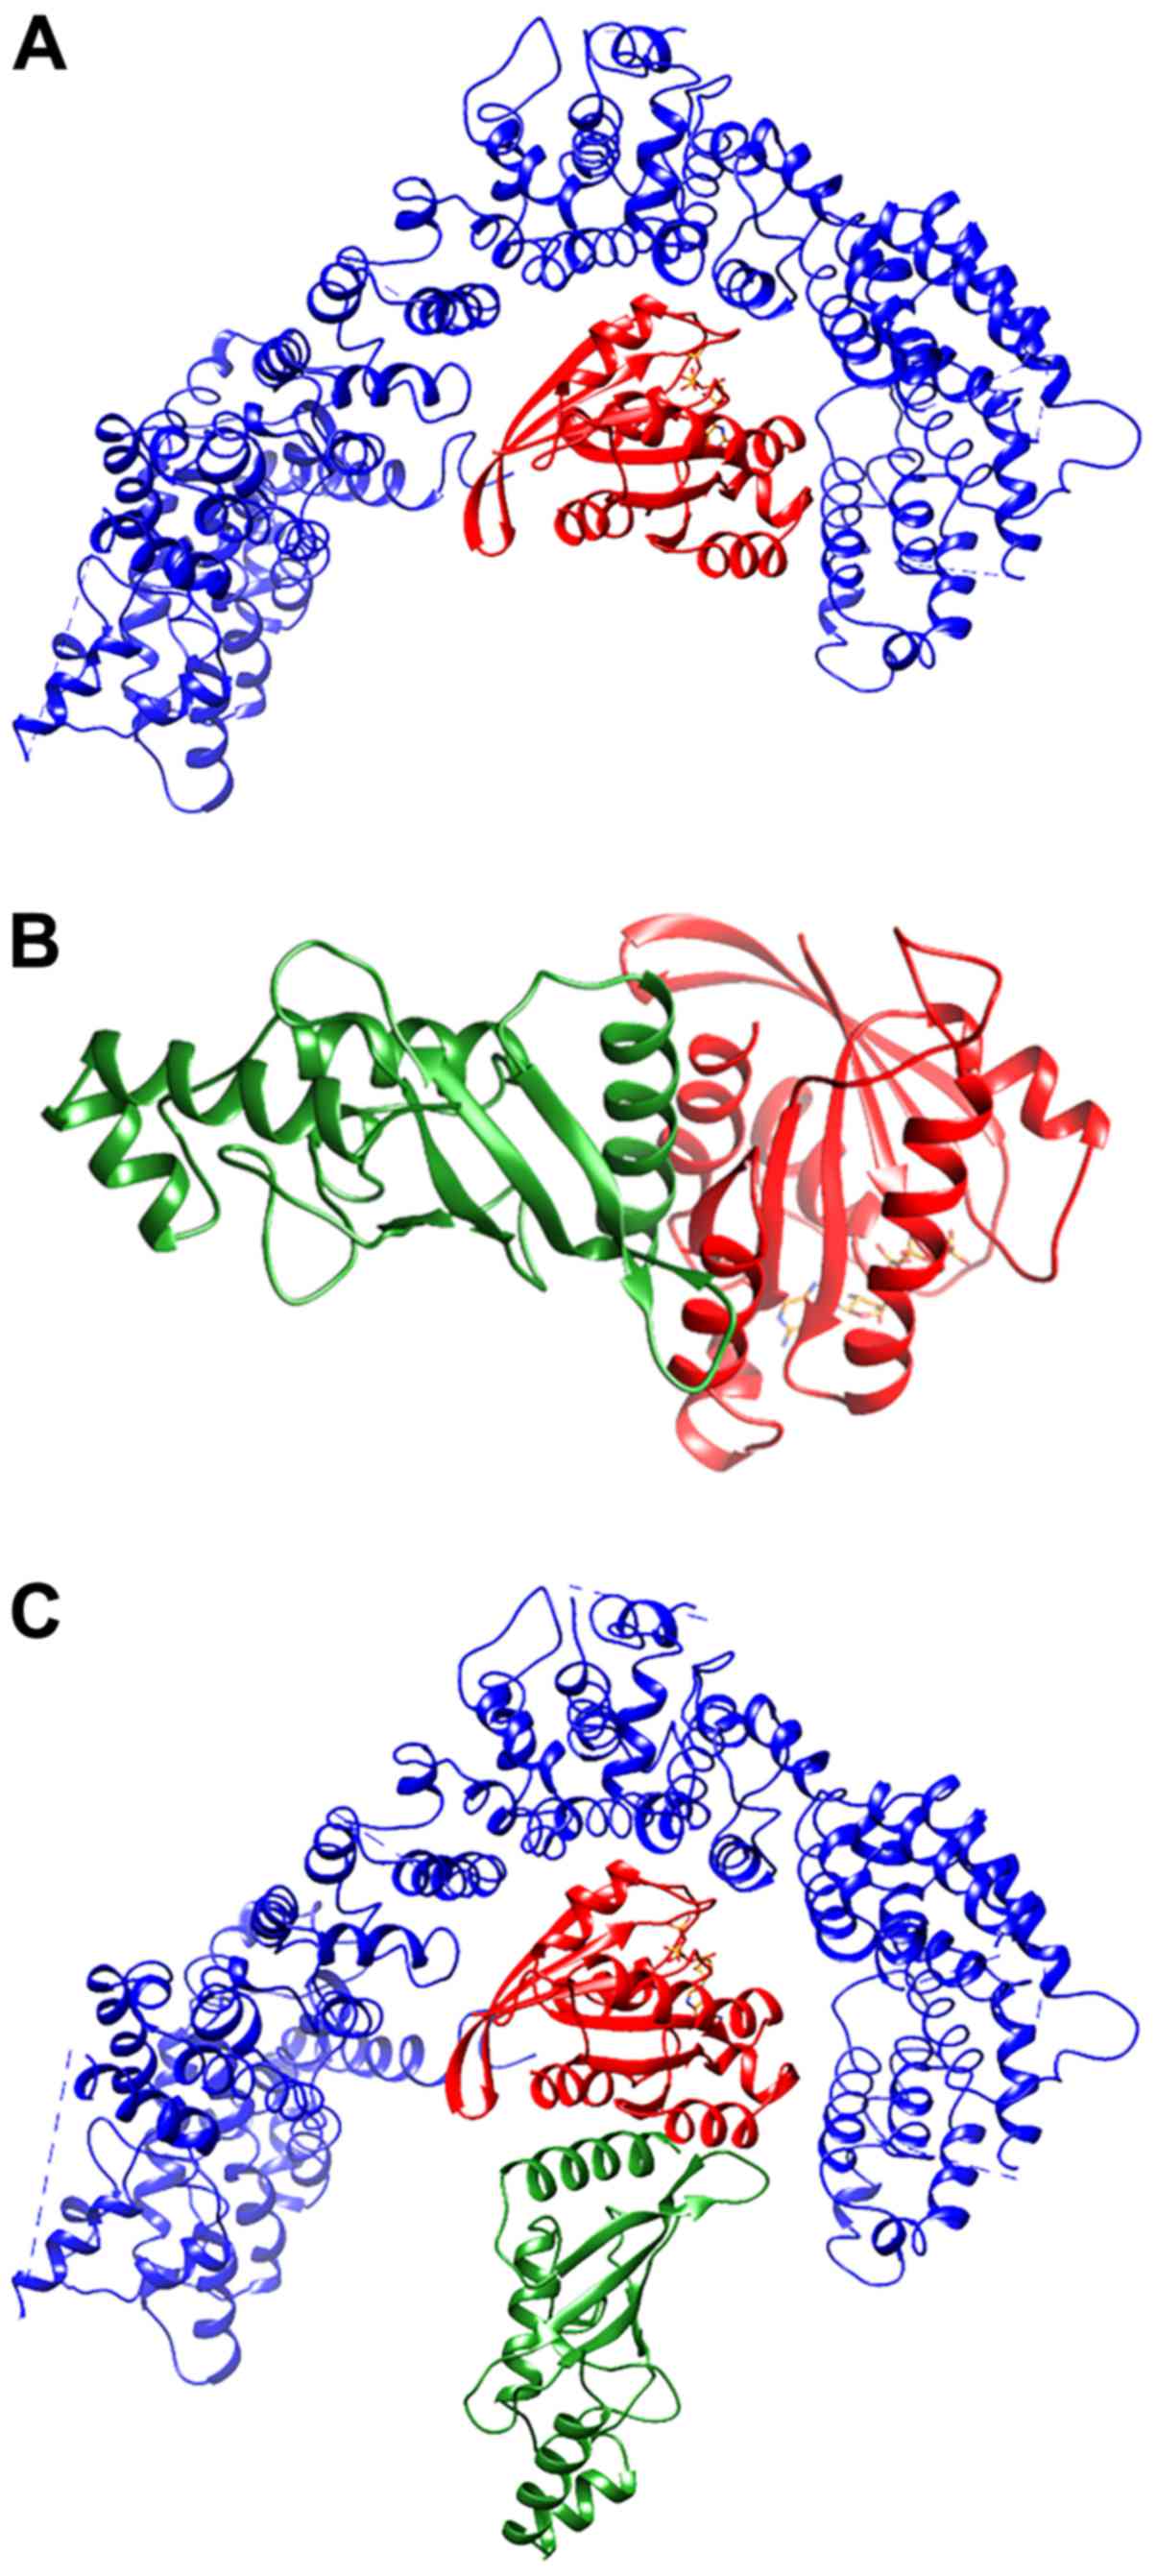
in the best-ranked complex (Fig.
2A; Table III) RHES
interacts with Htt in the same region in which other GTP-binding
proteins have been predicted to bind (51). Fig.
2B shows the best-ranked RHES-Ubc9 complex. The superimposition
between Htt-RHES and RHES-Ubc9 predicted complexes (Fig. 2C) is compatible with formation of
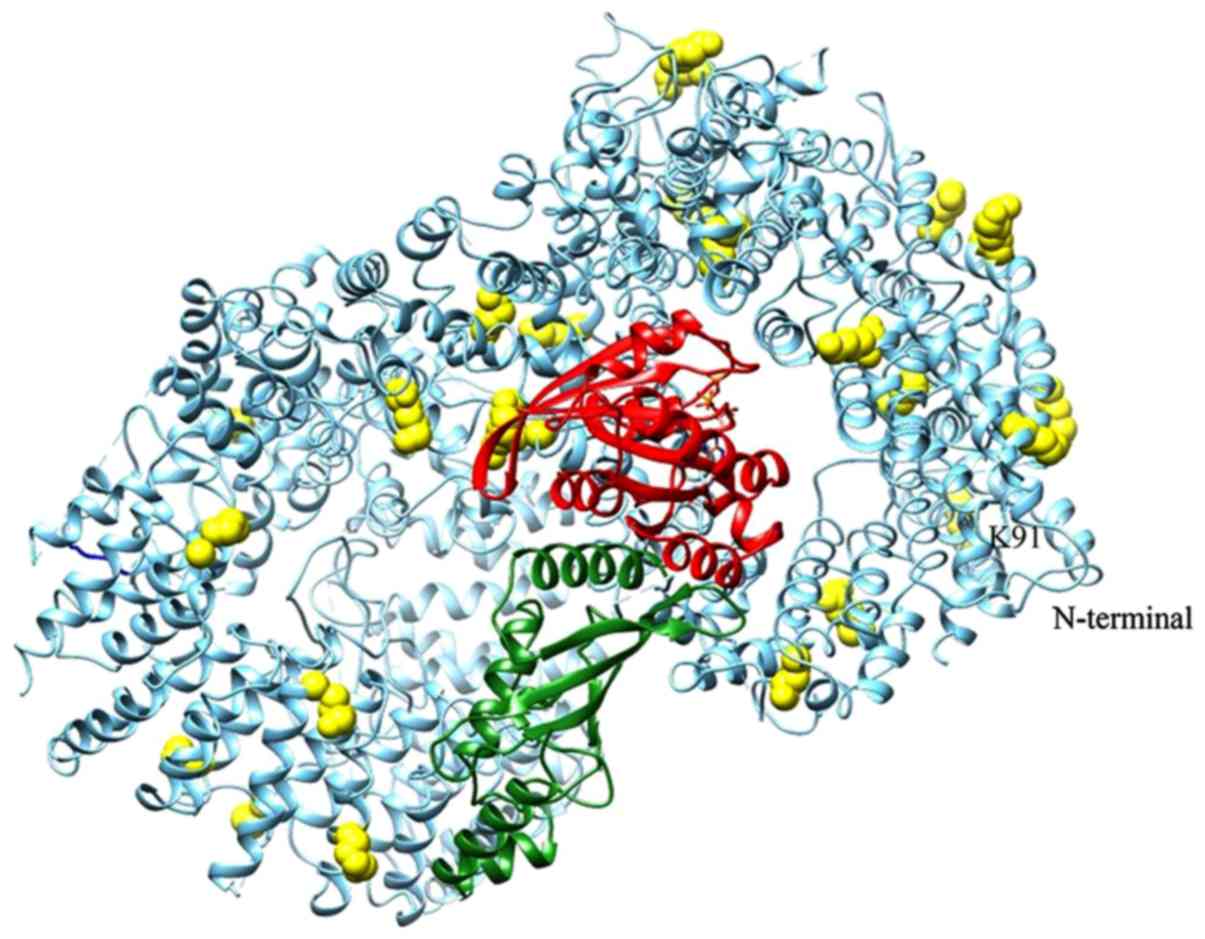
a ternary complex. In Fig. 3 the
ternary complex is shown in the context of the whole Htt protein,
together with the predicted sumoylation sites. Several sumoylation
sites of Htt are located in regions spatially close to Ubc9 and/or
at the interface with RHES. However, since the only available
experimental structure of Htt has been determined in complex with
Htt-associated protein 40, the Htt conformation present in the
complex with RHES is representative of this particular bimolecular
complex. It is well known that Htt assumes different conformations
depending on its intra- and inter-molecular interactions (52); therefore, other Htt sumoylation
sites, including the ones located in the 1-90 N-terminal region,
which is not present in the experimentally determined structure,
may be located within reach of Ubc9 in the ternary Htt-RHES-Ubc9
complex.
| Table IIIRHES residues located at the
interface with Htt and Ubc9 in the respective complexes obtained by
docking simulations. |
Table III
RHES residues located at the
interface with Htt and Ubc9 in the respective complexes obtained by
docking simulations.
| RHES-Htt | RHES-Ubc9 |
|---|
| SER28 | ARG63 |
| ARG29 | THR153 |
| GLN47 | GLU157 |
| TYR48 | LEU158 |
| THR49 | VAL160 |
| PRO50 | SER161 |
| THR51 | GLY162 |
| ILE52 | ASP163 |
| GLU53 | GLU164 |
| ASP54 C | YS166 |
| PHE55 | ALA167 |
| ARG57 | TYR168 |
| LYS58 | PHE 169 |
| VAL59 | GLU181 |
| GLN68 | VAL185 |
| SER75 | SER188 |
| GLY76 | MET189 |
| ASN77 | |
| HIS78 | |
| PRO79 | |
| PRO81 | |
| MET83 | |
| LEU86 | |
| GLU104 | |
Design of peptides interfering with
RHES-Htt or RHES-Ubc9 interaction
Based on the results of the aforementioned analyses,
peptides aimed at interfering with RHES-mHtt or RHES-Ubc9
interactions were designed.
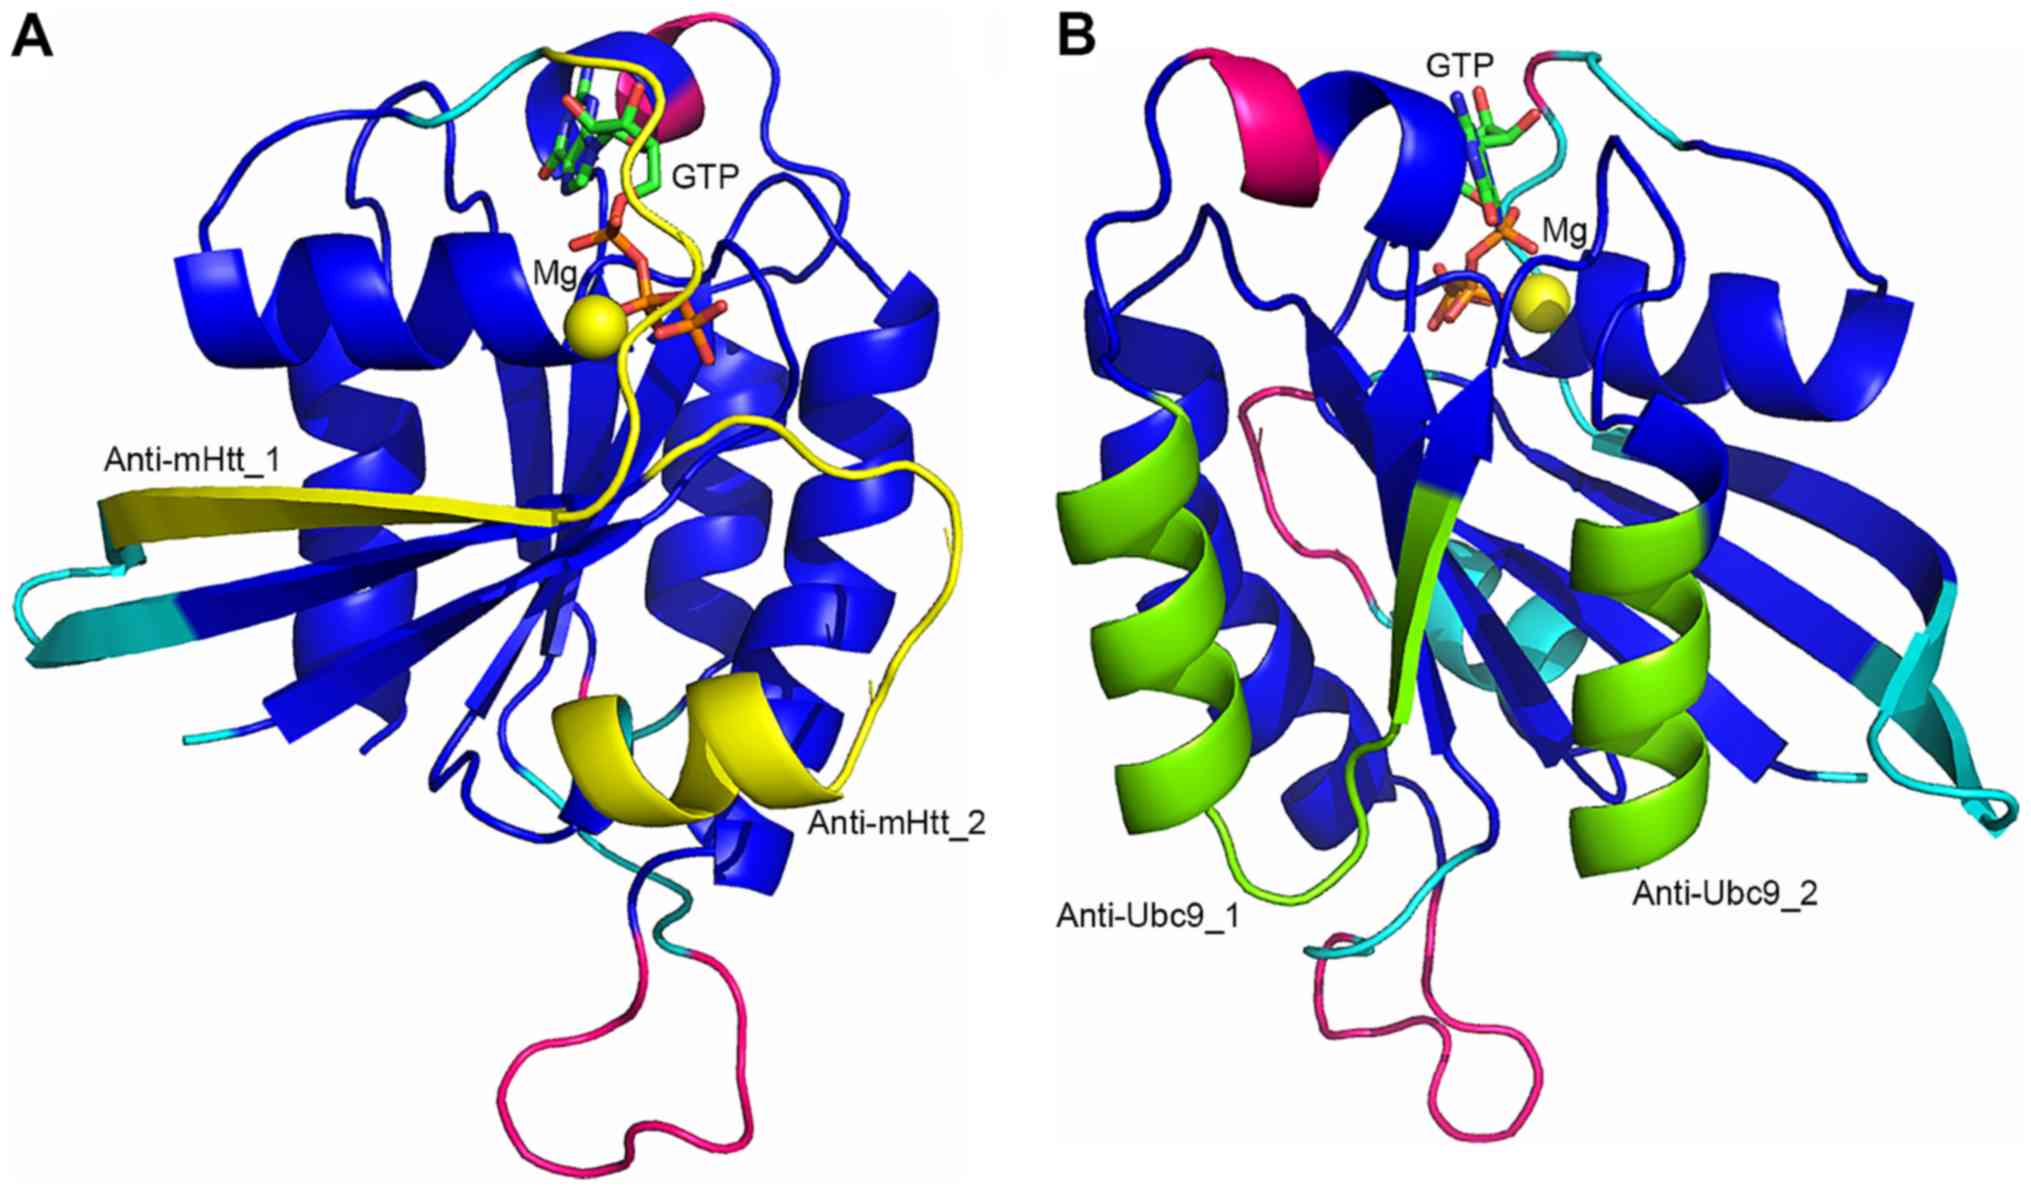
Two RHES regions, encompassing residues 47-59 and
75-86 (Fig. 4A), and partially
overlapping with the G2-switch I and G3-switch II region,
respectively, comprise 50 and 33% of the residues involved in the
interaction with Htt predicted by docking simulations,
respectively. Peptides comprising these residues are, therefore,
expected to effectively interfere with RHES-mHtt interaction. Both
peptide 47-59 (Anti-mHtt_1) and 75_86 (Anti-mHtt_2) have suitable
properties to be used as such as RHES-mHtt interaction inhibitors:
Short length (13 and 12 residues, respectively); high
polar/hydrophobic residues ratio (6 charged, 5 polar and 5
hydrophobic residues in Anti-mHtt_1; 2 charged, 4 polar and 5
hydrophobic residues in Anti-mHtt_2); absence of branched
hydrophobic-aliphatic residues next to one another; presence of
proline residues, which confer rigidity to the peptide and,
therefore, determine a reduction in entropy loss upon mHtt binding
(see Fig. 1A). If required,
Anti-mHtt peptides can be modified to improve their solubility
and/or binding properties, by replacing residues at positions not
predicted to be involved in mHtt binding (i.e., H56, F80, A82, R84
and R85) and/or substituting peptide bonds with non-peptidic
moieties. In case Anti-mHtt peptides prove to be able to inhibit
RHES-mHtt interaction, they can be alanine-scanned to identify
residues essential for the interaction to be used as a guide for
the design of non-peptidic molecules. In parallel to the use of
peptidic compounds, the Anti-mHtt_1 and Anti-mHtt_2 regions can be
used as a target for virtual screening of small molecule
libraries.
As in the case of the RHES-Htt complex, two RHES
regions comprise most of the residues involved in RHES-Ubc9
interaction (Fig. 4B); however,
in the latter case one region is larger than the other. The region
encompassing residues 153-169 (Anti-Ubc9_1), situated between the
G4 and G5 motifs, comprises 12 (i.e., 71%) of the 17 residues
predicted to be in contact with Ubc9. The region encompassing
residues 181-189 (Anti-Ubc9_2), situated after the G5 motif, in the
C-terminal region of the Ras domain, comprises just four (i.e.,
24%) residues predicted to be in contact with Ubc9. Peptides
comprising these regions and possibly just the Anti-Ubc9_1 region,
are likely to effectively interfere with the RHES-Ubc9 interaction.
The properties of peptides 153-169 (Anti-Ubc9_1; 17 residues) and
181-189 (Anti-Ubc9_2; 9 residues) are also favourable enough for
them to be used as such as RHES-Ubc9 interaction inhibitors.
However, in the case of these peptides, analysis of their
properties allowed identification of modifications likely to be
required to improve their solubility properties. Anti-Ubc9_1
contains three consecutive hydrophobic-aliphatic branched amino
acids (L158, L159 and V160) and two consecutive aromatic residues
(Y168 and F169), which may hamper solubility. However, L159 is not
predicted to interact with Ubc9, therefore it can be replaced by a
polar residue. To replace other hydrophobic residues and/or shorten
the peptide, which is slightly longer than most peptides used for
biomedical purposes, alanine-scanning mutagenesis must be performed
to reveal which residues are actually essential for peptide
activity. The Anti-Ubc9_2 peptide comprises six hydrophobic
residues next to one another. Of these, only V185 is predicted to
be involved in interactions with Ubc9, while the other five can be
replaced with polar residues to increase peptide solubility.
Anti-Ubc9_1 and Anti- Ubc9_2 regions can also be used as targets
for virtual screening of small molecule libraries to identify
non-peptide compounds aimed at inhibiting RHES-Ubc9
interaction.
Discussion
HD is known to be caused by the occurrence of a long
poly-Q repeat in mHtt, but the molecular mechanisms underlying mHtt
toxicity are not yet clear. While mHtt is expressed in all body
tissues, HD neuropathology is specifically related to the brain and
in particular to the corpus striatum. The only protein reported to
be overexpressed in this brain region so far is RHES, a small
GTP-binding protein containing an N-terminal domain homologous to
the Ras family member and a C-terminal tail that is not present in
other Ras proteins. RHES has a SUMO-E3 ligase activity and
sumoylates mHtt, as well as other proteins, but not wild type Htt
or the poly-Q containing protein ataxin. Sumoylated mHtt is then
able to escape formation of insoluble aggregates and exert its
cytotoxic and neurotoxic activity. Accordingly, several studies
have demonstrated a protective role of RHES deletion towards HD
symptoms in both cellular and animal models (5,14-16), supporting the notion that RHES is
a very attractive therapeutic target against HD. In only one report
knocking out RHES did not improve HD symptoms (17), likely because of the ability of
the C-terminal tail of RHES to activate autophagy, which is
protective towards HD (20).
Based on the above, a strategy to selectively
inhibit RHES functions that enhance HD phenotypes while preserving
the protective activity was envisaged. This goal can be achieved by
interfering with the molecular interactions involved in mHtt
sumoylation by RHES without hampering Beclin-1 binding.
Sumoylation is a multi-step process, analogous to
ubiqui-tination, which leads to the formation of a covalent
isopeptide bond between the carboxyl terminus of SUMO proteins and
the ε-amino group of a lysine residue of target proteins, which is
part of a ΨKxD/E motif (Ψ = large hydrophobic residue) (53). Briefly: i) SUMO proteins (SUMO-1,
SUMO-2 and SUMO-3), which are synthesized as inactive precursors,
are cleaved by SUMO-specific carboxy-terminal hydrolases that
remove four C-terminal residues. Mature SUMO proteins, presenting a
novel double-glycine C-terminus, are ii) linked via a thioester
bond to the catalytic cysteine (C173) of the SAE1/SAE2
heterodimeric activating enzyme (E1), iii) transferred to the
catalytic cysteine (C93) of the Ubc9 conjugating enzyme (E2) and
iv) eventually conjugated to the target protein, in a reaction that
can be aided by a ligase (E3). While Ubc9, the only known E2-ligase
for sumoylation, can act as an E3-ligase itself, RHES facilitates
or catalyses its sumoylation activity. Indeed, the role of
E3-ligases is to interact with both the E2 enzyme and the target
protein, thereby conferring substrate specificity to the E2-ligase.
Additionally, RHES has been shown to physiologically regulate
sumoylation by directly interacting with both E1 and Ubc9 and
enhancing SUMO transfer to Lys residues in both directions
(cross-sumoylation), i.e., from C173 of E1 to a lysine residue of
Ubc9 and from C93 of Ubc9 to a lysine residue of E1 (13).
In principle, mHtt sumoylation by RHES may be
hampered by interfering with each of the different steps of the
sumoylation process, namely SUMO i) maturation, ii) activation,
iii) conjugation, or iv) ligation. However, interference with some
of these processes might have unwanted effects, which go beyond
mHtt sumoylation. As an example, SAE1/SAE2 and Ubc9 are the only
known SUMO-E1 and SUMO-E2 ligases, respectively; therefore,
inhibition of this interaction would affect sumoylation of multiple
targets, as would the inhibition of the cross-sumoylation between
E1 and E2 catalysed by RHES.
The most specific strategy to interfere with mHtt
sumoylation consists of the inhibition of the interaction between
RHES and mHtt. To this end, RHES models in the GTP- and GDP-bound
conformation were built by homology modelling, and a model of the
complex between GTP-bound RHES and Htt was built by docking
simulations. Analysis of these models allowed identification of
RHES regions putatively involved in this interaction, as well as
Anti-mHtt peptides expected to interfere with it.
Additionally, a model of the complex between RHES
and Ubc9 was built by molecular docking, and a model of the ternary
complex between RHES, Htt and Ubc9 by superposition of the RHES-Htt
and RHES-Ubc9 complexes. Although there are no direct interactions
between Htt and Ubc9 in the ternary complex, the two molecules are
sufficiently close to each other for the interaction to occur if
Htt underwent a conformational change with respect to that observed
in the experimentally determined structure, which is only one of
the many conformations that this protein is known to assume. Thus,
the modelled ternary complex is compatible with the simultaneous
formation of the two binary RHES complexes modelled by docking and
provides indirect support for their validity. The RHES-Ubc9 model
was also analysed to highlight RHES regions predicted to be
involved in Ubc9 binding and design Anti-Ubc9 peptides aimed at
interfering with it. In principle, inhibition of this E2-E3
interaction is less attractive than RHES-mHtt inhibition, because
it could affect sumoylation of other potential RHES targets, as
well as mHtt. However, Anti-Ubc9 peptides might act in synergy with
the aforementioned Anti-mHtt peptides and be used jointly with them
or as an alternative, in case Anti-mHtt peptides do not possess
suitable activity or specificity.
Like the ubiquitination pathway (54), sumoylation can be antagonized by
interfering with several processes. It has been shown that RHES
sumoylation of mHtt can be hampered by interfering with RHES
farnesylation, but not with its GTPase activity. In fact, mutation
of the conserved cysteine 263 has been shown to abolish mHtt
sumoylation, mHtt disaggregation and cytotoxicity (12). These effects are likely mediated
by the lack of farnesylation, which is required for RHES to be
localized at the membrane level, in parallel with other small G
proteins whose activity is dependent on cell membrane attachment
mediated by fatty acid addition to conserved cysteines in CXXX
motifs. Conversely, mutation of serine 33, which is involved in the
GTPase activity, does not prevent mHtt sumoylation, disaggregation
and cytotoxicity, demonstrating that sumoylation and cytotoxicity
are not associated with the GTPase activity (12).
Other RHES regions that may be targeted for HD
therapy include the non-covalent SUMO binding motif identified
within the Ras domain and the binding motif for the
deubiquitinating enzyme identified within the N-terminal region.
However, inhibition of the interaction with the mHtt target and/or
the Ubc9 SUMO E2-ligase is the most direct way to interfere with
mHtt sumoylation.
With the aim of assessing their therapeutic
potential, the designed Anti-mHtt and Anti-Ubc9 peptides will be
tested for their ability to: i) Interfere with RHES-mHtt and
RHES-Ubc9 interaction, respectively, in vitro; ii)
selectively inhibit mHtt sumoylation, while not preventing
autophagy; and iii) revert the HD phenotype in cellular and/or
animal models without causing undesired side-effects. In parallel,
RHES regions encompassing the Anti-mHtt and Anti-Ubc9 peptides will
be exploited to perform virtual screenings of available small
molecule libraries to identify non-peptide compounds aimed at
inhibiting mHtt sumoylation.
In principle, molecules able to selectively inhibit
RHES SUMO-E3 ligase activity without interfering with the autophagy
promoting and HD protective activity mediated by RHES C-terminal
region, might effectively reduce the amount of soluble mHtt
responsible for cytotoxicity and allow the development of
therapeutic agents against the currently untreatable HD.
Supplementary Data
Abbreviations:
|
DiRas1 and DiRas2
|
Distinct subgroup of the Ras family
member 1 and 2
|
|
HAP40
|
Htt-associated protein 40
|
|
HD
|
Huntington's disease
|
|
Htt
|
huntingtin
|
|
mHtt
|
mutant Htt
|
|
mTOR
|
mammalian target of rapamycin
|
|
Rap1A
|
Ras-related protein 1A
|
|
RHES
|
Ras homologue enriched in the
striatum
|
|
SAE1 and SAE2
|
SUMO-activating enzyme subunits 1 and
2
|
|
SCRs
|
structurally conserved regions
|
|
SUMO
|
small ubiquitin-related modifier
|
|
Ubc9
|
SUMO conjugating enzyme, also referred
to as 'ubiquitin carrier protein 9' or 'ubiquitin conjugating
enzyme E2I'
|
Acknowledgements
Not applicable.
Funding
The present research project was funded by the
Italian Ministry of Health as a Finalised Research Project (Ricerca
Finalizzata; entitled 'RARE in rarity: Advanced in vivo and
in vitro technologies to Study Juvenile Huntington's Disease
neuronal connectivity and its relationship with clinical and
genetic factors: The RAREST-JHD project'; grant no.
RF-2016-02364123), by the National Collection of Chemical Compounds
and Screening Center, National Research Council of Italy (grant no.
DSB.AD011.005) and by the Italian Ministry of Education, University
and Research (MIUR) as a Scientific Research Program of Relevant
National Interest (PRIN 2017), entitled 'Protein Bioinformatics for
Human Health' (grant no. 2017483NH8_005). The funding bodies had no
role in the design of the study, collection, analysis and
interpretation of data, or manuscript writing.
Availability of data and materials
The coordinates of RHES-GTP and RHES-GDP models, as
well as those of RHES-Htt and RHES-Ubc9 complex models, are
available from the authors upon reasonable request.
Authors' contributions
MC built the RHES model and contributed to analyses.
VB performed the docking simulations. GP, DSS and GC performed
database and literature searches. FP performed data analysis, and
contributed in writing the manuscript. AI contributed to the
research design and writing the manuscript. VM contributed to the
research design, data analysis and writing the manuscript. All
authors read and approved the final manuscript.
Ethics approval and consent to
participate
Not applicable.
Patient consent for publication
Not applicable.
Competing interests
The authors declare that they have no competing
interests.
References
|
1
|
Testa CM and Jankovic J: Huntington
disease: A quarter century of progress since the gene discovery. J
Neurol Sci. 396:52–68. 2019. View Article : Google Scholar
|
|
2
|
Gusella JF and MacDonald ME: Huntington's
disease: CAG genetics expands neurobiology. Curr Opin Neurobiol.
5:656–662. 1995. View Article : Google Scholar : PubMed/NCBI
|
|
3
|
Saudou F, Finkbeiner S, Devys D and
Greenberg ME: Huntingtin acts in the nucleus to induce apoptosis
but death does not correlate with the formation of intranuclear
inclusions. Cell. 95:55–66. 1998. View Article : Google Scholar : PubMed/NCBI
|
|
4
|
Gong B, Lim MC, Wanderer J, Wyttenbach A
and Morton AJ: Time-lapse analysis of aggregate formation in an
inducible PC12 cell model of Huntington's disease reveals
time-dependent aggregate formation that transiently delays cell
death. Brain Res Bull. 75:146–157. 2008. View Article : Google Scholar
|
|
5
|
Lu B and Palacino J: A novel human
embryonic stem cell-derived Huntington's disease neuronal model
exhibits mutant huntingtin (mHTT) aggregates and soluble
mHTT-dependent neurodegeneration. FASEB J. 27:1820–1829. 2013.
View Article : Google Scholar : PubMed/NCBI
|
|
6
|
Harrison LM and Lahoste GJ: The role of
Rhes, Ras homolog enriched in striatum, in neurodegenerative
processes. Exp Cell Res. 319:2310–2315. 2013. View Article : Google Scholar : PubMed/NCBI
|
|
7
|
Sipione S and Cattaneo E: Modeling
Huntington's disease in cells, flies, and mice. Mol Neurobiol.
23:21–52. 2001. View Article : Google Scholar : PubMed/NCBI
|
|
8
|
Shahani N, Swarnkar S, Giovinazzo V,
Morgenweck J, Bohn LM, Scharager-Tapia C, Pascal B, Martinez-Acedo
P, Khare K and Subramaniam S: RasGRP1 promotes amphetamine-induced
motor behavior through a Rhes interaction network ('Rhesactome') in
the striatum. Sci Signal. 9:ra1112016. View Article : Google Scholar
|
|
9
|
Valjent E: Striatal signaling: Two decades
of progress. Front Neuroanat. 6:432012. View Article : Google Scholar : PubMed/NCBI
|
|
10
|
Ross CA and Tabrizi SJ: Huntington's
disease: From molecular pathogenesis to clinical treatment. Lancet
Neurol. 10:83–98. 2011. View Article : Google Scholar
|
|
11
|
Falk JD, Vargiu P, Foye PE, Usui H, Perez
J, Danielson PE, Lerner DL, Bernal J and Sutcliffe JG: Rhes: A
striatal-specific Ras homolog related to Dexras1. J Neurosci Res.
57:782–788. 1999. View Article : Google Scholar : PubMed/NCBI
|
|
12
|
Subramaniam S, Sixt KM, Barrow R and
Snyder SH: Rhes, a striatal specific protein, mediates
mutant-huntingtin cytotoxicity. Science. 324:1327–1330. 2009.
View Article : Google Scholar : PubMed/NCBI
|
|
13
|
Subramaniam S, Mealer RG, Sixt KM, Barrow
RK, Usiello A and Snyder SH: Rhes, a physiologic regulator of
sumoylation, enhances cross-sumoylation between the basic
sumoylation enzymes E1 and Ubc9. J Biol Chem. 285:20428–20432.
2010. View Article : Google Scholar : PubMed/NCBI
|
|
14
|
Seredenina T, Gokce O and Luthi-Carter R:
Decreased striatal RGS2 expression is neuroprotective in
Huntington's disease (HD) and exemplifies a compensatory aspect of
HD-induced gene regulation. PLoS One. 6:e222312011. View Article : Google Scholar : PubMed/NCBI
|
|
15
|
Baiamonte BA, Lee FA, Brewer ST, Spano D
and LaHoste GJ: Attenuation of Rhes activity significantly delays
the appearance of behavioral symptoms in a mouse model of
Huntington's disease. PLoS One. 8:e536062013. View Article : Google Scholar : PubMed/NCBI
|
|
16
|
Mealer RG, Subramaniam S and Snyder SH:
Rhes deletion is neuroprotective in the 3-nitropropionic acid model
of Huntington's disease. J Neurosci. 33:4206–4210. 2013. View Article : Google Scholar : PubMed/NCBI
|
|
17
|
Lee JH, Sowada MJ, Boudreau RL, Aerts AM,
Thedens DR, Nopoulos P and Davidson BL: Rhes suppression enhances
disease phenotypes in Huntington's disease mice. J Huntingtons Dis.
3:65–71. 2014.PubMed/NCBI
|
|
18
|
Ravikumar B, Vacher C, Berger Z, Davies
JE, Luo S, Oroz LG, Scaravilli F, Easton DF, Duden R, O'Kane CJ, et
al: Inhibition of mTOR induces autophagy and reduces toxicity of
polyglutamine expansions in fly and mouse models of Huntington
disease. Nat Genet. 36:585–595. 2004. View
Article : Google Scholar : PubMed/NCBI
|
|
19
|
Subramaniam S, Napolitano F, Mealer RG,
Kim S, Errico F, Barrow R, Shahani N, Tyagi R, Snyder SH and
Usiello A: Rhes, a striatal-enriched small G protein, mediates mTOR
signaling and L-DOPA-induced dyskinesia. Nat Neurosci. 15:191–193.
2012. View Article : Google Scholar
|
|
20
|
Mealer RG, Murray AJ, Shahani N,
Subramaniam S and Snyder SH: Rhes, a striatal-selective protein
implicated in Huntington disease, binds beclin-1 and activates
autophagy. J Biol Chem. 289:3547–3554. 2014. View Article : Google Scholar :
|
|
21
|
Naseri NN, Xu H, Bonica J, Vonsattel JP,
Cortes EP, Park LC, Arjomand J and Gibson GE: Abnormalities in the
tricarboxylic acid cycle in Huntington disease and in a Huntington
disease mouse model. J Neuropathol Exp Neurol. 74:527–537. 2015.
View Article : Google Scholar : PubMed/NCBI
|
|
22
|
Golas MM and Sander B: Use of human stem
cells in Huntington disease modeling and translational research.
Exp Neurol. 278:76–90. 2016. View Article : Google Scholar : PubMed/NCBI
|
|
23
|
Stricker-Shaver J, Novati A, Yu-Taeger L
and Nguyen HP: Genetic rodent models of Huntington disease. Adv Exp
Med Biol. 1049:29–57. 2018. View Article : Google Scholar : PubMed/NCBI
|
|
24
|
UniProt Consortium: Activities at the
Universal Protein Resource (UniProt). Nucleic Acids Res.
42(Database Issue): D191–D198. 2014. View Article : Google Scholar :
|
|
25
|
Berman HM, Westbrook J, Feng Z, Gilliland
G, Bhat TN, Weissig H, Shindyalov IN and Bourne PE: The protein
data bank. Nucleic Acids Res. 28:235–242. 2000. View Article : Google Scholar
|
|
26
|
Altschul S, Madden TL, Schäffer AA, Zhang
J, Zhang Z, Miller W and Lipman DJ: Gapped BLAST and PSI-BLAST: A
new generation of protein database search programs. Nucleic Acids
Res. 25:3389–3402. 1997. View Article : Google Scholar : PubMed/NCBI
|
|
27
|
Sievers F, Wilm A, Dineen D, Gibson TJ,
Karplus K, Li W, Lopez R, McWilliam H, Remmert M, Söding J, et al:
Fast, scalable generation of high-quality protein multiple sequence
alignments using Clustal Omega. Mol Syst Biol. 7:5392011.
View Article : Google Scholar : PubMed/NCBI
|
|
28
|
Guex N and Peitsch MC: SWISS-MODEL and the
Swiss-PdbViewer: An environment for comparative protein modeling.
Electrophoresis. 18:2714–2723. 1997. View Article : Google Scholar
|
|
29
|
Pettersen EF, Goddard TD, Huang CC, Couch
GS, Greenblatt DM, Meng EC and Ferrin TE: UCSF Chimera-A
visualization system for exploratory research and analysis. J
Comput Chem. 25:1605–1612. 2004. View Article : Google Scholar : PubMed/NCBI
|
|
30
|
Krissinel E and Henrick K:
Secondary-structure matching (SSM), a new tool for fast protein
structure alignment in three dimensions. Acta Crystallogr Sect D
Biol Crystallogr. 60:2256–2268. 2004. View Article : Google Scholar
|
|
31
|
Finn RD, Coggill P, Eberhardt RY, Eddy SR,
Mistry J, Mitchell AL, Potter SC, Punta M, Qureshi M,
Sangrador-Vegas A, et al: The Pfam protein families database:
Towards a more sustainable future. Nucleic Acids Res. 44:D279–D285.
2016. View Article : Google Scholar :
|
|
32
|
Pandurangan AP, Stahlhacke J, Oates ME,
Smithers B and Gough J: The SUPERFAMILY 2.0 database: A significant
proteome update and a new webserver. Nucleic Acids Res.
47:D490–D494. 2019. View Article : Google Scholar :
|
|
33
|
Roy A, Kucukural A and Zhang Y: I-TASSER:
A unified platform for automated protein structure and function
prediction. Nat Protoc. 5:725–738. 2010. View Article : Google Scholar : PubMed/NCBI
|
|
34
|
Söding J, Biegert A and Lupas AN: The
HHpred interactive server for protein homology detection and
structure prediction. Nucleic Acids Res. 33(Web Server Issue):
W244–W248. 2005. View Article : Google Scholar : PubMed/NCBI
|
|
35
|
Kelley LA, Mezulis S, Yates CM, Wass MN
and Sternberg MJ: The Phyre2 web portal for protein modeling,
prediction and analysis. Nat Protoc. 10:845–858. 2015. View Article : Google Scholar : PubMed/NCBI
|
|
36
|
Drozdetskiy A, Cole C, Procter J and
Barton GJ: JPred4: A protein secondary structure prediction server.
Nucleic Acids Res. 43:W389–W394. 2015. View Article : Google Scholar : PubMed/NCBI
|
|
37
|
Buchan DW, Minneci F, Nugent TC, Bryson K
and Jones DT: Scalable web services for the PSIPRED protein
analysis Workbench. Nucleic Acids Res. 41(Web Server Issue):
W349–W357. 2013. View Article : Google Scholar : PubMed/NCBI
|
|
38
|
Dinkel H, Van Roey K, Michael S, Kumar M,
Uyar B, Altenberg B, Milchevskaya V, Schneider M, Kühn H, Behrendt
A, et al: ELM 2016-data update and new functionality of the
eukaryotic linear motif resource. Nucleic Acids Res. 44:D294–D300.
2016. View Article : Google Scholar
|
|
39
|
Petersen TN, Brunak S, von Heijne G and
Nielsen H: SignalP 4.0: Discriminating signal peptides from
transmembrane regions. Nat Methods. 8:785–786. 2011. View Article : Google Scholar : PubMed/NCBI
|
|
40
|
Chou KC and Shen HB: Signal-CF: A
subsite-coupled and window-fusing approach for predicting signal
peptides. Biochem Biophys Res Commun. 357:633–640. 2007. View Article : Google Scholar : PubMed/NCBI
|
|
41
|
Frank K and Sippl MJ: High-performance
signal peptide prediction based on sequence alignment techniques.
Bioinformatics. 24:2172–2176. 2008. View Article : Google Scholar : PubMed/NCBI
|
|
42
|
Shen HB and Chou KC: Signal-3L: A 3-layer
approach for predicting signal peptides. Biochem Biophys Res
Commun. 363:297–303. 2007. View Article : Google Scholar : PubMed/NCBI
|
|
43
|
Pierce BG, Wiehe K, Hwang H, Kim BH,
Vreven T and Weng Z: ZDOCK server: Interactive docking prediction
of protein-protein complexes and symmetric multimers.
Bioinformatics. 30:1771–1773. 2014. View Article : Google Scholar : PubMed/NCBI
|
|
44
|
Pierce B and Weng Z: ZRANK: Reranking
protein docking predictions with an optimized energy function.
Proteins. 67:1078–1086. 2007. View Article : Google Scholar : PubMed/NCBI
|
|
45
|
Beauclair G, Bridier-Nahmias A, Zagury JF,
Saïb A and Zamborlini A: JASSA: A comprehensive tool for prediction
of SUMOylation sites and SIMs. Bioinformatics. 31:3483–3491. 2015.
View Article : Google Scholar : PubMed/NCBI
|
|
46
|
Sayers EW, Agarwala R, Bolton EE, Brister
JR, Canese K, Clark K, Connor R, Fiorini N, Funk K, Hefferon T, et
al: Database resources of the National Center for Biotechnology
Information. Nucleic Acids Res. 47:D23–D28. 2019. View Article : Google Scholar :
|
|
47
|
Moult J, Fidelis K, Kryshtafovych A,
Schwede T and Tramontano A: Critical assessment of methods of
protein structure prediction (CASP)-Round XII. Proteins. 86(Suppl
1): S7–S15. 2018. View Article : Google Scholar
|
|
48
|
Vetter IR: The structure of the G domain
of the Ras superfamily. Ras superfamily small G proteins: Biology
and mechanisms 1. Springer; Vienna, Vienna: pp. 25–50. 2014
|
|
49
|
Chothia C and Lesk AM: The relation
between the divergence of sequence and structure in proteins. EMBO
J. 5:823–826. 1986. View Article : Google Scholar : PubMed/NCBI
|
|
50
|
Thapliyal A, Verma R and Kumar N: Small G
proteins Dexras1 and RHES and their role in pathophysiological
processes. Int J Cell Biol. 2014:3085352014. View Article : Google Scholar : PubMed/NCBI
|
|
51
|
Brandi V, Di Lella V, Marino M, Ascenzi P
and Polticelli F: A comprehensive in silico analysis of huntingtin
and its interactome. J Biomol Struct Dyn. 36:3155–3171. 2018.
View Article : Google Scholar
|
|
52
|
Saudou F and Humbert S: The biology of
Huntingtin. Neuron. 89:910–926. 2016. View Article : Google Scholar : PubMed/NCBI
|
|
53
|
Krumova P and Weishaupt JH: Sumoylation in
neurodegenerative diseases. Cell Mol Life Sci. 70:2123–2138. 2013.
View Article : Google Scholar
|
|
54
|
Landré V, Rotblat B, Melino S, Bernassola
F and Melino G: Screening for E3-ubiquitin ligase inhibitors:
Challenges and opportunities. Oncotarget. 5:7988–8013. 2014.
View Article : Google Scholar : PubMed/NCBI
|