Introduction
Ovarian cancer (OC) is predominant among all types
of gynecological cancer, and is widely geographical distributed in
Asian countries with high incidence and morbidity (1,2).
Due to the aggressiveness, recurrence and drug-resistance of the
disease, most OC patients are diagnosed at an advanced stage and
have a poor prognosis (3). As
predicted by the International Agency for Research on Cancer in
2018, the number of OC cases and OC-associated deaths worldwide
will rise by 55 and 67%, respectively, over the next two decades
(4). For patients with advanced
OC, primary cytoreductive surgery in combination with a platinum
agent (cisplatin)-based chemotherapy is the cornerstone of current
treatment (5). However, the
development of drug resistance frequently triggers tumor recurrence
after chemotherapy in 57% of OC patients (6). Therefore, the molecular mechanisms
involved in tumor chemoresistance and more efficacious
consolidation strategies are acutely needed to improve
progression-free and overall survival for patients with OC.
Pleomorphic adenoma gene 1 (PLAG1), located on
chromosome 8q12, belongs to the pleomorphic adenoma (PLA) gene
family and encodes a zinc finger protein with 2 putative nuclear
localization signals (7).
PLAG1-associated Gene Ontology annotations include DNA binding
transcription factor activity and transcriptional activator
activity (8). Previous studies
have emphasized the positive role played by the overexpression of
PLAG1 in tumor angiogenesis and development (9-11).
Meanwhile, high expression of PLAG1 is reported to be an
independent prognostic factor in hepatocellular carcinoma (12). Sun et al (13) demonstrated that knockdown of PLAG1
increased the tumor necrosis factor-related apoptosis-inducing
ligand (TRAIL) sensitivity of acute myeloid leukemia cells.
Mounting reports have illustrated an enhanced anticancer effect of
TRAIL-cisplatin combination therapy (13-15). Insulin-like growth factor 2
(IGF2), which is a confirmed target of PLAG1, may be involved in
the pathological process of OC (16). Furthermore, Zhuang et al
(17) suggested that IGF1
receptor (IGF1R) is involved in the microRNA-143 (miR-143)-mediated
resistance of gastric cancer cells to cisplatin. Insulin receptor
substrate 1 (IRS1) is a classical adaptor protein for IGF1R
(18). It has been speculated
that IRS1 variants, which affect IGF and insulin signaling, modify
OC risk in breast cancer 1 (BRCA1) and BRCA2 mutation carriers
(19). Additionally, the
IRS1/IGF1R signaling pathway regulates the resistance of human
gastric cancer cells to cisplatin (20). Hence, we hypothesized that PLAG1
may represent a novel target in the therapy for OC, with the
involvement of the IGF2/IGF1R/IRS1 signaling pathway. In the
present study, gene overexpression and silencing experiments were
performed to investigate the role of PLAG1 in the cellular
activities and cisplatin resistance of OC cells, and its underlying
molecular mechanisms were investigated.
Materials and methods
Ethics statement
All patients enrolled in the study signed informed
consent documentation. All experimental procedures were conducted
under the approval of the Clinical Experiment Ethics Committee of
Hunan Provincial People's Hospital (The First Affiliated Hospital
of Hunan Normal University; Changsha, China).
Bioinformatics prediction
Based on the Gene Expression Omnibus database
(http://www.ncbi.nlm.nih.gov/geo), the
National Center for Biotechnology Information, datasets for
GSE66957, GSE54388, GSE40595 and GSE18520 and annotation files
associated to OC were retrieved and downloaded. Dataset information
is depicted in Table I. The Affy
1.60.0 installation package (http://www.bioconductor.org/packages/release/bioc/html/affy.html)
in R software 3.5.1 (https://www.r-project.org) was used to perform
background correction and normalization processing of the data.
Differential expression analysis was conducted for data profiling
by the package limma 3.36.5 (http://master.bioconductor.org/packages/release/bioc/html/limma.html)
in R software. The differentially expressed genes (DEGs) were
screened out with an adjusted P<0.05 and a threshold of |log2
(fold change)|>2. Next, heat maps of DEGs in dataset were drawn
using the pheatmap package 1.0.10 (https://cran.r-project.org/web/packages/pheatmap/index.html)
in R software, while the intersection of the four datasets was
obtained using Jvenn (http://jvenn.toulouse.inra.fr/app/example.html)
(21), which is an interactive
Venn diagram viewer. DisGeNET (http://www.disgenet.org/web/DisGeNET/menu/search?4) is
a relational gene-disease database that integrates information of
human disease-associated genes and variants (22). OC associated genes were retrieved
using 'Ovarian Carcinoma' as the keyword in the DisGeNET database.
The STRING database (https://string-db.org/) was employed to extract
protein-protein interaction data (23) and Cytoscape (3.6.0) was used for
extracting DEG-OC gene interaction networks (24).
 | Table IHuman ovarian cancer-associated gene
expression datasets from the GLP570 platform. |
Table I
Human ovarian cancer-associated gene
expression datasets from the GLP570 platform.
| Accession no. | Cancer type | Samples |
|---|
| GSE66957 | Unknown | Ovarian carcinoma
(n=57); normal ovarian (n=12) |
| GSE54388 | Epithelial ovarian
cancer | Healthy ovarian
surface epithelium (n=6); high grade serous ovarian cancer
(n=16) |
| GSE40595 | Epithelial ovarian
cancer | Epithelial tumor
from high grade serous ovarian cancer (n=32); normal ovarian
surface epithelium (n=6) |
| GSE18520 | Papillary serous
cystadenocarcinoma | Advanced stage,
high-grade primary tumor (n=53); normal ovarian surface epithelium
(n=10) |
Study subjects
A total of 75 female OC patients who were admitted
to the Department of Gynecology in Hunan Provincial People's
Hospital (The First Affiliated Hospital of Hunan Normal University)
between August 2015 to September 2017 were enrolled in the current
study All patients were confirmed as OC by postoperative
pathological examination. Moreover, no patient received
radiotherapy, chemotherapy or immunotherapy before surgery. The age
ranged from 21-64 years, with a mean age of 43.23±9.96 years. OC
and adjacent (3 cm) tissues were collected from all subjects and
frozen in liquid nitrogen for further use. The stages of OC were
determines according to the standard pathological staging system
for OC (25).
Immunohistochemistry
Paraffin sections of OC and adjacent tissues (4-6
µm) were dewaxed using xylene and dehydrated using gradient
alcohol. Then, a 15-min treatment with 3% hydrogen peroxide was
conducted to eliminate endogenous peroxidases. The samples were
subsequently blocked with normal goat serum (16210064; Gibco;
Thermo Fisher Scientific, Inc.) for 20 min at 37°C. After serum
removal, samples were incubated with diluted primary rabbit PLAG1
antibody (1:1,000; ab80267; Abcam) at 4°C overnight, with PBS used
as the negative control. After that, the samples were further
incubated with goat anti-rabbit secondary HRP-conjugated IgG
antibody (1:1,000; ab150117; Abcam) at 37°C for 30 min.
Streptavidin-biotin complex (Boster Biological Technology) was
added to the samples according to the manufacturer's instructions
and samples were incubated at 37°C for 30 min. Diaminobenzidine
(1:1,000) was utilized to develop the samples at room temperature
for 15-20 min followed by counterstaining with hematoxylin (0.3
g/ml) at room temperature for 1 min prior to observation under a
light microscope (magnification, ×200).
Cell culture and screening
OC cell lines A2780 (CBP60283), SKOV3 (CBP60291),
HO8910 (CBP61086) and COC1 (CBP60776) were provided by Cobioer.
RPMI-1640 (CBP50005; Gibco; Thermo Fisher Scientific, Inc.)
containing 10% fetal bovine serum (FBS; Gibco; Thermo Fisher
Scientific, Inc.) was used to suspend A2780, HO8910 and COC1 cells
and SKOV3 cells were suspended using McCoy's 5A (CBP50013 Gibco;
Thermo Fisher Scientific, Inc.) supplemented with 10% FBS. Then,
the cells (0.5×10⁵/ml) were added to 24-well plates (1
ml/well) and incubated at 37°C in an incubator with 5%
CO2 and 100% saturated humidity. The cells were passaged
once every 2-3 days. Cell line screening included determining the
expression levels of PLAG1 and IGF2 in the four cell lines by
reverse transcription-quantitative (RT-q) PCR.
Small interfering RNA (siRNA)
construction and screening
Three siRNAs sequences for each PLAG1 and IGF2, as
well as a negative control (NC; Table II) were designed online
(http://rnaidesigner.thermofisher.com/rnaiexpress/).
The sequences were cloned into pRI-GFP/Neo plasmids (cat. no.
V6408; Inovogen Biotechnology, Pvt., Ltd.). Following enzyme
digestion by BamHI (ER0053; Thermo Fisher Scientific, Inc.)
and HindIII (FD0505; Thermo Fisher Scientific, Inc.), the
constructed plasmids were validated by sequencing and named as
si-PLAG1-1, si-PLAG1-2, si-PLAG1-3, si-IGF2-1, si-IGF2-2 and
si-IGF2-3. siRNAs were transfected into OC cells as described
below. RT-qPCR was employed to determine PLAG1 and IGF2 expression
in the cells.
| Table IISequences of designed siRNA and
NC. |
Table II
Sequences of designed siRNA and
NC.
| Construct | Sequence
(5′-3′) |
|---|
| si-PLAG1-1 |
GCTGGAGGCAGATGTATAT |
| si-PLAG1-2 |
GGAGGCAGATGTATATGAT |
| si-PLAG1-3 |
CCAGCAACACTGACAACAA |
| si-IGF2-1 |
TCGTGCTGCTCGTCTTCTT |
| si-IGF2-2 |
TCGTGCTGCTATGCTGCTT |
| si-IGF2-3 |
GGGCAAGTTCTTCCGCTAT |
| NC-1 |
TTCTCCGAACGTGTCACGTTT |
| NC-2 |
TTAAGAGGCTTGCACAGTGCA |
Construction of overexpression
vectors
PLAG1 and IGF2 sequences obtained from the NCBI
(https://www.ncbi.nlm.nih.gov) were
inserted into the overexpression vector pcDNA3-EGFP (cat. no.
13031; Addgene, Inc.) carrying ampicillin resistance. Through
restriction enzyme digestion by BamHI and HindIII and
sequencing, it was confirmed that the PLAG1 and IGF2 overexpression
plasmids were successfully constructed, and samples were named
pcDNA-PLAG1 and pcDNA-IGF2, respectively. pcDNA-PLAG1, pcDNA-IGF2
and NC vectors were transfected into OC cells as described below.
RT-qPCR was used to detect the content of PLAG1 and IGF2 in
cells.
Grouping and transfection
A2780 used in the subsequent experiments and the
following groups were established: Blank, not transfected;
pcDNA-NC, transfected with empty vector; pcDNA-PLAG1, transfected
with PLAG1 overexpression sequence; pcDNA-IGF2, transfected with
IGF2 overexpression sequence; si-NC, transfected with empty siRNA
vector; si-PLAG1, transfected with si-PLAG1; si-IGF2, transfected
with si-IGF2; si-PLAG1 + pcDNA-IGF2, co-transfection with si-PLAG1
and IGF2 overexpression sequence; and pcDNA-PLAG1 + si-IGF2,
co-transfected with PLAG1 overexpression sequence and si-IGF2.
Prior to transfection, cells (4×10⁵
cells/well) were cultured in 500 µl of antibiotic-free
medium. When cell confluence reached 80%, cells were transfected
with Lipofectamine2000 (Invitrogen; Thermo Fisher Scientific, Inc.)
according to the manufacturer's instructions. Serum-free medium (50
µl) was used to dilute 20 pmol plasmid. Another 50 µl
of serum-free medium was used to dilute 1 µl of transfection
reagent and the mixture was incubated at room temperature for 5
min. Then, both mixtures were combined and added to the individual
wells for 6 h. Complete medium was adopted and cells were further
cultured at 37°C for 48 h; A2780 cells at 3rd passage were used for
subsequent experiments. The transfection efficiency of pcDNA-PLAG1,
si-PLAG1, pcDNA-IGF2 and si-IGF2 is presented in Fig. S1.
EdU labeling
A2780 cells (1×l05/ml) were seeded in
24-well plates (1 ml/well) with a cover glass coated with
poly-lysine. Cell culture medium was used to dilute EdU solution
(C01503; 1:1,000; 50 µM; Shanghai Dongsheng Biotechnology
Co., Ltd.). A total of 100 µl of EdU culture medium (50
µM) added to each well and incubated for 2 h with glycine (2
mg/ml) at room temperature for 10 min. Next, 0.5% Triton X-100 (100
µl) was added to each well to permeabilize cells and stain
them with Apollo staining solution (100 µl; Beyotime
Institute of Biotechnology) at room temperature in the dark for 30
min. Nuclei were stained with DAPI (10 µg/ml; C0060; Beijing
Solarbio Science & Technology Co., Ltd.) at room temperature
for 10 min and observed under an inverted fluorescence microscope
(magnification, ×200). The proportion of DAPI-positive to
EdU-positive cells was regarded as the positive cell rate.
Transwell assay
Matrigel was melted at 4°C overnight and diluted
with serum-free medium (1:1). The solution was then added to a
Transwell chamber for coating at room temperature for 15-30 min.
Then, 2% serum-containing medium was added to the cells to prepare
cell a suspension, which was added to the upper chamber. The lower
Transwell chamber contained medium supplemented with 20% FBS. After
20-24 h at 37°C, the Transwell plate was immersed in formalin at
room temperature for 10 min. Subsequently, 0.1% crystal violet was
used for staining at room temperature for 20-30 min. We randomly
selected five visual fields from each sample and the mean number of
cells was calculated using an inverted microscope (magnification,
×200) as the index of cell invasion ability.
Scratch test
Uniform horizontal lines were drawn on the back of
6-well plates every 0.5-1.0 cm; each well was crossed by ≥5 lines.
A2780 cells (5×10⁵) were added to 6-well plates and
grown to confluence of 95% over night. The next day, cell
monolayers were scratched perpendicular to the horizontal lines
using a 10 µl pipette tip. Afterward, the cells were washed
three times with PBS to remove cells. Each well was incubated with
serum-free medium in a 5% CO2 at 37°C. Images were
captured at 0 and 24 h using an optical microscope (magnification,
×200).
CCK-8 assay
First, we used 10% FBS medium to obtain various
cisplatin (P4394-25MG; Sigma-Aldrich; Merck KGaA) concentrations
(0, 0.75, 1.5, 3, 6 and 12 µmol/l) and stored it at 4°C for
further use. A2780 cells (2×10⁴/200 µl) at the
logarithmic growth phase were added to a 96-well plate. The plate
was incubated at 37°C with 5% CO2 for 6 h. Cisplatin
(1,000 µM) was diluted to 0.75, 1.5, 3, 6 and 12 µM
and added to wells, with three replicates for each concentration.
Blank wells were used as controls. After 48 h incubation, 10
µl fresh CCK-8 reagent (Yeasen) was added to each well,
followed by 4 h incubation at 37°C. Absorption (A) at 450 nm was
detected and the cell survival rate was calculated as:
[A(experimental)/A(control)] ×100%.
RT-qPCR
total RNA was extracted from A2780 cells using
TRIzol® reagent (Invitrogen; Thermo Fisher Scientific,
Inc.) and the concentration and purity were determined. The total
RNA was reverse transcribed into cDNA according to the instructions
of the ReverTra Ace qPCR RT kit (Toyobo Life Science). Primers
(Table III) were synthesized by
Sangon Biotechnology Co., Ltd. qPCR was performed using a two-step
method using a ReverTra Ace qPCR RT kit (Toyobo Life Science),
GAPDH served as the internal reference. Each sample was measured
three times and the data were analyzed using the 2−ΔΔCq
method (26).
| Table IIIPrimer sequences for reverse
transcription-quantitative PCR. |
Table III
Primer sequences for reverse
transcription-quantitative PCR.
| Gene | Direction | Sequence
(5′-3′) |
|---|
| PLAG1 | Forward |
ATCACCTCCATACACACGACC |
| Reverse |
AGCTTGGTATTGTAGTTCTTGCC |
| IGF2 | Forward |
GTGGCATCGTTGAGGAGTG |
| Reverse C |
ACGTCCCTCTCGGACTTG |
| IGF1R | Forward |
TCGACATCCGCAACGACTATC |
| Reverse CC |
AGGGCGTAGTTGTAGAAGAG |
| IRS1 | Forward |
ACAAACGCTTCTTCGTACTGC |
| Reverse |
AGTCAGCCCGCTTGTTGATG |
| GAPDH | Forward |
CCCCTTCATTGACCTCAACTACAT |
| Reverse |
TCACCATCTTCCAGGAGCG |
Western blot analysis
RIPA lysis buffer (Beyotime Institute of
Biotechnology) and phenylmethylsulfonyl fluoride were added to
A2780 cells to extract the total protein. The protein concentration
was measured using a bicinchoninic acid kit. Then, 20 µg
protein was separated on 10% SDS-PAGE gels and transferred to
polyvinylidene fluoride membranes. Each membrane was blocked using
5% skimmed milk for 1.5 h at room temperature and then incubated
with following rabbit primary antibodies: PLAG1(1:10,000; ab80267),
IGF2 (1:1,000; ab9574), IGF1R (1:1,000; ab39398), IRS1 (1:1,000;
ab52167) and GAPDH (1:2,500; ab9485). Then, membranes were
incubated with horseradish peroxidase-conjugated goat anti-rabbit
secondary IgG antibody (1:10,000; ab6721) at room temperature for 2
h. All antibodies were purchased from Abcam. An enhanced
chemiluminescence reagent (Shanghai Huiying Biological Technology
Co., Ltd.) was used for sample development and imaging. Quantity
One V4.6.6 software (Bio-Rad Laboratories, Inc.) for analyzing the
gray value of each protein band.
Statistical analysis
Statistical analysis was performed using SPSS 21.0
(IBM Corp.). Data are expressed as the mean ± standard deviation.
All data were tested for normality and homogeneity of variance. If
conforming to a normal distribution or homogeneity of variance,
comparisons within the group were performed by paired Student's
t-test, while comparisons between two groups were analyzed by an
unpaired Student's t-test. Comparisons among multiple groups were
assessed by one-way ANOVA with Tukey's post hoc test. If data did
not conform to a normal distribution or homogeneity of variance,
the rank sum test was used. Pearson's correlation coefficient was
used to analyze the correlation between PLAG1 and IGF2. P<0.05
was indicative of statistical significance.
Results
PLAG1 and IGF2 gene expression is
increased in OC
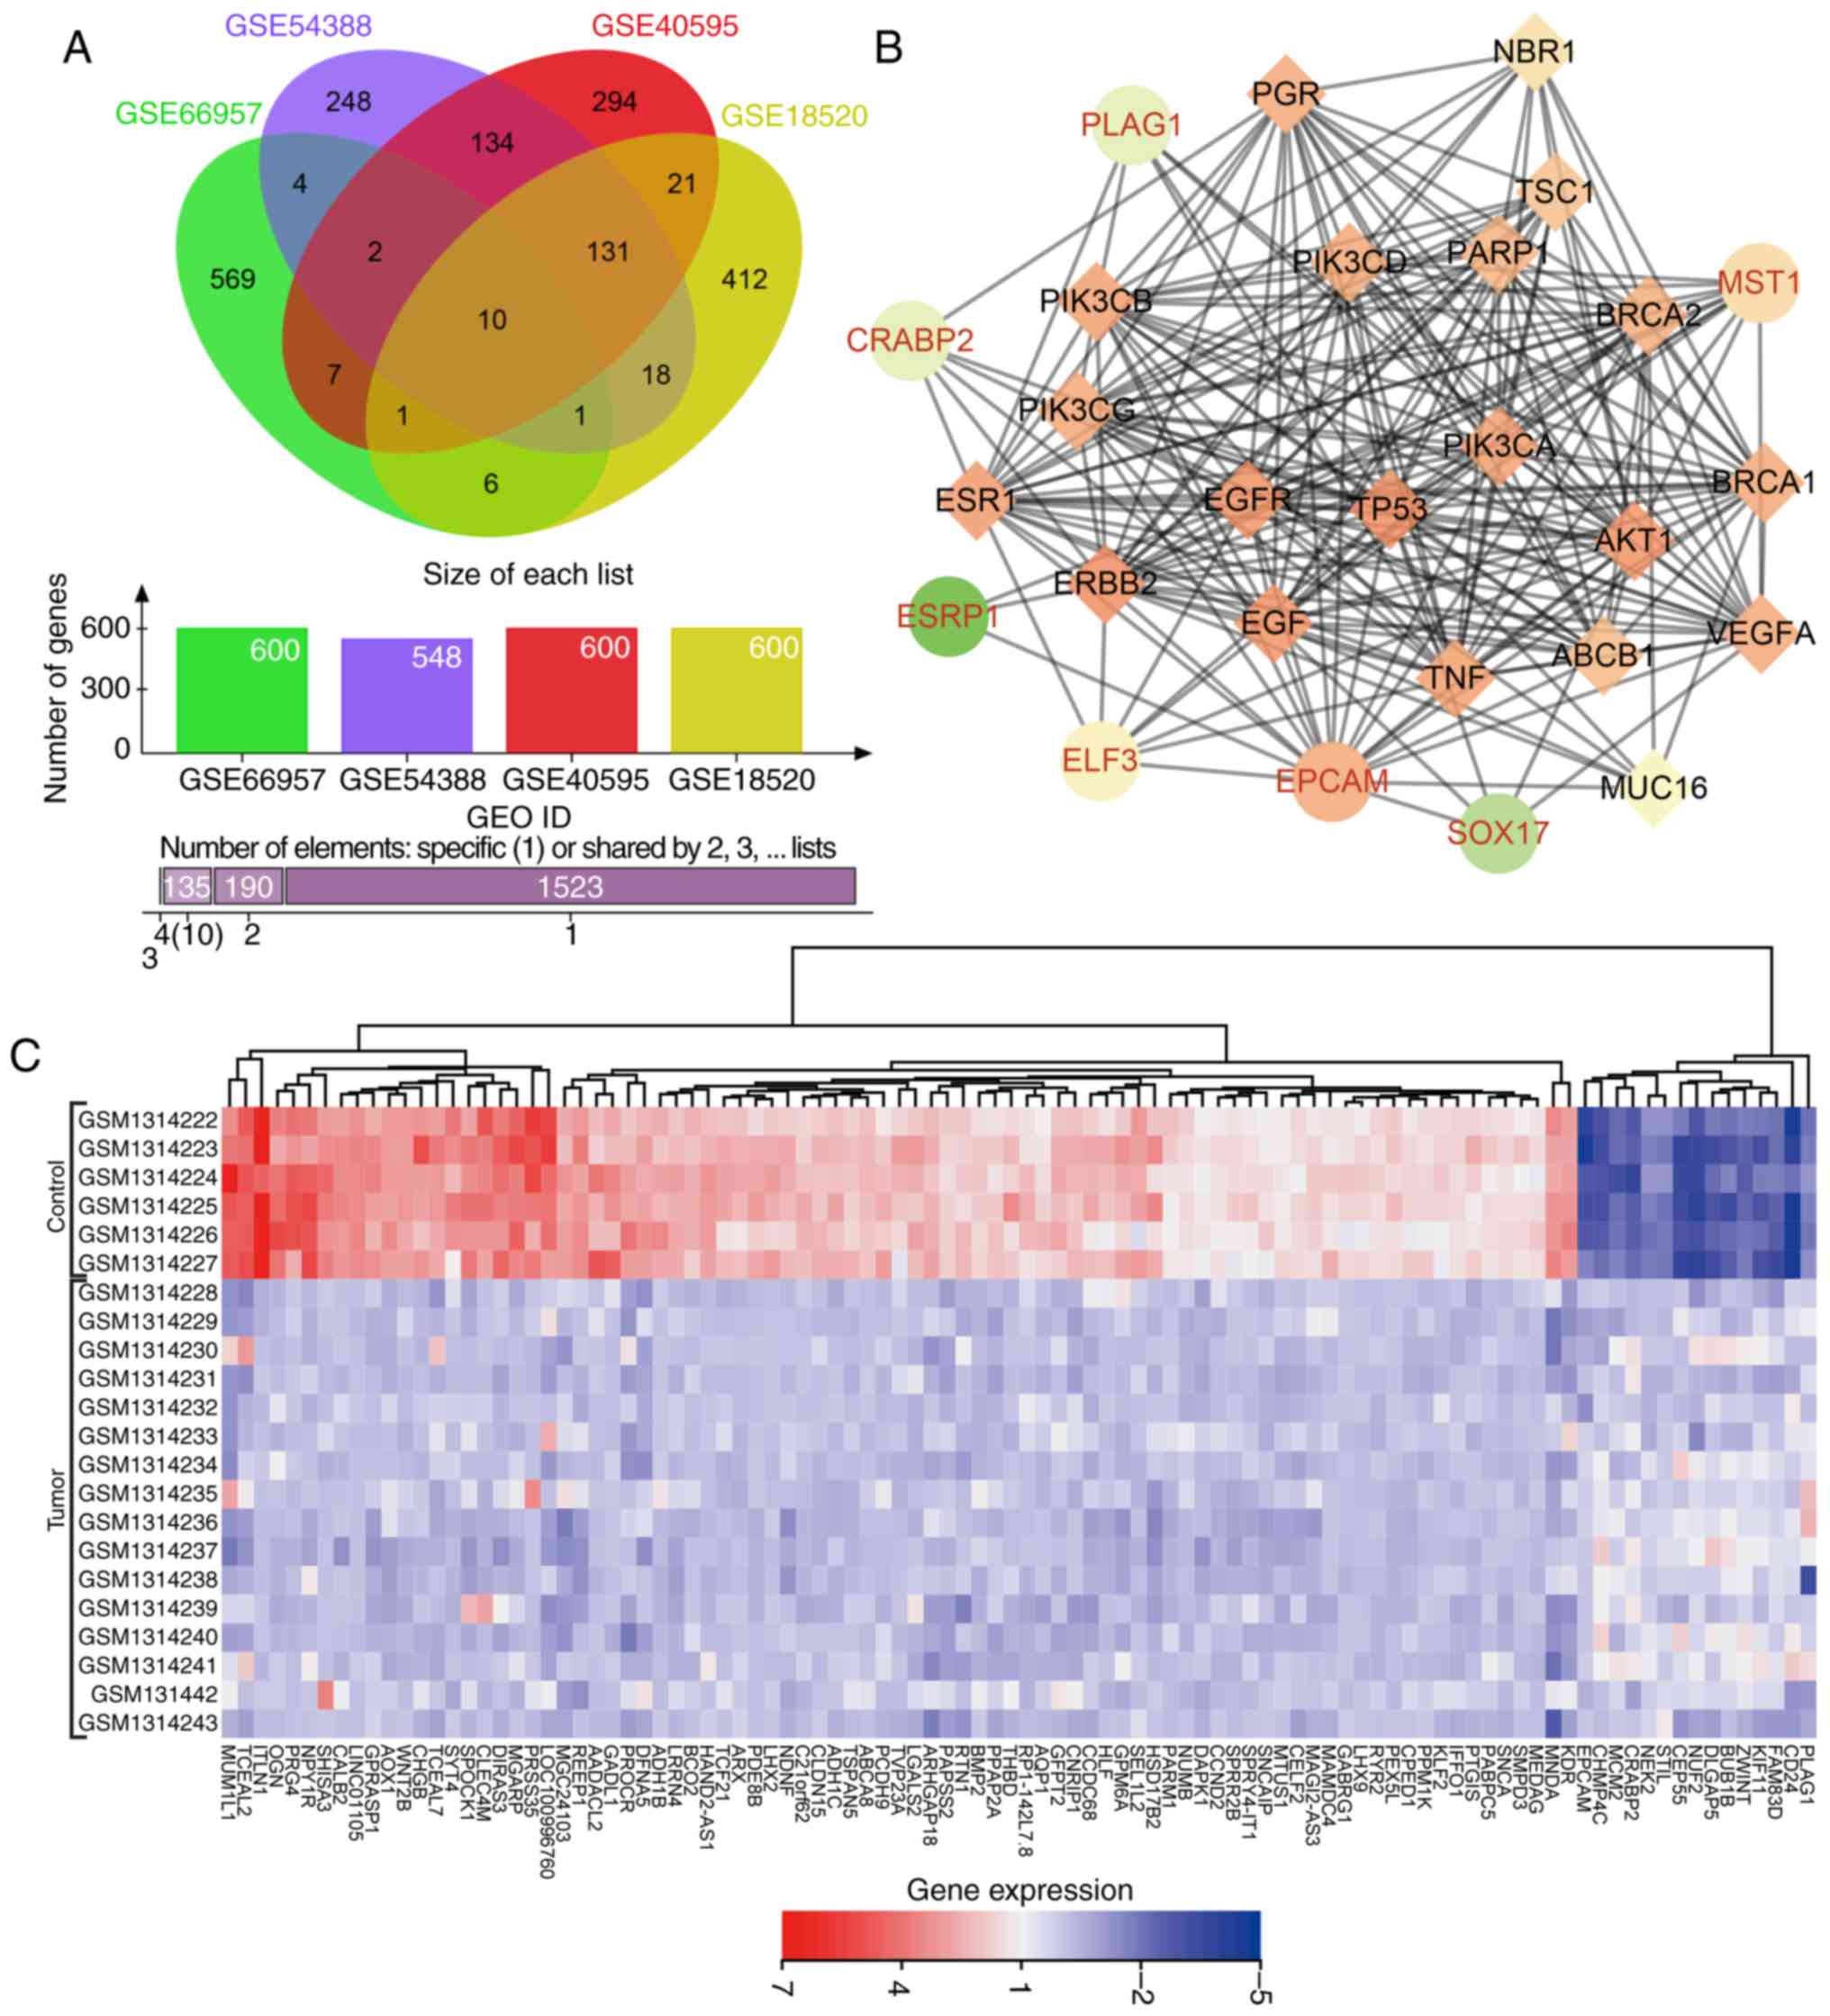
DEGs associated with OC were extracted from four OC
microarray datasets (GSE66957, GSE54388, GSE40595 and GSE18520).
Venn diagrams (Fig. 1A) were
drawn based on the top 600 DEGs in each dataset, presenting 10
genes (KLHL14, EPCAM, ELF3, CD24, SOX17, CRABP2, MST1, ESRP1, GIPC2
and PLAG1) in the dataset intersection. These genes were assessed
in the subsequent analysis. In the DisGeNET dataset, we retrieved
OC-associated genes and selected the top 20 genes (TP53, BRCA1,
BRCA2, ERBB2, VEGFA, MUC16, EGFR, NBR1, PIK3CA, ESR1, PIK3CB,
PIK3CD, PIK3CG, ABCB1, TSC1, EGF, AKT1, TNF, PARP1 and PGR) as
OC-associated genes. DEGs in OC and OC-associated genes were
applied in the STRING dataset to analyze the gene interaction. The
gene interaction network was visualized via Cytoscape (Fig. 1B). In the interaction network,
EPCAM, ELF3, PLAG1, MST1 and CRABP2 displayed a complex association
(degree, >5) with other genes. Existing studies have revealed
that EPCAM (27,28), ELF3 (29), MST1 (30), and CRABP2 (31,32) showed aberrant expression in OC.
However, few studies have focused on the aberrant expression of
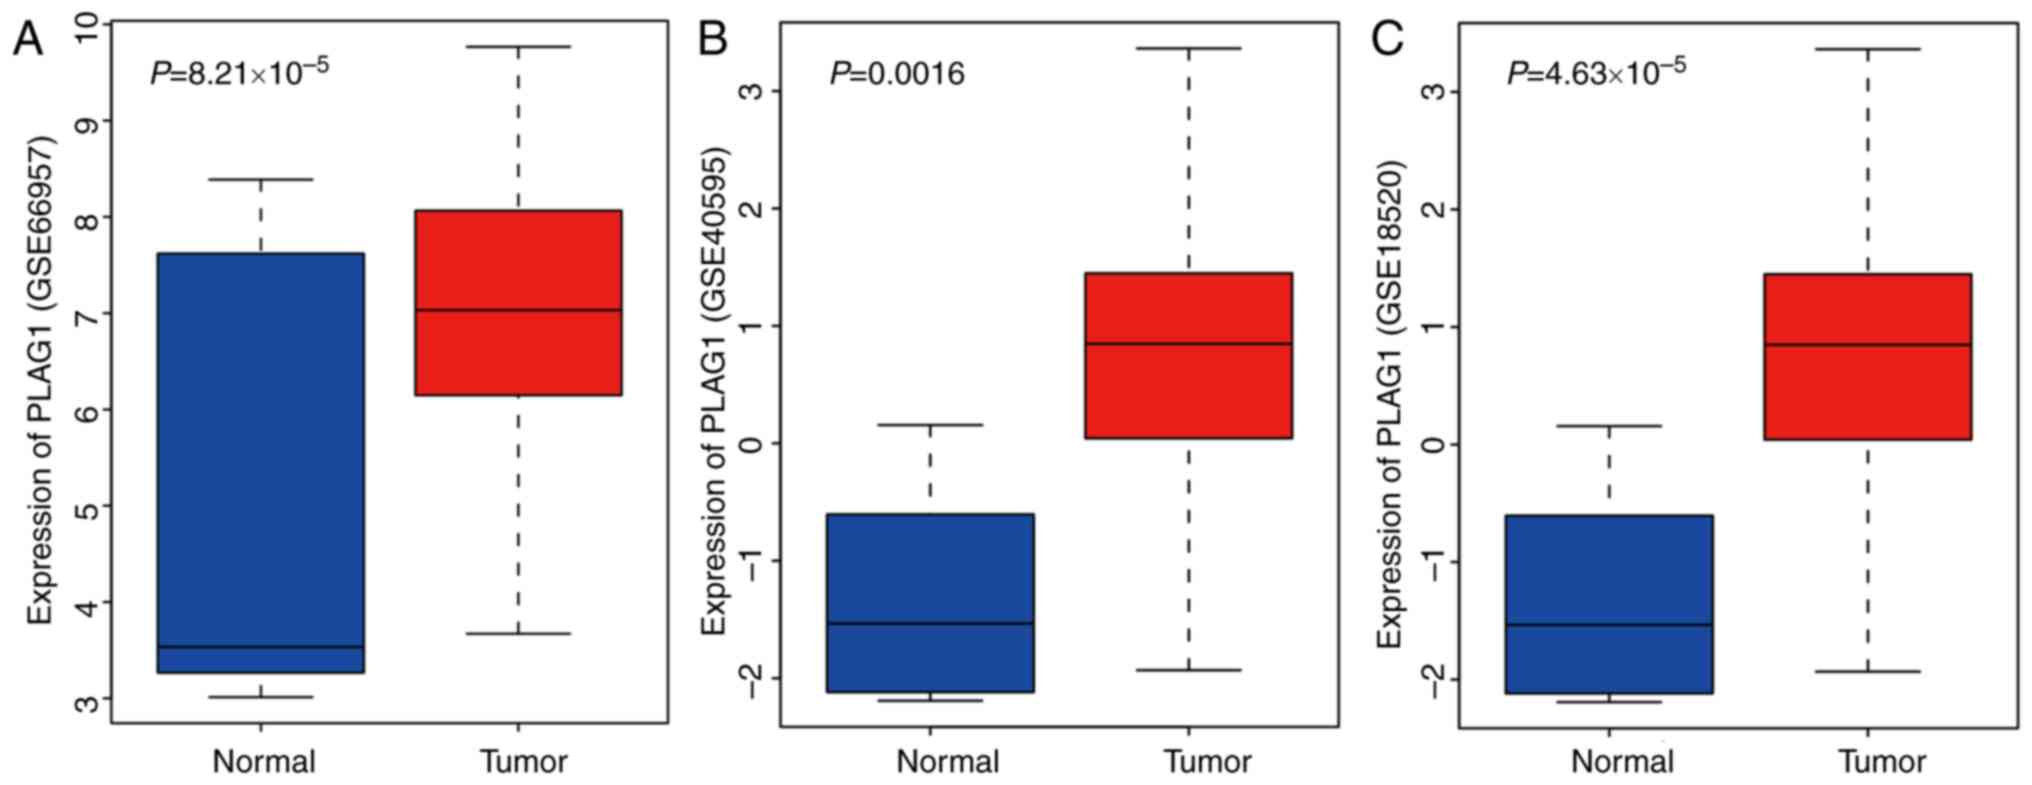
PLAG1 in OC. Heat maps (Fig. 1C)
of the top 100 DEGs in GSE54388 were prepared, indicating that
PLAG1 was robustly overexpressed in OC compared with normal
tissues. As shown for the GSE66957, GSE40595 and GSE18520 datasets
(Fig. 2A-C), PLAG1 was
overexpressed in OC tissues. The expression of IGF2 was abundant in
OC, as previously described (33,34). Of importance, PLAG1, as a
transcriptional activator of IGF2, regulates expression of IGF2
(35). It was hypothesized that
PLAG1 may serve a role in the progression of OC that may also
affect IGF2 expression.
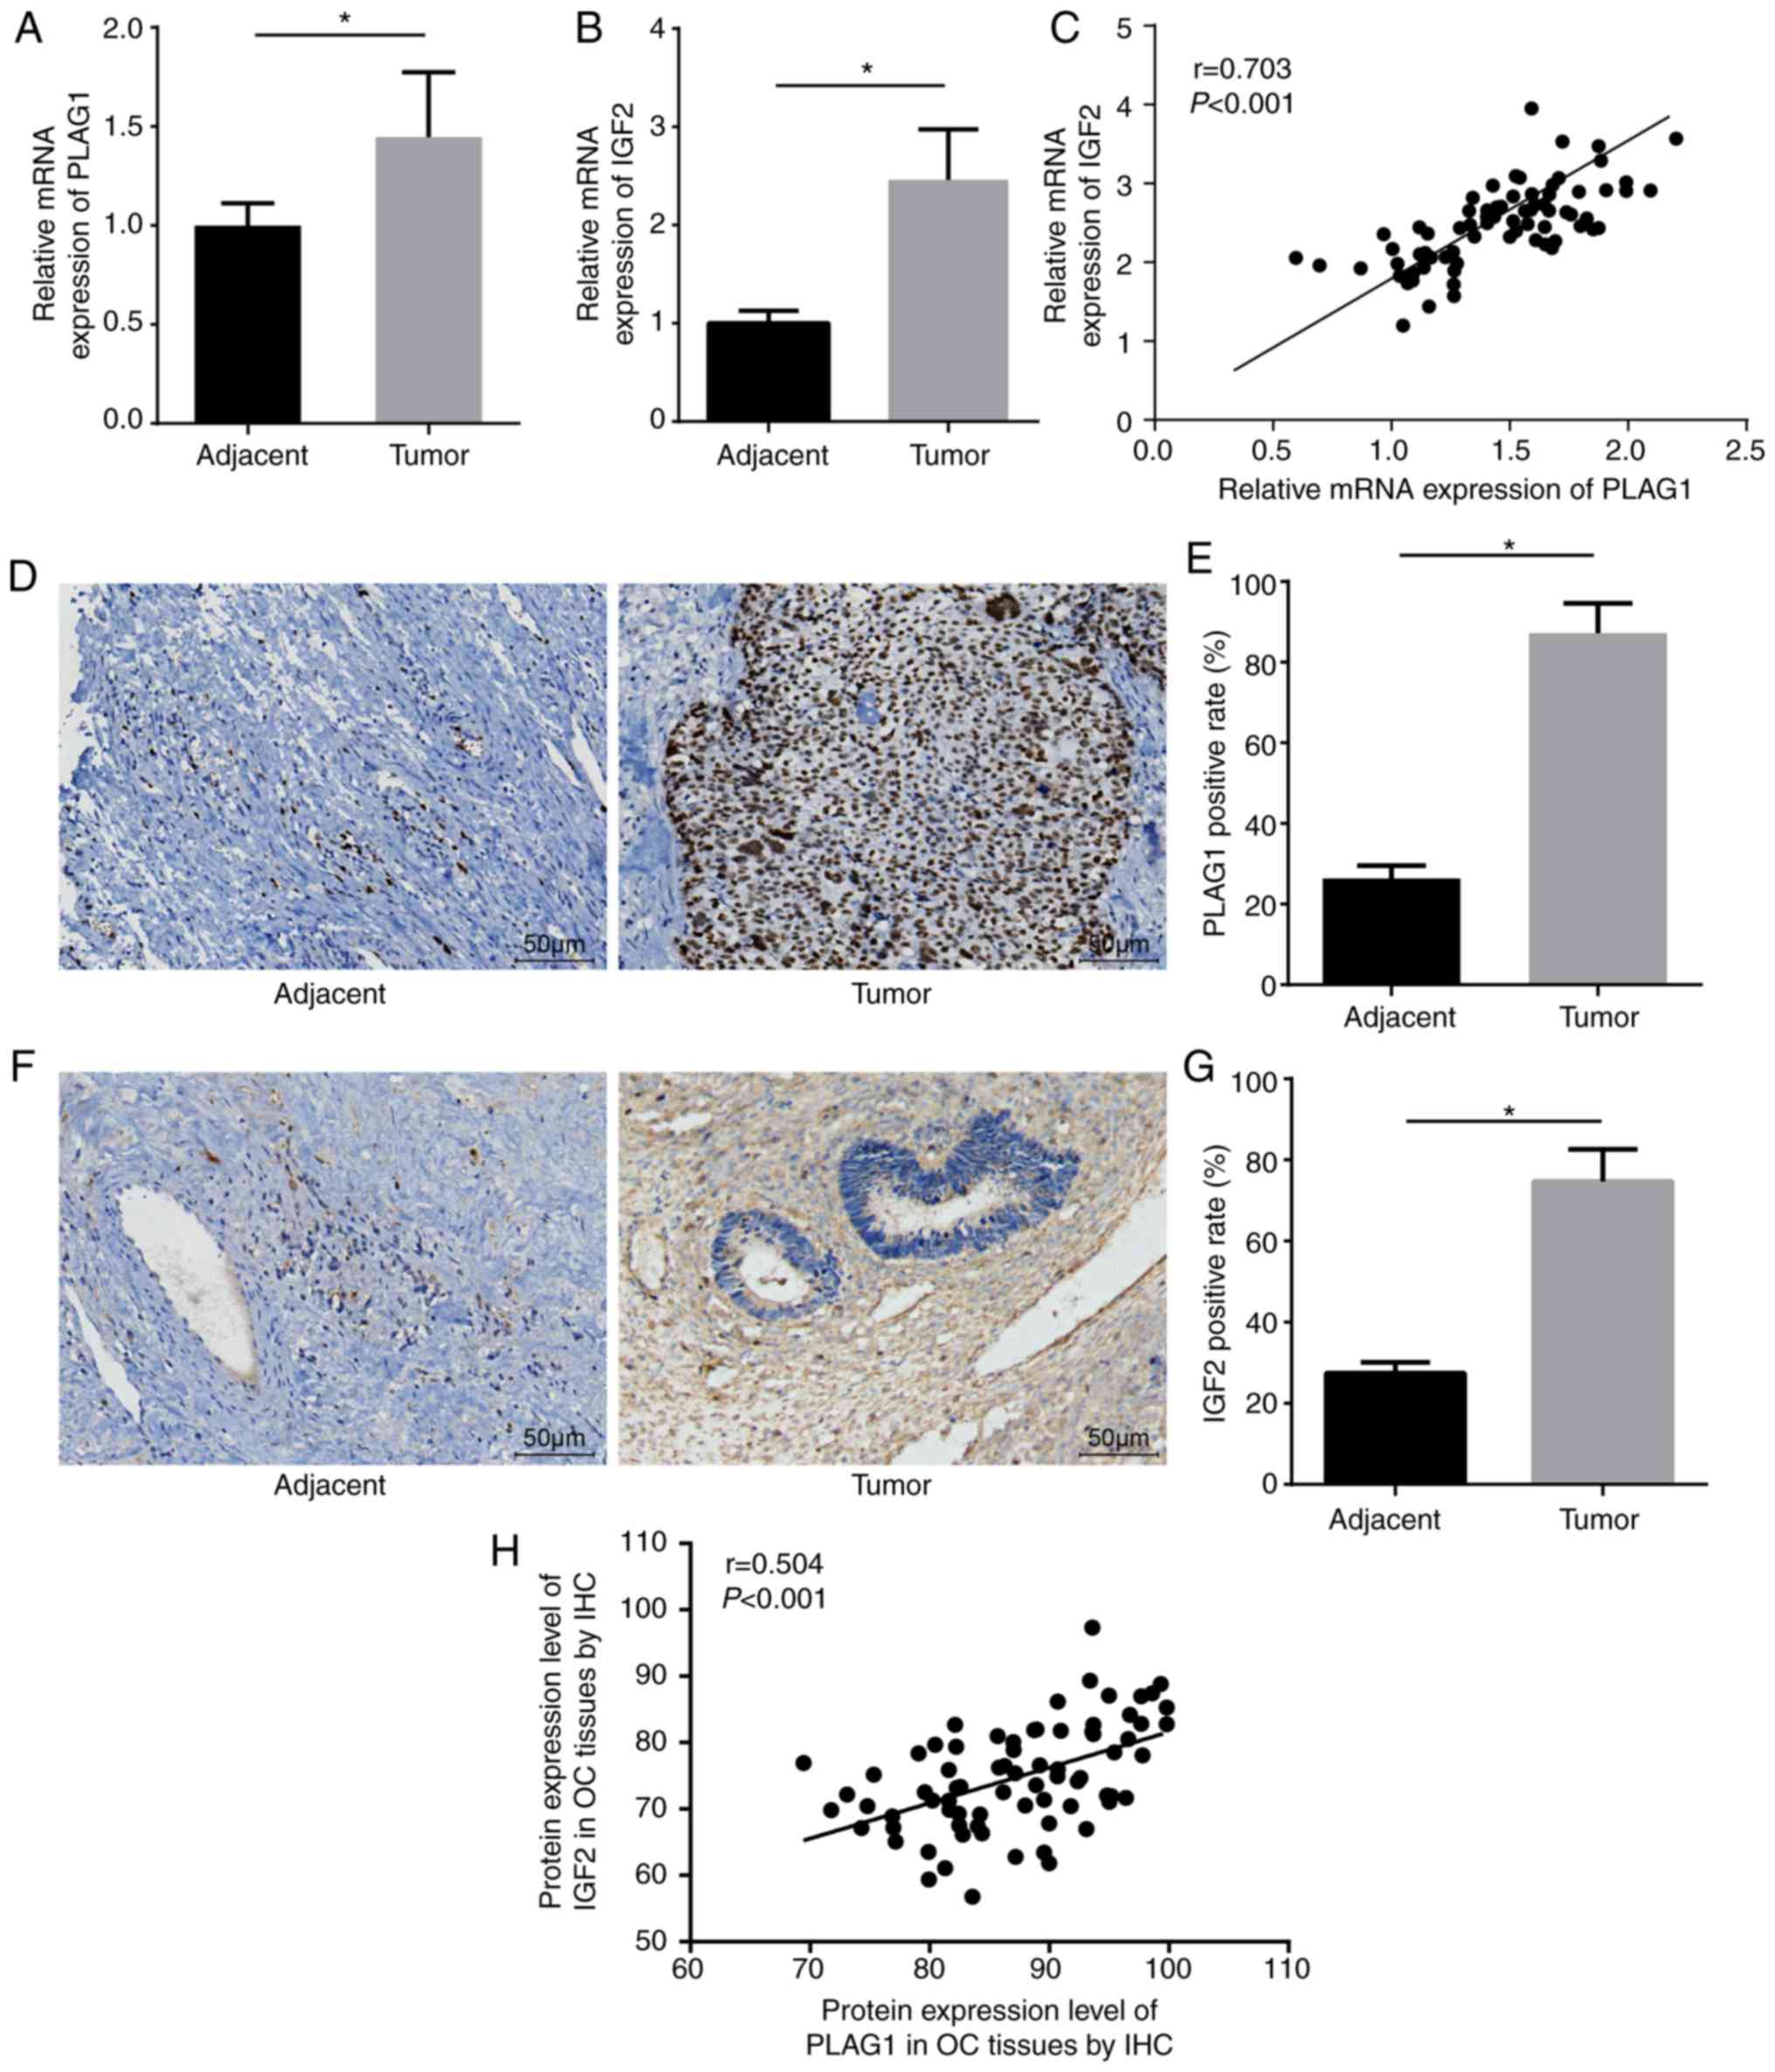
PLAG1 and IGF2 are overexpressed in OC
tissues
RT-qPCR was utilized to determine the expression of
PLAG1 and IGF2 in the 75 OC and corresponding adjacent tissues. Of
the 75 patients a total of 36 cases were confirmed to be stage I,
28 stage II and 11 stage III. A total of 39 cases were ovarian
serous adenocarcinomas, 23 cases were mucinous adenocarcinomas and
13 cases were endometrioid carcinomas. Compared with the adjacent
tissues, the OC tissues showed significantly higher mRNA expression
of PLAG1 and IGF2 (P<0.05; Fig. 3A
and B). Correlation analysis displayed that expression levels
of PLAG1 and IGF2 were positively correlated (Fig. 3C). Immunohistochemistry was
employed to measure the expression of PLAG1 (Fig. 3D and E). PLAG1 protein presented
as pale brown or yellow-brown and was mainly expressed in the
nucleus. The expression of PLAG1 in OC tissues was significantly
higher than in adjacent tissues (P<0.05). In addition,
immunohistochemistry was used to test the protein expression of
IGF2. The results showed that IGF2 protein was pale brown or
yellow-brown. Compared with the adjacent tissues, the expression of
IGF2 in OC tissues was significantly elevated (P<0.05; Fig. 3F and G). The immunohistochemistry
results of PLAG1 and IGF2 were adopted for the correlation
analysis, which demonstrated that the protein expression levels of
PLAG1 and IGF2 were positively correlated (Fig. 3H).
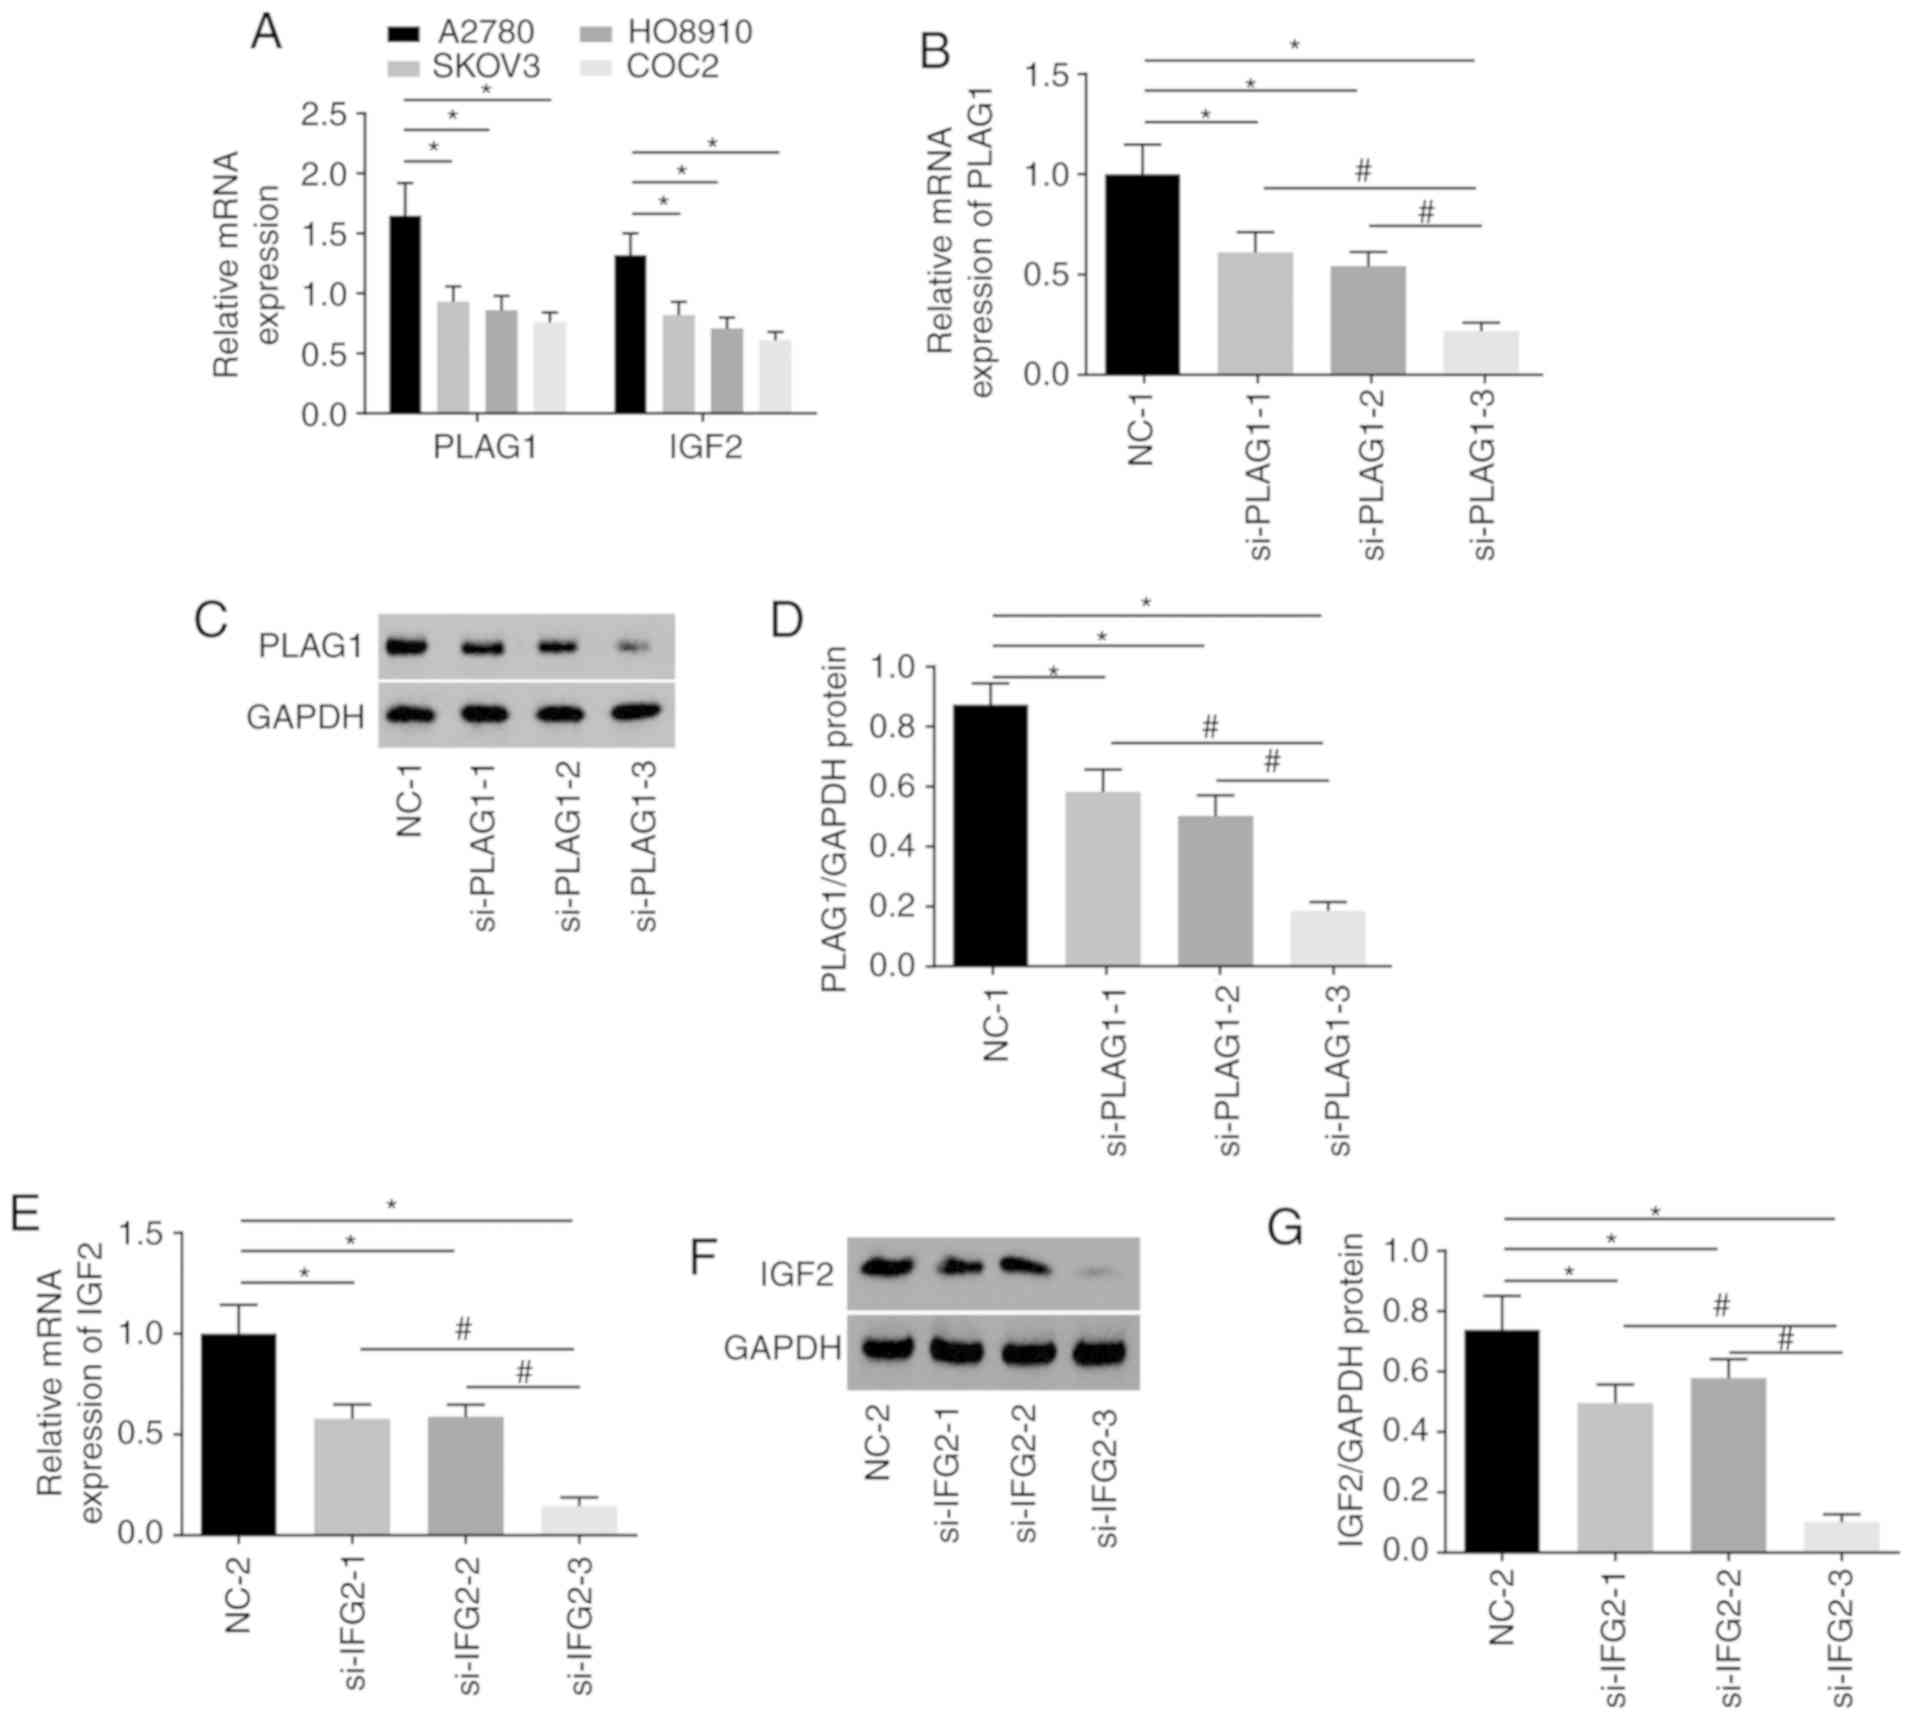
Selection of siRNAs and cell lines for
subsequent experiments
A series of experiments were conducted to select the
siRNA with the highest transfection efficiency and to select an OC
cell line to ensure the highest accuracy of the results. Among four
OC cell lines, A2780 presented the highest expression of PLAG1 and
IGF2 (Fig. 4A). As displayed in
Fig. 4B-D, A2780 transfected with
si-PLAG1-3 showed significant reductions in the mRNA and protein
levels of PLAG1 when compared with those transfected with
si-PLAG1-1 and si-PLAG1-2 (P<0.05). The results suggested that
A2780 transfected with si-IGF2-3 had significantly decreased mRNA
and protein level of IGF2 compared with those transfected with
si-IGF2-1 and si-IGF2-2 (P<0.05; Fig. 4E and G). The silencing effects of
si-PLAG1-3 and si-IGF2-3 were the best among the tested siRNAs and
A2780 transfected with si-PLAG1-3 and si-IGF2-3 were selected for
subsequent experiments and are termed as si-PLAG1 and si-IGF2
hereafter.
PLAG1 activates the IGF2 signaling
pathway
We conducted RT-qPCR to assess expression of IGF2
signaling pathway-associated genes to analyze the regulatory
connection between PLAG1 and the IGF2 signaling pathway. The
results suggested that overexpression of PLAG1 led to increased
mRNA and protein expression of IGF2, IGF1R and IRS1, while
silencing PLAG1 resulted in reversed observations for IGF2, IGF1R
and IRS1 (P<0.05; Fig. 5).
These findings suggested that PLAG1 positively regulated the IGF2
signaling pathway.
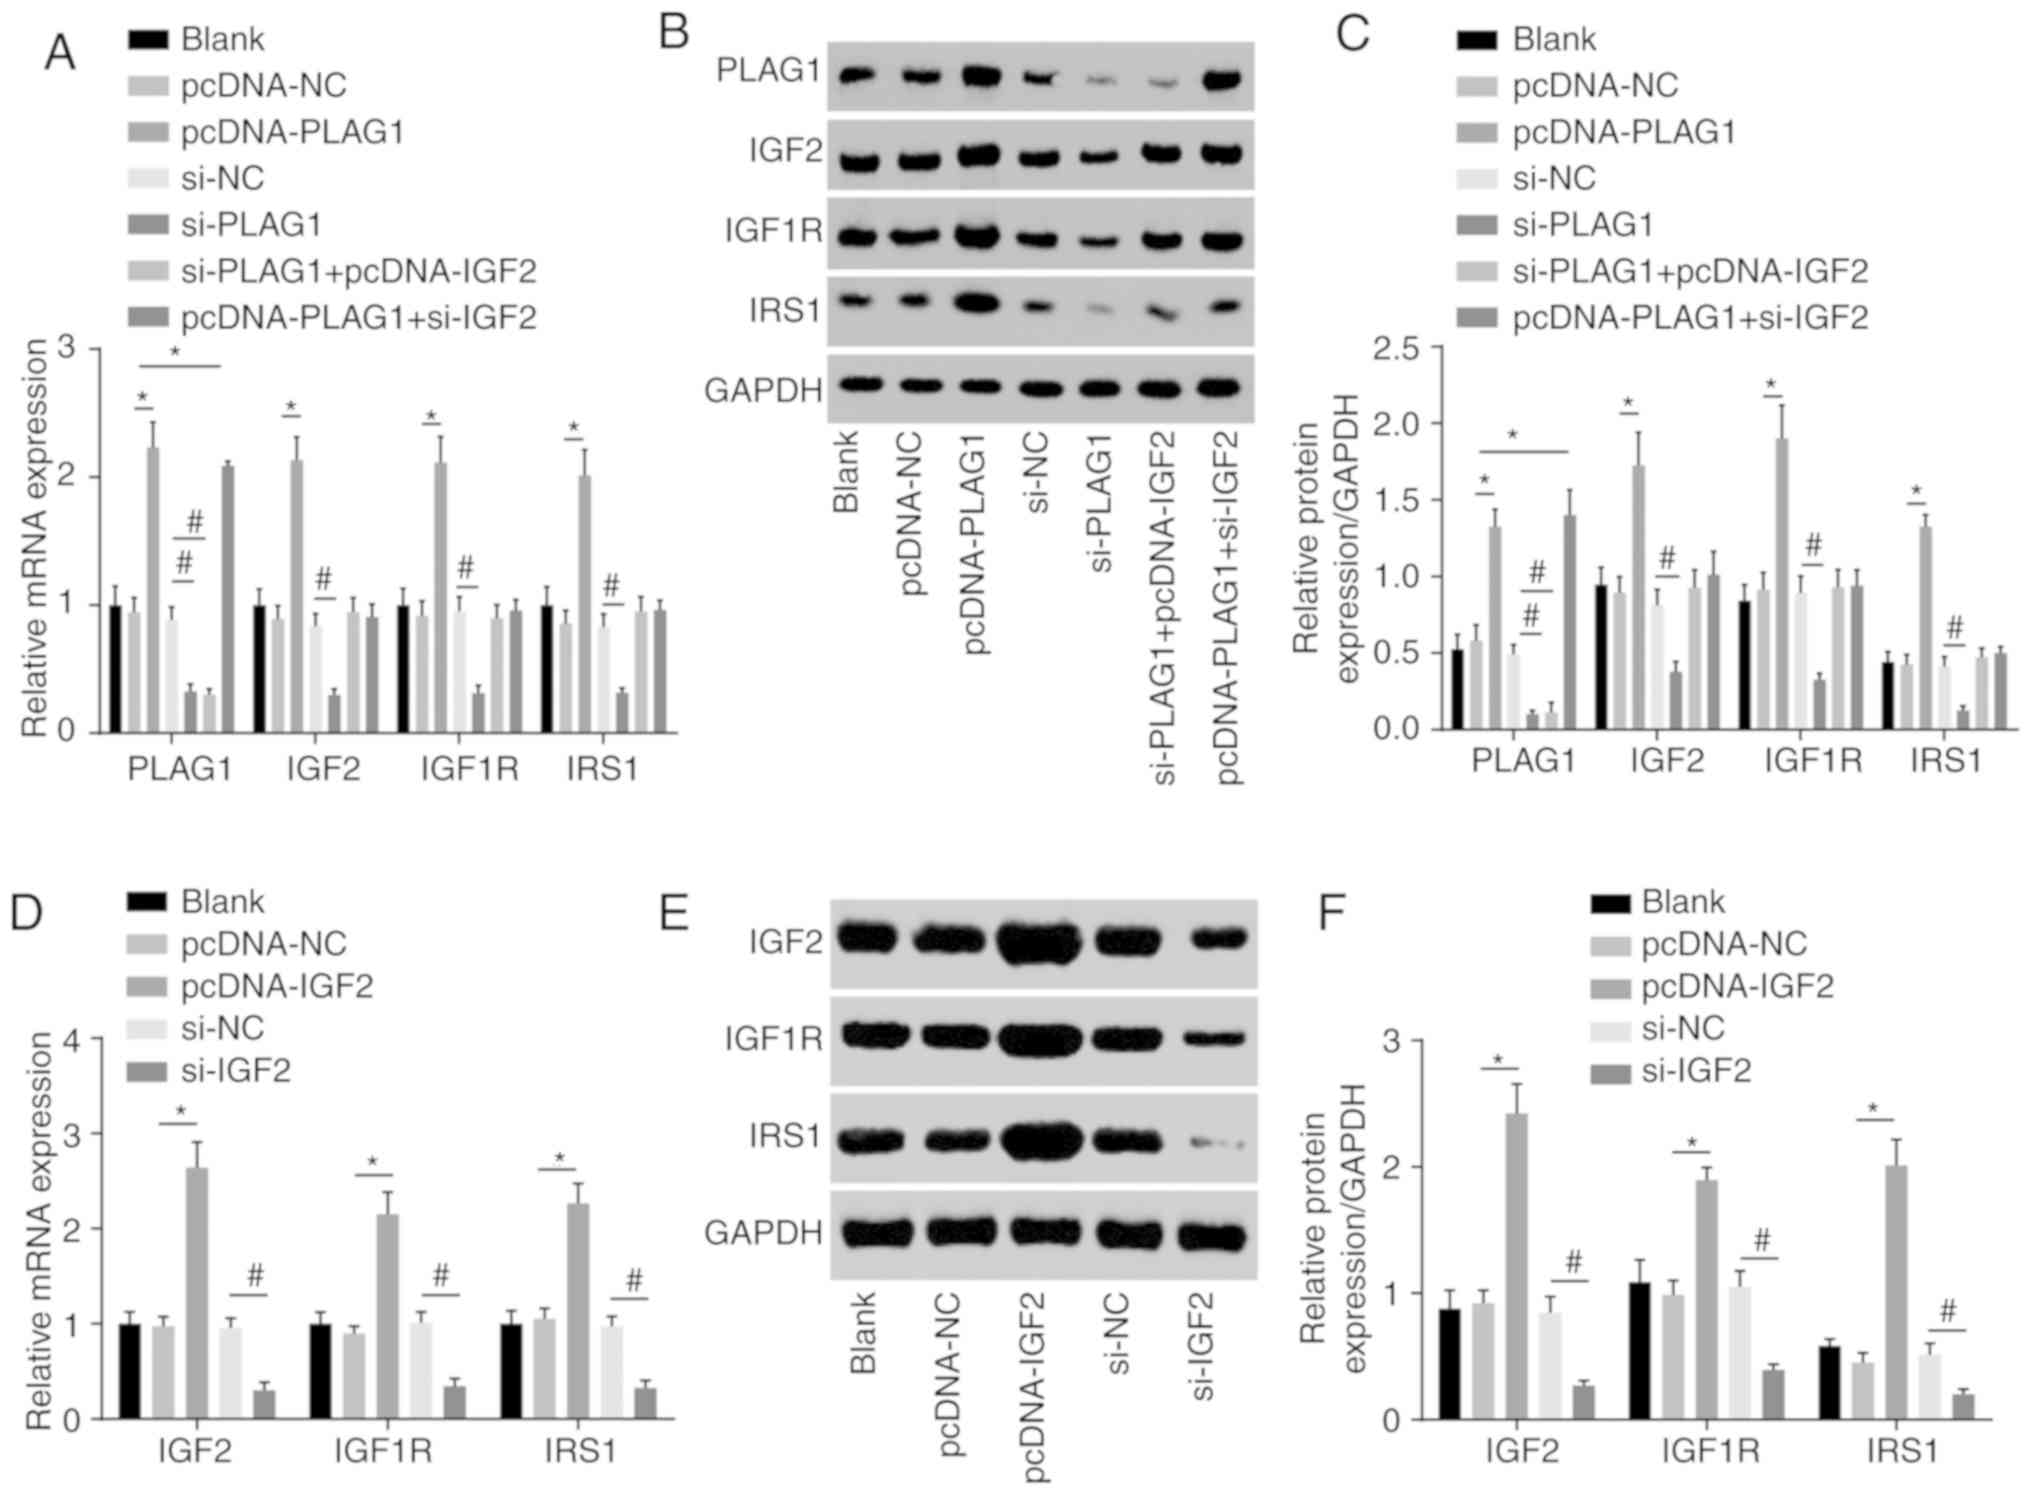 | Figure 5PLAG1 overexpression activates the
IGF2 signaling pathway. PLAG1, IGF2, IGF1R and IRS1 (A) mRNA
levels, (B) western blot images and (C) quantification in A2780
transfected with pcDNA-PLAG1, si-PLAG1, si-PLAG1 + pcDNA-IGF2 and
pcDNA-PLAG1 + si-IGF2 or associated controls. IGF2, IGF1R and IRS1
(D) mRNA levels, (E) western blot images and (F) protein levels in
A2780 transfected with pcDNA-IGF2 and si-IGF2 or respective
controls. Data are expressed as the mean ± standard error; each
experiment was repeated three times. *P<0.05
vs.pcDNA-NC; #P<0.05 vs. si-NC. PLAG1, pleomorphic
adenoma gene 1; IGF2, insulin-like growth factor-2; IGF1R,
insulin-like growth factor 1 receptor; IRS1, insulin receptor
substrate 1; si, small interfering RNA; NC, negative control. |
Silencing of PLAG1 suppresses
proliferation, migration, invasion and cisplatin resistance in OC
cells via downregulation of IGF2
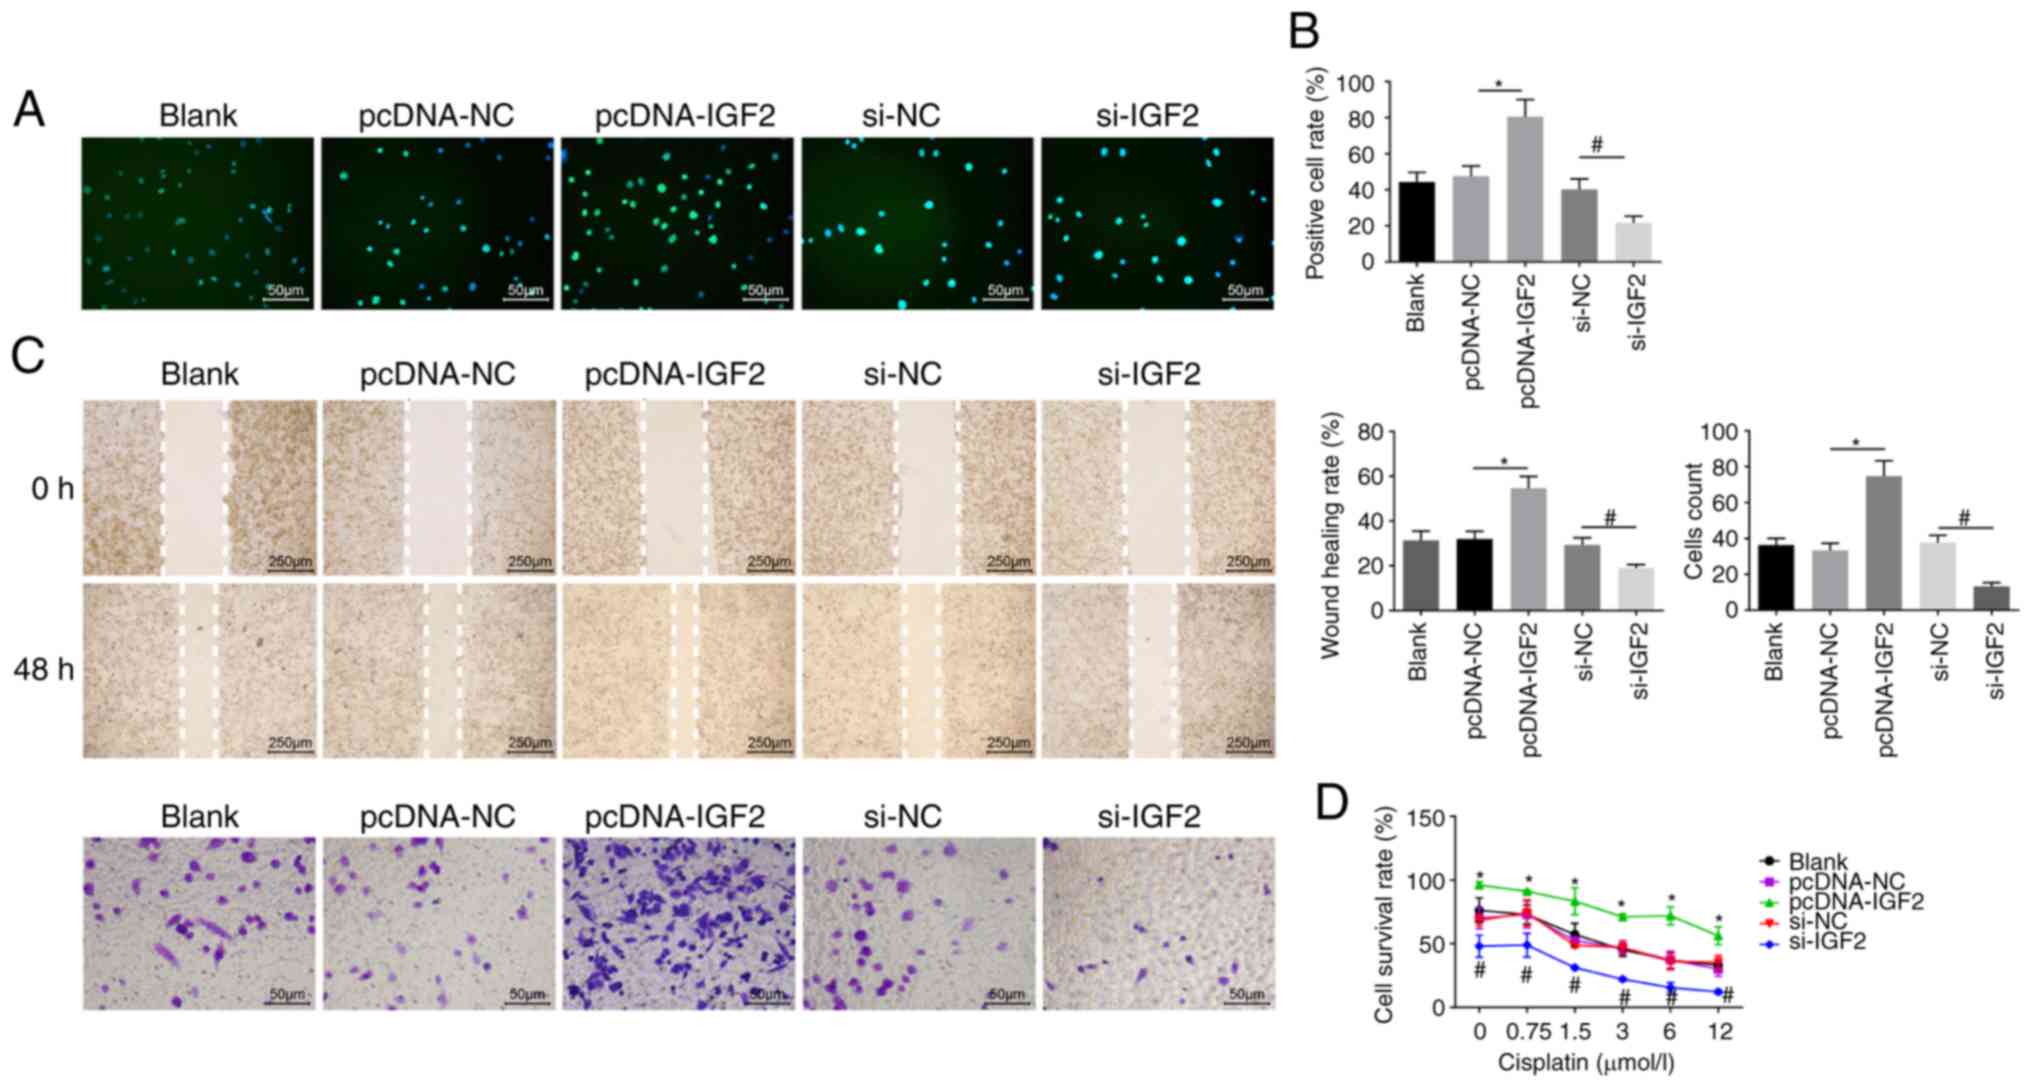
EdU labeling, Transwell assay, scratch test and CCK8
assay were employed to evaluate cell proliferation (Fig. 6A and B), migration, invasion
ability (Fig. 6C) and resistance
to cisplatin (Fig. 6D),
respectively. It was noted that no obvious differences in
proliferation, migration and invasion ability, as well as
resistance to cisplatin were displayed among the pcDNA-NC and si-NC
groups (P>0.05). Compared with the pcDNA-NC group, the number of
EdU-positive cells and the invasion and migration ability were
elevated in the pcDNA-IGF2 group, accompanied by enhanced
resistance to cisplatin in a dose-dependent manner (P<0.05).
However, compared with the si-NC group, a significant decrease was
found in the number of EdU-positive cells and in the invasion and
migration ability in the si-IGF2 group, where resistance to
cisplatin was decreased in a dose-dependent manner (P<0.05).
These results revealed that IGF2 silencing was associated with
reducing OC cell proliferation, migration, invasion and drug
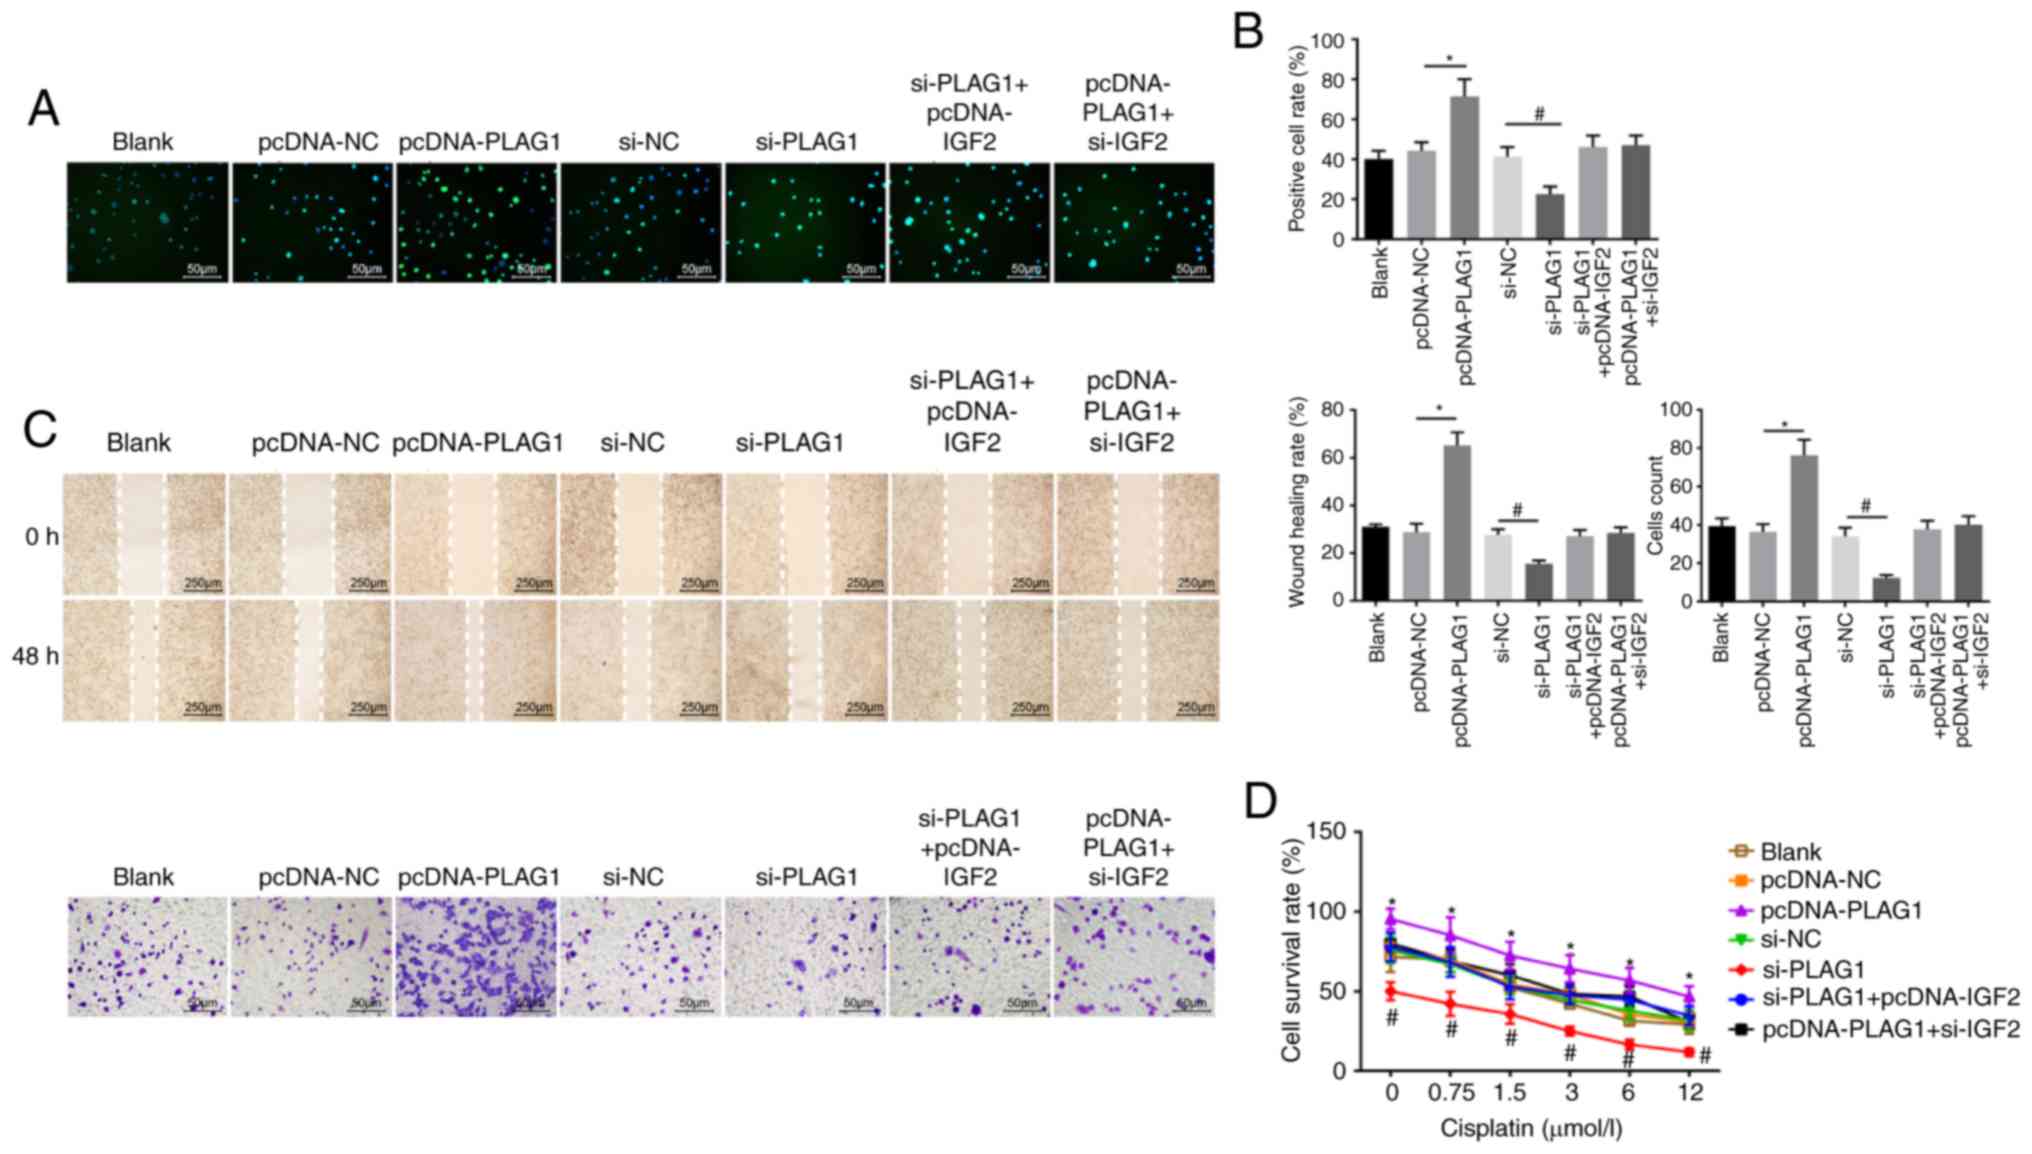
resistance. In order to determine the role of PLAG1 in OC cellular
processes, cell proliferation (Fig.
7A and B), migration, invasion (Fig. 7C) and drug resistance (Fig. 7D) were assessed. The number of
EdU-positive cells, the invasion and migration ability, and
resistance to cisplatin were increased in the pcDNA-PLAG1 group
compared with the pcDNA-NC group (P<0.05). Moreover, silencing
of PLAG1 reversed these observed effects for A2780 overexpressing
PLAG1 as suggested by the number of EdU-positive cells, the
invasion and migration ability, and resistance to cisplatin.
Results of the si-IGF2 + pcDNA-PLAG1 group were similar to the
results for the si-PLAG1 + pcDNA-IGF2 group. Based on these
results, we conclude that PLAG1 silencing reduced OC cell
proliferation, migration, invasion and drug resistance by
potentially affecting IGF2.
Discussion
OC, a heterogeneous group of malignant neoplasms,
causes high mortality in females despite considerable progress in
new cytotoxic drugs and targeted biologic agents (36-38). Metastasis is responsible for OC
recurrence, and recurrent OC tumors are more aggressive and acquire
resistance to conventional chemotherapeutic drugs (39,40). Herein, we selected OC tissues and
cells to elucidate the mechanism of PLAG1 regulation on the
IGF2/IGF1R/IRS1 signaling pathway in OC and to investigate the
underlying molecular alterations. In our study, gain- and
loss-of-function assays demonstrated that the siRNA-mediated
silencing of PLAG1 led to decreased migration, invasion capacity
and cisplatin resistance; suggesting that the expression of PLAG1
may be associated with OC cell motility.
PLAG1 has been reported to be associated with the
development of various malignant tumors, such as lung cancer
(41) and chronic lymphoblastic
leukemia (42). However, its role
in OC has not been reported. We explored the expression and
biological function of PLAG1 in OC. Through in vitro cell
phenotypic experiments, it is suggested that PLAG1 functions as an
oncogene. The oncogenic capacity of the PLAG1 gene has been
previously demonstrated by in vivo/vitro approaches
(43,44). PLAG1 is usually overexpressed in
PLA of the salivary gland due to fusion genes, including
CTNNB1-PLAG1, with promoter swapping caused by chromosomal
aberrations (11).
Hypermethylation of the putative imprinting center region in OC
shares an association with PLA gene like-1 (PLAGL1) expression
levels (45). Sekiya et al
(46) demonstrated that a PLAGL2
and PLAG1 structure- and function-associated family member induced
activation of ras homolog family member A in OC cells, resulting in
promoted organization of actin stress fibers and focal adhesions
(47). It should be noted that
the knockdown of PLAGL2 inhibited cell migration and invasion in
breast cancer (48), which agrees
with our results.
As a genuine transcription factor, PLAG1-encoded
protein recognizes a specific bipartite DNA sequence motif and
activates a variety of target genes in the IGF signaling pathway
(49). Western blot analysis in
the present study showed that PLAG1 modulated the expression of
IGF2 and its associated proteins, IGF1R and IRS1. Furthermore, we
confirmed that PLAG1 regulated the expression of IGF1R/IRS, thus
promoting carcinogenesis in an IGF2-dependent manner. The fetal
transcription factor PLAG1 was observed to be upregulated in
cancers and has been indicated to bind to the IGF2 P3 promoter and
to activate the IGF2 gene (50).
Wang et al (51) employed
a signal transduction microarray-based method to show that PLAG1
restoration is closely associated with IGF2 expression changes in
transgenic mice. PLAG1 knockout mice and paternal IGF2-LOSS mice
shared similar phenotypes, featured by intrauterine and postnatal
growth retardation (35). IGF2 is
considered as an unfavorable indicator of OC prognosis (52). IGF2 transcription from P3 and P4
promoters have a negative association with the survival of OC
patients (53). IGF1 has been
reported to exert a bystander effect for cisplatin resistance in
various OC cells (54), which has
been validated in the A2780 cell line. PLAG1, as an upstream
regulator of IGF2, is resistant to cisplatin and may be developed
as a new target for OC. Therefore, we explored the effect of PLAG1
on cisplatin resistance, and we found that PLAG1 conferred
resistance to cisplatin. Taken together, our results suggest that
PLAG1 may be a new therapeutic target in OC.
In conclusion, we found the abnormal expression of
PLAG1 in several public databases. In addition, to verify the
differential expression of PLAG1, we collected OC samples at
different disease stages to obtain a more representative result. In
the course of the study, we noted that different subtypes of OC
have different prognoses. We did not use different cell lines for
different subtypes of OC, which is one of the limitations of this
study and further studies may be performed in the future. Moreover,
future study may be investigated the mediators of the IGF1R
signaling pathway to further explore whether PLAG1 directly causes
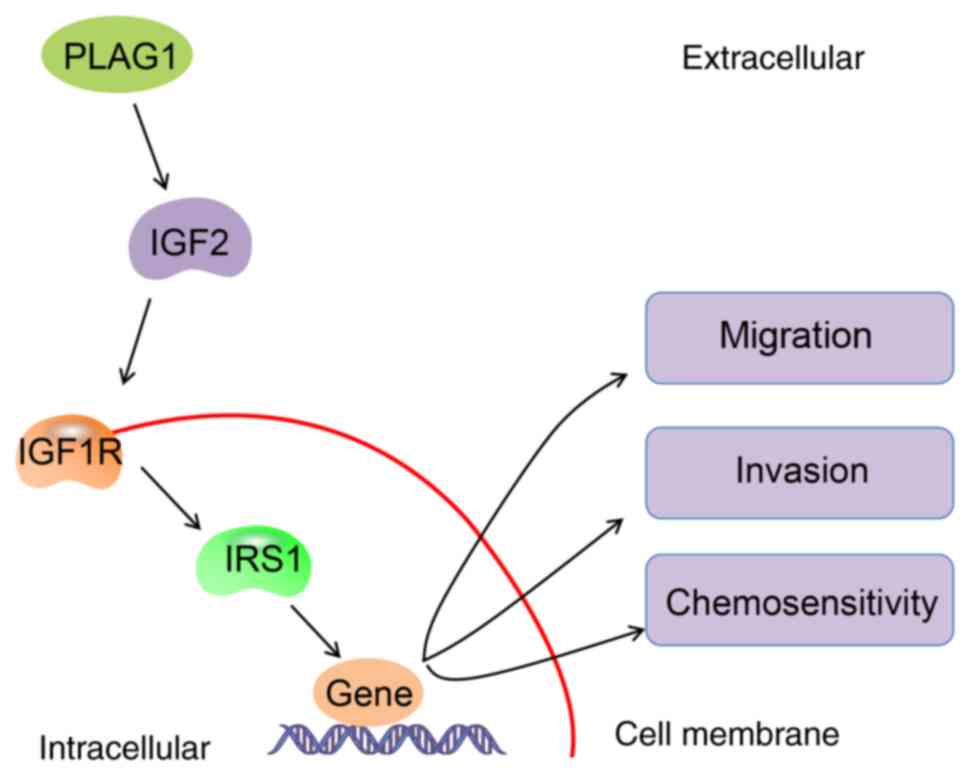
sensitivity to cisplatin. Nevertheless, the key findings of our
study presented significant evidence that PLAG1 was an oncogene in
OC, and the knockdown of PLAG1 inhibited the metastatic potential
of OC cells and sensitized OC cells to cisplatin by inactivating
the IGF2/IGF1R/IRS1 signaling pathway (Fig. 8). These findings provide novel
opportunities for PLAG1 as a potential therapeutic target in
clinical settings. The repression of PLAG1 may reduce resistance of
OC cells to chemotherapeutics, which may be of great clinical use
in identifying effective therapeutic strategies for patients with
OC.
Supplementary Data
Funding
No funding was received.
Availability of data and materials
The data sets used and/or analyzed during the
present study are available from the corresponding author on
reasonable request.
Authors' contributions
WH and BRL designed the study. HF, WH and BRL
collated the data, performed analyses and prepared the manuscript.
All authors have read and approved the final submitted
manuscript.
Ethics approval and consent to
participate
All patients enrolled in the study signed informed
consent documentation. All experimental procedures were conducted
under the approval of the Clinical Experiment Ethics Committee of
Hunan Provincial People's Hospital (The First Affiliated Hospital
of Hunan Normal University; Changsha, China).
Patient consent for publication
Not applicable.
Competing interests
The authors declare that they have no competing
interests.
Acknowledgments
Not applicable.
References
|
1
|
Foster R, Buckanovich RJ and Rueda BR:
Ovarian cancer stem cells: Working towards the root of stemness.
Cancer Lett. 338:147–157. 2013. View Article : Google Scholar
|
|
2
|
Razi S, Ghoncheh M, Mohammadian-Hafshejani
A, Aziznejhad H, Mohammadian M and Salehiniya H: The incidence and
mortality of ovarian cancer and their relationship with the Human
Development Index in Asia. Ecancermedicalscience. 10:6282016.
View Article : Google Scholar : PubMed/NCBI
|
|
3
|
Mitra T, Prasad P, Mukherjee P, Chaudhuri
SR, Chatterji U and Roy SS: Stemness and chemoresistance are
imparted to the OC cells through TGFβ1 driven EMT. J Cell Biochem.
119:5775–5787. 2018. View Article : Google Scholar : PubMed/NCBI
|
|
4
|
Manchanda R and Menon U: Setting the
threshold for surgical prevention in women at increased risk of
ovarian cancer. Int J Gynecol Cancer. 28:34–42. 2018. View Article : Google Scholar
|
|
5
|
Di Donato V, Kontopantelis E, Aletti G,
Casorelli A, Piacenti I, Bogani G, Lecce F and Benedetti Panici P:
Trends in mortality after primary cytoreductive surgery for ovarian
cancer: A systematic review and metaregression of randomized
clinical trials and observational studies. Ann Surg Oncol.
24:1688–1697. 2017. View Article : Google Scholar
|
|
6
|
Abu Hassaan SO: Monitoring ovarian cancer
patients during chemotherapy and follow-up with the serum tumor
marker CA125. Dan Med J. 65:2018.PubMed/NCBI
|
|
7
|
Xu W, He H, Zheng L, Xu JW, Lei CZ, Zhang
GM, Dang RH, Niu H, Qi XL, Chen H and Huang YZ: Detection of 19-bp
deletion within PLAG1 gene and its effect on growth traits in
cattle. Gene. 675:144–149. 2018. View Article : Google Scholar : PubMed/NCBI
|
|
8
|
https://www.genecards.org/cgi-bin/carddisp.pl?gene=PLAG1
|
|
9
|
de Brito BS, Giovanelli N, Egal ES,
Sanchez-Romero C, Nascimento JS, Martins AS, Tincani AJ, Del Negro
A, Gondak RO, Almeida OP, et al: Loss of expression of Plag1 in
malignant transformation from pleomorphic adenoma to carcinoma ex
pleomorphic adenoma. Hum Pathol. 57:152–159. 2016. View Article : Google Scholar : PubMed/NCBI
|
|
10
|
Andreasen S, von Holstein SL, Homøe P and
Heegaard S: Recurrent rearrangements of the PLAG1 and HMGA2 genes
in lacrimal gland pleomorphic adenoma and carcinoma ex pleo-morphic
adenoma. Acta Ophthalmol. 96:e768–e771. 2018. View Article : Google Scholar
|
|
11
|
Matsuyama A, Hisaoka M and Hashimoto H:
PLAG1 expression in mesenchymal tumors: An immunohistochemical
study with special emphasis on the pathogenetical distinction
between soft tissue myoepithelioma and pleomorphic adenoma of the
salivary gland. Pathol Int. 62:1–7. 2012. View Article : Google Scholar
|
|
12
|
Hu ZY, Yuan SX, Yang Y, Zhou WP and Jiang
H: Pleomorphic adenoma gene 1 mediates the role of karyopherin
alpha 2 and has prognostic significance in hepatocellular
carcinoma. J Exp Clin Cancer Res. 33:612014. View Article : Google Scholar : PubMed/NCBI
|
|
13
|
Sun YP, Lu F, Han XY, Ji M, Zhou Y, Zhang
AM, Wang HC, Ma DX and Ji CY: MiR-424 and miR-27a increase TRAIL
sensitivity of acute myeloid leukemia by targeting PLAG1.
Oncotarget. 7:25276–25290. 2016.PubMed/NCBI
|
|
14
|
Xu L, Yin S, Banerjee S, Sarkar F and
Reddy KB: Enhanced anticancer effect of the combination of
cisplatin and TRAIL in triple-negative breast tumor cells. Mol
Cancer Ther. 10:550–557. 2011. View Article : Google Scholar : PubMed/NCBI
|
|
15
|
Gasparian ME, Bychkov ML, Yagolovich AV,
Kirpichnikov MP and Dolgikh DA: The effect of cisplatin on
cytotoxicity of anticancer cytokine TRAIL and its
receptor-selective mutant variant DR5-B1. Dokl Biochem
Biophys. 477:385–388. 2017. View Article : Google Scholar
|
|
16
|
Qian B, Katsaros D, Lu L, Canuto EM,
Benedetto C, Beeghly-Fadiel A and Yu H: IGF-II promoter specific
methylation and expression in epithelial ovarian cancer and their
associations with disease characteristics. Oncol Rep. 25:203–213.
2011.
|
|
17
|
Zhuang M, Shi Q, Zhang X, Ding Y, Shan L,
Shan X, Qian J, Zhou X, Huang Z, Zhu W, et al: Involvement of
miR-143 in cisplatin resistance of gastric cancer cells via
targeting IGF1R and BCL2. Tumour Biol. 36:2737–2745. 2015.
View Article : Google Scholar
|
|
18
|
Knowlden JM, Gee JM, Barrow D, Robertson
JF, Ellis IO, Nicholson RI and Hutcheson IR: erbB3 recruitment of
insulin receptor substrate 1 modulates insulin-like growth factor
receptor signalling in oestrogen receptor-positive breast cancer
cell lines. Breast Cancer Res. 13:R932011. View Article : Google Scholar : PubMed/NCBI
|
|
19
|
Ding YC, McGuffog L, Healey S, Friedman E,
Laitman Y, Paluch-Shimon S, Kaufman B; SWE-BRCA; Liljegren A,
Lindblom A, et al: A nonsynonymous polymorphism in IRS1 modifies
risk of developing breast and ovarian cancers in BRCA1 and ovarian
cancer in BRCA2 mutation carriers. Cancer Epidemiol Biomarkers
Prev. 21:1362–1370. 2012. View Article : Google Scholar : PubMed/NCBI
|
|
20
|
Yang M, Shan X, Zhou X, Qiu T, Zhu W, Ding
Y, Shu Y and Liu P: miR-1271 regulates cisplatin resistance of
human gastric cancer cell lines by targeting IGF1R, IRS1, mTOR, and
BCL2. Anticancer Agents Med Chem. 14:884–891. 2014. View Article : Google Scholar : PubMed/NCBI
|
|
21
|
Bardou P, Mariette J, Escudié F, Djemiel C
and Klopp C: Jvenn: An interactive Venn diagram viewer. BMC
Bioinformatics. 15:2932014. View Article : Google Scholar : PubMed/NCBI
|
|
22
|
Piñero J, Bravo À, Queralt-Rosinach N,
Gutiérrez-Sacristán A, Deu-Pons J, Centeno E, García-García J, Sanz
F and Furlong LI: DisGeNET: A comprehensive platform integrating
information on human disease-associated genes and variants. Nucleic
Acids Res. 45:D833–D839. 2017. View Article : Google Scholar :
|
|
23
|
Szklarczyk D, Franceschini A, Wyder S,
Forslund K, Heller D, Huerta-Cepas J, Simonovic M, Roth A, Santos
A, Tsafou KP, et al: STRING v10: Protein-protein interaction
networks, integrated over the tree of life. Nucleic Acids Res.
43:D447–D452. 2015. View Article : Google Scholar
|
|
24
|
Shannon P, Markiel A, Ozier O, Baliga NS,
Wang JT, Ramage D, Amin N, Schwikowski B and Ideker T: Cytoscape: A
software environment for integrated models of biomolecular
interaction networks. Genome Res. 13:2498–2504. 2003. View Article : Google Scholar : PubMed/NCBI
|
|
25
|
Chang SJ, Bristow RE and Ryu HS: Analysis
of paraaortic lymphadenectomy up to the level of the renal vessels
in apparent early-stage ovarian cancer. J Gynecol Oncol. 24:29–36.
2013. View Article : Google Scholar : PubMed/NCBI
|
|
26
|
Tuo YL, Li XM and Luo J: Long noncoding
RNA UCA1 modulates breast cancer cell growth and apoptosis through
decreasing tumor suppressive miR-143. Eur Rev Med Pharmacol Sci.
19:3403–3411. 2015.PubMed/NCBI
|
|
27
|
Tayama S, Motohara T, Narantuya D, Li C,
Fujimoto K, Sakaguchi I, Tashiro H, Saya H, Nagano O and Katabuchi
H: The impact of EpCAM expression on response to chemotherapy and
clinical outcomes in patients with epithelial ovarian cancer.
Oncotarget. 8:44312–44325. 2017. View Article : Google Scholar : PubMed/NCBI
|
|
28
|
Zheng J, Zhao S, Yu X, Huang S and Liu HY:
Simultaneous targeting of CD44 and EpCAM with a bispecific aptamer
effectively inhibits intraperitoneal ovarian cancer growth.
Theranostics. 7:1373–1388. 2017. View Article : Google Scholar : PubMed/NCBI
|
|
29
|
Quinn MC, Filali-Mouhim A, Provencher DM,
Mes-Masson AM and Tonin PN: Reprogramming of the transcriptome in a
novel chromosome 3 transfer tumor suppressor ovarian cancer cell
line model affected molecular networks that are characteristic of
ovarian cancer. Mol Carcinog. 48:648–661. 2009. View Article : Google Scholar : PubMed/NCBI
|
|
30
|
Shigemasa K, Hu C, West CM, Clarke J,
Parham GP, Parmley TH, Korourian S, Baker VV and O'Brien TJ: p16
overexpression: A potential early indicator of transformation in
ovarian carcinoma. J Soc Gynecol Investig. 4:95–102.
1997.PubMed/NCBI
|
|
31
|
Toyama A, Suzuki A, Shimada T, Aoki C,
Aoki Y, Umino Y, Nakamura Y, Aoki D and Sato TA: Proteomic
characterization of ovarian cancers identifying annexin-A4,
phosphoserine amino-transferase, cellular retinoic acid-binding
protein 2, and serpin B5 as histology-specific biomarkers. Cancer
Sci. 103:747–755. 2012. View Article : Google Scholar : PubMed/NCBI
|
|
32
|
Cho H, Kang ES, Hong SW, Oh YJ, Choi SM,
Kim SW, Kim SH, Kim YT, Lee KS, Choi YK and Kim JH: Genomic and
proteomic characterization of YDOV-157, a newly established human
epithelial ovarian cancer cell line. Mol Cell Biochem. 319:189–201.
2008. View Article : Google Scholar : PubMed/NCBI
|
|
33
|
Dong Y, Li J, Han F, Chen H, Zhao X, Qin
Q, Shi R and Liu J: High IGF2 expression is associated with poor
clinical outcome in human ovarian cancer. Oncol Rep. 34:936–942.
2015. View Article : Google Scholar : PubMed/NCBI
|
|
34
|
Liefers-Visser JAL, Meijering RAM, Reyners
AKL, van der Zee AGJ and de Jong S: IGF system targeted therapy:
Therapeutic opportunities for ovarian cancer. Cancer Treat Rev.
60:90–99. 2017. View Article : Google Scholar : PubMed/NCBI
|
|
35
|
Abi Habib W, Brioude F, Edouard T, Bennett
JT, Lienhardt-Roussie A, Tixier F, Salem J, Yuen T, Azzi S, Le Bouc
Y, et al: Genetic disruption of the oncogenic HMGA2-PLAG1-IGF2
pathway causes fetal growth restriction. Genet Med. 20:250–258.
2018. View Article : Google Scholar
|
|
36
|
Zou Y, Wang F, Liu FY, Huang MZ, Li W,
Yuan XQ, Huang OP and He M: RNF43 mutations are recurrent in
Chinese patients with mucinous ovarian carcinoma but absent in
other subtypes of ovarian cancer. Gene. 531:112–116. 2013.
View Article : Google Scholar : PubMed/NCBI
|
|
37
|
Abramov Y, Carmi S, Anteby SO and Ringel
I: Characterization of ovarian cancer cell metabolism and response
to chemotherapy by (31)p magnetic resonance spectroscopy. Oncol
Res. 20:529–536. 2013. View Article : Google Scholar : PubMed/NCBI
|
|
38
|
Karki R, Seagle BL, Nieves-Neira W and
Shahabi S: Taxanes in combination with biologic agents for ovarian
and breast cancers. Anticancer Drugs. 25:536–554. 2014. View Article : Google Scholar
|
|
39
|
Wang W, Ren F, Wu Q, Jiang D, Li H, Peng
Z, Wang J and Shi H: MicroRNA-497 inhibition of ovarian cancer cell
migration and invasion through targeting of SMAD specific E3
ubiquitin protein ligase 1. Biochem Biophys Res Commun.
449:432–437. 2014. View Article : Google Scholar : PubMed/NCBI
|
|
40
|
Li C, Ding H, Tian J, Wu L, Wang Y, Xing Y
and Chen M: Forkhead box protein C2 (FOXC2) promotes the resistance
of human ovarian cancer cells to cisplatin in vitro and in vivo.
Cell Physiol Biochem. 39:242–252. 2016. View Article : Google Scholar : PubMed/NCBI
|
|
41
|
Jin L, Chun J, Pan C, Kumar A, Zhang G, Ha
Y, Li D, Alesi GN, Kang Y, Zhou L, et al: The PLAG1-GDH1 axis
promotes anoikis resistance and tumor metastasis through
CamKK2-AMPK signaling in LKB1-deficient lung cancer. Mol Cell.
69:87.e7–99.e7. 2018. View Article : Google Scholar
|
|
42
|
Pallasch CP, Patz M, Park YJ, Hagist S,
Eggle D, Claus R, Debey-Pascher S, Schulz A, Frenzel LP, Claasen J,
et al: miRNA deregulation by epigenetic silencing disrupts
suppression of the oncogene PLAG1 in chronic lymphocytic leukemia.
Blood. 114:3255–3264. 2009. View Article : Google Scholar : PubMed/NCBI
|
|
43
|
Van Dyck F, Scroyen I, Declercq J, Sciot
R, Kahn B, Lijnen R and Van de Ven WJ: aP2-Cre-mediated expression
activation of an oncogenic PLAG1 transgene results in cavernous
angiomatosis in mice. Int J Oncol. 32:33–40. 2008.
|
|
44
|
Declercq J, Van Dyck F, Braem CV, Van
Valckenborgh IC, Voz M, Wassef M, Schoonjans L, Van Damme B, Fiette
L and Van de Ven WJ: Salivary gland tumors in transgenic mice with
targeted PLAG1 proto-oncogene overexpression. Cancer Res.
65:4544–4553. 2005. View Article : Google Scholar : PubMed/NCBI
|
|
45
|
Arima T and Wake N: Establishment of the
primary imprint of the HYMAI/PLAGL1 imprint control region during
oogenesis. Cytogenet Genome Res. 113:247–252. 2006. View Article : Google Scholar : PubMed/NCBI
|
|
46
|
Sekiya R, Maeda M, Yuan H, Asano E, Hyodo
T, Hasegawa H, Ito S, Shibata K, Hamaguchi M, Kikkawa F, et al:
PLAGL2 regulates actin cytoskeletal architecture and cell
migration. Carcinogenesis. 35:1993–2001. 2014. View Article : Google Scholar : PubMed/NCBI
|
|
47
|
Van Dyck F, Declercq J, Braem CV and Van
de Ven WJ: PLAG1, the prototype of the PLAG gene family:
Versatility in tumour development (Review). Int J Oncol.
30:765–774. 2007.PubMed/NCBI
|
|
48
|
Xu B, Zhang X, Wang S and Shi B: MiR-449a
suppresses cell migration and invasion by targeting PLAGL2 in
breast cancer. Pathol Res Pract. 214:790–795. 2018. View Article : Google Scholar : PubMed/NCBI
|
|
49
|
Zhu J, Declercq J, Willekens K, Creemers
J, Vermorken AJM and de Ven WJV: Abstract 1981: Interference of the
polyphenolic compound curcumin with expression regulation of target
genes of the PLAG1 oncogenic transcription factor. Cancer Res.
72:19812012.
|
|
50
|
Akhtar M, Holmgren C, Göndör A, Vesterlund
M, Kanduri C, Larsson C and Ekström TJ: Cell type and
context-specific function of PLAG1 for IGF2 P3 promoter activity.
Int J Oncol. 41:1959–1966. 2012. View Article : Google Scholar : PubMed/NCBI
|
|
51
|
Wang Y, Shang W, Lei X, Shen S, Zhang H,
Wang Z, Huang L, Yu Z, Ong H, Yin X, et al: Opposing functions of
PLAG1 in pleomorphic adenoma: A microarray analysis of PLAG1
transgenic mice. Biotechnol Lett. 35:1377–1385. 2013. View Article : Google Scholar : PubMed/NCBI
|
|
52
|
Lu L, Katsaros D, de la Longrais IA,
Sochirca O and Yu H: Hypermethylation of let-7a-3 in epithelial
ovarian cancer is associated with low insulin-like growth factor-II
expression and favorable prognosis. Cancer Res. 67:10117–10122.
2007. View Article : Google Scholar : PubMed/NCBI
|
|
53
|
Lu L, Katsaros D, Wiley A, Rigault de la
Longrais IA, Puopolo M, Schwartz P and Yu H: Promoter-specific
transcription of insulin-like growth factor-II in epithelial
ovarian cancer. Gynecol Oncol. 103:990–995. 2006. View Article : Google Scholar : PubMed/NCBI
|
|
54
|
Eckstein N, Servan K, Hildebrandt B,
Pölitz A, von Jonquières G, Wolf-Kümmeth S, Napierski I, Hamacher
A, Kassack MU, Budczies J, et al: Hyperactivation of the
insulin-like growth factor receptor I signaling pathway is an
essential event for cisplatin resistance of ovarian cancer cells.
Cancer Res. 69:2996–3003. 2009. View Article : Google Scholar : PubMed/NCBI
|