Introduction
Uric acid is the product of purine metabolism in
animals (1). Some animals
decompose uric acid into allantoin by uricase and expel it from
body. However, due to the lack of the uricase gene, the product of
purine metabolism is excreted by humans in form of uric acid
(2,3). Therefore, serum uric acid (SUA) is
maintained at a high level in humans. When normal human purine
metabolism is disrupted, the production and excretion of uric acid
in the body are dysregulated, leading to hyperuricemia (4). The clinical diagnostic criteria for
hyperuricemia are SUA >420 μmol/l in males and SUA >360
μmol/l in females (5). Recent
studies have shown that following changes to the structure of the
human diet, the incidence of hyperuricemia in the world is
increasing (6–8), and the age of onset of hyperuricemia
is decreasing (9,10).
It has been demonstrated that hyperuricemia is not
only a risk factor for gout and chronic kidney disease, but also a
risk factor for hypertension, hyperlipidemia, diabetes and
cardiovascular disease, which are conditions that seriously affects
human health (11–17). Therefore, xanthine oxidase
inhibitors are commonly used in clinical practice to inhibit the
synthesis of uric acid (18,19), but the effect is not as good as
expected and has serious side effects (20–23). It was observed from previous
studies that approximately two-thirds of uric acid in the human
body is excreted by the kidneys, and one-third is excreted by
intestinal microorganisms following degradation (24–28). Due to the limited water-solubility
of uric acid, increasing the level of uric acid excretion in the
kidneys will increase the burden on the organ and lead to renal
diseases (29,30). Furthermore, recombinant uricase
has been used to convert uric acid into allantoin in the human body
in order to decrease the levels of uric acid, but its clinical
application is limited due to its side effects, including
immunogenicity of heterologous proteins (31,32). Therefore, increasing the excretion
of uric acid through the intestine has become an alternative
treatment strategy. In the present study, genetically engineered
bacteria containing a recombinant uricase gene that could be
expressed extracellularly without induction were constructed. The
uricase secreted by the engineered bacteria in the intestinal
tissues of a hyperuricemia rat model served a role in decreasing
the levels of uric acid. The present study aimed to identify new
methods for the treatment of hyperuricemia.
Materials and methods
Ethics statement
In the present study, all the experimental protocols
involving animals approved by the Ethics Committee of Chongqing
Medical University.
Vectors, bacterial strains and growth
conditions
The plasmid containing the gene of staphylococcal
protein A (spa) and uricase (UOX), pET-28a-sUOX (accession no.
D32043.1) (33–36), was preserved by the Department of
Biochemistry and Molecular Biology, Chongqing Medical University,
and the plasmid was purchased from Beijing Beina Chuanglian
Biotechnology Research Institute. The pMG36e vector was purchased
from the Suzhou Bei Na Chuanglian Biological Corporation. The pUC57
vector containing the S-layer protein signal peptide gene (spo)
(accession no. Z14250.1) of Lactobacillus brevis was
purchased from the Chengdu Qingke Zixi Biological Company. In this
study, Escherichia coli DH5α and BL-21 cells were used for
cloning and expression, respectively, which were grown in LB medium
(Beijing Dingguo Changsheng Biotechnology Co., Ltd.) broth
containing 200 μg/ml erythromycin incubated at 37°C with 200 r/min
rotation. Restriction enzymes XbaI, HindIII,
SalI and T4 ligase and polymerase chain reaction (PCR) kit
(catalog no. R060A) were purchased from Takara Biotechnology Co.,
Ltd.
Construction of recombinant plasmids
pMG36e-sUOX and pMG36e-spo-uox
UOX and sUOX gene primers were designed by Primer
5.0 software (Premier Software, Inc.) using the UOX and sUOX
sequences in the pET-28a-sUOX vector as templates and the
corresponding restriction sites and protection base sequences were
added to the primers. The primers were synthesized by Shanghai
Shenggong Biological Engineering Co., Ltd. The sequences of primer
are listed in Table I. The vector
pet-28a-sUOX was used as a template, and corresponding target genes
were amplified by PCR using primers OUX-forward (f), UOX-reverse
(r), sUOX-f, sUOX-r and high-fidelity rTaq DNA polymerase (Takara
Biotechnology Co., Ltd.). The PCR reaction conditions were as
follows: Pre-denaturation at 94°C for 10 min, followed by 32 cycles
of 94°C for 1 min, 60°C for 30 sec and 72°C for 2 min, and final
extension for 10 min at 72°C. PCR products, and the pUC57
(containing the spo signal peptide) and pMG36e vectors were double
digested with the corresponding restriction enzymes: The sUOX
fragment and pMG36e vector were digested with restriction
endonucleases XbaI and HindIII, respectively. Both
ends of the UOX fragment were digested with SalI and
HindIII. The spo fragment was digested with restriction
endonucleases XbaI and SalI, and then ligated by T4
ligase. Next, the recombinant plasmids were introduced into E.
coli DH5α and BL-21 cells. Then, these bacteria were spread
onto LB agar plates containing erythromycin. Following successful
culture, single colonies were selected and grown in LB liquid
medium containing erythromycin.
 | Table ITarget gene primer sequences. |
Table I
Target gene primer sequences.
| Primer | Primer sequence
(5′-3′) | Restriction
sites |
|---|
| UOX-F | GGTCGACATGTCAACAACGCTCTCATCCACC | SalI |
| UOX-R | GCGAAGCTTTTAGTGGTGGTGGTGGTGGTGCAACTTG | HindIII |
| sUOX-F | CGTCTAGAATGACTTTACAAATACATACAGGGGGTATTAATTTGAAAAAG | XbaI |
| sUOX-R |
ATAAAGCTTTTAGTGGTGGTGGTGGTGGTG | HindIII |
Secretion and expression of uricase
Positive clones were selected and grown in LB medium
containing 200 μg/ml erythromycin, and incubated at 37°C with 200
r/min for 12 h. The bacterial solution was used to inoculate the LB
medium at a ratio of 1:20 at 37°C for 200 r/min. Following
agitation for 3, 6, 9 and 12 h, the supernatant of the bacterial
solution was collected after centrifugation (4,000 × g, 15 min) at
4°C and concentrated by polyethylene glycol. The protein
concentration was detected using the Bradford protein detection kit
(Beyotime Institute of Biotechnology; cat. no. P0006). The steps
were as follows: 10 μl protein standard was diluted by 0.9% NaCl to
a concentration of 0.5 mg/ml. Subsequently, 0, 1, 2, 4, 8, 12, 16
or 20 μl of the protein standard was added to the standard wells of
a 96-well plate, and then the standard dilution was added to make
up to 20 μl. The sample (10 μl) was added to the sample wells of
the 96-well plate and then made up to 20 μl with standard dilution.
Then, 200 μl coomassie blue g-250 staining solution was added to
each well, placed at room temperature for 5 min, and the absorbance
was detected at 595 nm. Finally, the protein concentration in the
samples was calculated according to the standard curve. The optimal
protein expression time was determined by 10% SDS-PAGE analysis
with 40 μg protein loaded per lane. Coomassie G-250 dye solution
purchased from Beyotime Institute of Biotechnology was used for
visualization at room temperature for 1 h.
The activity of uricase was determined, and the unit
of activity of the enzyme was defined as: The amount of enzyme
required to catalyze the decomposition of 1 μmol of uric acid per
min at 40°C and pH 8.5. The protein content was determined using a
Bradford assay.
Application of engineered bacteria in a
rat model Establishment of rat model of hyperuricemia and
administration of engineered bacteria
A total of 50 male SPF-grade Sprague-Dawley (SD)
rats were purchased from the Animal Experimental Center of
Chongqing Medical University. The rats were maintained at 24±2°C,
50–70% humidity and a 12 h light: Dark cycle (8:00 a.m.–8:00 p.m.).
Rats were divided into the following 5 groups by random:
Recombinant uricase-expressing genetically engineered E.
coli bacteria group (E36eu); empty vector-expressing engineered
E. coli bacteria group (E36e); E. coli group (E);
carboxymethylcellulose suspension group (NS); and blank control
(Con) group. The Con group was fed with water, the rats in the
other groups were fed with 5% fructose and injected
intraperitoneally with oteracil potassium (100 mg/kg/day) twice
daily for 8 weeks to maintain a high uric acid state, as described
previously (37–43). During the entire experiment, all
rats were fed standard rat chow and were given ad libitum
access to water.
The suspension of engineered bacteria (bacterial
solution concentration of 0.02 g/ml) was made from
carboxymethylcellulose solution. An total of 5 ml/kg/day was
administered via intragastric gavage at 2:00 p.m. every day to the
E36eu group (carboxymethylcellulose suspension administered with
recombinant uricase E. coli genetically engineered
bacteria), E36e group (carboxymethylcellulose suspension
administered with empty vector E. coli engineered bacteria),
E group (carboxymethylcellulose suspension administered with E.
coli) and NS group (carboxymethylcellulose suspension).
Collection and processing of samples
During the experiment, the water consumption, food
intake and body weight of rats were measured daily. After fasting
rats for 12 h, at 8:00 a.m. every Sunday, 0.5–1.0 ml of blood was
collected by tail cutting, and serum was collected by
centrifugation (1,000 × g, 10 min) at 4°C.
i) Measurement of SUA levels. SUA levels were
determined by enzyme colorimetry. The uric acid detection kit was
purchased from Nanjing Jiancheng Technology Co., Ltd (cat. no.
C012). The principle of measuring uric acid is that, in the
protein-free filtrate, uric acid reduces phosphotungstic acid to
generate tungsten blue, allantoin and carbon dioxide in the
alkaline state. The shade of blue coloring is directly proportional
to the concentration of uric acid. The kit was used as follows: A
total of 0.2 ml serum, uric acid standard application solution and
distilled water were added to the test tube, standard tube and
blank tube respectively. Then, 2 ml tungstate protein precipitator
was added to the 3 tubes. The fully mixed solutions were allowed to
stand for 10 min, and then centrifuged at 1,000 × g for 5 min at
4°C. Following removal of 1.6 ml supernatant from each tube, 0.5 ml
sodium tungstate reagent and phosphotungstic acid reagent were
added to each tube, and the solutions were mixed well. After 10
min, the absorbance value of each tube was measured at a wavelength
of 690 nm with 1 cm light diameter. A blank tube was used to
calibrate the machine. Finally, the values of SUA were calculated
according to the formula: SUA=OD of the test tube/(OD of the
standard tube × content of the standard substance). At the end of
the experiment, blood samples from the rats were used to coat
slides. At room temperature, 0.5 ml Wright’s stain was added to the
slides for 1 min, and then 1 ml buffer was added to mix with the
Wright’s stain for 5 min. Finally, the dyeing solution was washed
away by running water. Subsequently, the cells on each slide were
observed at magnification, ×40, and images were captured at a
magnification, ×400 from three different field of view, and
eosinophil counts were performed.
ii) Histology. To obtain tissue samples for further
analysis, 4% paraformaldehyde was injected into the heart of
anesthetized rats (IP, 40 mg/kg sodium pentobarbital). Following
perfusion, small intestine tissues were extracted, fixed in 4%
paraformaldehyde at 4°C for 24 h, and sectioned to 5 μm. At room
temperature, paraffin sections were dewaxed with pure xylene (twice
for 5 min each), and then washed with distilled water following
rehydration using high concentration to low concentration alcohol
(anhydrous ethanol, twice for 5 min each; 95% alcohol, 80% alcohol,
70% alcohol, each time for 5 min). The slides were then stained
using hematoxylin for 5 min at room temperature. Color separation
was then conducted using acidic and ammonia solutions (1%
hydrochloric acid alcohol solution, 15 sec; 0.6% ammonia water, 15
sec). The slides were rinsed with running water and placed in
distilled water for 15 min. The samples were then stained with
eosin for 2 min at room temperature, followed by dehydration with
alcohol (95% alcohol, twice for 5 min each; anhydrous ethanol,
twice for 5 min each) and then treatment with pure xylene (twice
for 5 min each). They were then covered and observed using an
optical microscope (magnification, ×400) and images were
captured.
iii) High-throughput sequencing. The contents of the
small intestine tissues of rats were stored at −80°C, and then
analyzed by Chengdu Lilai Biotechnology Co., Ltd. The methods for
high-throughput sequencing were as follows: The total microbiome
DNA was extracted using the E.Z.N.A.® Stool DNA kit
(cat. no. D4015; Omega Bio-Tek, Inc.), and target fragment
libraries were constructed. The corresponding primers were designed
according to the conserved region in the microbial ribosomal RNA
sequence, and the sequencing universal adapters and sample specific
Barcode sequences were added to the common primers, so as to
amplify the variable region gene (V3+V4) or specific gene fragments
of rDNA by PCR. The PCR amplification products were then detected
by 2% agarose gel electrophoresis and the target fragments were
recovered using the AMPure XT beads recovery kit (cat. no. A63881;
Beckman Coulter, Inc.). A Qubit fluorometer was used to quantify
the purified PCR products, using a cut-off value of >2 nM.
Following gradient dilution of the qualified sequencing libraries,
they were mixed according to the amount required for sequencing,
and then modified into a single chain by NaOH for machine
sequencing. The MiSeq sequencer was used for 2 × 300 bp double-end
sequencing. Finally, bioinformatics analysis was performed.
Bioinformatics analysis included Operational Taxonomic Units (OTU)
cluster analysis, Alpha diversity analysis, Bate analysis and
species analysis. The sequence for OTU cluster analysis was
performed using USEARCH software (https://www.drive5.com/usearch/; version 10.0) based
on 97% sequence similarity. USEARCH software was also used for
Alpha diversity analysis and Beta analysis. Alpha diversity
analysis includes Chao1, Observed_species, Goods_coverage, Shannon
and Simpson index. And Beta diversity analysis and species analysis
were performed based on the results obtained by OTU cluster
analysis. Beta diversity analysis was started by calculating the
distance matrix between environmental samples, which included the
distance between any two samples. The sample distance matrix was
clustered using the Unweighted Pair Group Method with Arithmetic
Mean method (44). The generated
cluster tree data file was imported into the cluster tree viewing
software Figtree (version v1.4.4; http://tree.bio.ed.ac.uk/software/figtree/). Principal
coordinates analysis and clustering analysis were used to decompose
the community data structure naturally, and to observe the
differences between samples by ordinating the samples. Then,
species analysis was performed. RDP (http://rdp.cme.msu.edu/index.jsp) and NT-16S
(http://ftp.ncbi.nlm.nih.gov/blast/db)
databases were used for species classification and subsequent
analysis. According to the OTU annotation results and the OTU
abundance table of each sample, the species abundance tables of
phylum and genera level were obtained, and the species composition
and difference analysis of different groups were performed for
different levels of species abundance table. In the analysis, Blast
(http://blast.ncbi.nlm.nih.gov/Blast.cgi) was used for
classification comparison.
iv) Allantoin ELISA analysis. Fecal excrement from
the rat large intestine tissues was stored in liquid nitrogen for
determination of allantoin levels. A rat allantoin ELISA kit was
purchased from Jiangsu Mei Biao Biological Technology Co., Ltd.
(cat. no. MB-7159A). The stop solution changed the reaction color
from blue to yellow, and the color intensity was measured at 450 nm
using a spectrophotometer. In order to measure the concentration of
allantoin in the sample, the allantoin ELISA kit used included
specific calibration standards. The calibration standards were
assayed concomitantly with the samples, which produced a standard
curve of optical density (OD) vs. allantoin concentration. The
concentration of allantoin in the samples was then determined by
comparing the OD of the samples with the standard curve.
Statistical analysis
Measurement data were expressed as mean ± standard
deviation. The Student’s t-test was used for comparison between the
two groups (Tables II, III, IV, V
and VI). One-way analysis of
variance was used to compare multiple groups (Table VII). If the variances were
equal, Tukey’s post hoc test was used. If the variances were not
equal, Tamhane T2 test was used. GraphPad Prism (GraphPad Software,
Inc.) was used to analyze the data. P<0.05 was considered to
indicate a statistically significant difference.
| Table IIChanges in water consumption in rats
ml/(kg/day). |
Table II
Changes in water consumption in rats
ml/(kg/day).
| Group | Time interval,
weeks |
|---|
|
|---|
| 1 | 2 | 3 | 4 | 5 | 6 | 7 | 8 |
|---|
| E36eu | 132.24±2.24D | 136.0±2.07a | 151.44±3.00a,B,c | 144.29±7.28a | 152.56±9.45 | 154.40±3.50A,d | 143.05±2.39a,c,D | 148.23±1.62A,d |
| E36e | 142.21±2.06c | 140.03±2.05A,c | 141.92±9.02a |
160.22±11.66A | 155.75±2.59a | 161.93±1.37A,B | 153.60±2.59a,c | 156.25±1.93 |
| E | 136.48±2.24 | 145.04±2.64A | 144.48±1.01a | 142.66±2.02a,b | 154.28±6.23 | 157.70±1.56A | 147.87±1.57a | 142.00±2.96 |
| NS | 136.10±1.98 | 136.70±1.94a | 141.06±2.41a | 135.90±2.04a | 153.56±0.54a | 150.17±2.16a | 157.43±7.79A | 147.86±1.72 |
| Con | 119.08±1.11 | 110.99±3.27 | 113.81±4.14 | 115.96±3.10 | 118.33±6.17 | 118.46±1.69 | 117.70±5.85 | 121.81±3.22 |
| Table IIIChanges of food intake in rats
(g/kg/day). |
Table III
Changes of food intake in rats
(g/kg/day).
| Group | Time, weeks |
|---|
|
|---|
| 1 | 2 | 3 | 4 | 5 | 6 | 7 | 8 |
|---|
| E36eu | 73.91±2.43 | 73.26±2.46c | 73.04±1.78d | 71.88±1.10c | 66.46±2.85a | 68.12±1.60 | 66.03±2.13 | 63.26±3.11 |
| E36e | 72.33±1.89 | 67.85±2.11 | 70.14±1.32 | 66.36±2.67 | 73.63±2.79 | 65.29±1.86 | 64.86±1.53 | 62.87±1.59 |
| E | 74.53±1.28 | 70.06±3.48 | 68.58±2.63 | 63.66±2.25a,b | 66.67±2.29a | 65.85±4.51 | 62.38±2.01 | 61.61±2.44 |
| NS | 70.81±2.87 | 72.43±3.00 | 70.14±1.72 | 72.35±1.12a | 64.96±3.13 | 67.47±2.45 | 64.16±3.56 | 62.13±2.59 |
| Con | 74.14±2.76 | 68.91±5.54 | 66.80±1.49 | 66.24±2.14 | 73.69±3.10 | 67.77±3.10 | 62.47±1.39 | 60.37±3.41 |
| Table IVChanges of body weight in rats
(g). |
Table IV
Changes of body weight in rats
(g).
| Group | Time, weeks |
|---|
|
|---|
| 1 | 2 | 3 | 4 | 5 | 6 | 7 | 8 |
|---|
| E36eu | 183.30±2.70 | 212.72±4.51 | 233.80±15.45 | 236.67±4.99 | 278.50±2.36 | 301.33±4.03 | 311.71±4.03B,d | 351.25±4.50D |
| E36e | 184.56±10.88 | 218.69±3.07 | 244.67±8.26 | 265.66±13.10 | 282.16±3.40a | 310.57±7.59 | 326.68±2.6B | 333.76±4.49b |
| E | 182.90±13.16 | 207.37±19.26 | 241.77±18.28 | 258.03±8.60 | 272.24±4.03a | 294.28±3.86 | 317.29±7.85b | 326.49±5.56a,b |
| NS | 175.17±14.48 | 208.67±4.11a | 233.23±11.15 | 254.43±9.46 | 278.67±7.36 | 312.87±20.17 | 334.51±3.40 | 351.19±4.19a |
| Con | 188.20±8.74 | 224.68±8.60 | 249.00±12.33 | 278.35±15.17 | 297.09±5.89 | 305.69±8.81 | 347.37±15.52 | 341.21±2.05 |
| Table VChanges in serum uric acid levels in
rats (μmol/l). |
Table V
Changes in serum uric acid levels in
rats (μmol/l).
| Group | Time, weeks |
|---|
|
|---|
| 1 | 2 | 3 | 4 | 5 | 6 | 7 | 8 |
|---|
| E36eu |
384.56±14.51A | 427.61±9.42A |
428.51±22.01A |
424.90±27.69A |
405.84±32.04B,C,D |
375.98±26.08A,B,C,D |
361.49±16.71A,B,c,D | 345.45±4.27A,B,C,D |
| E36e |
380.90±15.72A | 421.91±5.10A |
414.13±13.92A |
431.92±34.73A |
448.02±22.61b |
463.79±16.23A |
451.48±33.47A,b | 450.23±3.97A,B |
| E |
386.52±17.82a | 418.41±7.01A |
428.06±20.52A |
433.95±10.89A | 446.31±6.57A,b | 443.84±35.61 |
449.12±26.87A,b |
455.95±45.75A,B |
| NS |
379.59±15.88a |
415.22±33.87A |
424.72±26.88A |
435.62±10.95A |
432.40±13.50A |
436.81±25.07A |
434.19±23.83A |
436.08±13.39A |
| Con | 203.23±10.06 | 192.70±24.04 | 189.13±4.89 | 198.34±37.87 | 195.32±13.70 | 191.35±14.59 | 198.07±46.63 | 188.83±44.66 |
| Table VIFecal allantoin levels. |
Table VI
Fecal allantoin levels.
| Group | E36eu | E36e | E | NS | Con |
|---|
| Allantoin,
μg/ml | 393.94±5.16A–D |
259.92±14.58a | 271.71±9.34 | 250.49±11.09 | 241.27±8.87 |
| Table VIIEosinophil count. |
Table VII
Eosinophil count.
| Group | E36eu | E36e | E | NS | Con |
|---|
| Number | 3.80±2.42 | 4.01±0.18 | 3.63±0.12 | 2.30±0.15 | 2.08±0.17 |
Results
Identification of target genes and
recombinant expression vectors pMG36e-sUOX and pMG36e-spo-uox
The target genes UOX, sUOX and spo exhibited target
bands of 948 bp [Fig. 1A (lanes
2–5) and C (lanes 3–4)], 1,093 bp [Fig. 1B (lanes 2–5) and C (lane 2)] and
105 bp [Fig. 1D (lane 2)] by 1.0%
agarose gel electrophoresis, respectively. The pMG36e plasmid
exhibited a band at 3,600 bp [Fig.
1C (lane 5)] by 1.0% agarose gel electrophoresis. Plasmids of
positive clones were extracted for PCR identification and
restriction enzyme digestion, and were confirmed by 1.0% agarose
gel electrophoresis. As demonstrated in Fig. 1, vector pMG36e was 3.6 kb
[Fig. 1F (lane 2)], UOX gene was
1 kb [Fig. 1E (lane 3)], and sUOX
gene was 1.1 kb [Fig. 1E (lane
2)], which coincided with the size of the target gene. Sequencing
results indicated that the base sequence was complete and
consistent with GenBank base sequence (45).
 | Figure 1Results of target gene amplification,
identification of recombinant plasmid and expression of uricase.
(A) Molecular weight marker DL4500 (lane 1) and PCR results for the
UOX gene (lanes 2–5). (B) DL4500 (lane 1) and PCR results for sUOX
gene analysis (lanes 2–5). (C) DL4500 (lane 1), double digestion of
sUOX gene (lane 2), double digestion of UOX gene (lanes 3–4) and
double digestion of pMG36e (lane 5). (D) DL500 (lane 1) and double
digestion of spo gene (lane 2). (E) DL4500 (lane 1), PCR results of
sUOX gene analysis in recombinant plasmid (lane 2); PCR results of
UOX gene analysis in recombinant plasmid (lane 3). (F) DL4500 (lane
1), double digestion of pMG36e in recombinant plasmid (lane 2),
double digestion of recombinant plasmid pMG36e-spo-uox (lanes 3–5)
and double digestion of recombinant plasmid pMG36e-sUOX (lanes
6–8). (G) Protein marker 170 kDa (lane 1), protein expression of
pmg36e-spo-uox in the periplasmic space, protein inclusion bodies
and supernatant following 9 h culture (lanes 2–4), protein
expression of pmg36e-sUOX in the periplasmic space, protein
inclusion bodies and supernatant following 9 h culture (lanes 5–7)
and protein expression of pmg36e-spo-uox in supernatants after 3,
6, and 12 h culture (lanes 8–10). PCR, polymerase chain reaction;
UOX, uricase, sUOX, staphylococcal protein A + uricase. |
Secretion expression of uricase
Following transformation of pMG36e-sUOX and
pMG36e-spo-uox into E. coli BL21 cells, the expression
levels of proteins were analyzed by SDS-PAGE at different culture
times in the supernatant, periplasmic space and inclusion bodies.
As indicated in Fig. 1G, the
supernatants of the recombinant plasmids pMG36e-sUOX and
pMG36e-spo-uox exhibited a band at 34 kDa [Fig. 1G (lane 4)], which was consistent
with the expected molecular weight of the target protein. In
addition, the expression level of pMG36e-spo-uox was increased
compared with that of pMG36e-sUOX, and maximum expression was
obtained at 9 h. The enzyme activity was identified to be 2.97
U/mg. Therefore, the recombinant plasmid pMG36e-spo-uox was
selected for subsequent analysis in vivo.
Application of engineered bacteria in rat
model Changes in water consumption, food intake, body weight and
SUA of rats, and fecal allantoin
Compared with the Con group, the water consumption
of the E36eu group was increased at weeks 6 and 8 (P<0.05;
Table II) and increased
significantly at weeks 2, 3, 4, and 7 (P<0.01; Table II), and food intake was decreased
at week 5 (P<0.05; Table
III). Compared with the NS group, water consumption in the
E36eu group was significantly increased at week 3 (P<0.01;
Table II) and body weight was
significantly decreased at week 7 (P<0.01; Table IV). The changes of SUA in rats
are presented in Table V. During
the whole experiment, SUA in the Con group was significantly
decreased compared with that in the other groups (P<0.01).
Between week 5 to week 8, the levels of SUA in the E36eu group were
decreased, and were significantly decreased compared with those in
the NS, E and E36e groups (P<0.01). Compared with the NS group,
the SUA levels in the E36e group at week 5 and the E group at weeks
5 and 7 were higher than that in the NS group (P<0.05). The SUA
levels in the E36e group at weeks 7 and 8 and the E group at week 8
were significantly higher than that in the NS group (P<0.01). As
observed in Table VI, the
allantoin levels in the feces of the E36eu group were significantly
increased compared with those of the other groups (P<0.01).
These data indicate that there was no decrease in the SUA levels in
the rats who were administered the empty vector E. coli
engineered bacteria and E. coli. The SUA levels in the rats
who were administered uricase genetically engineered bacteria was
significantly decreased.
Analysis of eosinophil count and
histological observation of small intestine in rats
Compared with the Con group, the number of
eosinophils in the E36eu, E36e, E and NS groups increased slightly,
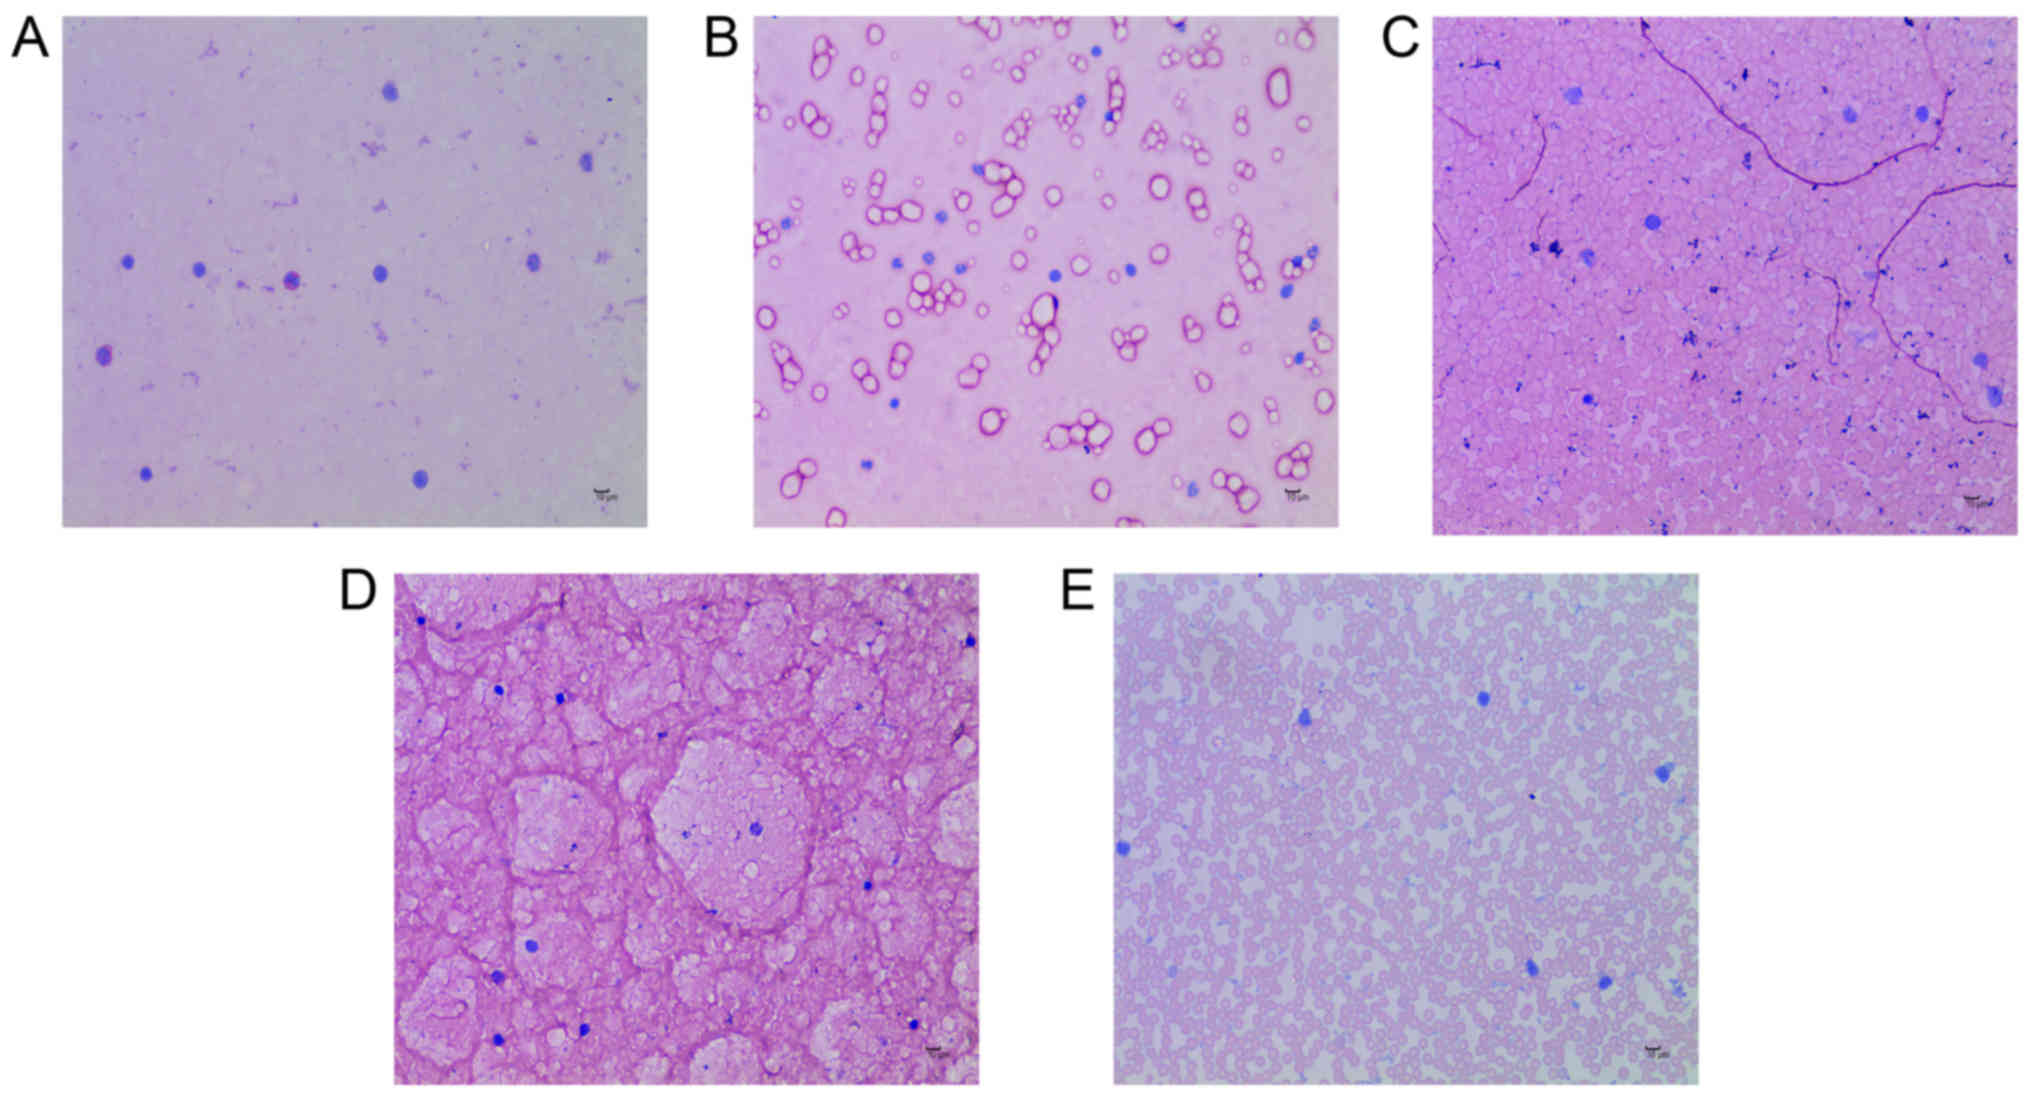
but the difference was not significant (P>0.05; Table VII and Fig. 2A–E). The structure of the
intestinal mucosa was intact, epithelial cells were closely
arranged and goblet cells were scattered between absorptive cells.
There were no pathological changes in observed in the cells
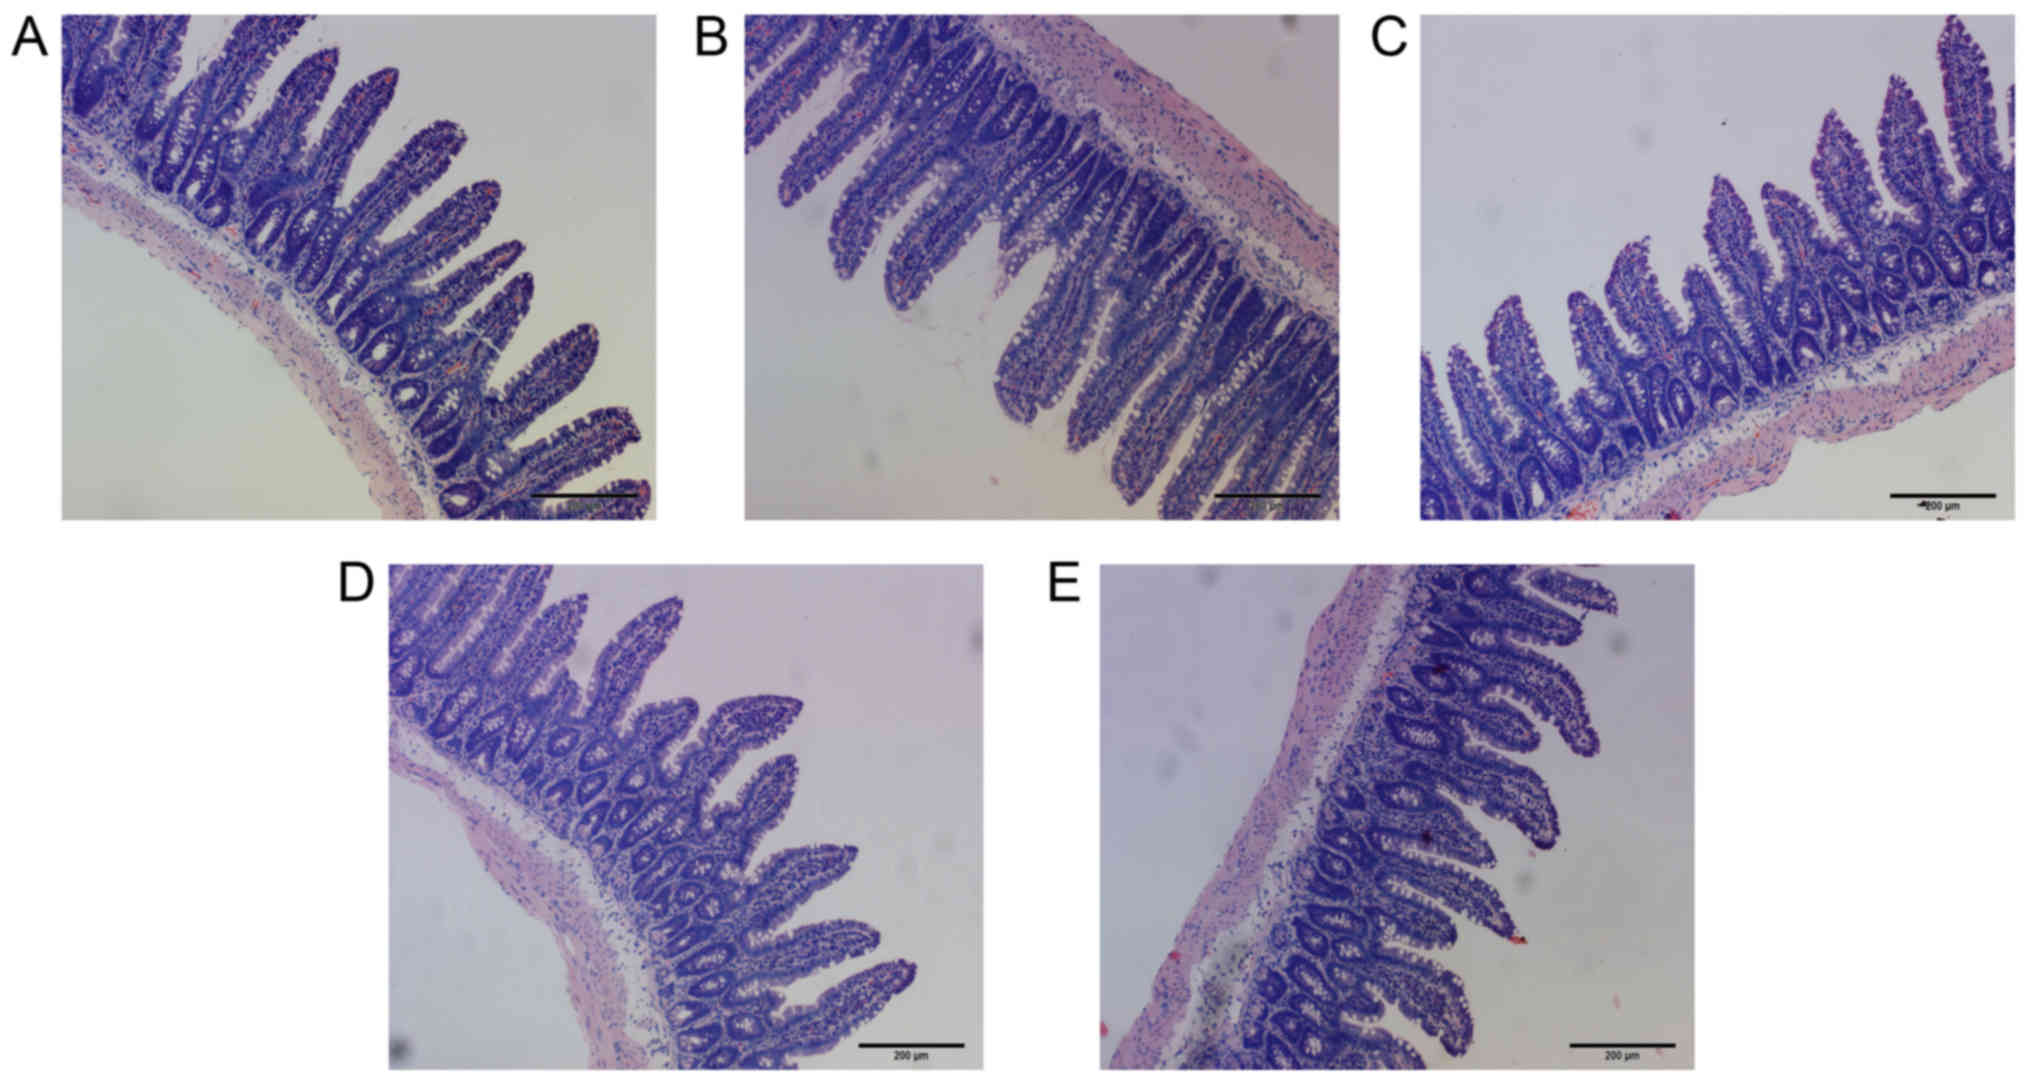
(Fig. 3A–E).
Analysis of intestinal contents in
rats
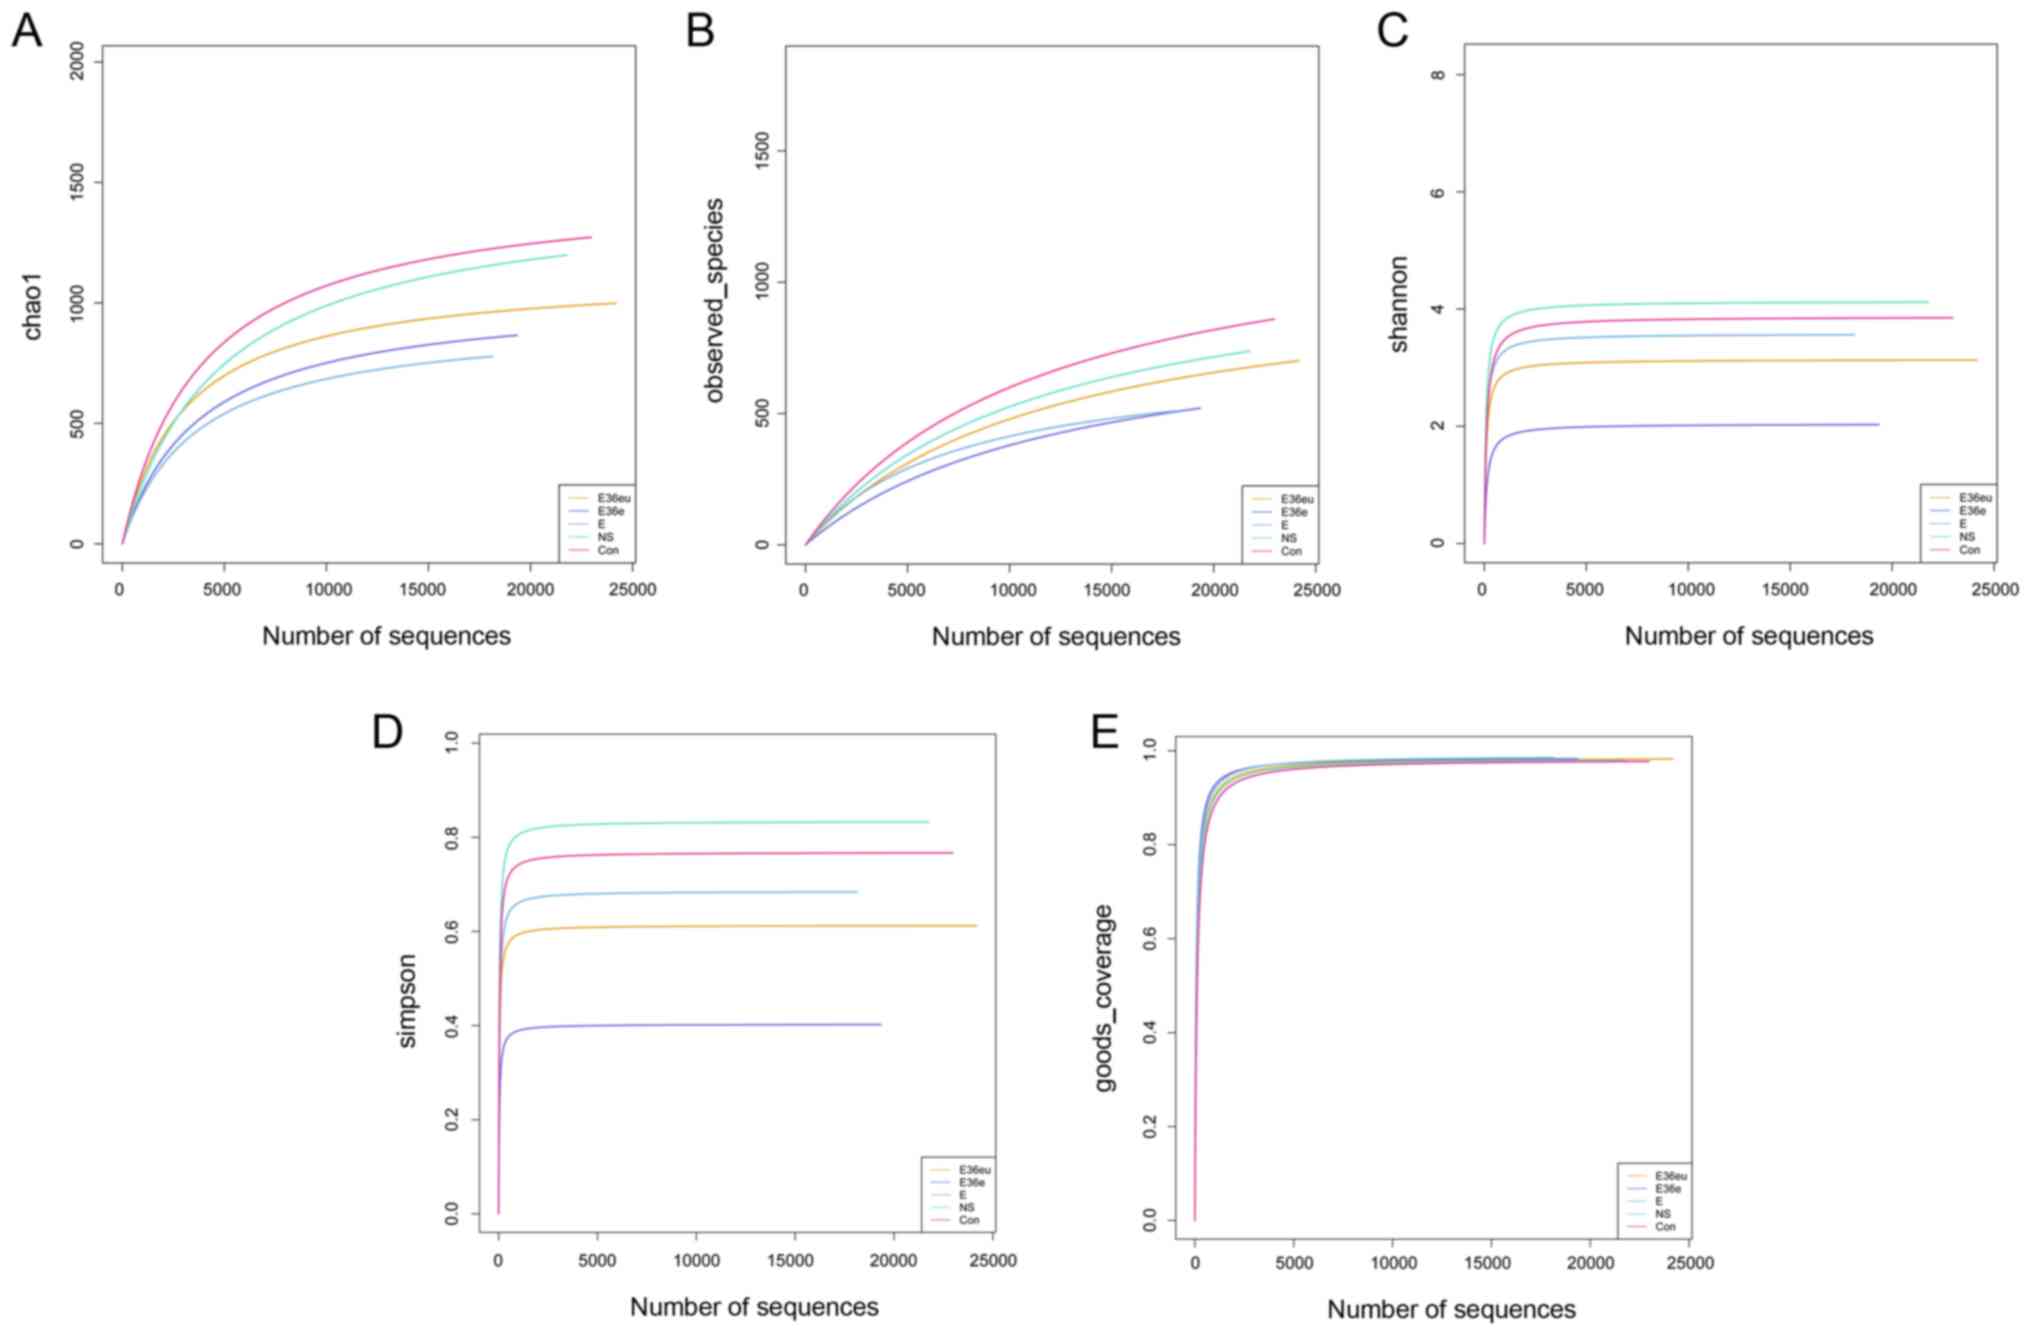
Following high-throughput sequencing, the intestinal
contents of the rats were analyzed by bioinformatics, including
Operational Taxonomic Units (OTU) cluster analysis, Alpha diversity
analysis, Beta diversity analysis and species analysis. The results
are presented in Figs. 4Figure 5Figure 6–7. The results of the OTU cluster
analysis and Alpha diversity analysis demonstrated that the
dilution curves of each group were generally smooth, indicating
that the data volume of sequencing was reasonable and could include
the majority of microorganisms in the samples (Fig. 4). According to the Goods_coverage
index, the results of sequencing can represent all samples
(Fig. 4E). According to the
Observed_species, Chao1, Shannon and Simpson indexes, the species
richness and evenness of the Con and NS groups were relatively high
(Fig. 4A–D). The results of the
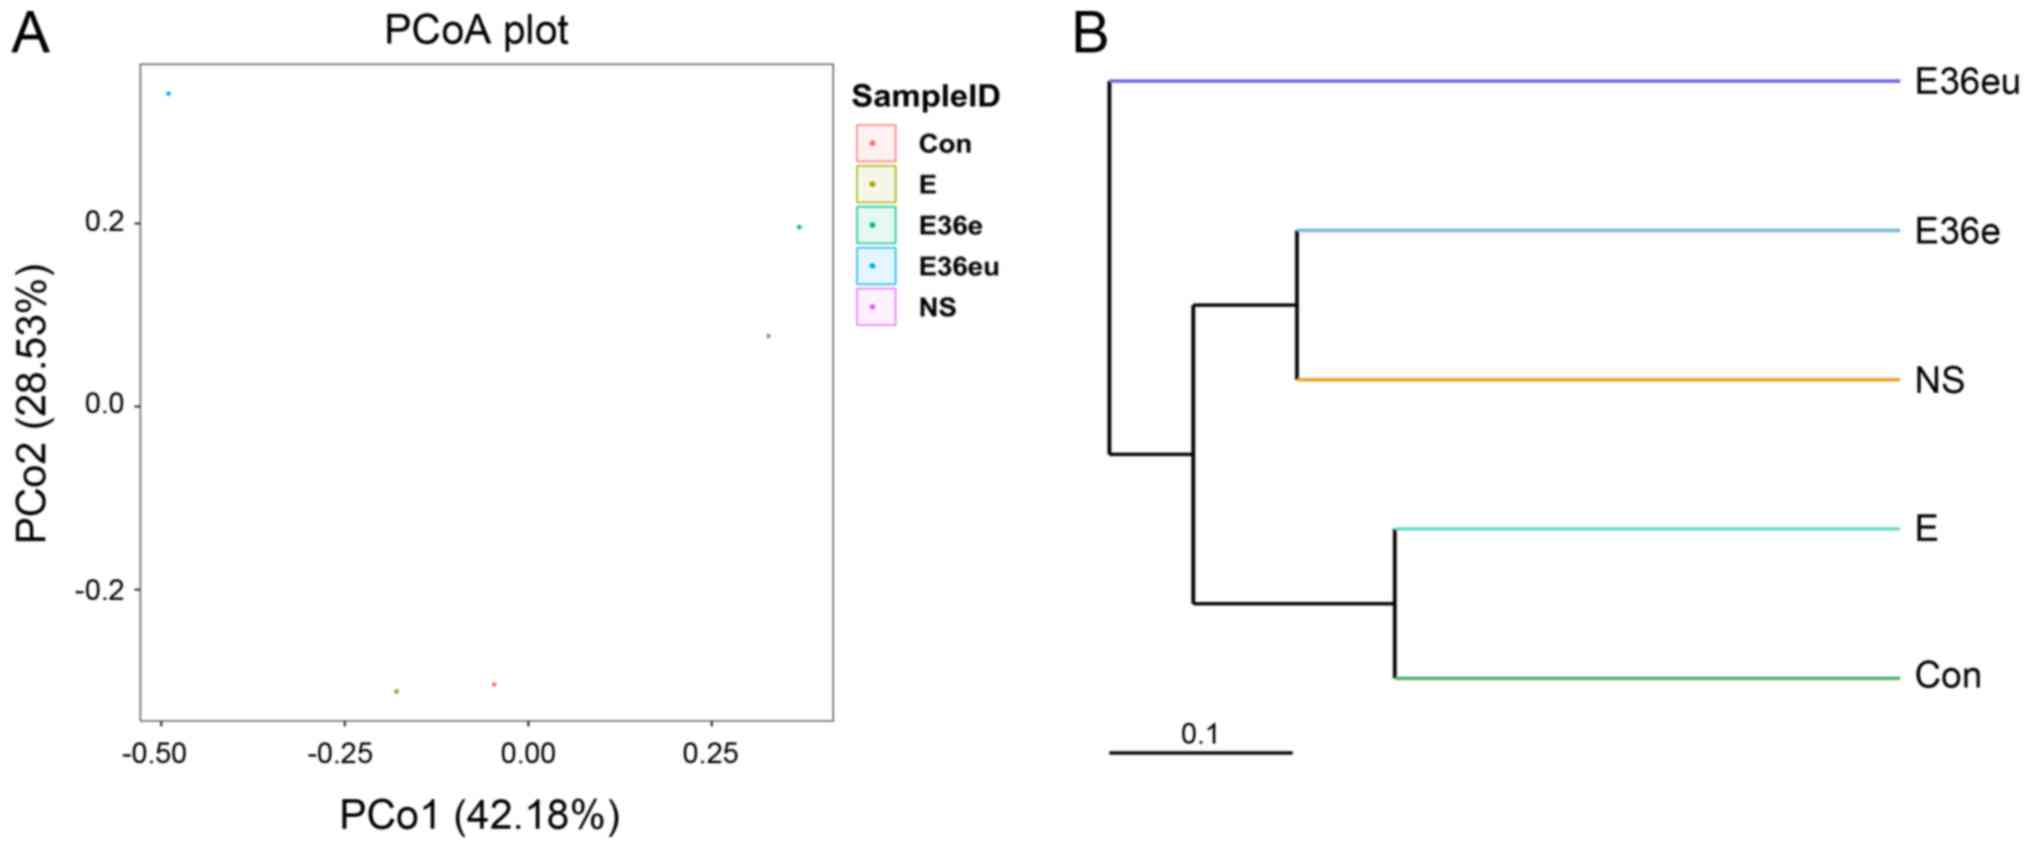
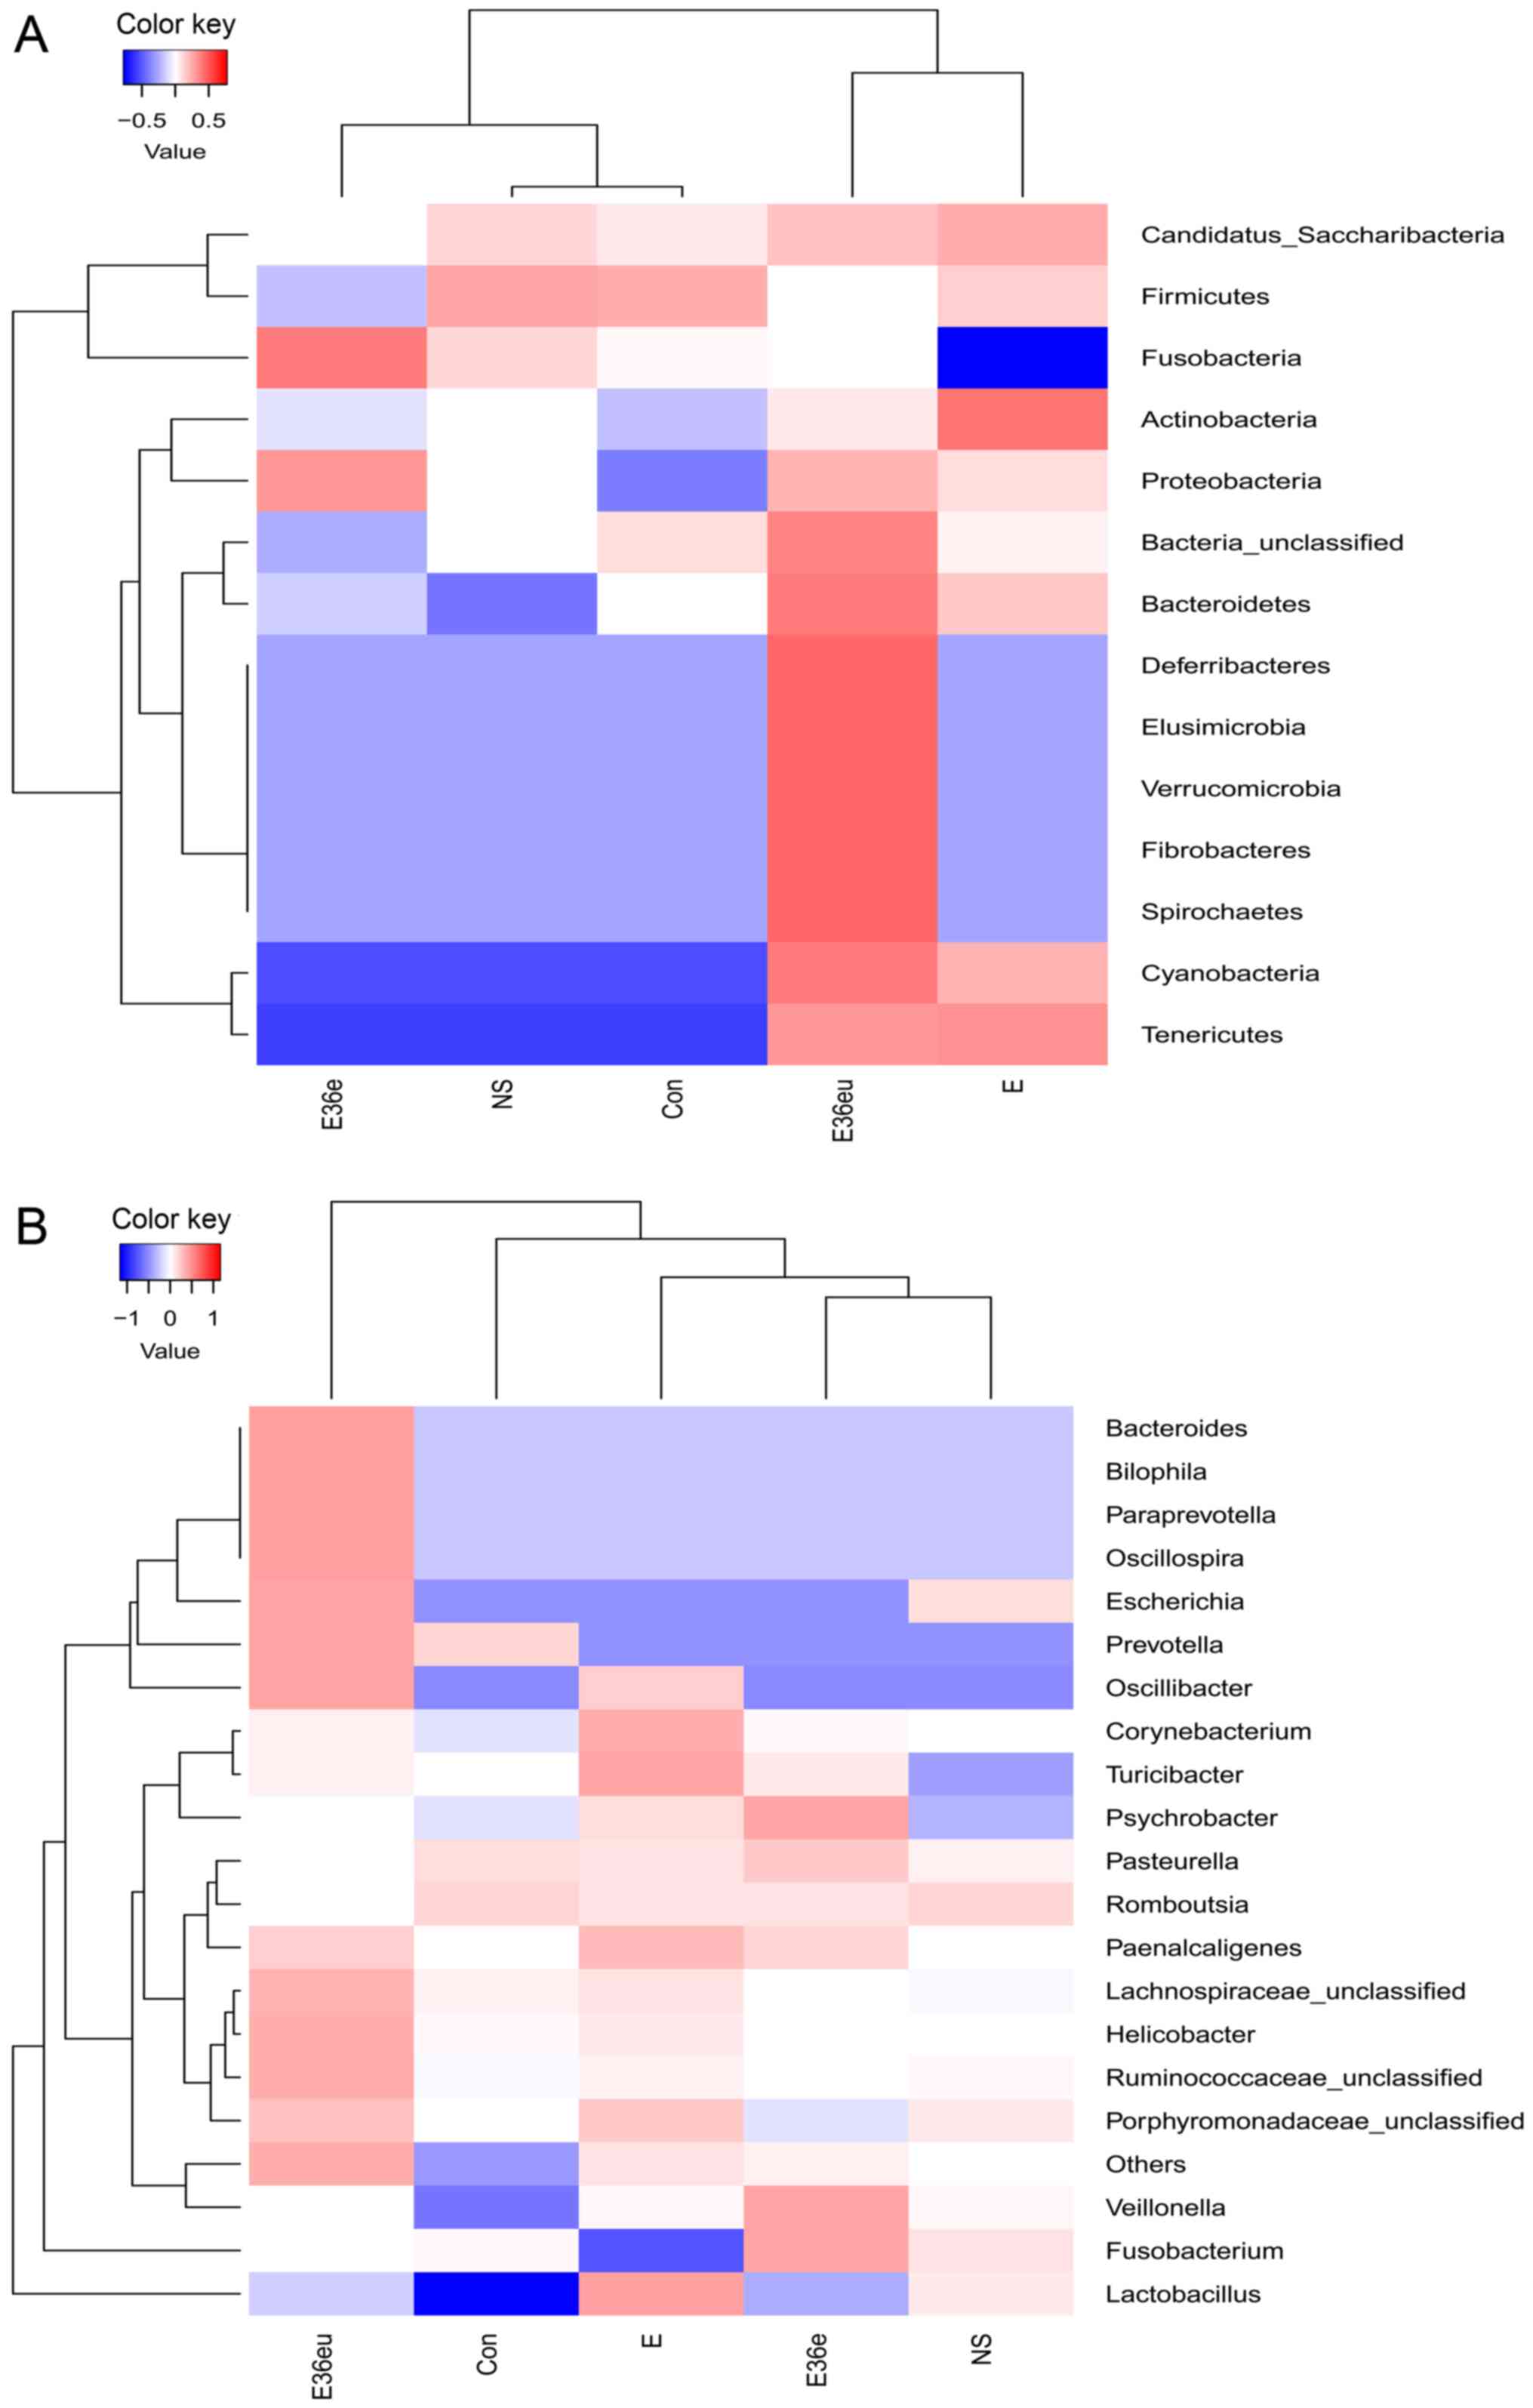
Bate analysis and species analysis indicated that there were
differences in species diversity between the E36eu and Con groups
(Fig. 5A and B). According to the
phylum level cluster analysis, intestinal flora of each group was
primarily composed of Firmicutes, Proteobacteria, Bacteroidetes,
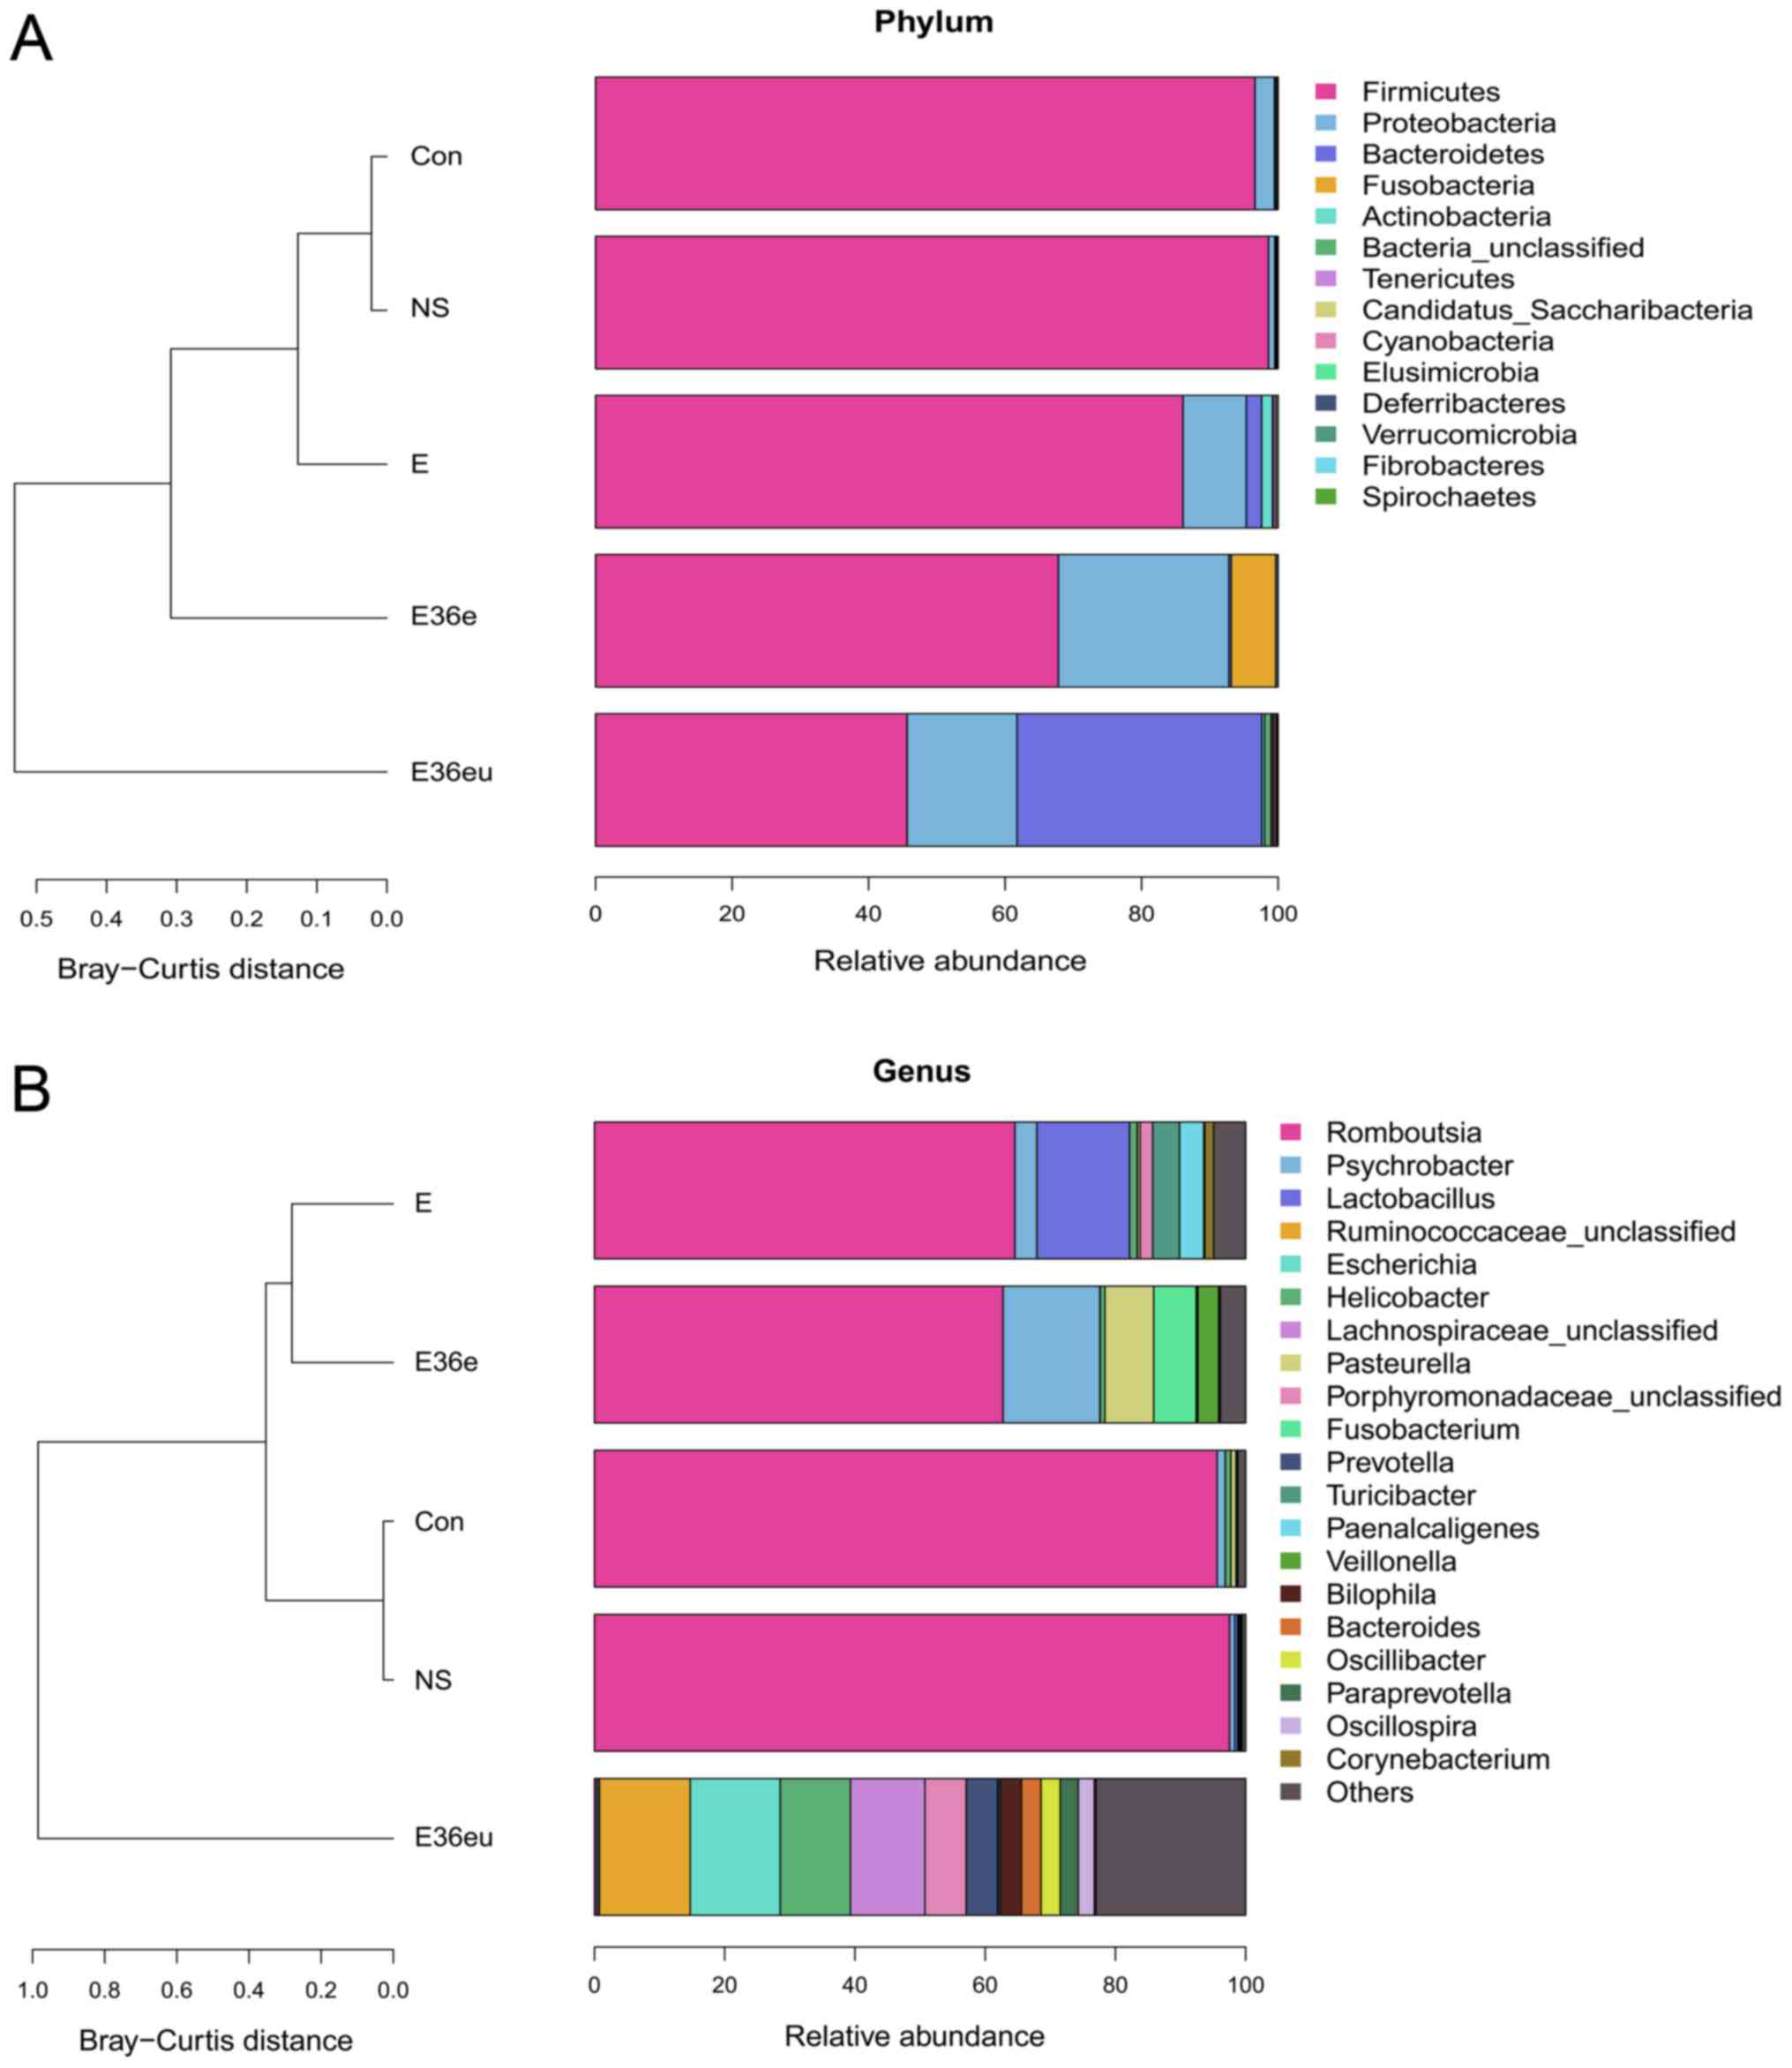
Fusobacteria, Actinobacteria and Teneriquets (Figs. 6A and 7A). The compositions of the colonies in
the Con and NS groups were similar, and the compositions of the
colonies in the Con and E36eu groups were different. According to
the genus level cluster analysis, composition and abundance of
colonies in each group were different (Figs. 6B and 7B).
Discussion
Apart from the kidney, the intestine is the most
important organ for excreting uric acid (27,46). The uric acid in the intestine
primarily originates from both endogenous (SUA) and exogenous
(food) sources. Endogenous uric acid is not only comprised of SUA
(46,47), but also a small amount of uric
acid secreted from liver (48).
The penetration of SUA into the intestine occurs through passive
diffusion (49), and may be
associated with the organic ion transporter 10 (OAT10) in the
intestinal mucosa (50).
Therefore, hyperuricemia significantly increases the level of uric
acid entering the intestine in this way (46). Furthermore, uric acid in the
intestine may also be absorbed into the blood, which is associated
with the secretory and absorptive functions of the intestinal
mucosa. Under normal circumstances, microorganisms in the intestine
convert some uric acid into allantoin, which is more easily soluble
in water, and excreted in feces (51). The conversion of uric acid into
allantoin not only decreases the level of uric acid in the
intestine, but also facilitates the excretion of SUA into the
intestine, which is conducive to the overall decrease of uric acid
levels in the body.
Therefore, the present study successfully
constructed uricase-expressing genetically engineered bacteria by
gene recombination technology, and the efficacy of the engineered
bacteria was verified in a hyperuricemia rat model using oteracil
potassium, which is a commonly used drug in animal models that
inhibits uricase activity. When administered in certain amounts, it
may partially inhibit the activity of uricase due to the
competitive inhibition mechanism of the drug, which results in an
rapid increase in the levels of SUA in rats. However, oteracil
potassium is metabolized quickly in the body; therefore, the time
of injection of oteracil potassium in the animal model of the
present study was different from the time of administration of the
genetically engineered bacteria, so that the oteracil potassium
would not affect the activity of uricase secreted by the engineered
bacteria. The results indicated that the SUA levels in rats who
received uricase-expressing genetically engineered bacteria
decreased significantly and that the rats grew normally. In the
upper part of the intestine, the number of bacteria in the lumen is
relatively low, and it is generally accepted that bacterial
communities increase in relative diversity and complexity in the
proximal-distal direction, from duodenum through to the jejunum and
ileum. Based on early molecular studies, the genus
Streptococcus appears to be the dominant genus in the
duodenum and jejunum (52,53).
There are more gram-negative bacteria compared with gram-positive
bacteria in the terminal ileum. Located next to the ileocecal
valve, the environment of the colon is conducive to the growth of
obligate anaerobic bacteria, and the number of bacteria increases
rapidly. Normally, the flora of the small intestine is primarily
distributed in the ileum. The duodenum and jejunum are relatively
sterile, and the primary bacterial species are gram-positive
aerobic bacteria, including Streptococcus,
Staphylococcus and Lactobacillus (54). In the distal ileum, the
gram-negative bacteria begin to outnumber the gram-positive
bacteria. Therefore, there are few bacteria in the upper part of
the small intestine, and it is difficult to collect samples. As
such, the contents of the whole intestinal segment of the small
intestine were collected in the present study for intestinal
contents analysis. It has been demonstrated that SUA can be
excreted into the intestinal lumen throughout the small intestine
to the large intestine (49,50). The mucosal area of the small
intestine is large, and this organ serves an important role in
lowering SUA levels. In the present study, the analysis of the
whole contents of the small intestine, SUA values and allantoin
values in rats suggested that uricase-expressing genetically
engineered bacteria colonized the intestine and served a role in
lowering uric acid levels. In addition, one study has used
montmorillonite to adsorb intestinal uric acid in order to decrease
SUA levels (55), which is
consistent with the results of the present study. However, the
aforementioned study only analyzed the effect of adsorption of
intestinal uric acid by montmorillonite on SUA in a short period of
time, but the effect of long-term use of montmorillonite on SUA was
not analyzed. Therefore, it has not been demonstrated that this
method can be used for long-term treatment of hyperuricemia.
Recombinant uricase has also been used to decompose uric acid in
vivo, but its clinical application has been limited by side
effects such as immunogenicity of heterologous proteins (31,32). Using a different method, the
present study used gene recombination technology to introduce the
s-layer protein signal peptide gene from Lactobacillus
brevis at the N-terminal end of the UOX gene, which is the
signal peptide gene that directs extracellular secretion of
uricase. Therefore, uricase-expressing engineered bacteria
colonized in the intestine may secrete endogenous uricase.
Additionally, E. coli is one of the normal species of
intestinal flora. Uricase, which is expressed through normal
intestinal flora, cannot enter the blood, and even if exposed for
prolonged periods, the body will not produce antibodies. The
present study also contains certain limitations; although E.
coli is a normal intestinal flora but a conditional pathogen,
excessive use may cause some side effects, including diarrhea and
inflammation.
An increasing number of studies investigating
probiotics have been performed in recent years.
Lactobacillus is one of the probiotics present in the human
intestine, which can improve intestinal microenvironment, regulate
immunity and promote nutrient absorption (56–59). Recent studies have demonstrated
that probiotics also have a role in regulating abnormal brain
activity (60,61). Therefore, this study group plans
to transfect a recombinant UOX gene into Lactobacillus, to
further analyze the practical application value and significance of
engineered bacteria.
In summary, the present study described a novel
approach to treat hyperuricemia through degrading uric acid by
uricase secreted by intestinal microorganisms carrying a
recombinant uricase gene. The uricase secreted by
uricase-expressing engineered bacteria, constructed through gene
recombination technology, promoted the conversion of intestinal
uric acid into allantoin, which not only prevented the absorption
of intestinal uric acid into the bloodstream but also accelerated
the diffusion of SUA into the intestine, thereby decreasing SUA
levels.
Acknowledgements
Not applicable.
Funding
The present study was supported by a grant from the
Chongqing Science and Technology Foundation in China (grant no.
cstc2016jcyjA0220) awarded to XJ.
Availability of data and materials
All data generated or analyzed during this study are
included in this published article.
Authors’ contributions
XL was responsible for the conceptualization of the
study. LC was involved in data curation. QL performed the formal
analysis. XJ was involved in funding acquisition, project
administration and supervision of the project. WD was involved in
reviewing the literature. YD was responsible for developing the
methodology. LC, QL and WD were involved in performing experiments.
XJ was involved in processing and editing the figures. LC was
responsible for writing the original draft. XJ was involved in
revision of the manuscript and final approval of the version to be
released. All authors read and approved the final manuscript.
Ethics approval and consent to
participate
In the present study, all the experimental protocols
involving animals approved by the Ethics Committee of Chongqing
Medical University (Chonqing, China).
Patient consent for publication
Not applicable.
Competing interests
The authors declare that they have no competing
interests.
References
|
1
|
Rock KL, Kataoka H and Lai JJ: Uric acid
as a danger signal in gout and its comorbidities. Nat Rev
Rheumatol. 9:13–23. 2013. View Article : Google Scholar :
|
|
2
|
Mallat SG, Al Kattar S, Tanios BY and
Jurjus A: Hyperuricemia, hypertension, and chronic kidney disease:
An emerging association. Curr Hypertens Rep. 18:742016. View Article : Google Scholar : PubMed/NCBI
|
|
3
|
Alvarez-Lario B and Macarron-Vicente J:
Uric acid and evolution. Rheumatology (Oxford). 49:2010–2015. 2010.
View Article : Google Scholar
|
|
4
|
Mandal AK and Mount DB: The molecular
physiology of uric acid homeostasis. Annu Rev Physiol. 77:323–345.
2015. View Article : Google Scholar
|
|
5
|
Li Q, Li X, Wang J, Liu H, Kwong JS, Chen
H, Li L, Chung SC, Shah A, Chen Y, et al: Diagnosis and treatment
for hyperuricemia and gout: A systematic review of clinical
practice guidelines and consensus statements. BMJ Open.
9:e266772019. View Article : Google Scholar
|
|
6
|
Kuo CF, Grainge MJ, Mallen C, Zhang W and
Doherty M: Rising burden of gout in the UK but continuing
suboptimal management: A nationwide population study. Ann Rheum
Dis. 74:661–667. 2015. View Article : Google Scholar :
|
|
7
|
Smith E, Hoy D, Cross M, Merriman TR, Vos
T, Buchbinder R, Woolf A and March L: The global burden of gout:
Estimates from the global burden of disease 2010 study. Ann Rheum
Dis. 73:1470–1476. 2014. View Article : Google Scholar : PubMed/NCBI
|
|
8
|
Elfishawi MM, Zleik N, Kvrgic Z, Michet CJ
Jr, Crowson CS, Matteson EL and Bongartz T: The rising incidence of
gout and the increasing burden of comorbidities: A population-based
study over 20 years. J Rheumatol. 45:574–579. 2018. View Article : Google Scholar :
|
|
9
|
Chiang KM, Tsay YC, Vincent NT, Yang HC,
Huang YT, Chen CH and Pan WH: Is hyperuricemia, an early-onset
metabolic disorder, causally associated with cardiovascular disease
events in han Chinese? J Clin Med. 8:E12022019. View Article : Google Scholar : PubMed/NCBI
|
|
10
|
Seoane-Mato D, Sanchez-Piedra C,
Silva-Fernandez L, Sivera F, Blanco FJ, Pérez Ruiz F, Juan-Mas A,
Pego-Reigosa JM, Narváez J, Quilis Martí N, et al: Prevalence of
rheumatic diseases in adult population in Spain (EPISER 2016
study): Aims and methodology. Reumatol Clin. 15:90–96. 2019.(In
English, Spanish). View Article : Google Scholar
|
|
11
|
Liu CW, Liao PC, Chen KC, Chiu YW, Liu YH,
Ke SR and Wu YW: Relationship of serum uric acid and Killip class
on mortality after acute ST-segment elevation myocardial infarction
and primary percutaneous coronary intervention. Int J Cardiol.
226:26–33. 2017. View Article : Google Scholar
|
|
12
|
Neogi T, Jansen TL, Dalbeth N, Fransen J,
Schumacher HR, Berendsen D, Brown M, Choi H, Edwards NL, Janssens
HJ, et al: 2015 gout classification criteria: An American college
of rheumatology/ European league against rheumatism collaborative
initiative. Arthritis Rheumatol. 67:2557–2568. 2015. View Article : Google Scholar : PubMed/NCBI
|
|
13
|
Roumeliotis S, Roumeliotis A, Dounousi E,
Eleftheriadis T and Liakopoulos V: Dietary antioxidant supplements
and uric acid in chronic kidney disease: A review. Nutrients.
11:pii: E1911. 2019. View Article : Google Scholar : PubMed/NCBI
|
|
14
|
Ryu S, Chang Y, Zhang Y, Kim SG, Cho J,
Son HJ, Shin H and Guallar E: A cohort study of hyperuricemia in
middle-aged South Korean men. Am J Epidemiol. 175:133–143. 2012.
View Article : Google Scholar
|
|
15
|
Johnson RJ, Bakris GL, Borghi C, Chonchol
MB, Feldman D, Lanaspa MA, Merriman TR, Moe OW, Mount DB, Sanchez
Lozada LG, et al: Hyperuricemia, acute and chronic kidney disease,
hypertension, and cardiovascular disease: Report of a scientific
workshop organized by the national kidney foundation. Am J Kidney
Dis. 71:851–865. 2018. View Article : Google Scholar : PubMed/NCBI
|
|
16
|
Liu CW, Chen KH, Tseng CK, Chang WC, Wu YW
and Hwang JJ: The dose-response effects of uric acid on the
prevalence of metabolic syndrome and electrocardiographic left
ventricular hypertrophy in healthy individuals. Nutr Metab
Cardiovasc Dis. 29:30–38. 2019. View Article : Google Scholar
|
|
17
|
Williams B, Mancia G, Spiering W, Agabiti
Rosei E, Azizi M, Burnier M, Clement DL, Coca A, de Simone G,
Dominiczak A, et al: 2018 ESC/ESH Guidelines for the management of
arterial hypertension. Eur Heart J. 39:3021–3104. 2018. View Article : Google Scholar : PubMed/NCBI
|
|
18
|
Presa M, Pérez-Ruiz F and Oyagüez I:
Second-line treatment with lesinurad and allopurinol versus
febuxostat for management of hyperuricemia: A cost-effectiveness
analysis for Spanish patients. Clin Rheumatol. 38:3521–3528. 2019.
View Article : Google Scholar : PubMed/NCBI
|
|
19
|
Becker MA, Schumacher HJ Jr, Wortmann RL,
MacDonald PA, Eustace D, Palo WA, Streit J and Joseph-Ridge N:
Febuxostat compared with allopurinol in patients with hyperuricemia
and gout. N Engl J Med. 353:2450–2461. 2005. View Article : Google Scholar : PubMed/NCBI
|
|
20
|
Liu CW, Chang WC, Lee CC, Shau WY, Hsu FS,
Wang ML, Chen TC, Lo C and Hwang JJ: The net clinical benefits of
febuxostat versus allopurinol in patients with gout or asymptomatic
hyperuricemia-A systematic review and meta-analysis. Nutr Metab
Cardiovasc Dis. 29:1011–1022. 2019. View Article : Google Scholar : PubMed/NCBI
|
|
21
|
Mu Z, Wang W, Wang J, Lv W, Chen Y, Wang
F, Yu X, Wang Y, Cheng B and Wang Z: Predictors of poor response to
urate-lowering therapy in patients with gout and hyperuricemia: A
post-hoc analysis of a multicenter randomized trial. Clin
Rheumatol. 38:3511–3519. 2019. View Article : Google Scholar : PubMed/NCBI
|
|
22
|
White WB, Saag KG, Becker MA, Borer JS,
Gorelick PB, Whelton A, Hunt B, Castillo M and Gunawardhana L;
CARES Investigators. Cardiovascular safety of febuxostat or
allopurinol in patients with gout. N Engl J Med. 378:1200–1210.
2018. View Article : Google Scholar : PubMed/NCBI
|
|
23
|
Richette P, Doherty M, Pascual E, Barskova
V, Becce F, Castañeda-Sanabria J, Coyfish M, Guillo S, Jansen TL,
Janssens H, et al: 2016 updated EULAR evidence-based
recommendations for the management of gout. Ann Rheum Dis.
76:29–42. 2017. View Article : Google Scholar
|
|
24
|
Xu X, Li C, Zhou P and Jiang T: Uric acid
transporters hiding in the intestine. Pharm Biol. 54:3151–3155.
2016. View Article : Google Scholar : PubMed/NCBI
|
|
25
|
Jalal DI, Chonchol M, Chen W and Targher
G: Uric acid as a target of therapy in CKD. Am J Kidney Dis.
61:134–146. 2013. View Article : Google Scholar
|
|
26
|
Maiuolo J, Oppedisano F, Gratteri S,
Muscoli C and Mollace V: Regulation of uric acid metabolism and
excretion. Int J Cardiol. 213:8–14. 2016. View Article : Google Scholar
|
|
27
|
Yun Y, Yin H, Gao Z, Li Y, Gao T, Duan J,
Yang R, Dong X, Zhang L and Duan W: Intestinal tract is an
important organ for lowering serum uric acid in rats. PLoS One.
12:e1901942017. View Article : Google Scholar
|
|
28
|
Matsuo H, Tsunoda T, Ooyama K, Sakiyama M,
Sogo T, Takada T, Nakashima A, Nakayama A, Kawaguchi M, Higashino
T, et al: Hyperuricemia in acute gastroenteritis is caused by
decreased urate excretion via ABCG2. Sci Rep. 6:310032016.
View Article : Google Scholar : PubMed/NCBI
|
|
29
|
Adejumo OA, Okaka EI, Madumezia G, Okwuonu
CG and Ojogwu LI: Assessment of some cardiovascular risk factors in
predialysis chronic kidney disease patients in Southern Nigeria.
Niger Med J. 56:394–399. 2015. View Article : Google Scholar
|
|
30
|
Sakhaee K: Epidemiology and clinical
pathophysiology of uric acid kidney stones. J Nephrol. 27:241–245.
2014. View Article : Google Scholar : PubMed/NCBI
|
|
31
|
Stamp LK, O’Donnell JL and Chapman PT:
Emerging therapies in the long-term management of hyperuricaemia
and gout. Intern Med J. 37:258–266. 2007. View Article : Google Scholar : PubMed/NCBI
|
|
32
|
Terkeltaub R: Gout. Novel therapies for
treatment of gout and hyperuricemia. Arthritis Res Ther.
11:2362009. View
Article : Google Scholar : PubMed/NCBI
|
|
33
|
Cao C, Zhang H, Yang Z and Wu B: Peptide
recognition, signaling and modulation of class B G protein-coupled
receptors. Curr Opin Struct Biol. 51:53–60. 2018. View Article : Google Scholar : PubMed/NCBI
|
|
34
|
Tristan A, Benito Y, Montserret R, Boisset
S, Dusserre E, Penin F, Ruggiero F, Etienne J, Lortat-Jacob H, Lina
G, et al: The signal peptide of Staphylococcus aureus panton
valentine leukocidin LukS component mediates increased adhesion to
heparan sulfates. PLoS One. 4:e50422009. View Article : Google Scholar : PubMed/NCBI
|
|
35
|
Negi S, Pandey S, Srinivasan SM, Mohammed
A and Guda C: LocSigDB: A database of protein localization signals.
Database (Oxford). 2015.pii: bav003. 2015. View Article : Google Scholar
|
|
36
|
Lv XG, Shi YF, Xu X, Wei YL, Wang HM,
Zhang XB and Wu JL: Oryza sativa chloroplast signal recognition
particle 43 (OscpSRP43) is required for chloroplast development and
photosynthesis. PLoS One. 10:e1432492015. View Article : Google Scholar
|
|
37
|
Chen G and Jia P: Allopurinol decreases
serum uric acid level and intestinal glucose transporter-5
expression in rats with fructose-induced hyperuricemia. Pharmacol
Rep. 68:782–786. 2016. View Article : Google Scholar : PubMed/NCBI
|
|
38
|
Zhu C, Tai LL, Wan XC, Li DX, Zhao YQ and
Xu Y: Comparative effects of green and black tea extracts on
lowering serum uric acid in hyperuricemic mice. Pharm Biol.
55:2123–2128. 2017. View Article : Google Scholar : PubMed/NCBI
|
|
39
|
Dalbeth N, Phipps-Green A, House ME,
Gamble GD, Horne A, Stamp LK and Merriman TR: Body mass index
modulates the relationship of sugar-sweetened beverage intake with
serum urate concentrations and gout. Arthritis Res Ther.
17:2632015. View Article : Google Scholar : PubMed/NCBI
|
|
40
|
Caliceti C, Calabria D, Roda A and Cicero
AFG: Fructose intake, serum uric acid, and cardiometabolic
disorders: A critical review. Nutrients. 9:pii: E395. 2017.
View Article : Google Scholar : PubMed/NCBI
|
|
41
|
Abdulla MH, Sattar MA, Abdullah NA and
Johns EJ: The effect of high-fructose intake on the vasopressor
response to angiotensin II and adrenergic agonists in
sprague-dawley rats. Pak J Pharm Sci. 26:727–732. 2013.PubMed/NCBI
|
|
42
|
Lecoultre V, Egli L, Theytaz F, Despland
C, Schneiter P and Tappy L: Fructose-induced hyperuricemia is
associated with a decreased renal uric acid excretion in humans.
Diabetes Care. 36:e149–e150. 2013. View Article : Google Scholar : PubMed/NCBI
|
|
43
|
Xilifu D, Abudula A, Rehemu N, Zhao L,
Zhou X and Zhang X: Effect of rosuvastatin on hyperuricemic rats
and the protective effect on endothelial dysfunction. Exp Ther Med.
8:1683–1688. 2014. View Article : Google Scholar : PubMed/NCBI
|
|
44
|
LI Y and Xu L: Improvement for unweighted
pair group method with arithmetic mean and its application. J
Beijing Univ Technol. 33:2007.
|
|
45
|
Benson DA, Cavanaugh M, Clark K,
Karsch-Mizrachi I, Lipman DJ, Ostell J and Sayers EW: GenBank.
Nucleic Acids Res. 41(Database Issue): D36–D42. 2013. View Article : Google Scholar :
|
|
46
|
Hosomi A, Nakanishi T, Fujita T and Tamai
I: Extra-renal elimination of uric acid via intestinal efflux
transporter BCRP/ABCG2. PLoS One. 7:e304562012. View Article : Google Scholar : PubMed/NCBI
|
|
47
|
Szczurek P, Mosiichuk N, Woliński J,
Yatsenko T, Grujic D, Lozinska L, Pieszka M, Święch E, Pierzynowski
SG and Goncharova K: Oral uricase eliminates blood uric acid in the
hyperuricemic pig model. PLoS One. 12:e1791952017. View Article : Google Scholar
|
|
48
|
Takada T, Ichida K, Matsuo H, Nakayama A,
Murakami K, Yamanashi Y, Kasuga H, Shinomiya N and Suzuki H: ABCG2
dysfunction increases serum uric acid by decreased intestinal urate
excretion. Nucleosides Nucleotides Nucleic Acids. 33:275–281. 2014.
View Article : Google Scholar : PubMed/NCBI
|
|
49
|
Bronk JR and Shaw MI: The transport of
uric acid across mouse small intestine in vitro. J Physiol.
378:229–239. 1986. View Article : Google Scholar : PubMed/NCBI
|
|
50
|
Bahn A, Hagos Y, Reuter S, Balen D, Brzica
H, Krick W, Burckhardt BC, Sabolic I and Burckhardt G:
Identification of a new urate and high affinity nicotinate
transporter, hOAT10 (SLC22A13). J Biol Chem. 283:16332–16341. 2008.
View Article : Google Scholar : PubMed/NCBI
|
|
51
|
Góth L: Rasburicase therapy may cause
hydrogen peroxide shock. Orv Hetil. 149:1587–1590. 2008.(In
Hungarian). View Article : Google Scholar
|
|
52
|
Skar V, Skar AG, Bratlie J and Osnes M:
Beta-glucuronidase activity in the bile of gallstone patients both
with and without duodenal diverticula. Scand J Gastroenterol.
24:205–212. 1989. View Article : Google Scholar : PubMed/NCBI
|
|
53
|
Justesen T, Nielsen OH, Jacobsen IE, Lave
J and Rasmussen SN: The normal cultivable microflora in upper
jejunal fluid in healthy adults. Scand J Gastroenterol. 19:279–282.
1984. View Article : Google Scholar : PubMed/NCBI
|
|
54
|
Hollister EB, Gao C and Versalovic J:
Compositional and functional features of the gastrointestinal
microbiome and their effects on human health. Gastroenterology.
146:1449–1458. 2014. View Article : Google Scholar : PubMed/NCBI
|
|
55
|
Wang Y, Lin Z, Zhang B, Nie A and Bian M:
Cichorium intybus L. Promotes intestinal uric acid excretion by
modulating ABCG2 in experimental hyperuricemia. Nutr Metab (Lond).
14:382017. View Article : Google Scholar
|
|
56
|
Yadav H, Lee JH, Lloyd J, Walter P and
Rane SG: Beneficial metabolic effects of a probiotic via
butyrate-induced GLP-1 hormone secretion. J Biol Chem.
288:25088–25097. 2013. View Article : Google Scholar : PubMed/NCBI
|
|
57
|
Balakrishnan B and Taneja V: Microbial
modulation of the gut microbiome for treating autoimmune diseases.
Expert Rev Gastroenterol Hepatol. 12:985–996. 2018. View Article : Google Scholar : PubMed/NCBI
|
|
58
|
Rinaldi E, Consonni A, Guidesi E, Elli M,
Mantegazza R and Baggi F: Gut microbiota and probiotics: Novel
immune system modulators in myasthenia gravis? Ann NY Acad Sci.
1413:49–58. 2018. View Article : Google Scholar : PubMed/NCBI
|
|
59
|
Chang CJ, Lin TL, Tsai YL, Wu TR, Lai WF,
Lu CC and Lai HC: Next generation probiotics in disease
amelioration. J Food Drug Anal. 27:615–622. 2019. View Article : Google Scholar : PubMed/NCBI
|
|
60
|
Bagheri S, Heydari A, Alinaghipour A and
Salami M: Effect of probiotic supplementation on seizure activity
and cognitive performance in PTZ-induced chemical kindling.
Epilepsy Behav. 95:43–50. 2019. View Article : Google Scholar : PubMed/NCBI
|
|
61
|
Akkasheh G, Kashani-Poor Z,
Tajabadi-Ebrahimi M, Jafari P, Akbari H, Taghizadeh M, Memarzadeh
MR, Asemi Z and Esmaillzadeh A: Clinical and metabolic response to
probiotic administration in patients with major depressive
disorder: A randomized, double-blind, placebo-controlled trial.
Nutrition. 32:315–320. 2016. View Article : Google Scholar
|