Introduction
Hyperlipidemia, which refers to abnormally elevated
levels of lipids, such as cholesterol, and lipid proteins in the
blood, increases the risk of arteriosclerosis, coronary heart
disease, cerebral stroke and myocardial infarction in humans
(1–3). Simvastatin (SV) is a lactone
prodrug. It undergoes reversible de-esterification to its active
6-hydroxyl acid and serves as an inhibitor of
3-hydroxy-3-methylglutaryl coenzyme A reductase to regulate hepatic
cholesterol production (4).
Additionally, SV is one of the most commonly prescribed statins, a
safe and effective cholesterol-lowering drug for the clinical
treatment of hyperlipidemia (5).
Other studies have suggested that metabolites
produced by gut bacteria can enter the bloodstream by absorption,
enterohepatic circulation or impaired gut barrier function
(6,7), which can affect the metabolism of
xenobiotics and serves an important role in disease onset and
progression (8). On the other
hand, the microbiota composition is also the result of the
equilibrium between the ability of the host to withstand the
selective pressure of the immune system and the ability to take
advantage of available nutrients (9). In addition, microbial influences on
drug response and bioavailability by their metabolic or peptide
products on the host immune system or host metabolism, which is
called indirect microbial effects, have attracted much attention
(10,11). Although growing evidence has
demonstrate that the gut microbiome is involved in variability of
drug response and bioavailability, the underlying molecular
mechanisms remain largely unknown (12,13). Zimmerman et al (13) measured the ability of diverse
human gut bacteria to metabolize 271 oral drugs and found ~2/3 of
the assayed drugs are metabolized by at least one strain, and 30
microbiome-encoded enzymes are validated. It is, therefore,
possible to improve drug efficacy or minimize drug toxicity by
manipulating the gut microbiome in the host (12,14).
In a previous study, variations in the therapeutic
benefits and low-density lipoprotein cholesterol (LDL-C) reduction
of SV therapy have been observed between ‘good’ and ‘poor’
responders (15). However, the
mechanisms underlying the interindividual variation of cholesterol
lowering during SV therapy are poorly understood. Therefore, Trupp
et al and Kaddurah-Daouk et al (16,17) conducted a series of investigations
to decipher the association between metabolic changes and efficacy
of SV in ‘good’ and ‘poor’ responders using the metabolomic
approach. They detected that plasma concentrations of SV are
positively associated with microbially-synthesized secondary bile
acids (18). The evidence
highlighted the involvement of gut microbiota in affecting
individual response to SV. Another study has demonstrated that one
of the most significant differences in active fecal suspension is
SV fragmentation (19). The data
suggested that the degradation of SV by hydrolytic cleavage of
methyl butanoic acid from the SV backbone may be associated with
the intestinal microflora. Although statins have been implied to
reduce growth and virulence in a number of bacterial pathogens due
to their anti-inflammatory and immunomodulatory activities
(20–22), the composition and metabolism
characteristics of gut microbiota following SV treatment,
particularly in a diseased state, are poorly understood. The
present study was designed to obtain insights into the gut
microbiota response to SV treatment in a hyperlipidemia disease
model, as well as the underlying mechanisms of the metabolic
pathways involved in gut flora interactions. Gut microbiota in
fecal samples from high-lipid diet-fed rats following SV treatment
were comprehensively evaluated by 16S rRNA gene high-throughput
sequencing and Phylogenetic Investigation of Communities by
Reconstruction of Unobserved States (PICRUSt) algorithm analysis.
The results may help obtain an improved understanding of the
associations among gut microbiota, hyperlipidemia and the
hypolipidemic efficacy of SV.
Materials and methods
Materials and reagents
SV (20 mg) was purchased from Merck Sharp &
Dohme-Hoddesdon. DNA extraction was performed using the fast DNA
stool mini kit (Qiagen GmbH). High-throughput sequencing was
performed using Phusion High-Fidelity PCR Master mix (New England
BioLabs, Inc.), the Qiagen Gel Extraction kit (Qiagen GmbH) and the
TruSeq DNA PCR-Free Sample Preparation kit (Illumina, Inc.).
Commercial assay kits for total cholesterol (TC), triglycerides
(TG), LDL-C and high-density lipoprotein cholesterol (HDL-C) were
purchased from Nanjing Jiancheng Bioengineering Institute.
Animal treatment and experimental
design
All animal experiments were carried out in
accordance with the National Institutes of Health Guidelines for
the Care and Use of Laboratory Animals, and were approved by the
Ethical Committee of Xi’an Jiaotong University School of Medical
Sciences (approval no. 2017-288). A total of 24, 8-week-old male
Sprague Dawley rats, weighing 180–220 g were purchased from the
Experimental Animal Center of Xi’an Jiaotong University (Xi’an,
China) and maintained under controlled specific pathogen-free
environmental conditions (temperature, 24±2°C; relative humidity,
55±15%; 12-h light/dark cycle) with ad libitum access to
food and water.
All 24 rats were acclimatized for 1 week prior to
the experiments, and then fed with high-lipid diet enriched with 1%
(w/w) cholesterol, 10% (w/w) lard, 5% egg yolk, 0.2%
propylthiouracil, 1% sodium tauroglycocholate and 82.8% basic diet
(23,24) during the entire study period.
Following 4 weeks of high-lipid diet feeding, the levels of TC, TG,
LDL-C and HDL-C in rat serum were determined and compared with
those of the same rats prior to the experiment. Subsequently, the
24 rats in the hyperlipidemia disease model (24) were randomly divided into three
groups (n=8). Two groups were treated with SV at a dose of 10
mg/kg−1/day−1 and 40
mg/kg−1/day−1 each, as previously described
(25–27). The remaining group was considered
to be the control group (0 mg/kg−1/day−1).
The suspensions of SV (10 and 40 mg/kg−1) were prepared
in sterile water and administered daily via gastric gavage at
approximately the same time, at noon. Fecal samples were collected
at the end of weeks 2 and 4 of the SV treatment period. As a
consequence, a total of 48 fecal samples were divided into six
groups: TW0mg, TW10mg and TW40mg (2-week SV treatment); and FW0mg,
FW10mg and FW40mg (4-week SV treatment). TW0mg and FW0mg were the
control groups, and the other four groups were considered to be
treatment groups. All fecal samples were stored immediately at
−80°C until DNA extraction for subsequent sequencing.
Bacterial genomic DNA extraction
Each fecal sample (~200 mg) was resuspended in
Qiagen InhibitEX buffer (Qiagen GmbH) and thoroughly homogenized
for 2 min. Bacterial genomic DNA was extracted from the supernatant
using the QIAamp Fast DNA stool Mini kit (Qiagen GmbH), according
to the manufacturer’s protocol. The extracted bacterial genomic DNA
was estimated by measuring the absorbance at 260 nm using a
NanoDrop spectrophotometer (Thermo Fisher Scientific, Inc.) prior
to downstream processing.
16S rRNA gene high-throughput
sequencing
For each sample, the extracted bacterial genomic DNA
was diluted to a 1 ng/μl working stock, which was used as a
template for PCR. The barcoded primers flanked the V3–V4 region of
the bacterial 16S rRNA gene. The primer sequences were as follows:
341F, 5′-CCTAYGGGRBGCASCAG-3′ and 806R, 5′-GGACTACNNGGGTATCTAAT-3′.
All PCR reactions were carried out using Phusion High-Fidelity PCR
Master Mix (New England BioLabs, Inc.). The thermocycling
conditions were as follows: Pre-denaturation at 98°C for 1 min,
followed by 30 cycles of denaturation at 98°C for 10 sec, annealing
at 50°C for 30 sec and extension at 72°C for 30 sec; final
extension at 72°C for 5 min. Resulting amplicons were confirmed in
2% agarose gel containing ethidium bromide and purified using a
Qiagen Gel Extraction kit (Qiagen GmbH). Sequencing libraries were
constructed using the TruSeq DNA PCR-Free Sample Preparation kit
(Illumina, Inc.), according to the manufacturer’s protocol. Pooled
amplicons were paired-end sequenced (2x250) on an Illumina
HiSeq2500 platform, according to the manufacturer’s protocol. The
samples were sent to Novogene Co., Ltd. for sequencing
analysis.
Data analysis
Paired-end reads were merged using FLASH (version
1.2.7; http://ccb.jhu.edu/software/FLASH/) (28). Following merging, quality
filtering on the raw tags was performed under specific filtering
conditions to obtain the high-quality clean tags (29), according to the Quantitative
Insights Into Microbial Ecology (QIIME; version 1.7.0)
quality-control process (30).
Using the UCHIME algorithm, chimera sequences were detected and
then removed against the Gold reference database (31,32) and the effective tags were finally
obtained. Similar sequences were assigned to operational taxonomic
units (OTUs) using the threshold of 97% identity (UPARSE version
7.0.1001; http://drive5.com/uparse/). Each
representative sequence was matched against the SSUrRNA database of
SILVA using Mothur (version 1.39.3) to annotate taxonomic
information (33,34). OTUs abundance information was
normalized using a standard of sequence number corresponding to the
sample with the least sequences.
Rarefaction and rank-abundance curves were drawn
using the R software (version 2.15.3; https://www.r-project.org/). α diversity analysis
including Chao1 index, abundance-based coverage estimator (ACE)
index, Shannon index and Simpson index were estimated using QIIME
software. Phylogenetic β diversity distances, including unweighted
and weighted UniFrac distances, were calculated using QIIME
software. Principal coordinates analysis (PCoA) was performed to
visualize the similarities or dissimilarities of variables from
complex multidimensional data. This analysis was visualized using
the WGCNA package (version 1.51; https://cran.r-project.org/web/packages/WGCNA/), stats
package (version 3.4.0; https://www.rdocumentation.org/packages/stats/versions/3.4.0)
and the ggplot2 package (version 2.2.0; https://cran.r-project.org/web/packages/ggplot2/)
in the R software. Unweighted pair-group method with arithmetic
means (UPGMA) clustering was performed using QIIME software as a
type of hierarchical clustering to interpret the distance matrix
using average linkage. The significant differences of the bacterial
community structure were tested by analysis of similarities
(ANOSIM) and permutational multivariate analysis of variance using
distance matrices (ADONIS) in the R software with the use of the
vegan package (version 2.4-0; https://cran.r-project.org/web/packages/vegan/).
Bacterial taxa with different abundances among different groups
were detected using MetaStat analysis (35), and only taxa with mean relative
abundance of >0.1% were considered. P-values were corrected for
multiple comparisons with Benjamini and Hochberg false-discovery
rate correction (q-value) (36).
The associations among microbial taxa could be
captured by co-occurrence networks. Genera from 16S rRNA gene
sequencing were used to calculate Spearman’s correlation
coefficient for the TW0mg, TW10mg and TW40mg groups (37,38).
Functional annotation and profiling
The 16S rRNA gene study is a common method of
identifying the bacterial taxonomic composition of fecal samples,
but it has disadvantages in directly identifying the functional
capabilities of the bacteria (39). PICRUSt algorithm analysis was used
to analyze and predict the functional capacity of the intestinal
bacterial community (39). The
sequences were processed using QIIME. To make closed-reference
picked OTUs compatible with PICRUSt, the Greengenes reference
database (version 13.5; ftp://greengenes.microbio.me/greengenes_release/gg_13_5/gg_13_5_otus.tar.gz)
was used. Following the filtering and normalizing of the OTU table,
functional predictive assignment was performed coordinating with
the Kyoto Encyclopedia of Genes and Genomes (KEGG) database
(40).
Statistical analysis
Data are presented as the mean ± SD (levels of TC,
TG, LDL-C and HDL-C ; average length and number of sequences) or
mean ± standard error of the mean (relative abundance of
operational taxonomic units at species level). The levels of TC,
TG, LDL-C and HDL-C were compared with those of the same rats
before the experiment using a paired-sample t-test. Significant
differences between treated and untreated groups (TW10mg vs. TW0mg;
TW40mg vs. TW0mg; FW10mg vs. FW0mg; FW40mg vs. FW0mg) in α
diversity and functional prediction were tested by Kruskal-Wallis,
followed by Dunn’s post hoc test. ANOSIM and ADONIS were used to
test the existence of different compositions between treated and
untreated groups. P<0.05 was considered to indicate a
statistically significant difference. MetaStat analysis
investigated the differentially abundant bacterial taxa between
treated and untreated groups, and P<0.05 with q<0.05 was
considered to indicate a statistically significant difference. All
statistical analysis was carried out using SPSS (version 22.0;
SPSS, Inc.) or R (version 2.15.3) software.
Results
Hyperlipidemia model
After a 4-week administration of a high-lipid diet,
the levels of TC, TG, LDL-C and HDL-C (TC, 9.50±3.85 mmol/l; TG,
1.44±0.54 mmol/l; LDL-C, 6.34±2.35 mmol/l; HDL-C, 0.94±0.38 mmol/l;
mean ± SD) were compared with those of the same rats before the
experiment (data not shown). There were significant increases in
the TC and LDL-C levels (P<0.001). TG was slightly increased
(P<0.05), whereas HDL-C was decreased (P<0.05). The results
clearly demonstrated that the hyperlipidemia model had been
successfully established in these 24 Sprague Dawley rats.
Overview of sequencing analysis
A total of 4,082,278 raw sequences were generated in
the present study (Table SI).
Following sequence trimming, quality filtering and the removal of
chimeras, 2,802,025 high-quality sequences remained, with an
average length of 416±2 bp (mean ± SD). The mean number of
sequences per sample was 58,376±4,050 (mean ± SD; data not shown).
The rarefaction and rank abundance curves of all samples were
stable, indicating that species representation in each sample had
approached the plateau phase. This meant that no more bacteria
would be detected with additional sequencing efforts (Fig. S1A and B).
These high-quality sequences were assigned to a
total of 48,600 OTUs by the UPARSE pipeline based on 97%
similarity, with an average of 1,012 OTUs per sample (Table SI). In total, 2,316 OTUs were
singletons. A total of 99.98±0.11% (mean ± SD) high-quality
sequences were classified to the phylum level, 98.71±0.47% (mean ±
SD) to the family level, 71.80±7.84% (mean ± SD) to the genus level
and 18.75±9.93% (mean ± SD) to the species level. The results
demonstrated that the bacteria belonged to 29 phyla, 66 classes,
128 orders, 232 families, 362 genera and 111 species (data not
shown).
Relative abundance of gut bacteria in
different groups
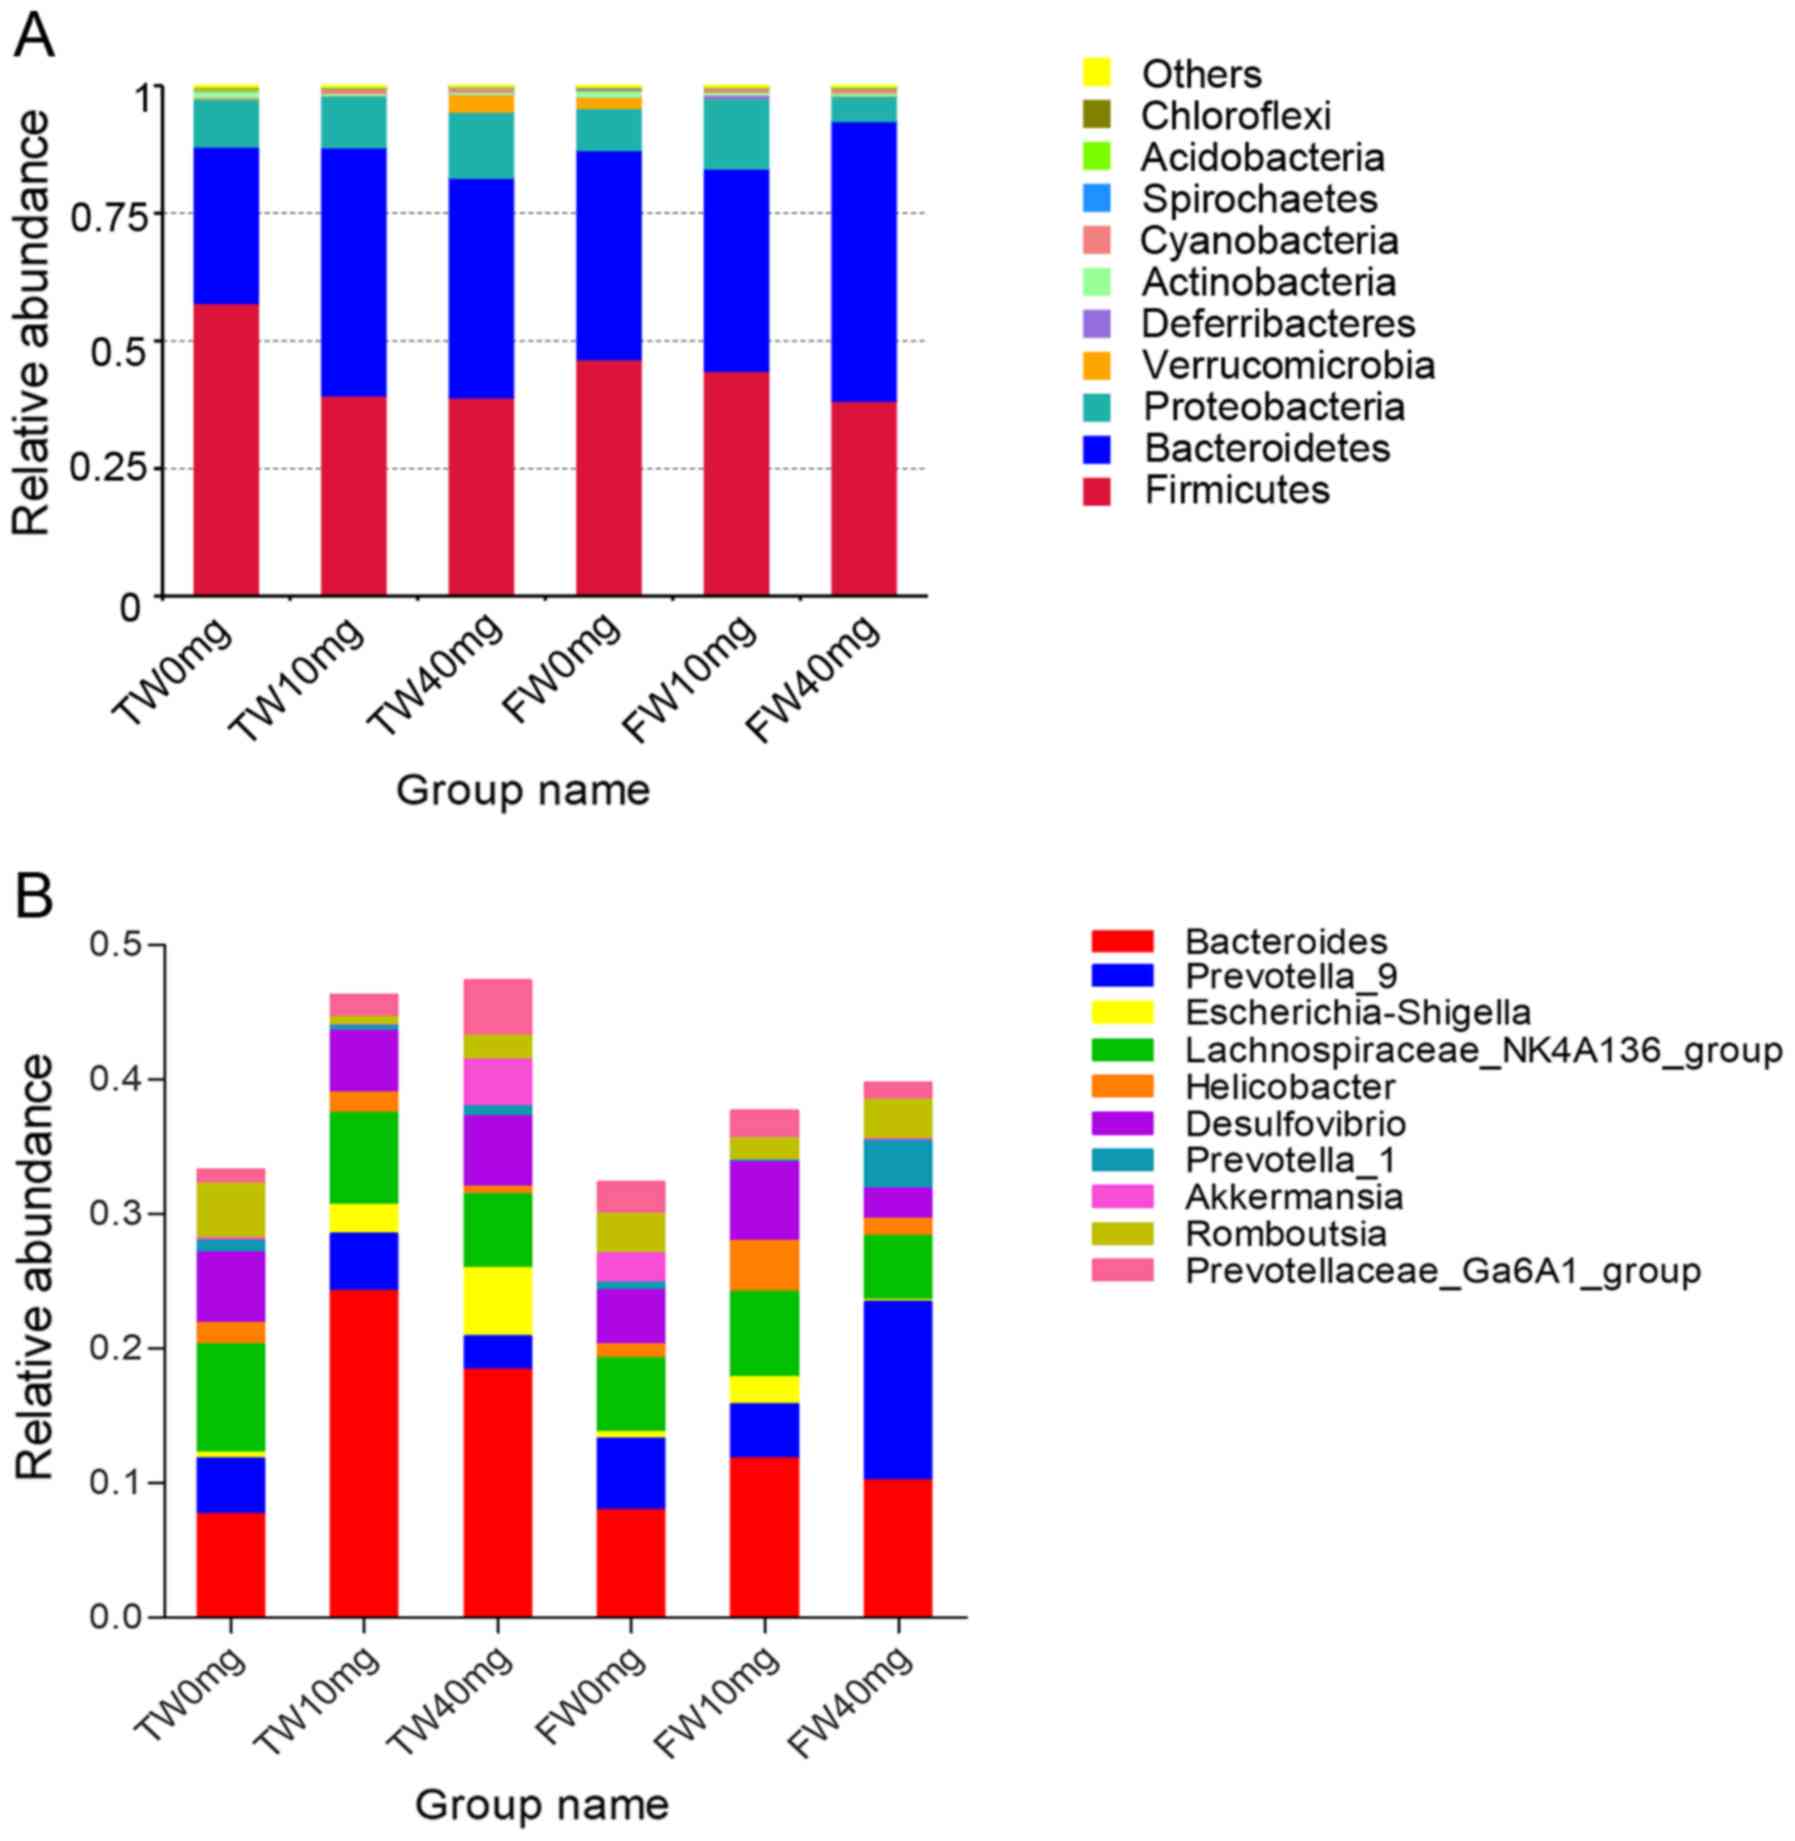
The top 10 phyla and top 10 genera in gut bacteria
relative abundance are shown in Fig.
1. Firmicutes (38.22–57.39%) and Bacteroidetes
(30.64–54.80%) were the most prevalent phyla in all groups,
followed by Proteobacteria and Verrucomicrobia. These
phyla accounted for ~97.53, 98.04, 98.30, 97.76, 97.52 and 98.07%
of the reads in the TW0mg, TW10mg, TW40mg, FW0mg, FW10mg and FW40mg
groups, respectively (Table SII).
Additionally, the phylum Actinobacteria is shown in Table SII. Only 0.029, 0.020, 0.021,
0.026, 0.023 and 0.013% of sequences were unclassified in the
TW0mg, TW10mg, TW40mg, FW0mg, FW10mg and FW40mg groups,
respectively. The relative abundance of Firmicutes in the SV
treatment groups (TW10mg, 39.27%; TW40mg, 38.88%; FW10mg, 44.07%;
FW40mg, 38.22%) was lower than that in the control groups (TW0mg,
57.39%; FW0mg, 46.36%; Fig. 1A;
Table SII).
At the genus level, Bacteroides (7.70–24.25%)
was the most predominant gut bacterial genus in the TW0mg, TW10mg,
TW40mg, FW0mg and FW10mg groups; other major genera included
Prevotella_9, Lachnospiraceae_NK4A136_group,
Escherichia-Shigella, Helicobacter,
Desulfovibrio, Prevotella_1, Akkermansia,
Romboutsia and Prevotellaceae_Ga6A1_group (Fig. 1B). It was identified that the
relative abundance of genus Bacteroides in the SV treatment
groups (TW10mg, 24.25%; TW40mg, 18.42%; FW10mg, 11.85%; FW40mg,
10.23%) was higher than that in the control groups (TW0mg, 7.70%
and FW0mg, 8.02%; Fig. 1B;
Table SII).
Characterization of bacterial α
diversity
The observed OTUs, Chao1, ACE, Shannon and Simpson
indices were calculated for each sample to evaluate the richness,
evenness and diversity of the microbial communities (Table SI). More specifically, as compared
with the TW0mg group, the values of the OTUs and Shannon indices
significantly decreased in the TW10mg and TW40mg groups, whereas
the values of the Chao1 and ACE indices significantly decreased in
the TW40mg group. Compared with the FW0mg group, the Shannon and
Simpson indices were significantly decreased in the FW40mg group
(P<0.05; Fig. 2A). In
addition, Good’s coverage was 99.6% on average. This result
indicated that the 16S rRNA sequences identified in these groups
represented the major bacterial sequences in the samples.
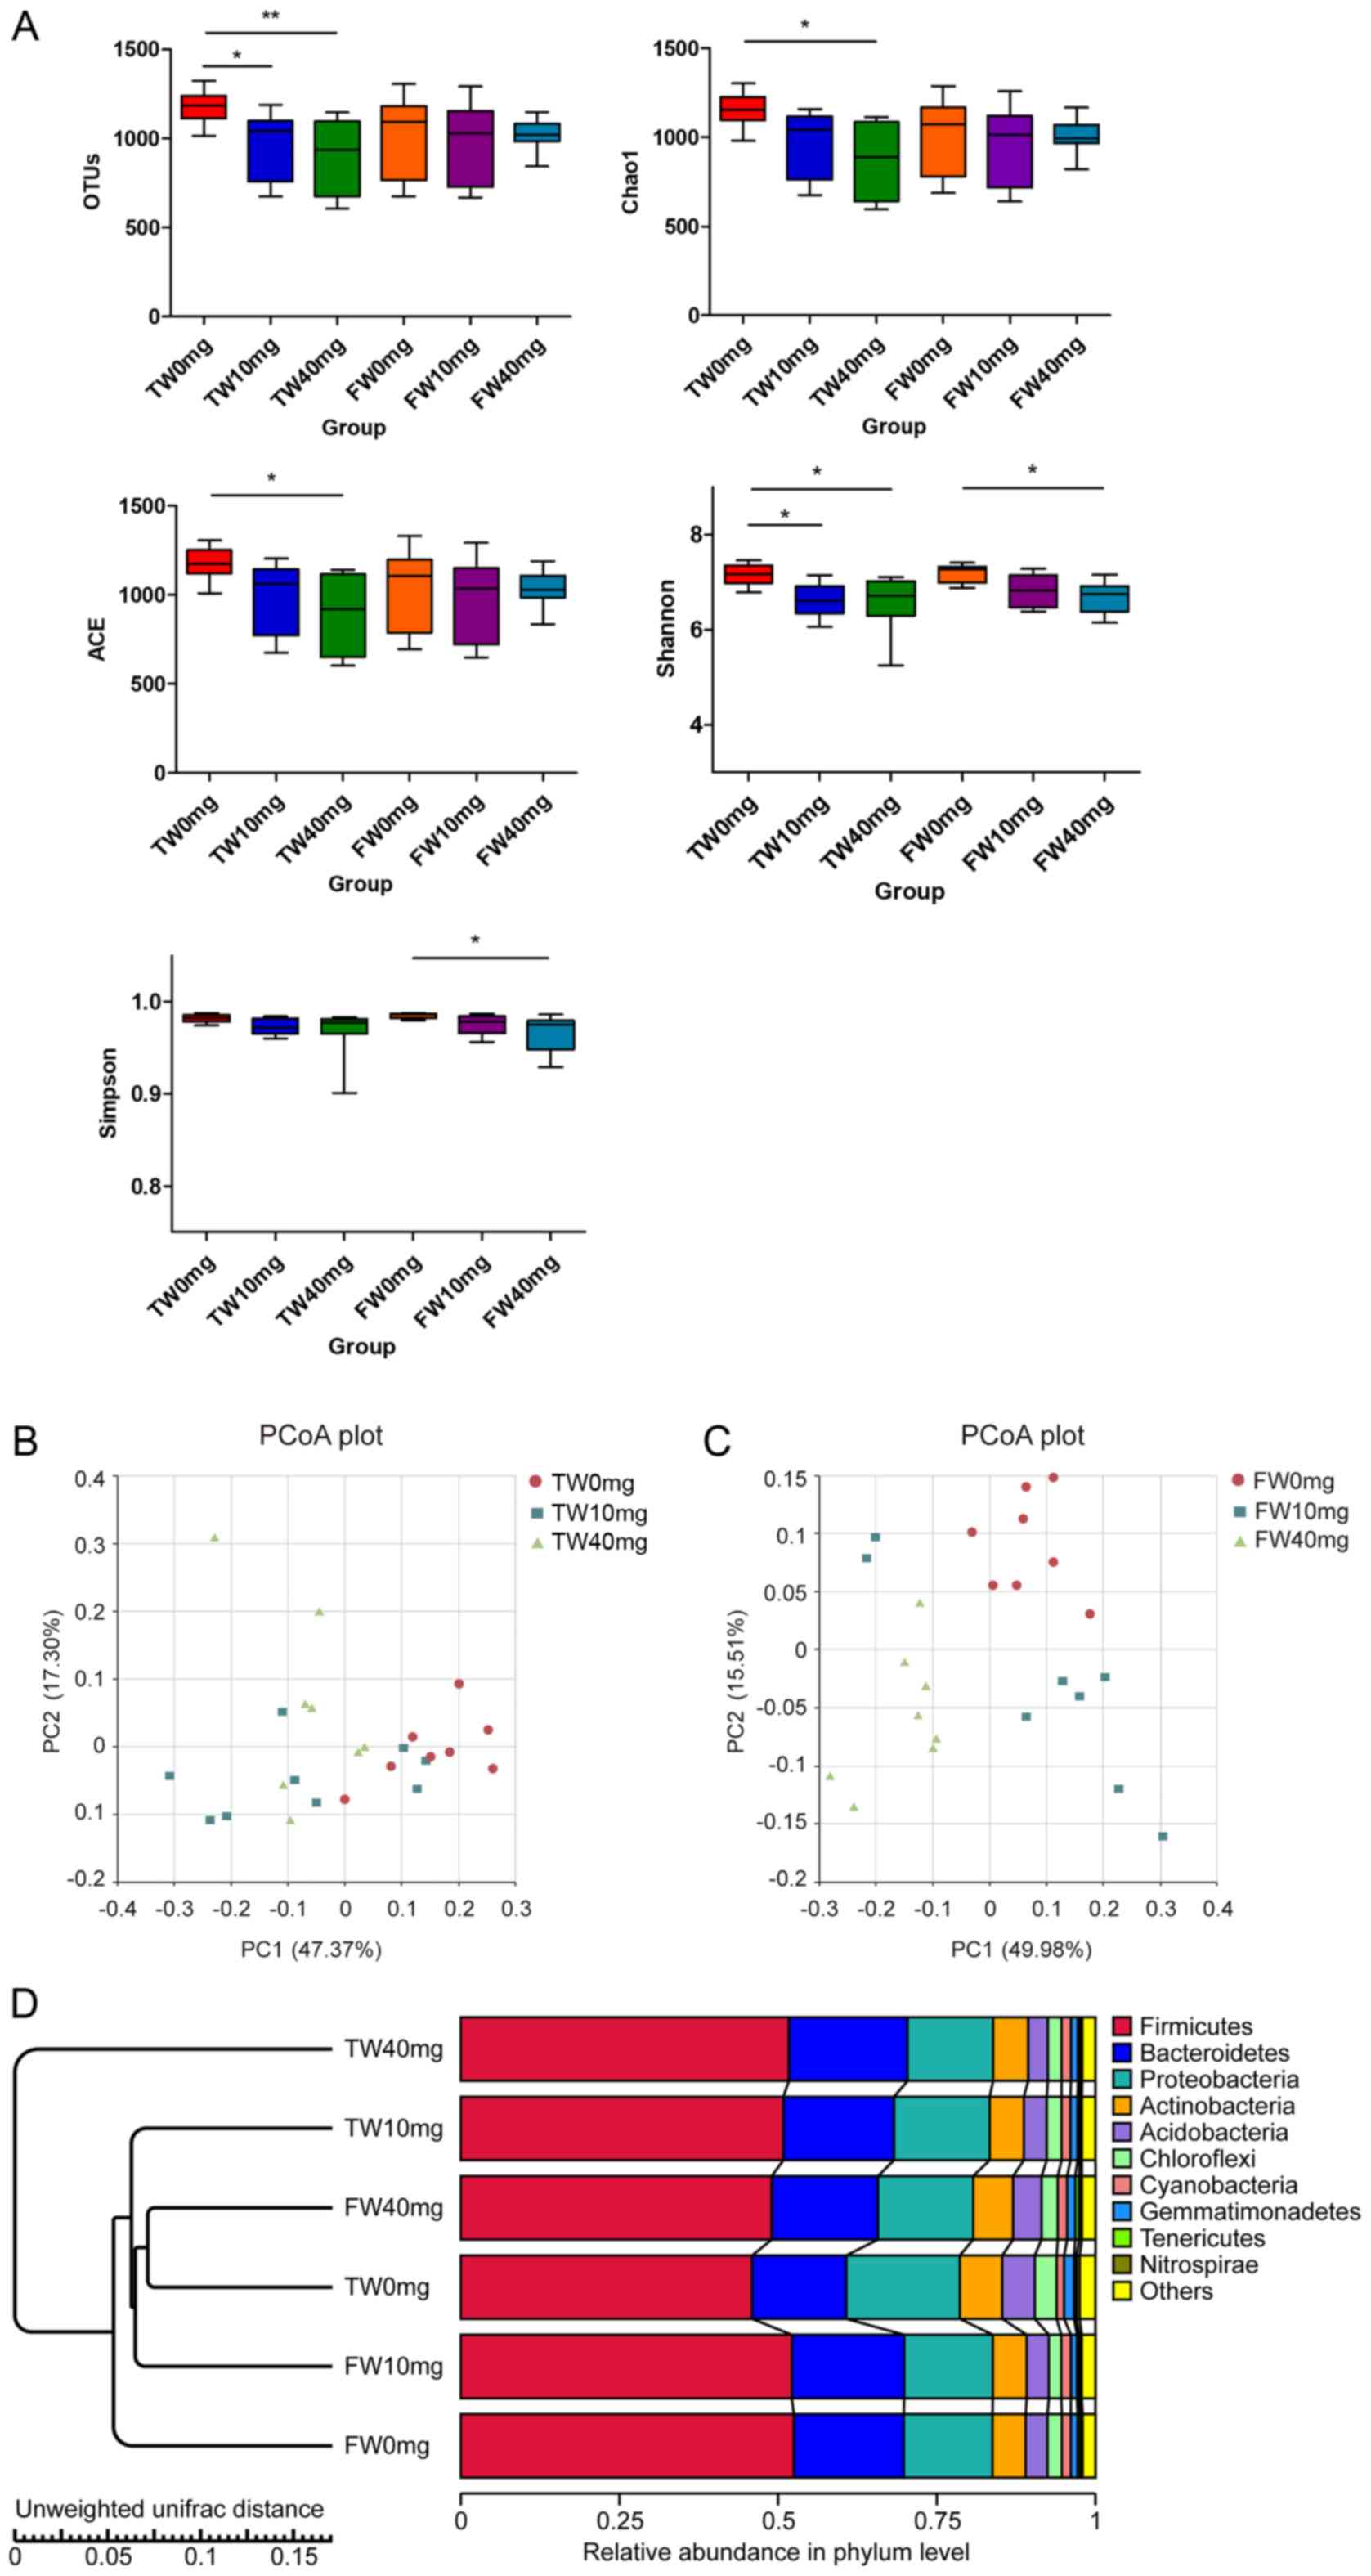 | Figure 2α and β diversity of bacterial
community. (A) Boxplots of α diversity indices (observed OTUs,
Shannon, Simpson, Chao1 and ACE) in each group.
*P<0.05, **P<0.001. Kruskal-Wallis
followed by Dunn’s post hoc test was used to test significant
differences. PCoA plots for samples following SV treatment for (B)
2 weeks and (C) for 4 weeks. Each point corresponds to an
individual rat. (D) Unweighted pair-group method with arithmetic
means tree, all revealing differences among six groups based on the
unweighted Unifrac distances of OTUs community. OTU, Operational
Taxonomic Unit; PCoA, principal coordinate analysis; SV,
simvastatin; ACE, abundance-based coverage estimator; TW, 2-week SV
treatment; FW, 4-week SV treatment. |
Furthermore, Venn diagrams were used to compare the
similarities and differences among the microbial communities in
different groups. The TW0mg, TW10mg and TW40mg groups had 1,287
OTUs in common. These OTUs represented 68.35, 74.35 and 80.09% to
their respective total OTUs. Additionally, the FW0mg, FW10mg and
FW40mg groups had 1,326 OTUs in common. These OTUs represented
74.66, 75.68 and 76.29% to their respective total OTUs (Fig. S1C and D).
Characterization of bacterial β
diversity
PCoA was performed to visualize the similarities or
dissimilarities of the intestinal microbiota composition among
different groups. According to PC1 and PC2 analysis (47.37 and
17.30% of variance explained, respectively), the microbial
communities of the TW0mg, TW10mg and TW40mg groups were separated
clearly from one another (Fig.
2B). Following 4 weeks of treatment, the microbial communities
of the FW0mg, FW10mg and FW40mg groups were grouped into three
distinct clusters based on PC1 and PC2 analysis (49.98 and 15.51%
of variance explained, respectively; Fig. 2C). The PCoA plots demonstrated the
dissimilarities of microbial community structure among these
groups. Additionally, this observation was supported by UPGMA
analysis based on the unweighted UniFrac distances (Fig. 2D). Furthermore, the results of the
UPGMA analysis revealed that the composition of gut microbiota
could be altered by SV treatment.
Furthermore, ANOSIM and ADONIS analyses were used to
test the differences in bacterial communities between different
groups. An R value of >0 was considered well separated by ANOSIM
analysis. Higher R2 values suggested larger intergroup
differences, as determined by ADONIS analysis (Fig. S2; Table I). The results of ANOSIM and
ADONIS analyses revealed that there were significant differences in
the fecal bacterial community between the treatment and control
groups (P<0.05).
 | Table IANOSIM and ADONIS analysis of the
community structure of fecal samples. |
Table I
ANOSIM and ADONIS analysis of the
community structure of fecal samples.
| ANOSIM | ADONIS |
|---|
|
|
|
|---|
| Comparison | R | P-value | R2 | P-value |
|---|
| TW0mg vs.
TW10mg | 0.8343 | 0.001 | 0.36395 | 0.001 |
| TW0mg vs.
TW40mg | 0.5642 | 0.001 | 0.26047 | 0.001 |
| FW0mg vs.
FW10mg | 0.6088 | 0.001 | 0.23014 | 0.001 |
| FW0mg vs.
FW40mg | 0.6752 | 0.001 | 0.25363 | 0.001 |
Changes in bacterial communities
following SV treatment
At the phylum level, significant differences in the
major taxonomical profiles (mean relative abundance of >0.1%) of
fecal microbiota among different groups were further identified
using MetaStat analysis. The relative abundances of phylum
Firmicutes and Actinobacteria in the fecal microbiota
were decreased following SV treatment, whereas that of
Bacteroidetes was elevated. Specifically, as compared with
the TW0mg group, the phylum Firmicutes and
Actinobacteria in the TW10mg and TW40mg groups were
significantly decreased (q<0.05). By contrast, there was a
significant increase in the relative abundance of the phylum
Bacteroidetes in the TW10mg, TW40mg and FW40mg groups (TW0mg
vs. TW10mg, q<0.05; TW0mg vs. TW40mg, q<0.05; FW0mg vs.
FW40mg, q<0.05; Fig. 3A;
Table SII).
A total of 16 genera (average relative abundance of
>0.1%; P<0.05; q<0.05) exhibiting different relative
abundances were identified between the control and treatment groups
(Table SII). The relative
abundances of the Bacteroides and
Phascolarctobacterium genera showed a significant increase
following SV treatment for 2 weeks (TW10mg, TW40mg; q<0.05)
compared with that in the TW0mg group (q<0.05), whereas that of
Bifidobacterium and Tyzzerella displayed a
significant decrease (q<0.05). In addition, the relative
abundance of the genus Sutterella was significantly elevated
in the TW10mg group compared with that in the TW0mg group
(q<0.05); however, the genus Intestinimonas was less
abundant in the TW10mg group than in the TW0mg group (q<0.05).
Furthermore, the relative abundance of genus
Ruminococcaceae_UCG-009 was significantly decreased in the
TW40mg compared with in the TW0mg group. The genus
Ruminococcaceae_NK4A214 was also decreased in the FW40mg
group compared with in the FW0mg group (Fig. 3B).
A total of 35 sequences were classified to the
species level, and certain species exhibited significant
differences in relative abundance following SV treatment (Table II). A higher percentage of
Bacteroides_caccae, Parabacteroides_distasonis,
Escherichia_coli, Parasutterella_secunda and
Bacteroides_fragilis was observed in the TW10mg group, as
compared with the TW0mg group. In addition, the relative abundances
of Bacteroides_intestinalis, Bacteroides_vulgatus and
Bacteroides_uniformis were significantly increased in both
the TW10mg and TW40mg groups, whereas
Lachnospiraceae_bacterium_COE1 was less abundant. The
percentage of Clostridiales_bacterium_CIEAF_020 decreased in
the TW40mg and FW40mg groups compared with in the TW0mg and FW0mg
groups, respectively.
| Table IISignificant bacterial difference in
relative abundance of operational taxonomic units at species
level. |
Table II
Significant bacterial difference in
relative abundance of operational taxonomic units at species
level.
| Mean abundance
(SEM) |
|---|
|
|
|---|
| Species | TW0mg | TW10mg | TW40mg | FW0mg | FW10mg | FW40mg |
|---|
|
Bacteroides_caccae | 0.002989
(8.69x10⁻⁴) | 0.010917b,g
(1.72x10⁻³) | 0.001600
(2.95x10⁻⁴) | 0.001655
(2.80x10⁻⁴) | 0.009473f (9.93x10⁻⁴) | 0.001340
(1.63x10⁻⁴) |
|
Parabacteroides_distasonis | 0.014800
(2.98x10⁻³) | 0.039378b,g
(5.76x10⁻³) | 0.020773
(2.87x10⁻³) | 0.012071
(2.19x10⁻³) | 0.018321
(3.37x10⁻³) | 0.019155d (1.87x10⁻³) |
|
Escherichia_coli | 0.004394
(1.20x10⁻³) | 0.021633b,g
(1.04x10⁻²) | 0.050662a (3.36x10⁻²) | 0.004563
(1.23x10⁻³) | 0.019439
(1.15x10⁻²) | 0.000941e (2.05x10⁻⁴) |
|
Parasutterella_secunda | 0.001016
(1.92x10⁻⁴) | 0.006215b,g
(2.07x10⁻³) | 0.003664
(1.51x10⁻³) | 0.000748
(1.21x10⁻⁴) | 0.002874e (7.74x10⁻⁴) | 0.001141
(3.88x10⁻⁴) |
|
Bacteroides_intestinalis | 0.003002
(1.99x10⁻⁴) | 0.027231c,g
(4.39x10⁻³) | 0.012077c,g
(3.08x10⁻³) | 0.004957
(8.20x10⁻⁴) | 0.009997d (1.75x19−3) | 0.004368
(9.19x10⁻⁴) |
|
Lachnospiraceae_bacterium_COE1 | 0.004045
(6.14x10⁻⁴) | 0.001240b,g
(4.21x10⁻⁴) | 0.001582b,g
(2.75x10⁻⁴) | 0.001710
(2.38x10⁻⁴) | 0.003581
(1.37x10⁻³) | 0.001527
(3.11x10⁻⁴) |
|
Bacteroides_vulgatus | 0.005366
(8.79x10⁻⁴) | 0.030262b,g
(8.68x10⁻³) | 0.031679c,g
(9.06x10⁻³) | 0.005634
(5.61x10⁻⁴) | 0.005838
(9.13x10⁻⁴) | 0.009851
(2.95x10⁻³) |
|
Bacteroides_fragilis | 0.001048
(2.80x10⁻⁴) | 0.007516c,g
(1.12x10⁻³) | 0.012006a (7.10x10⁻³) | 0.00124
(3.03x10⁻⁴) | 0.004647e (1.03x10⁻³) | 0.000915
(2.30x10⁻⁴) |
|
Clostridiales_bacterium_CIEAF_020 | 0.002924
(7.63x10⁻⁴) | 0.000698a (3.70x10⁻⁴) | 0.000414c,g
(1.11x10⁻⁴) | 0.003177
(1.09x10⁻³) | 0.001118
(5.94x10⁻⁴) | 0.000326f,g
(8.39x10⁻⁵) |
|
Bacteroides_uniformis | 0.004105
(6.42x10⁻⁴) | 0.020937c,g
(6.78x10⁻³) | 0.013791b,g
(4.62x10⁻³) | 0.003054
(2.98x10⁻⁴) | 0.006017d (1.28x10⁻³) | 0.004761
(1.16x10⁻³) |
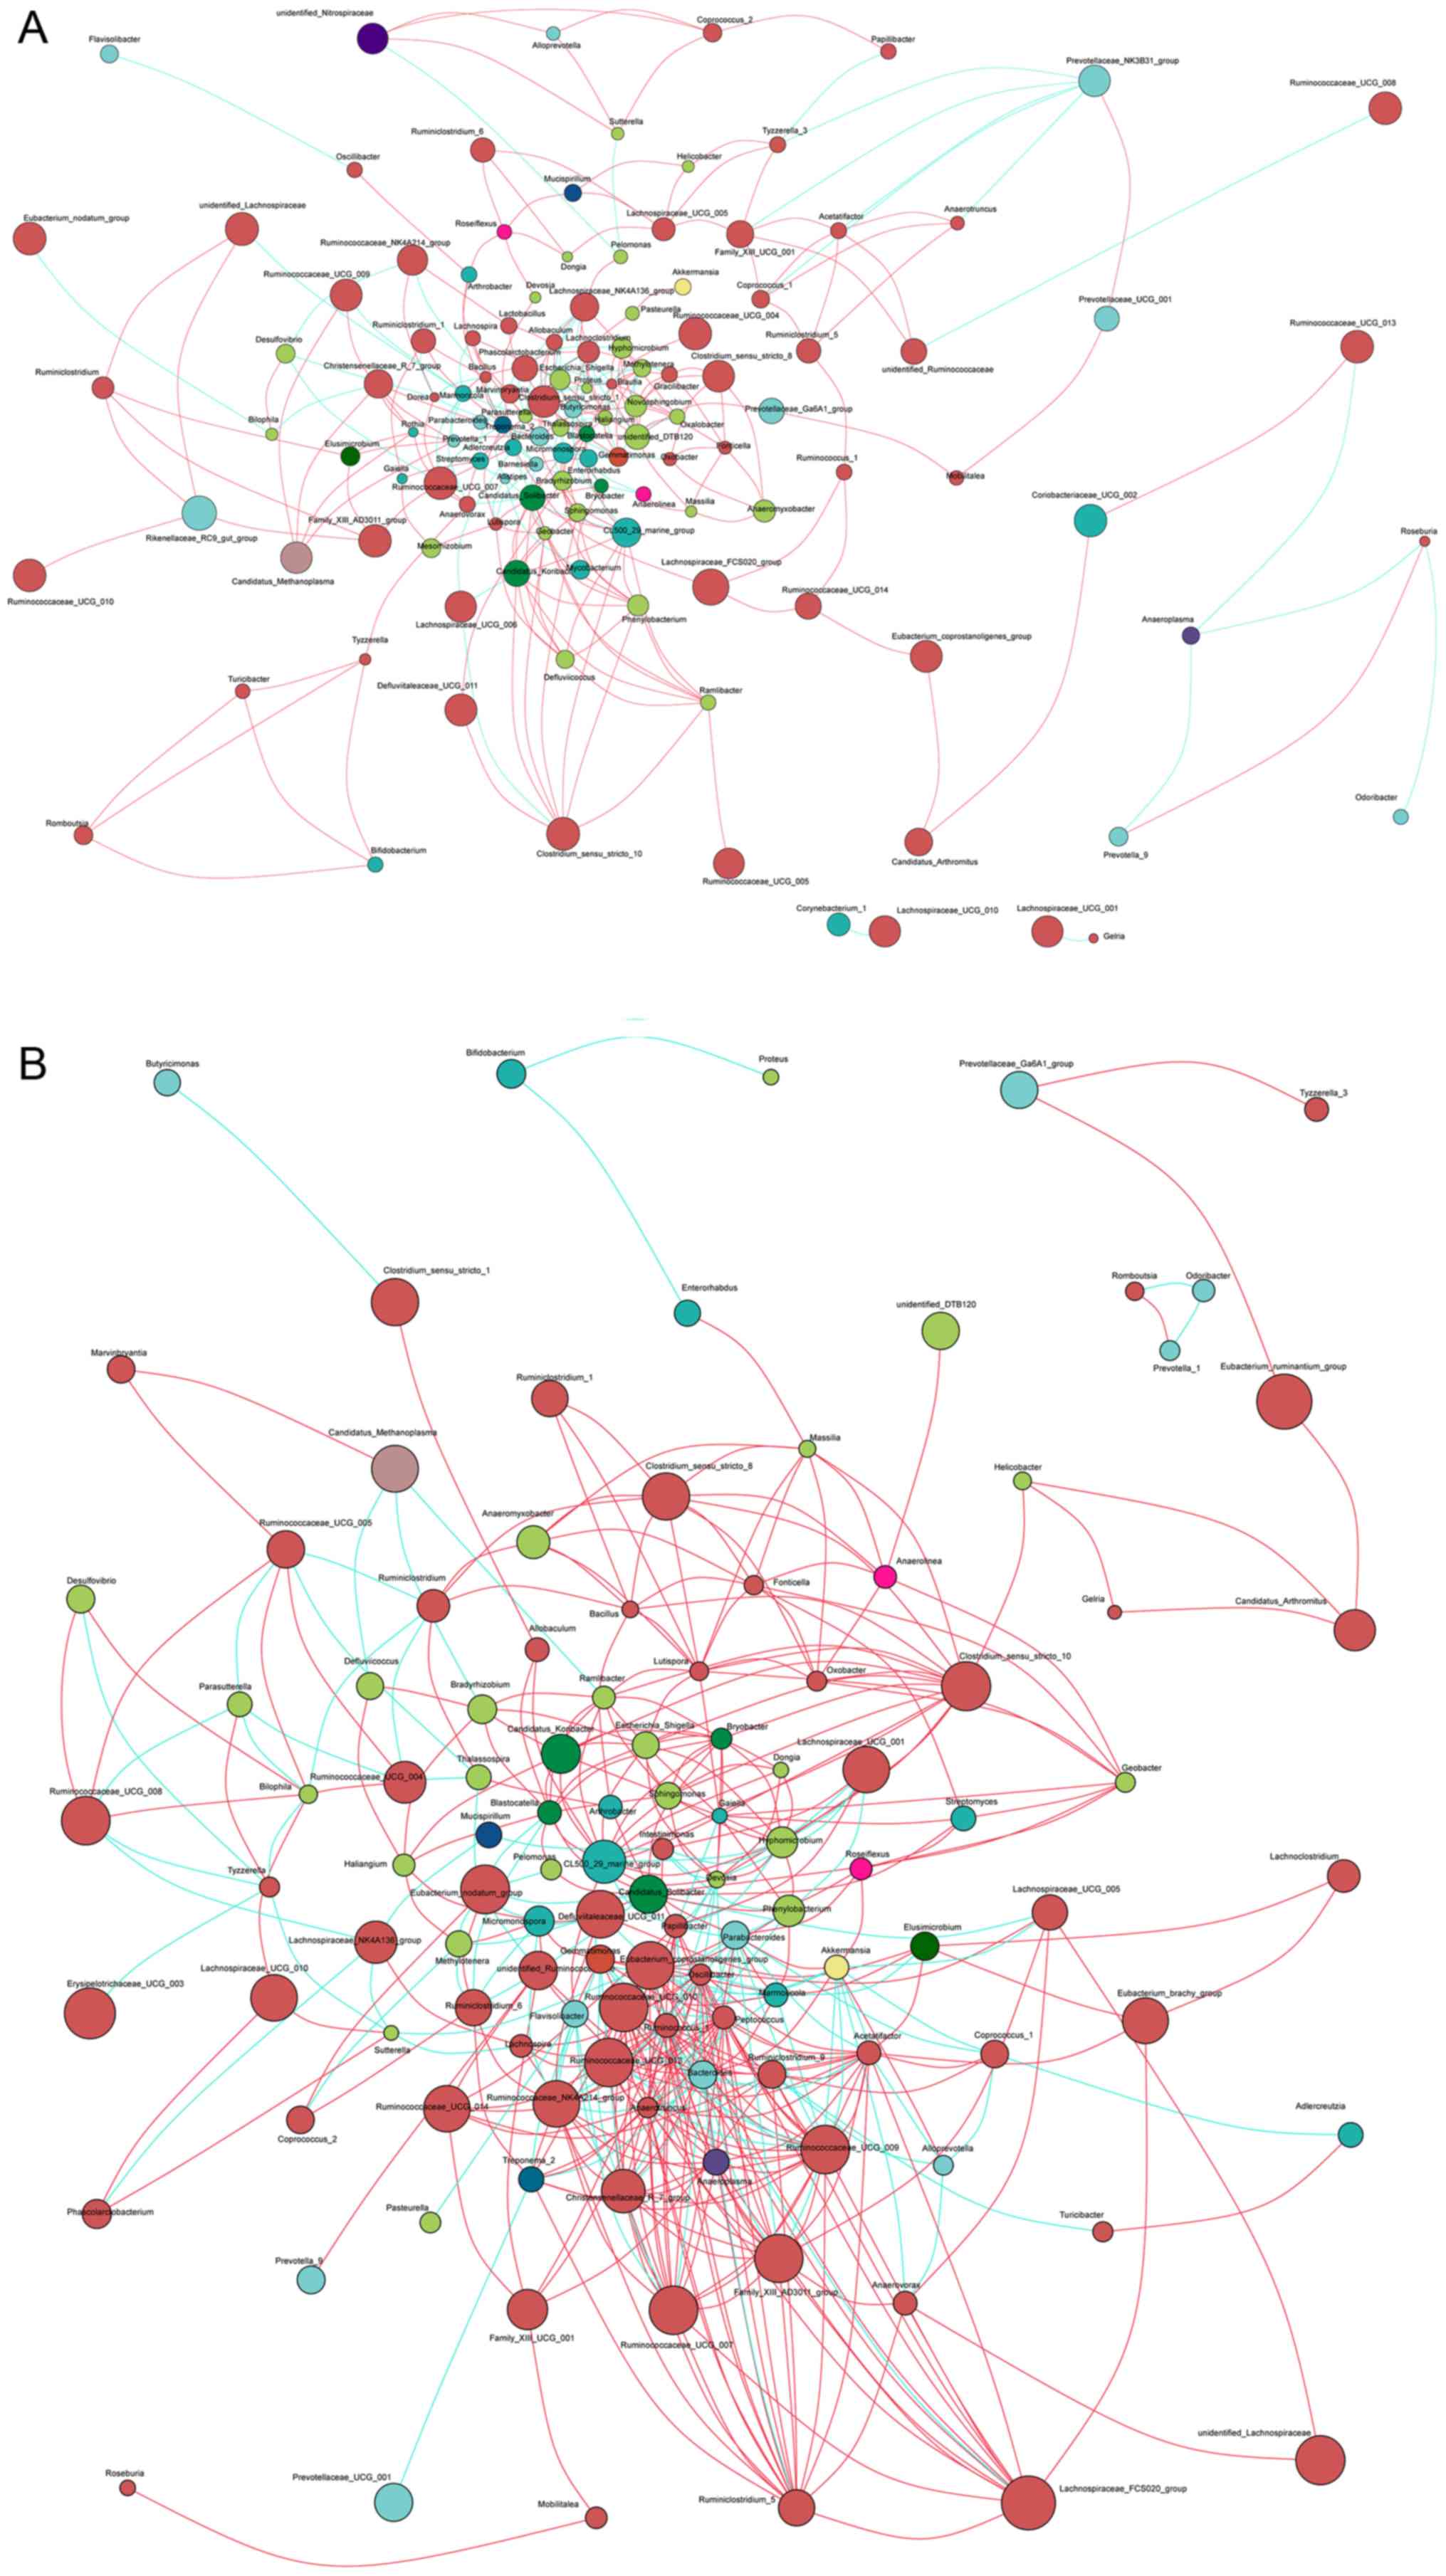
Co-occurrence networks of bacterial
genera
Based on the aforementioned analyses, the change of
the intestinal microbiota was particularly caused following SV
treatment for 2 weeks. The co-occurrence networks mainly focused on
TW0mg, TW10mg and TW40mg groups. Based on Spearman’s correlation
coefficient (r), the co-occurrence networks deduced from the genera
were separately constructed for the rats of these three groups
(Fig. 4). The results revealed
that the predominant genera were from the Firmicutes,
Bacteroidetes, Proteobacteria and
Actinobacteria phyla. Samples from the TW0mg group had a
lower network complexity than those from other groups. In addition,
genera from Bacteroidetes in the TW10mg and TW40mg groups
had a lower negative correlation with other genera, as compared
with the TW0mg group, but genera from Firmicutes and
Proteobacteria showed a higher positive correlation.
Notably, genera from the Firmicutes showed an increased
positive correlation in the TW10mg and TW40mg groups, mainly
including genera within the Ruminococcaceae,
Lachnospiraceae and Family_XIII families.
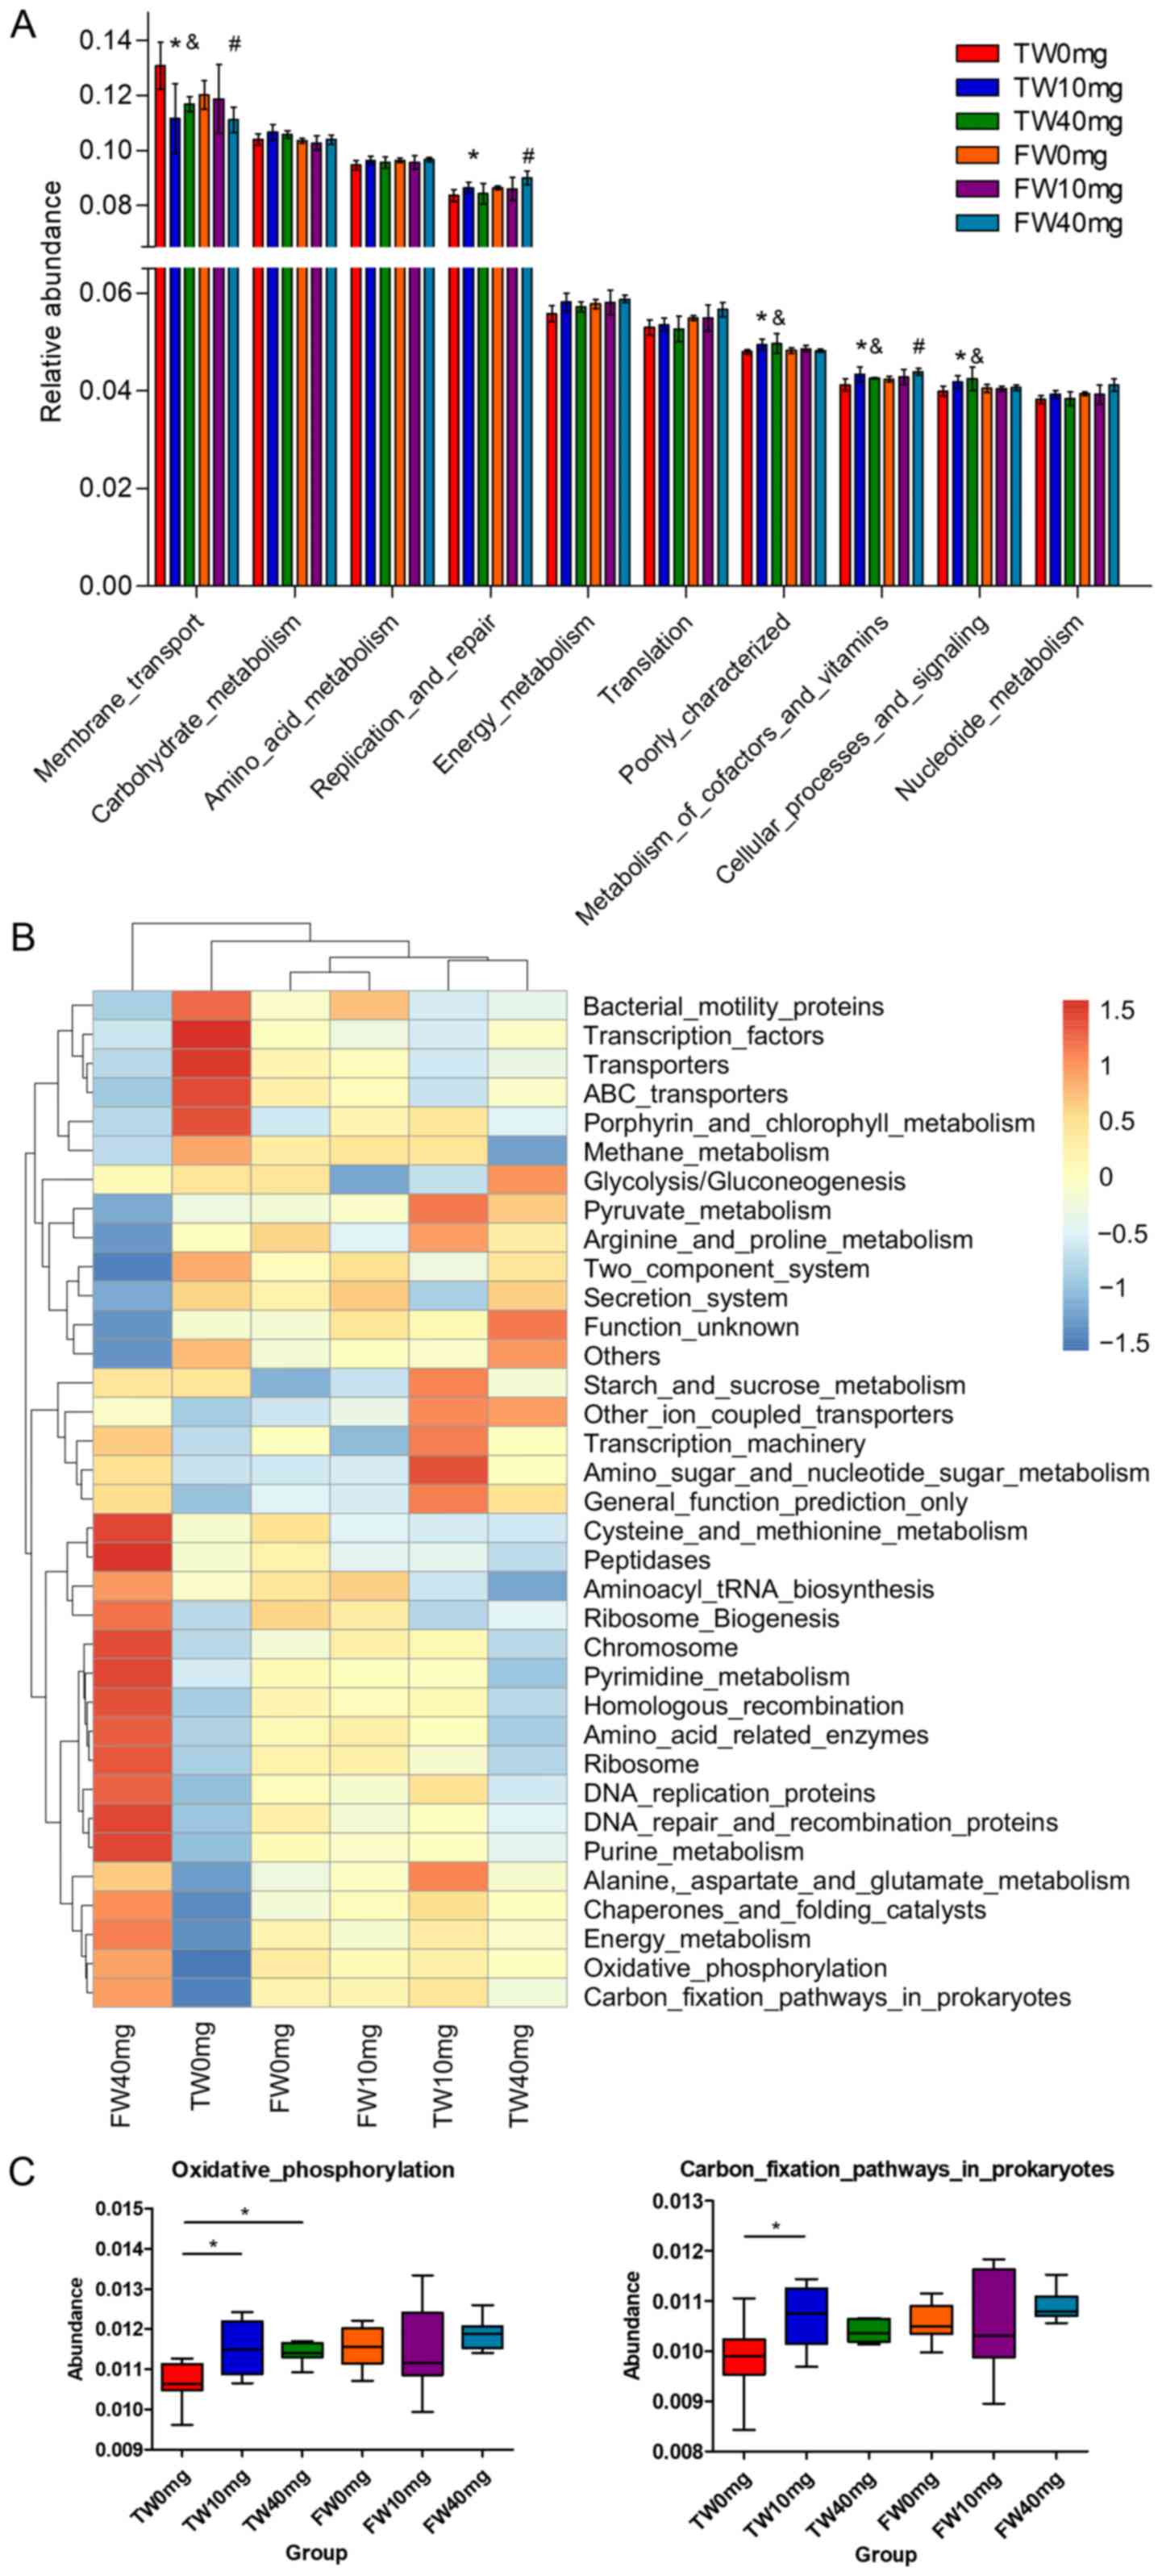
Functional annotation of the gut
microbiota following SV treatment
The function of microbiota was investigated based on
information from the 16S rRNA gene and OTUs using the PICRUSt
algorithm. From the 6,112 predicted KEGG Orthology terms, 328 KEGG
pathways were tested. The top 10 abundant categories at level 2 are
shown in Fig. 5A. The third level
of the KEGG pathway is shown in a heatmap (Fig. 5B). The SV-associated microbial
genes involved in metabolism pathways (as described below) were
emphasized. The abundances of pathways associated with ‘oxidative
phosphorylation’ and ‘carbon fixation pathways in prokaryotes’
(energy metabolism; Fig. 5C),
‘pyruvate metabolism’ and ‘amino sugar and nucleotide sugar
metabolism’ (carbohydrate metabolism; Fig. 5D), ‘amino acid related enzymes’
and ‘alanine, aspartate and glutamate metabolism’ (amino acid
metabolism; Fig. 5E), and ‘purine
metabolism’ and ‘pyrimidine metabolism’ (nucleotide metabolism;
Fig. 5F) were significantly
changed in the SV treatment groups compared with in the control
groups (TW10mg vs. TW0mg; TW40mg vs. TW0mg; FW40mg vs. FW0mg;
P<0.05). These results highlighted the importance of the gut
microbiota in these metabolic pathways.
Discussion
Statin therapy has different lipid-lowering effects
on hyperlipidemia in different individuals, while most efforts to
understand statin pharmacodynamics have focused on genetic
polymorphisms (41,42). However, growing evidences have
suggested that the gut microbiome contributes to the variability in
statin metabolism and statin response (19,43). A previous study reported that SV
is metabolized by anaerobic bacteria in human fecal suspension
(19). A recent study has
revealed that antibiotic-modulated gut microbiota could attenuate
the hypolipidemic effect of SV in high-fat diet (HFD)-fed mice
(44). These results highlighted
the potential interaction between gut microbiota and SV, both in
vivo and in vitro. Although SV is considered one of the
representative examples of microbial impact on drug
bioavailability, the molecular characterization of gut microbiota
in response to SV in high-lipid diet-induced hyperlipidemic rats is
not fully understood. In the present study, the altered
compositional and functional characteristics of gut microbiota in
response to SV treatment were observed in high-lipid diet-fed
rats.
The community richness of gut microbiota was
calculated by the OTUs, Chao1 and ACE indices, while community
diversity was explored by the Shannon and Simpson indices. As shown
by the decrease in richness and diversity indices, SV therapy
reduced not only the total number of species in gut microbiota, but
also the heterogeneity in the 2-week treatment groups. In the
4-week treatment groups, no significant change was observed in the
richness indices, whereas a significant decrease was observed in
diversity indices. A previous 1-week SV study did not report
appreciable changes in total bacteria by quantitative PCR (45). A previous 8-week SV study revealed
that the hypolipidemic effect of SV is associated with the altered
composition of the gut microbiota (44). The influence of SV (2- and 4-week
therapy) on gut microbiota lacks information and is not fully
understood. In the present study, the V3–V4 region of the 16S rRNA
gene was sequenced following 2 and 4 weeks of SV treatment, and
changes in richness and diversity of gut microbiota were
identified. Consistent with the present study, Liu et al
(43) and Sun et al
(46) reported that variation in
community richness and diversity was identified between
statin-sensitive and -insensitive patients, which may suggest that
the complexity of the fecal microbiome is closely associated with
SV therapeutic actions. Therefore, the community composition of gut
microbiota was analyzed at the phylum, genus and species levels,
and the variations among groups were observed.
Recent studies have reported that, at the phylum
level, Bacteroidetes and Firmicutes are predominant
in the gut following statin treatment during HFD (44,47). In accordance with previous
reports, the present data also demonstrated that Firmicutes
and Bacteroidetes were the dominant phyla in all samples.
From the co-occurrence networks, the increased positive correlation
within the phylum Firmicutes suggested that the 2-week SV
treatment induced strong interactions between
Ruminococcaceae, Family_XIII, Lachnospiraceae
and other bacteria within the phylum Firmicutes. This result
indicated that these associated intestinal floras may by a novel
therapeutic target for the improvement of SV efficacy. The
abundance of Bacteroidetes suggested that a higher dose of
SV treatment could cause the enrichment of Bacteroidetes in
hyperlipidemic rats following 4 weeks of treatment. A decrease in
the count of Firmicutes and an increase in that of
Bacteroidetes caused the Firmicutes to
Bacteroidetes ratio (F/B ratio) to drop from 2.05 to 0.70
following SV treatment. Consistent with the findings of the present
study, a decreased F/B ratio induced by other two statins
(atorvastatin and rosuvastatin) treatment was also observed
(47). Since the F/B ratio is
associated with metabolic disorders and is broadly considered to be
an indicator of gut microbiota dysbiosis (48), the changes in Firmicutes
and Bacteroidetes clearly suggested that SV treatment
contributed to the decline of the F/B ratio in a high-lipid model,
helping the gut microbiota regain its balance. The decrease in
Firmicutes and the increase in Bacteroides in the two
control groups (TW0mg and FW0mg) may be due to the high-lipid diet.
This was also reported by Wu et al (49) and Gentile and Weir (50).
At the genus level, Ruminococcaceae_NK4A214,
Ruminococcaceae_UCG-009 and Intestinimonas within the
family Ruminococcaceae were decreased following SV treatment
in the present study. It has been reported that the abundance of
Ruminococcaceae is associated with a positive therapeutic
effect of two statins, rosuvastatin (43) and atorvastatin (46). The results of the present study
provided more evidence that demonstrated the interaction between
Ruminococcaceae and statins. As shown in the co-occurrence
networks, higher positive correlations of genera
Ruminococcaceae_NK4A21, Ruminococcaceae_UCG-004,
Ruminococcaceae_UCG-009, etc. were observed in the 2-week
treatment groups, suggesting that the effect of SV may improve the
interaction among these bacterial floras. Ruminococcaceae
has been reported to be positively associated with the production
of short chain fatty acids (SCFAs) (51) and bile acids (52), and possesses an extraordinary
capacity for generating SCFAs and glucose (53). The genus Tyzzerella has
been identified to be enriched in patients with a high
cardiovascular disease risk profile (54); however, in the present study, a
decreased level of Tyzzerella was observed in rats following
SV treatment, suggesting that SV may reduce the risk of
cardiovascular disease by influencing the genus Tyzzerella
during the regulation of dyslipidemia. By contrast, the genus
Phascolarctobacterium within the phylum Firmicutes
was markedly increased following SV treatment. This genus is
associated with both insulin sensitivity and secretion, and
involved in the carbohydrate metabolism in overweight adults
(55). This may be due to the
production of SCFAs, including acetate and propionate (56). Briefly, the aforementioned
Firmicutes members, which were identified to be
significantly altered in the present study, suggested their
potential associations with the metabolites of SCFAs and glucose.
Since SCFAs regulate not only the gut barrier function but also
lipid, glucose and cholesterol metabolism, changes in the SCFAs
profile could impact the physiology of the host (57). These associations suggest that
Firmicutes members considerably influence hypolipidemic drug
efficacy or drug response by affecting the absorption of nutrients
and maintaining energy balance.
At the species level, the present study detected
that the proliferation of the genus Bacteroides was due to
the expansion of the species, including Bacteroides_caccae,
Bacteroides_fragilis, Bacteroides_vulgatus and
Bacteroides_uniformis, as well as
Bacteroides_intestinalis. As already reported,
Bacteroides uniformis is associated with hepatic G6pase and
farnesoid X receptor (FXR) (58).
This association suggests a potential mechanisms through which this
bacterium improves glucose tolerance (59). In addition, the species
Bacteroides fragilis is positively associated with fasting
blood glucose (60).
Bacteroides vulgatus may also reduce gut microbial
lipopolysaccharide production and inhibit atherosclerosis (61). Furthermore, Wang et al
(62) reported that
Parabacteroides distasonis within the phylum
Bacteroidetes, as a promising probiotic, could modulate the
host metabolism to alleviate obesity and metabolic dysfunctions by
generating the secondary bile acids and succinate. Consequently, it
has been accepted that these aforementioned microbial taxa at the
species level may affect physiological functions in the host and
serve a role in the statins-induced metabolic improvements. The
likely functional capacity of microbiota genes that are modulated
by SV treatment were predicted using PICRUSt. The PICRUSt approach
may cause potential biases due to the infrequent update of
GreenGene, and some OTUs could not be matched against GreenGene
(63). Additionally, functional
profiles of bacterial communities were based on the ‘common
ancestor gene’. PICRUSt was based on the OTU tree to deduce the
function of the common ancestor gene. There is an association
between the phylogenetic relatedness of organisms and their
complement of functional genes (39). Although potential biases exist,
PICRUSt has been applied to samples collected from a wide range of
habitats, including the human gastrointestinal tract (64). It must be remembered that PICRUSt
predicts the functional attributes of a microbiome rather than
identifying them directly from DNA sequences, the predictions made
by PICRUSt can serve as useful hypothesis-generating tools and
provide alternative ways to probe the structure of the microbiome
(39,65). A previous study has demonstrated
that the immune system balances the microbiota by directing the
metabolism towards oxidative phosphorylation and fatty acids
oxidation (66). The
SV-associated microbiota likely exhibited enrichment in genes for
energy metabolism, including oxidative phosphorylation in the
present study. These observations suggested that SV may target the
microbes for remediation of the immune system. Additionally, the
results demonstrated that the microbiota exhibited enrichment in
genes for the alanine, aspartate and glutamate metabolism pathway
following SV treatment. Consistent with the present study, previous
studies have reported that acetic acid could be produced by gut
bacteria like Bacteroides spp., Bifidobacterium spp.
and Ruminococuus spp. (67,68). In addition, propionic acid could
be produced from alanine and aspartate, and acetic and butyric acid
could be produced from glutamate (69). It is known that acetic, butyric
and propionic acid are the main ingredients of SCFAs (70). SCFAs inhibit insulin signal
transduction and control energy consumption by activating free
fatty acid receptor 3 and free fatty acid receptor 2 (71). Of note, intestinal bacteria like
Ruminococcaceae, Phascolarctobacterium and
Bacteroides, which are important sources of SCFAs (72), showed significant changes
following SV treatment in the present study. Previous studies have
demonstrated that gut microbiota regulates triglyceride,
cholesterol and bile acid homeostasis metabolism by influencing FXR
(73,74). In the present study, the genera
Bacteroides and Bifidobacterium, which have been
identified to be associated with bile salt hydrolases (BSH)
activity (75), were
significantly altered. The BSH-catalyzed step is considered the
‘gateway reaction’ of microbiota-mediated bile acid metabolism
(76). These findings suggested
that the effect of SV on metabolic improvements could be explained
by altered gut microbiota.
In conclusion, the findings of the present study
revealed that SV treatment could reduce gut microbial community
richness and diversity. The SV treatment also contributed to the
remodeling of the fecal bacterial community composition, mainly
including a decrease in the phylum Firmicutes and an
increase in the phylum Bacteroidetes. Furthermore, the
SV-associated modulation in gut microbiota genes has a profound
influence on the energy, carbohydrate, amino acid and nucleotide
metabolism pathways. Understanding the causal links between gut
microbiota gene content and associated-metabolic activities may
provide novel insights into potential drug targets for preventing
hyperlipidemia.
Supplementary Information
Acknowledgements
Not applicable.
Funding
The present study was supported by the National
Natural Science Foundation of China (grant no. NSFC81730056).
Availability of data and materials
The datasets used and/or analyzed during the
current study are available from the corresponding author on
reasonable request.
Authors’ contributions
SZ designed and executed the experiments, analyzed
the data and wrote the manuscript. HL, LY, JZ, LH, RL, RW, YS, NM
and SU helped perform the experiments. JX conceived and designed
the study, critically reviewed and drafted the manuscript. All
authors take responsibility for the integrity of the work as a
whole. All authors read and approved the final manuscript.
Ethics approval and consent to
participate
All animal experiments were carried out in
accordance with the National Institutes of Health Guide for the
Care and Use of Laboratory Animals and performed with the approval
of the Ethical Committee of Xi’an Jiaotong University School of
Medical Sciences (approval no. 2017-288).
Patient consent for publication
Not applicable.
Competing interests
The authors declare that they have no competing
interests.
References
|
1
|
Jain KS, Kathiravan MK, Somani RS and
Shishoo CJ: The biology and chemistry of hyperlipidemia. Bioorg Med
Chem. 15:4674–4699. 2007. View Article : Google Scholar : PubMed/NCBI
|
|
2
|
Farnier M and Davignon J: Current and
future treatment of hyperlipidemia: The role of statins. Am J
Cardiol. 82:3J–10J. 1998. View Article : Google Scholar : PubMed/NCBI
|
|
3
|
Fazio S and Linton MF: The role of
fibrates in managing hyperlipidemia: Mechanisms of action and
clinical efficacy. Curr Atheroscler Rep. 6:148–157. 2004.
View Article : Google Scholar : PubMed/NCBI
|
|
4
|
Vickers S, Duncan CA, Chen IW, Rosegay A
and Duggan DE: Metabolic disposition studies on simvastatin, a
cholesterol-lowering prodrug. Drug Metab Dispos. 18:138–145.
1990.PubMed/NCBI
|
|
5
|
Pedersen TR, Kjekshus J, Berg K, Haghfelt
T, Faergeman O, Faergeman G, Pyörälä K, Miettinen T, Wilhelmsen L,
Olsson AG, et al: Randomised trial of cholesterol lowering in 4444
patients with coronary heart disease: The scandinavian simvastatin
survival study (4S). 1994. Atheroscler Suppl. 5:81–87. 1994.
View Article : Google Scholar
|
|
6
|
Parks BW, Nam E, Org E, Kostem E, Norheim
F, Hui ST, Pan C, Civelek M, Rau CD, Bennett BJ, et al: Genetic
control of obesity and gut microbiota composition in response to
high-fat, high-sucrose diet in mice. Cell Metab. 17:141–152. 2013.
View Article : Google Scholar : PubMed/NCBI
|
|
7
|
Wikoff WR, Anfora AT, Liu J, Schultz PG,
Lesley SA, Peters EC and Siuzdak G: Metabolomics analysis reveals
large effects of gut microflora on mammalian blood metabolites.
Proc Natl Acad Sci USA. 106:3698–3703. 2009. View Article : Google Scholar : PubMed/NCBI
|
|
8
|
Gill SR, Pop M, Deboy RT, Eckburg PB,
Turnbaugh PJ, Samuel BS, Gordon JI, Relman DA, Fraser-Liggett CM
and Nelson KE: Metagenomic analysis of the human distal gut
microbiome. Science. 312:1355–1359. 2006. View Article : Google Scholar : PubMed/NCBI
|
|
9
|
Hooper LV, Littman DR and Macpherson AJ:
Interactions between the microbiota and the immune system. Science.
336:1268–1273. 2012. View Article : Google Scholar : PubMed/NCBI
|
|
10
|
Wu H, Esteve E, Tremaroli V, Khan MT,
Caesar R, Mannerås-Holm L, Ståhlman M, Olsson LM, Serino M,
Planas-Fèlix M, et al: Metformin alters the gut microbiome of
individuals with treatment-naive type 2 diabetes, contributing to
the therapeutic effects of the drug. Nat Med. 23:850–858. 2017.
View Article : Google Scholar : PubMed/NCBI
|
|
11
|
Gopalakrishnan V, Spencer CN, Nezi L,
Reuben A, Andrews MC, Karpinets TV, Prieto PA, Vicente D, Hoffman
K, Wei SC, et al: Gut microbiome modulates response to anti-PD-1
immunotherapy in melanoma patients. Science. 359:97–103. 2018.
View Article : Google Scholar
|
|
12
|
Jia W, Li H, Zhao L and Nicholson JK: Gut
microbiota: A potential new territory for drug targeting. Nat Rev
Drug Discov. 7:123–129. 2008. View Article : Google Scholar : PubMed/NCBI
|
|
13
|
Zimmermann M, Zimmermann-Kogadeeva M,
Wegmann R and Goodman AL: Mapping human microbiome drug metabolism
by gut bacteria and their genes. Nature. 570:462–467. 2019.
View Article : Google Scholar : PubMed/NCBI
|
|
14
|
Nicholson JK, Elaine H and Wilson ID: Gut
microorganisms, mammalian metabolism and personalized health care.
Nat Rev Microbiol. 3:431–438. 2005. View Article : Google Scholar : PubMed/NCBI
|
|
15
|
Simon JA, Lin F, Hulley SB, Blanche PJ,
Waters D, Shiboski S, Rotter JI, Nickerson DA, Yang H, Saad M and
Krauss RM: Phenotypic predictors of response to simvastatin therapy
among African-Americans and caucasians: The cholesterol and
pharmacogenetics (CAP) study. Am J Cardiol. 97:843–850. 2006.
View Article : Google Scholar : PubMed/NCBI
|
|
16
|
Trupp M, Zhu H, Wikoff WR, Baillie RA,
Zeng ZB, Karp PD, Fiehn O, Krauss RM and Kaddurah-Daouk R:
Metabolomics reveals amino acids contribute to variation in
response to simvastatin treatment. PLoS One. 7:e383862012.
View Article : Google Scholar : PubMed/NCBI
|
|
17
|
Kaddurah-Daouk R, Baillie RA, Zhu H, Zeng
ZB, Wiest MM, Nguyen UT, Watkins SM and Krauss RM: Lipidomic
analysis of variation in response to simvastatin in the cholesterol
and pharmacogenetics study. Metabolomics. 6:191–201. 2010.
View Article : Google Scholar : PubMed/NCBI
|
|
18
|
Kaddurah-Daouk R, Baillie RA, Zhu H, Zeng
ZB, Wiest MM, Nguyen UT, Wojnoonski K, Watkins SM, Trupp M and
Krauss RM: Enteric microbiome metabolites correlate with response
to simvastatin treatment. PLoS One. 6:e254822011. View Article : Google Scholar : PubMed/NCBI
|
|
19
|
Aura AM, Mattila I, Hyötyläinen T,
Gopalacharyulu P, Bounsaythip C, Orešič M and Oksman-Caldentey KM:
Drug metabolome of the simvastatin formed by human intestinal
microbiota in vitro. Mol Biosyst. 7:437–446. 2011. View Article : Google Scholar
|
|
20
|
Rodriguez AL, Wojcik BM, Wrobleski SK,
Myers DD Jr, Wakefield TW and Diaz JA: Statins, inflammation and
deep vein thrombosis: A systematic review. J Thromb Thrombolysis.
33:371–382. 2012. View Article : Google Scholar : PubMed/NCBI
|
|
21
|
Greenwood J, Steinman L and Zamvil SS:
Statin therapy and autoimmune disease: From protein prenylation to
immunomodulation. Nat Rev Immunol. 6:358–370. 2006. View Article : Google Scholar : PubMed/NCBI
|
|
22
|
Hennessy E, Adams C, Reen FJ and O’Gara F:
Is there potential for repurposing Statins as novel antimicrobials?
Antimicrobial Agents Chemother. 60:5111–5121. 2016. View Article : Google Scholar
|
|
23
|
Zhang Q, Wang GJ, A JY, Wu D, Zhu LL, Ma B
and Du Y: Application of GC/MS-based metabonomic profiling in
studying the lipid-regulating effects of Ginkgo biloba extract on
diet-induced hyperlipidemia in rats. Acta Pharmacol Sin.
30:1674–1687. 2009. View Article : Google Scholar : PubMed/NCBI
|
|
24
|
Xu QY, Liu YH, Zhang Q, Ma B, Yang ZD, Liu
L, Yao D, Cui GB, Sun JJ and Wu ZM: Metabolomic analysis of
simvastatin and fenofibrate intervention in high-lipid diet-induced
hyperlipidemia rats. Acta Pharmacol Sin. 35:1265–1273. 2014.
View Article : Google Scholar : PubMed/NCBI
|
|
25
|
Ozansoy G, Guven C, Ceylan A, Can B, Aktan
F, Oz E and Gönül B: Effects of simvastatin treatment on
oxidant/antioxidant state and ultrastructure of
streptozotocin-diabetic rat lung. Cell Biochem Funct. 23:421–426.
2006. View Article : Google Scholar
|
|
26
|
He Q, Qin S, Ma K, Luo S and Zhang X:
Effects of simvastatin on angiogenesis and the expression of Ang1
after myocardial infarction in rats. Heart. 96:A142010. View Article : Google Scholar
|
|
27
|
Bracht L, Barbosa CP, Caparroz-Assef SM,
Cuman RK, Ishii-Iwamoto EL, Bracht A and Bersani-Amado CA: Effects
of simvastatin, atorvastatin, ezetimibe, and ezetimibe+simvastatin
combination on the inflammatory process and on the liver metabolic
changes of arthritic rats. Fundam Clin Pharmacol. 26:722–734. 2012.
View Article : Google Scholar
|
|
28
|
Magoč T and Salzberg SL: FLASH: Fast
length adjustment of short reads to improve genome assemblies.
Bioinformatics. 27:2957–2963. 2011. View Article : Google Scholar
|
|
29
|
Bokulich NA, Subramanian S, Faith JJ,
Gevers D, Gordon JI, Knight R, Mills DA and Caporaso JG:
Quality-filtering vastly improves diversity estimates from Illumina
amplicon sequencing. Nat Methods. 10:57–59. 2013. View Article : Google Scholar
|
|
30
|
Caporaso JG, Kuczynski J, Stombaugh J,
Bittinger K, Bushman FD, Costello EK, Fierer N, Peña AG, Goodrich
JK, Gordon JI, et al: QIIME allows analysis of high-throughput
community sequencing data. Nat Methods. 7:335–336. 2010. View Article : Google Scholar : PubMed/NCBI
|
|
31
|
Edgar RC, Haas BJ, Clemente JC, Quince C
and Knight R: UCHIME improves sensitivity and speed of chimera
detection. Bioinformatics. 27:2194–2200. 2011. View Article : Google Scholar : PubMed/NCBI
|
|
32
|
Haas BJ, Gevers D, Earl AM, Feldgarden M,
Ward DV, Giannoukos G, Ciulla D, Tabbaa D, Highlander SK, Sodergren
E, et al: Chimeric 16S rRNA sequence formation and detection in
sanger and 454-pyrosequenced PCR amplicons. Genome Res. 21:494–504.
2011. View Article : Google Scholar : PubMed/NCBI
|
|
33
|
Wang Q, Garrity GM, Tiedje JM and Cole JR:
Naive Bayesian classifier for rapid assignment of rRNA sequences
into the new bacterial taxonomy. Appl Environ Microbiol.
73:5261–5267. 2007. View Article : Google Scholar : PubMed/NCBI
|
|
34
|
Quast C, Pruesse E, Yilmaz P, Gerken J,
Schweer T, Yarza P, Peplies J and Glöckner FO: The SILVA ribosomal
RNA gene database project: Improved data processing and web-based
tools. Nucleic Acids Res. 41:D590–D596. 2013. View Article : Google Scholar :
|
|
35
|
White JR, Nagarajan N and Pop M:
Statistical methods for detecting differentially abundant features
in clinical metagenomic samples. PLoS Comput Biol. 5:e10003522009.
View Article : Google Scholar : PubMed/NCBI
|
|
36
|
Benjamini Y and Hochberg Y: Controlling
the false discovery rate: A practical and powerful approach to
multiple testing. J Royal Statist Soc. 57:289–300. 1995.
|
|
37
|
Jiao S, Liu Z, Lin Y, Yang J, Chen W and
Wei G: Bacterial communities in oil contaminated soils:
Biogeography and co-occurrence patterns. Soil Biol Biochem.
98:64–73. 2016. View Article : Google Scholar
|
|
38
|
Qin J, Li Y, Cai Z, Li S, Zhu J, Zhang F,
Liang S, Zhang W, Guan Y, Shen D, et al: A metagenome-wide
association study of gut microbiota in type 2 diabetes. Nature.
490:55–60. 2012. View Article : Google Scholar : PubMed/NCBI
|
|
39
|
Langille MG, Zaneveld J, Caporaso JG,
McDonald D, Knights D, Reyes JA, Clemente JC, Burkepile DE, Vega
Thurber RL, Knight R, et al: Predictive functional profiling of
microbial communities using 16S rRNA marker gene sequences. Nat
Biotechnol. 31:814–821. 2013. View Article : Google Scholar : PubMed/NCBI
|
|
40
|
Kanehisa M, Goto S, Sato Y, Kawashima M,
Furumichi M and Tanabe M: Data, information, knowledge and
principle: Back to metabolism in KEGG. Nucleic Acids Res.
42:D199–D205. 2014. View Article : Google Scholar :
|
|
41
|
Mega JL, Morrow DA, Brown A, Cannon CP and
Sabatine MS: Identification of genetic variants associated with
response to statin therapy. Arterioscler Thromb Vasc Biol.
29:1310–1315. 2009. View Article : Google Scholar : PubMed/NCBI
|
|
42
|
Barber MJ, Mangravite LM, Hyde CL, Chasman
DI, Smith JD, McCarty CA, Li X, Wilke RA, Rieder MJ, Williams PT,
et al: Genome-wide association of lipid-lowering response to
statins in combined study populations. PLoS One. 5:e97632010.
View Article : Google Scholar : PubMed/NCBI
|
|
43
|
Liu Y, Song X, Zhou H, Zhou X, Xia Y, Dong
X, Zhong W, Tang S, Wang L, Wen S, et al: Gut microbiome associates
with lipid-lowering effect of rosuvastatin in vivo. Front
Microbiol. 9:5302018. View Article : Google Scholar :
|
|
44
|
He X, Zheng N, He J, Liu C, Feng J, Jia W
and Li H: Gut microbiota modulation attenuated the hypolipidemic
effect of simvastatin in high-fat/cholesterol-diet fed mice. J
Proteome Res. 16:1900–1910. 2017. View Article : Google Scholar : PubMed/NCBI
|
|
45
|
Catry E, Pachikian BD, Salazar N, Neyrinck
AM, Cani PD and Delzenne NM: Ezetimibe and simvastatin modulate gut
microbiota and expression of genes related to cholesterol
metabolism. Life Sci. 132:77–84. 2015. View Article : Google Scholar : PubMed/NCBI
|
|
46
|
Sun B, Li L and Zhou X: Comparative
analysis of the gut microbiota in distinct statin response patients
in East China. J Microbiol. 56:886–892. 2018. View Article : Google Scholar : PubMed/NCBI
|
|
47
|
Kim J, Lee H, An J, Song Y, Lee CK, Kim K
and Kong H: Alterations in gut microbiota by statin therapy and
possible intermediate effects on hyperglycemia and hyperlipidemia.
Front Microbiol. 10:19472019. View Article : Google Scholar : PubMed/NCBI
|
|
48
|
Ley RE, Turnbaugh PJ, Klein S and Gordon
JI: Microbial ecology: Human gut microbes associated with obesity.
Nature. 444:1022–1023. 2006. View Article : Google Scholar : PubMed/NCBI
|
|
49
|
Wu GD, Chen J, Hoffmann C, Bittinger K,
Chen YY, Keilbaugh SA, Bewtra M, Knights D, Walters WA, Knight R,
et al: Linking long-term dietary patterns with gut microbial
enterotypes. Science. 334:105–108. 2011. View Article : Google Scholar : PubMed/NCBI
|
|
50
|
Gentile CL and Weir TL: The gut microbiota
at the intersection of diet and human health. Science. 362:776–780.
2018. View Article : Google Scholar : PubMed/NCBI
|
|
51
|
Daniel H, Gholami AM, Berry D,
Desmarchelier C, Hahne H, Loh G, Mondot S, Lepage P, Rothballer M,
Walker A, et al: High-fat diet alters gut microbiota physiology in
mice. ISME J. 8:295–308. 2014. View Article : Google Scholar :
|
|
52
|
Lin H, An Y, Hao F, Wang Y and Tang H:
Correlations of fecal metabonomic and microbiomic changes induced
by high-fat diet in the pre-obesity state. Sci Rep. 6:216182016.
View Article : Google Scholar : PubMed/NCBI
|
|
53
|
Backhed F, Ding H, Wang T, Hooper LV, Koh
GY, Nagy A, Semenkovich CF and Gordon JI: The gut microbiota as an
environmental factor that regulates fat storage. Proc Natl Acad Sci
USA. 101:15718–15723. 2004. View Article : Google Scholar : PubMed/NCBI
|
|
54
|
Kelly TN, Bazzano LA, Ajami NJ, He H, Zhao
J, Petrosino JF, Correa A and He J: Gut microbiome associates with
lifetime cardiovascular disease risk profile among bogalusa heart
study participants. Circ Res. 119:956–964. 2016. View Article : Google Scholar : PubMed/NCBI
|
|
55
|
Muñiz Pedrogo DA, Jensen MD, Van Dyke CT,
Murray JA, Woods JA, Chen J, Kashyap PC and Nehra V: Gut microbial
carbohydrate metabolism hinders weight loss in overweight adults
undergoing lifestyle intervention with a volumetric diet. Mayo Clin
Proc. 93:1104–1110. 2018. View Article : Google Scholar : PubMed/NCBI
|
|
56
|
Wu F, Guo X, Zhang J, Zhang M, Ou Z and
Peng Y: Phascolarctobacterium faecium abundant colonization in
human gastrointestinal tract. Exp Ther Med. 14:3122–3126. 2017.
View Article : Google Scholar : PubMed/NCBI
|
|
57
|
Canfora EE, Jocken JW and Blaak EE:
Short-chain fatty acids in control of body weight and insulin
sensitivity. Nat Rev Endocrinol. 11:577–591. 2015. View Article : Google Scholar : PubMed/NCBI
|
|
58
|
Rodrigues RR, Greer RL, Dong X, Dsouza KN,
Gurung M, Wu JY, Morgun A and Shulzhenko N: Antibiotic-induced
alterations in gut microbiota are associated with changes in
glucose metabolism in healthy mice. Front Microbiol. 8:23062017.
View Article : Google Scholar : PubMed/NCBI
|
|
59
|
Gauffin Cano P, Santacruz A, Moya A and
Sanz Y: Bacteroides uniformis CECT 7771 ameliorates metabolic and
immunological dysfunction in mice with high-fat-diet induced
obesity. PLoS One. 7:e410792012. View Article : Google Scholar : PubMed/NCBI
|
|
60
|
Kim MS, Hwang SS, Park EJ and Bae JW:
Strict vegetarian diet improves the risk factors associated with
metabolic diseases by modulating gut microbiota and reducing
intestinal inflammation. Environ Microbiol Rep. 5:765–775.
2013.PubMed/NCBI
|
|
61
|
Yoshida N, Emoto T, Yamashita T, Watanabe
H, Hayashi T, Tabata T, Hoshi N, Hatano N, Ozawa G, Sasaki N, et
al: Bacteroides vulgatus and bacteroides dorei reduce gut microbial
lipopolysaccharide production and inhibit atherosclerosis.
Circulation. 138:2486–2498. 2018. View Article : Google Scholar : PubMed/NCBI
|
|
62
|
Wang K, Liao M, Zhou N, Bao L, Ma K, Zheng
Z, Wang Y, Liu C, Wang W, Wang J, et al: Parabacteroides distasonis
alleviates obesity and metabolic dysfunctions via production of
succinate and secondary bile acids. Cell Rep. 26:222–235. e2252019.
View Article : Google Scholar : PubMed/NCBI
|
|
63
|
Balvočiūtė M and Huson DH: SILVA, RDP,
greengenes, NCBI and OTT-how do these taxonomies compare? BMC
Genomics. 18(Suppl 2): 1142017. View Article : Google Scholar
|
|
64
|
Gevers D, Kugathasan S, Denson LA,
Vazquez-Baeza Y, Van Treuren W, Ren B, Schwager E, Knights D, Song
SJ, Yassour M, et al: The treatment-naive microbiome in new-onset
crohn’s disease. Cell Host Microbe. 15:382–392. 2014. View Article : Google Scholar : PubMed/NCBI
|
|
65
|
Douglas GM, Beiko RG and Langille MGI:
Predicting the functional potential of the microbiome from marker
genes using PICRUSt. Methods Mol Biol. 1849:169–177. 2018.
View Article : Google Scholar : PubMed/NCBI
|
|
66
|
Litvak Y, Byndloss MX and Baumler AJ:
Colonocyte metabolism shapes the gut microbiota. Science.
362:eaat9076. 2018. View Article : Google Scholar : PubMed/NCBI
|
|
67
|
Louis P, Hold GL and Flint HJ: The gut
microbiota, bacterial metabolites and colorectal cancer. Nat Rev
Microbiol. 12:661–672. 2014. View Article : Google Scholar : PubMed/NCBI
|
|
68
|
Rey FE, Faith JJ, Bain J, Muehlbauer MJ,
Stevens RD, Newgard CB and Gordon JI: Dissecting the in vivo
metabolic potential of two human gut acetogens. J Biol Chem.
285:22082–22090. 2010. View Article : Google Scholar : PubMed/NCBI
|
|
69
|
Davila AM, Blachier F, Gotteland M,
Andriamihaja M, Benetti PH, Sanz Y and Tomé D: Intestinal luminal
nitrogen metabolism: Role of the gut microbiota and consequences
for the host. Pharmacol Res. 68:95–107. 2013. View Article : Google Scholar
|
|
70
|
Kasubuchi M, Hasegawa S, Hiramatsu T,
Ichimura A and Kimura I: Dietary gut microbial metabolites,
short-chain fatty acids, and host metabolic regulation. Nutrients.
7:2839–2849. 2015. View Article : Google Scholar : PubMed/NCBI
|
|
71
|
Kimura I, Ozawa K, Inoue D, Imamura T,
Kimura K, Maeda T, Terasawa K, Kashihara D, Hirano K, Tani T, et
al: The gut microbiota suppresses insulin-mediated fat accumulation
via the short-chain fatty acid receptor GPR43. Nat Commun.
4:18292013. View Article : Google Scholar : PubMed/NCBI
|
|
72
|
Zhang J, Guo Z, Xue Z, Sun Z, Zhang M,
Wang L, Wang G, Wang F, Xu J, Cao H, et al: A phylo-functional core
of gut microbiota in healthy young chinese cohorts across
lifestyles, geography and ethnicities. ISME J. 9:1979–1990. 2015.
View Article : Google Scholar : PubMed/NCBI
|
|
73
|
Li T and Chiang JY: Bile acid signaling in
metabolic disease and drug therapy. Pharmacol Rev. 66:948–983.
2014. View Article : Google Scholar : PubMed/NCBI
|
|
74
|
Sayin SI, Wahlström A, Felin J, Jäntti S,
Marschall HU, Bamberg K, Angelin B, Hyötyläinen T, Orešič M and
Bäckhed F: Gut microbiota regulates bile acid metabolism by
reducing the levels of tauro-beta-muricholic acid, a naturally
occurring FXR antagonist. Cell Metab. 17:225–235. 2013. View Article : Google Scholar : PubMed/NCBI
|
|
75
|
Long SL, Gahan CGM and Joyce SA:
Interactions between gut bacteria and bile in health and disease.
Mol Aspects Med. 56:54–65. 2017. View Article : Google Scholar : PubMed/NCBI
|
|
76
|
Parasar B, Zhou H, Xiao X, Shi Q, Brito IL
and Chang PV: Chemoproteomic profiling of gut microbiota-associated
bile salt hydrolase activity. ACS Cent Sci. 5:867–873.
2019.PubMed/NCBI
|