Introduction
Polycystic ovary syndrome (PCOS) is the most common
hormonal disorder affecting women between the ages of 18 and 44
years. The characteristics of PCOS include hyperandrogenism,
ovulatory dysfunction and polycystic ovaries (1). The pathogenesis of PCOS remains
unclear and is generally considered to be caused by a combination
of genetic and environmental factors, such as long-term exposure to
high levels of androgens in utero. The prevalence of PCOS
depends on the selection of the diagnostic criteria.
Epidemiological studies based on the Rotterdam criteria revealed
that approximately 18% of women suffer from PCOS, which affects 116
million women worldwide (2,3).
At present, PCOS is incurable. Current treatments, such as the
administration of metformin and anti-androgen to improve
hyperandrogenism, the birth control pill to regulate menstruation,
lifestyle changes, such as weight loss, exercise, etc., all address
mainly the symptoms of PCOS (4).
The United States spent a reported $4.36 billion on medical care
for its 4 million patients with PCOS in 2005 (5). PCOS is one of the leading causes of
infertility today, severely affecting the health of women.
Insulin resistance (IR) refers to the abnormal
physiological phenomena including the weakening effects of
pancreatic β cells and the reduced sensitivity of peripheral tissue
to insulin. In 1980, Burghen et al first proposed the
involvement of IR in PCOS, and in 1989 Dunaif et al found
that approximately 20% of obese women with PCOS suffered from IR
(6,7). A previous study demonstrated that a
number of lean patients with PCOS also suffered from IR, and the
lean patients with PCOS with normal insulin levels were
significantly more likely to suffer from post-prandial
hyperinsulinemia (8). According
to a systematic review and meta-analysis, and as previously
demonstrated, patients with PCOS and IR (PCOS-IR) were more likely
to have long-term complications, such as glucose metabolic
abnormalities, type 2 diabetes, cardiovascular disease and
unopposed estrogen effects on the endometrium, compared with
patients with PCOS alone (9,10),
thus indicating that IR and hyperinsulinism may play an important
role in the pathophysiology of PCOS. A previous study also
confirmed that women with PCOS and IR were more inclined to suffer
from metabolic disorders, such as upregulated blood glucose, blood
lipid and uric acid levels (11).
It has been demonstrated that early diagnosis and
timely treatment can significantly delay the occurrence of
short-term and long-term severe complications, such as infertility,
type 2 diabetes and endometrial carcinoma in patients with PCOS
(12,13). For instance, a number of scholars
used Diane-35 and metformin for the treatment of PCOS-IR women
diagnosed with early endometrial cancer. Following 6 months of
co-treatment, body weight (BW), body mass index (BMI), total
testosterone (TT), free androgen index (FAI), insulin area under
curve (IAUC) and homeostasis model assessment of insulin resistance
(HOMA-IR) markers were significantly reduced, in combination with a
significant increase in sex hormone binding globulin (SHBG).
Diane-35 and metformin co-treatment successfully transformed the
hyperplasia of endometrial into normal endometrial and reversed the
progression of endometrial carcinoma (14).
Currently, various methods are available for the to
diagnosis of IR, among which the hyperinsulinemic euglycemic clamp
(HEC) is the golden standard (15,16). However, due to the high cost and
complications associated with the surgery, its use is limited in
clinical practice. It has been demonstrated that fasting insulin,
an assessment index for IR, can only be applied to the non-diabetic
group (17). HOMA-IR has a good
association with HEC, which is suitable for both diabetics and
non-diabetics. However, the value of HOMA-IR is calculated based on
the fasting homeostasis data, which cannot truly reflect the
dynamic process of insulin in the body (18,19). Therefore, it is important to
identify specific protein markers which are sensitive to
distinguishing the IR status of PCOS patients. The present study
conducted a proteomics-based approach to identify and select novel
protein markers associated with IR in the serum of patients with
PCOS-IR.
Materials and methods
Clinical specimens
Total 218 patients with PCOS were recruited at
Guangdong Maternal and Child Health Hospital from January, 2013 to
February, 2014. The patients who were recruited for the study had
to simultaneously meet the following four criteria: i) Subjects
were 18–35 years of age; ii) the criteria for the diagnosis of PCOS
were based on the revised diagnostic criteria announced in the 2003
by the European Society for Human Reproduction and
Embryology/American Society for Reproductive Medicine (ESHRE/ASRM),
which includes two of the following: Clinical and/or biochemical
hyperandrogenism; oligo-ovulation or anovulation; polycystic
ovaries detected by ultrasound; iii) the subjects had no medication
history over the past 3 months prior to the first diagnosis that
confirmed PCOS; iv) subjects voluntary participated and conformed
well to this clinical study. The exclusion criteria were the
following: i) Hormone drugs or drugs that affect insulin production
were taken during the past 3 months prior to enrollment; ii)
pregnant or lactating women; iii) patients with cardiovascular
disease, liver and kidney, hematopoietic system and other diseases;
iv) patients suspected to suffer from malignant tumors and adrenal
disease; v) patients with glucose-6-phosphate deoxydase deficiency;
and vi) BMI <18 kg/m2. The patients were assessed
according to the homeostasis model assessment and were divided into
the PCOS-IR group (n=84) and the PCOS-NIR group (n=134). Blood
specimens were obtained at the early stage of the follicular phase
(3–5 days of the cycle) in women with regular menstruation and
randomized in women with amenorrhea. The present study was approved
by the Ethics Committee of the Guangdong Provincial Maternal and
Child Health Hospital and all patients signed written informed
consent to participate.
Sample preparation
Following the collection, all samples were placed at
room temperature for 2 h and the supernatants were then centrifuged
at 15,000 × g and at 4°C to remove lipids. Albumin and IgG were
removed using the Proteo Extract Albumin/IgG Removal kit (Merck
& Co., Inc.) according to the manufacturer’s instructions.
Subsequently, the samples were resuspended in lysis buffer (30 mM
Tris-HCl, 7 M urea, 2 M thiourea, 4% CHAPS, at pH 8.5), and
incubated on ice for 30 min. The suspended samples were then
centrifuged at 15,000 × g and at 4°C for 30 min. Protein
concentrations were determined using the 2D Quant kit (GE
Healthcare BioSciences) according to the manufacturer’s protocol.
Finally, the proteins were freeze-dried. All the other reagents
were supplied by Sigma-Aldrich; Merck KGaA unless otherwise
indicated.
Two-dimensional difference gel
electrophoresis (2D-DIGE)
Serum from patients in the PCOS-IR group and the
PCOS-NIR group was randomly selected for 2D-DIGE analysis. Due to
financial constraints, 20 subjects out of the total nmber of
clinical samples were randomly selected to perform 2D-DIGE
analysis. 2D-DIGE is the most commonly used method in proteomics.
2D-DIGE combined with digital image analysis markedly improves the
statistical evaluation of proteome variation (20,21). The amount of 50 μg of proteins was
minimally labelled with CyDyes at the ratio of 1 μg protein: 8 pmol
Cy3 or Cy5 protein-labeling dye (GE Healthcare BioSciences)
according to the manufacturer’s protocol. Cy3 or Cy5 were used to
label the samples and Cy2 was used to label the internal standard
(a pool of all the samples). Each labeled sample was applied to a
24-cm immobilized pH gradient gel strip (immobilized pH gradient
strip pH 3 to 10 NL) for separation in the first dimension. The
first dimension isoelectric focusing was carried out at 20°C in
IPGphor III (GE Healthcare BioSciences). The strips were then
loaded onto a 24×24 cm 12% polyacrylamide gel using low
fluorescence glass plates and subjected to an electric field in the
DALT Six (GE Healthcare BioSciences). Subsequently, the gels were
scanned on a Typhoon 9400 imager (GE Healthcare BioSciences) and
analyzed with the DeCyder 2D Software V6.5 (GE Healthcare
BioSciences). The protein spots, which were shown to be
differentially expressed between both groups (filtering conditions:
At least 50% change of ratios between both groups. The spot picking
gel without labeling by CyDyes was made with 600 μg of pooled
protein sample and stained with colloidal coomassie blue G-250. The
matched spots were selected by the Ettan Spot Picker (GE Healthcare
BioSciences).
Matrix-assisted laser desorption
ionization/time off light MS (MALDI-TOF-MS/MS) analysis and protein
identification
The collected spots were destained with 50%
acetonitrile/100 mM NH4HCO3. After 10 min, 2
μl of 25 ng/ml trypsin diluted in 50 mM
NH4HCO3 were added to each gel piece and 30
μl of 50 mM NH4HCO3 were then added followed
by incubation overnight at 37°C. The peptide mixtures from the gel
pieces were extracted and dry-digested using a vacuum pump.
Subsequently, 2 μl 50% acetonitrile/0.1% TFA and 0.5 μl matrix
solution containing CHCA saturated in 50% acetonitrile/0.1% TFA
were used to redissolve the powder. The samples were then analyzed
using the ABI 4800 Proteomics Analyzer MALDI-TOF/TOF mass
spectrometer (Applied Biosystems). For most mass spectrometers, the
upper limit for m/z is between 650 and 800. MS/MS analyses were
performed at collision energy of 2 KV with air. The Mascot search
engine (version 2.1, Matrix Science) and the GPS Explorer™ software
version 3.6.2 (Applied Biosystems) were used to explore the tandem
mass spectra and peptide and protein. The Mascot searching engine
was used to identify the protein.
Western blot analysis
Proteins used for western blot analysis were
extracted from human serum by ultracentrifugation at 15,000 × g for
30 min at 4°C. The protein concentrations were then quantified by
the bicinchoninic acid (BCA) protein determination method and a
total of 100 μg proteins were selected for further analysis.
Firstly, 2 volumes of acetonitrile were used to remove the peak
proteins in the serum. The remaining proteins were divided into
equal portions, one for detecting the target protein, and the other
for Coomassie bright blue staining. The proteins were separated by
12% polyacrylamide gel electrophoresis and the proteins were then
transferred onto a nitrocellulose membrane. The membrane was then
incubated in blocking buffer for 1 h at room temperature and
incubated with the primary anti-apolipoprotein C3 (APOC3) rabbit
monoclonal antibody (1:2,000; ab76305, Abcam) overnight at 4°C,
followed by incubation with a horseradish peroxidase-conjugated
secondary antibody (1:5,000; 7074, Cell Signaling Technology) for 1
h at room temperature. The signal was visualized by ECL solution
and the ImageQuant image analysis system (optical storm scanners,
Molecular Dynamics).
Enzyme-linked immunosorbent assay
(ELISA)
Serum APOC3 concentrations were measured using the
Human APOC3 ELISA kit (Blue Gene Biotech) according to the
manufacturer’s protocols. A solution was added to terminate the
reaction, which turned the solution yellow. The optical density
(OD) of plasma APOC3 was measured spectrophotometrically at 450 nm
using a microplate reader (PW-812, Shenzhen Huisong Technology
Development Co., Ltd.). A standard curve was plotted according to
OD of the concentration of standards. The APOC3 concentration in
each sample was examined from this standard curve.
Statistical analysis
For statistical analysis, SPSS 20.0 software was
used. In order to prevent and control the result error caused by
the quantitative difference between the groups, the same number of
cases, which were used in the subsequent proteomics analysis,
western blot analysis and so on, were selected for comparison. The
parametric variables were analyzed by normal distribution and
homogeneity of variance. The Student’s t-test was applied for
comparisons between the PCOS-IR group and the PCOS-NIR group. For
non-normally distributed data, the Wilcoxon rank sum test was used.
The area under curve (AUC) value, optimal cut-off value,
sensitivity and specificity were determined using
receiver-operating characteristic (ROC) curve. Linear regression
analysis was performed to examine the correlation between APOC3 and
HOMA-IR. P<0.05 was considered to indicate statistically
significant differences. The data are presented as the means ±
standard error of mean (SEM).
Results
Severe disruption of metabolic parameters
in the PCOS-IR group
A total of 218 PCOS patients were recruited at
Guangdong Women and Children’s Hospital from January, 2013 to
February, 2014. Among these, 84 patients with HOMA-IR ≥2.69 were
recruited into the PCOS-IR group and 134 patients with HOMA-IR
<2.69 were recruited into the PCOS-NIR group. As illustrated in
Table I, statistically
significantly differences were observed in BMI, waist circumference
(WC) and the waist-hip ratio (WHR) between the PCOS-IR and the
PCOS-NIR groups (P<0.001). The biochemical results revealed that
triglycerides (TG), cholesterol (TCH), low-density lipoprotein
(LDL), fasting plasma glucose (FPG) and uric acid (UA) levels were
significantly higher in the PCOS-IR group (P<0.01) than in the
PCOS-NIR group. The level of 3-h blood glucose (3hBG) (Z=−2.70,
P=0.007) was also higher in the PCOS-IR group. No significant
differences were observed in the levels of high-density lipoprotein
(HDL), 1-h blood glucose (1hBG) and 2-h blood glucose (2hBG)
between the groups (P>0.05) (Table II).
 | Table IBasic clinical data of the patients in
the PCOS-IR and the PCOS-NIR groups. |
Table I
Basic clinical data of the patients in
the PCOS-IR and the PCOS-NIR groups.
| Group | No. of patients | Age (years) | BMI
(kg/cm2) | WC (cm) | HC (cm) | WHR |
|---|
| PCOS-NIR | 134 | 24.4±4.6 | 21.02±3.06 | 74.65±7.99 | 96.97±82.83 | 0.83±0.09 |
| PCOS-IR | 84 | 25.2±5.9 | 25.78±3.65 | 87.3±12.67 | 98.74±7.13 | 0.88±0.11 |
| t value | | − 1.098 | − 10.14 | − 8.54 | − 0.183 | − 3.844 |
| P-value | | 0.274 | <0.001a | <0.001a | 0.855 | <0.001a |
| Table IIMetabolic characteristics of the
patients in the PCOS-IR and PCOS-NIR groups. |
Table II
Metabolic characteristics of the
patients in the PCOS-IR and PCOS-NIR groups.
| Group | TCH (mmol/) | TG (mmol/l) | HDL (mmol/l) | LDL (mmol/l) | FPG (mmol/) | 1 hBG (mmol/) | 2 hBG (mmol/l) | 3hBG (mmol/l) | UA
(μmol/l) |
|---|
| PCOS-NIR
(n=134) | 4.52±0.95 | 1.26
(0.71–1.34) | 1.22±0.36 | 2.69±0.68 | 4.86±0.31 | 7.98±4.78 | 6.55±3.11 | 5.15
(4.11–5.87) | 289.00±92.31 |
| PCOS-IR (n=84) | 4.98±1.02 | 1.92
(1.02–2.44) | 1.17±0.63 | 3.29±0.91 | 5.20±0.55 | 8.84±2.37 | 7.87±2.23 | 5.77
(4.38–7.08) | 351.60±102.34 |
| t/z | − 3.38 | − 5.73 | − 0.81 | −5.22 | −5.16 | −1.54 | − 1.1 | − 2.70 | − 3.21 |
| P-value | 0.001a | <0.001a | 0.422 | <0.001a | <0.001a | 0.125 | 0.275 | 0.007a | 0.002a |
Significantly differences in proteomics
results between the PCOS-IR and PCOS-NIR groups
A total of 12 paired serum samples from the PCOS-IR
and PCOS-NIR groups were randomly selected for 2D-DIGE and the
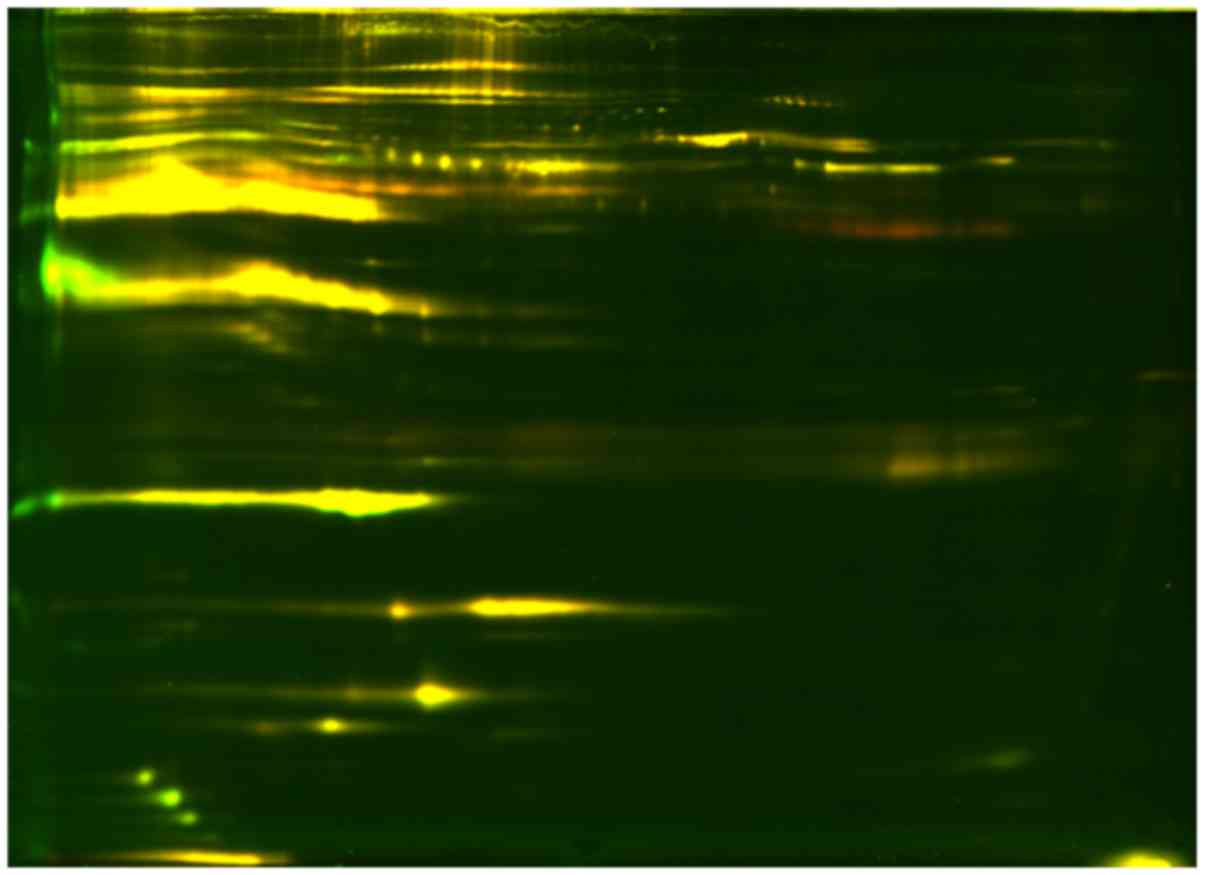
MALDI-TOF-MS/MS analysis. A section of the gel labeled with the
DIGE dyes is presented in Fig. 1.
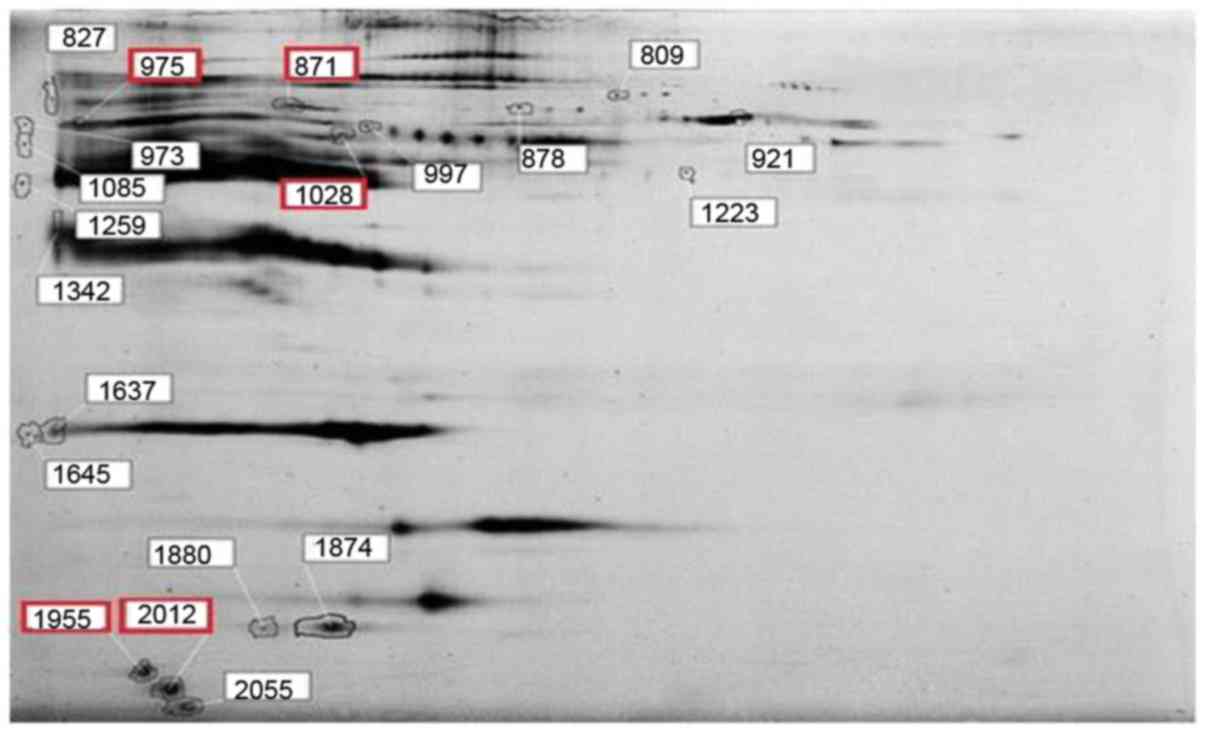
Based on the difference of an at least 50% ratio change between the
PCOS-IR and PCOS-NIR group, 20 spots were recognized and marked in
Fig. 2. Among the 20 different
proteins, only 4 proteins were identified by MALDI-TOF-MS/MS,
namely afamin (871), serotransferrin (975), complement C3 (1,028)
and APOC3 (1,955 and 2,012), and these are marked by red rectangles
in Fig. 2.
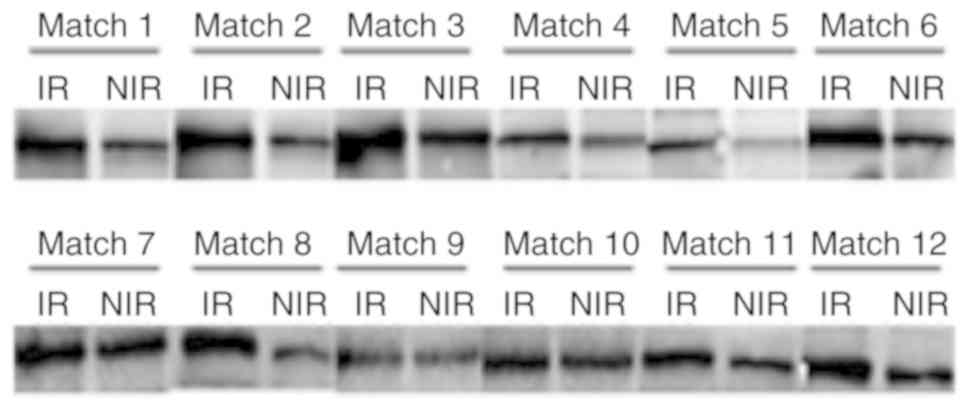
Protein expression level of APOC3 in the
PCOS-IR group is higher than that in the PCOS-NIR group
To further verify the differential protein
expression between the PCOS-IR and PCOS-NIR groups, western blot
analysis was performed. As illustrated in Fig. 3, the APOC3 expression level was
higher in the PCOS-IR group compared with that in the PCOS-NIR
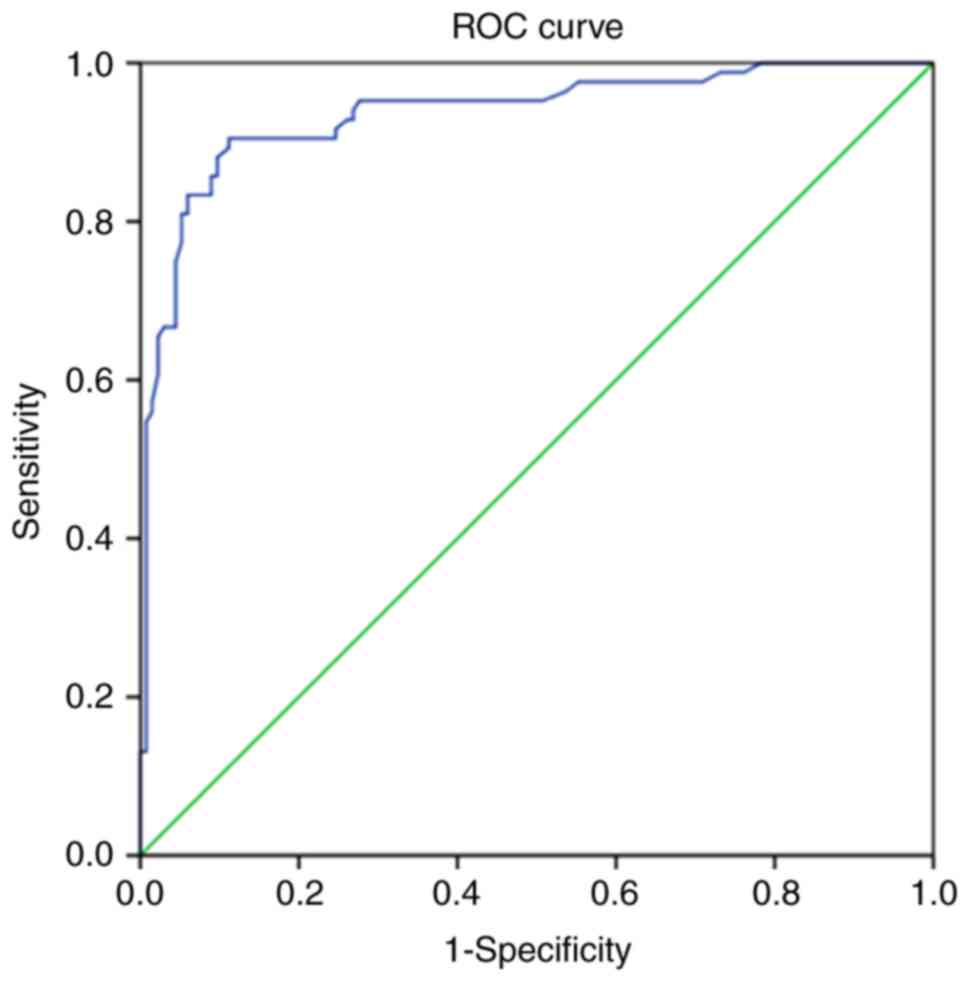
group. To further investigate the diagnostic value of serum APOC3
in patients with PCOS, ELISA was performed to detect the APOC3
levels in 80 PCOS-IR and 80 PCOS-NIR samples. The area under the
receiver operator characteristic curve was 0.936 (95% CI,
0.901–0.972); the Youden index was largest when the demarcation
value was 10.42 ng/ml, the sensitivity was 88.81%, and the
specificity was 90.48% (Fig.
4).
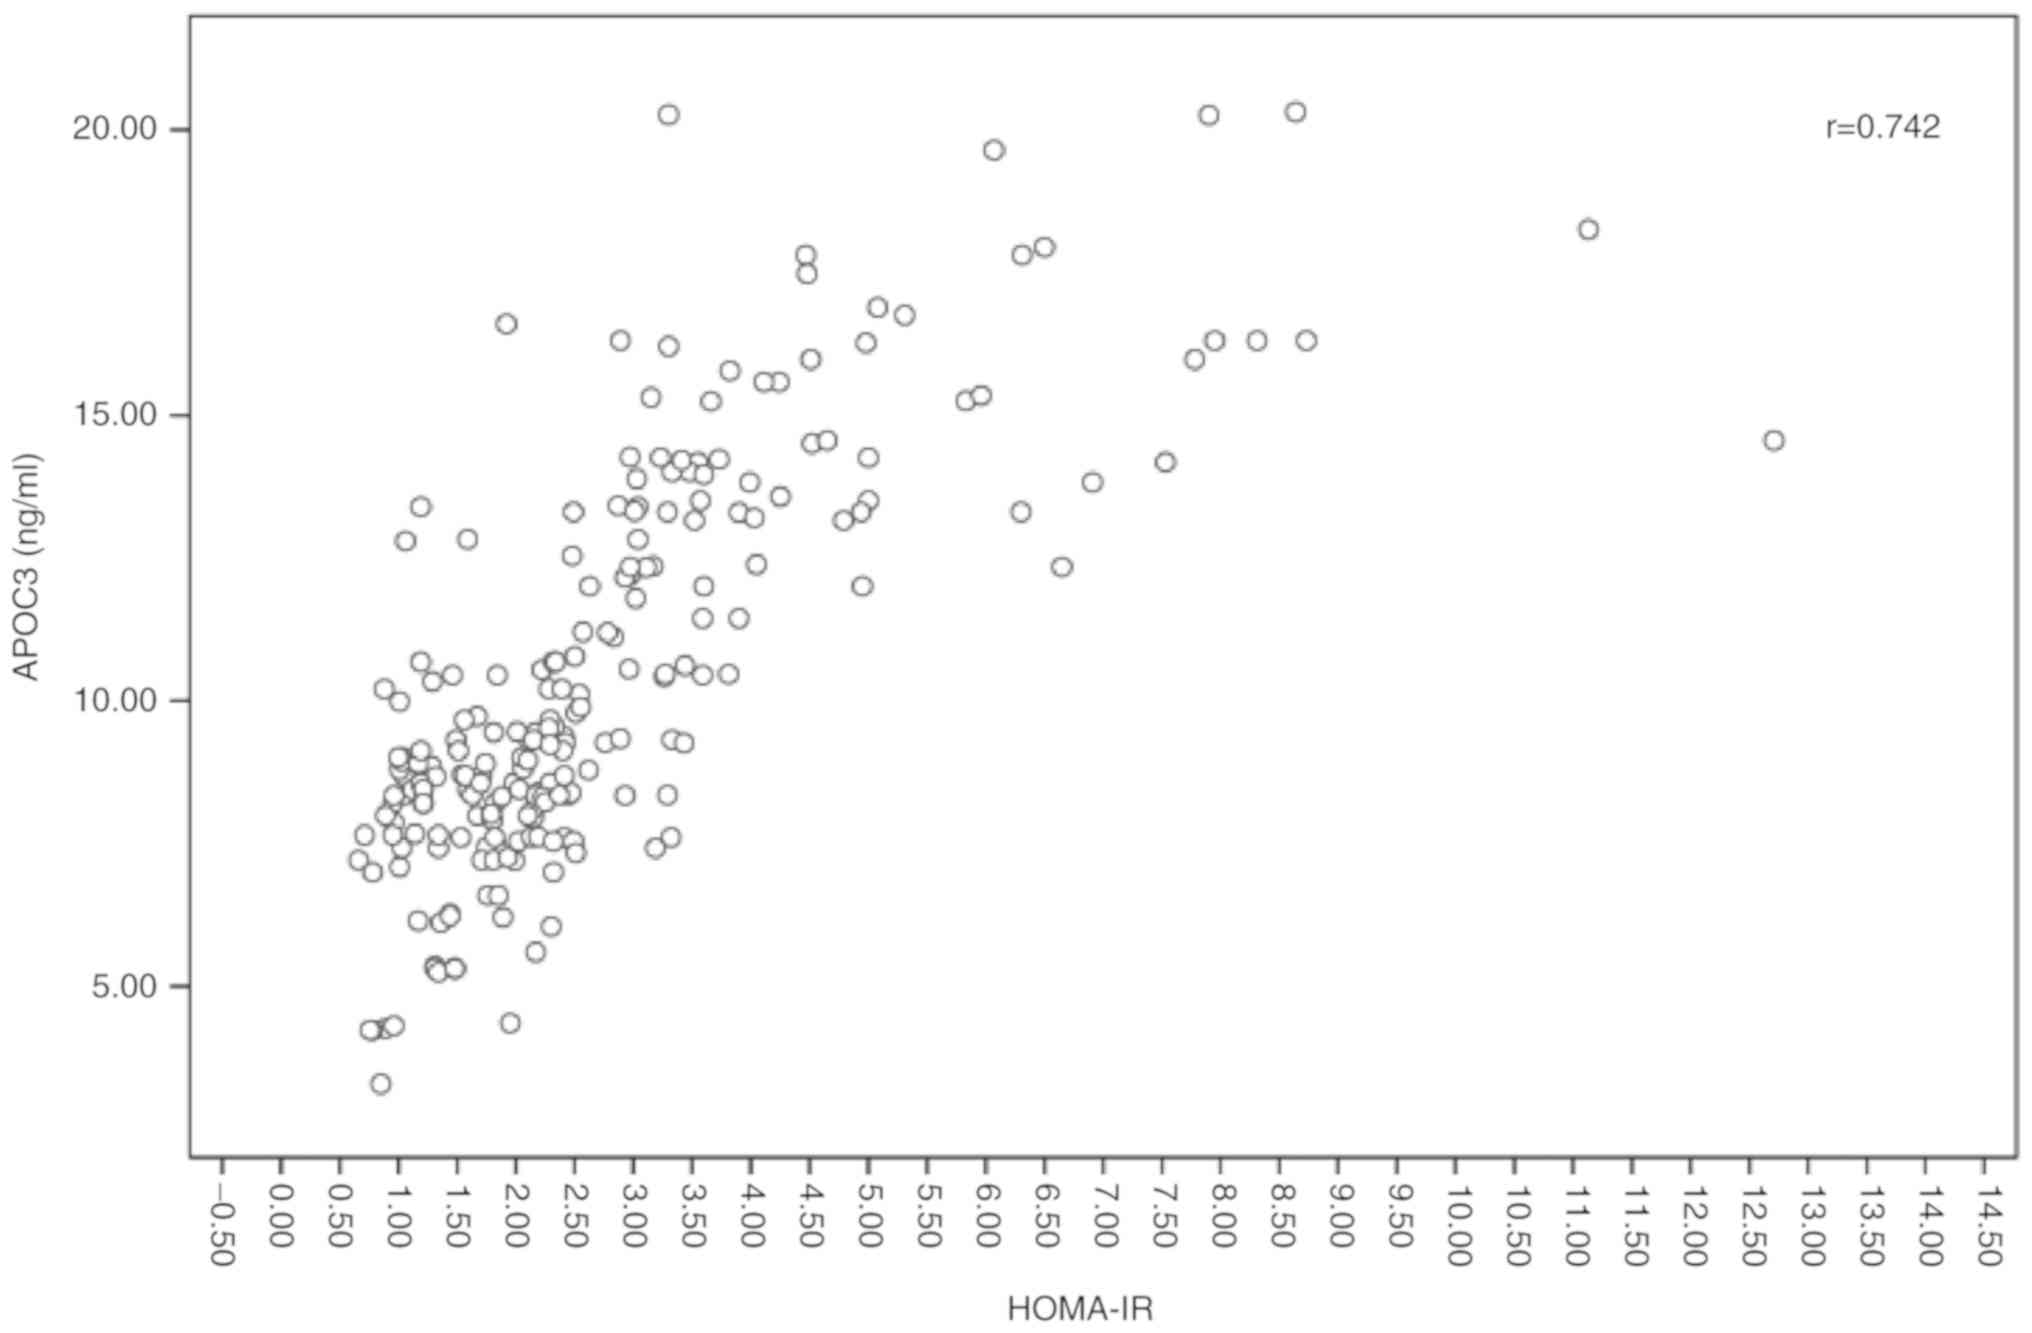
Serum APOC3 levels in patients with PCOS
are positively associated with HOMA-IR
To explore the association between APOC3 and
HOMA-IR, the ELISA results were further analyzed. The analysis of
this association demonstrated a strong positive association between
APOC3 and HOMA-IR (Fig. 5).
Discussion
A number of methods are currently available for the
clinical diagnosis of IR; however, there is no compatible method
available for the accurate and effective diagnosis of the IR status
in patients with PCOS. In the present study, HOMA-IR was used to
evaluate the IR in patients with PCOS due to its simplicity and
clinical applicability. However, the HOMA-IR level differs
significantly between different populations, and between patients
of different ethnicities and age groups. Thus far, there is no
uniform standard method available for measuring the cut-off value
of HOMA-IR worldwide. According to a Chinese diabetes prevention
collaborative study, the cut-off value was 2.69 (22), while a clinical trial of patients
with PCOS aged between 15 and 19 years demonstrated that the
physical upper limits of HOMA-IR were 2.69 (23). Therefore, in the present study,
the HOMA-IR value of 2.69 was taken as the critical value of IR in
patients with PCOS.
In the present study, 4 differentially expressed
proteins, namely afamin, serotransferrin, complement C3 and
apolipoprotein C3, were distinguished by 2D-DIGE and
MALDI-TOF-MS/MS analysis. Since there were 2 spots (the spots score
is respectively 1,955 and 2,012, as illustrated in Table III) identified as APOC3, the
credibility of APOC3 as the differentially expressed protein
increased. Western blot analysis was further used to verify the
differentially expressed proteins between the PCOS-IR and PCOS-NIR
groups. The results indicated that APOC3 was upregulated in the
PCOS-IR group. Multiple studies have suggested that APOC3 is
closely related to IR (24–26) and another independent study
demonstrated that IR was also positively associated with the
production of APOC3 protein. Based on these studies, it was thus
hypothesized that APOC3 could be used as an appropriate diagnostic
biomarker for women with PCOS with IR.
| Table IIIThe 4 differential proteins
identified by 2D-DIGE and MALDI-TOF-MS/MS in the PCOS-IR and
PCOS-NIR groups. |
Table III
The 4 differential proteins
identified by 2D-DIGE and MALDI-TOF-MS/MS in the PCOS-IR and
PCOS-NIR groups.
| No. | Spot score
(no.) | Protein | Accession no. | Theoretical | Protein score | Protein (%) | IR/NIR |
|---|
|
|---|
| Mass (Da) | PI |
|---|
| 1 | 871 | Afamin | P43652 | 70,962.7 | 5.64 | 130 | 100 | 1.66 |
| 2 | 975 |
Serotransferrin | P02787 | 79,280.5 | 6.81 | 213 | 100 | 1.53 |
| 3 | 1,028 | Complement C3 | P01024 | 188,569.5 | 6.02 | 72 | 99.88 | 1.76 |
| 4 | 1,955 | Apolipoprotein
C3 | P02656 | 10,845.5 | 5.23 | 72 | 99.88 | 1.47 |
| 5 | 2,012 | Apolipoprotein
C3 | P02656 | 10,845.5 | 5.23 | 72 | 99.88 | 2.14 |
APOC3 is a protein containing 79 amino acids, mainly
located in chylomicrons, very low-density lipoprotein, LDL and HDL
(27). APOC3 plays an important
role in regulating lipid metabolism, inhibiting lipid lipoprotein
lipase, hepatic lipase and reducing lacteal protein. Clinical
studies have demonstrated that concentrations of APOC3 in the very
low-density lipoprotein (VLDL) and LDL are higher in patients with
myocardial infarction (28), and
plasma APOC3 and apolipoprotein B (apoB) act as independent factors
to predict coronary heart disease (29,30). It is generally estimated that
abnormal lipid metabolism, particularly high triglyceride
lipoprotein metabolism, is the main factor leading to
atherosclerosis, while APOC3 can replace lipoprotein lipase, which
leads to reduced lipolysis (31,32). In addition, the inflammatory
responses caused by APOC3 in vascular endothelial cells may further
aggravate atherosclerosis (26).
As is known, patients with PCOS also suffer from an increased risk
of cardiovascular diseases and metabolic diseases. To the best of
our knowledge, there is no evidence available to date to indicate
that APOC3 may be used as a marker to predict the occurrence of
long-term complications, such as diabetes, dyslipidemia and
cardiovascular disease in women with PCOS. Therefore, further
studies are warranted on this matter. In the present study, FPG and
3hBG levels in the PCOS-IR group were higher than those in the
PCOS-NIR group, indicating a statistically significant difference
(P<0.05). The results also revealed that the area under the ROC
curve was measured at 0.936 (95% CI, 0.901–0.972), the sensitivity
was measured at 88.81%, and the specificity was measured at 90.48%.
The present study also found that there was a positive association
between APOC3 and HOMA-IR. Most importantly, it was demonstrated
that APOC3 may be used as a biomarker of the IR status of patients
with PCOS.
It is well known that PCOS is a lifelong disease,
and a delay in the onset of the long-term complications associated
with PCOS is considered highly beneficial to affected patients. The
current study focused on the strong association of APOC3 with
glucose homeostasis and lipid metabolism. However, further studies
are required to determine whether the APOC3 gene can be used as a
therapeutic target for IR in patients with PCOS. As the sample
collection is still ongoing, in future studies, the authors aim to
use other methods, such as ELISA and animal models to detect the
therapeutic potential of APOC3 in patients with PCOS.
Acknowledgements
Not applicable.
Funding
The study was supported by the Science and
Technology Planning Project of Guangdong Province (2014A020212237);
the Key Project of Guangdong Provincial Administration of
traditional Chinese Medicine: (20184005); the Science and
Technology Planning Project of Guangdong Province (2017ZC0378); and
the Guangzhou Municipal Science and Technology Innovation Council
(201510010290).
Availability of data and materials
All data generated or analyzed during this study are
included in this published article or are available from the first
author on reasonable request.
Authors’ contributions
LL and ZL designed the study. LL and JZh performed
the experiments, participated in collecting the data and drafted
the manuscript. JZe, BL and XP performed the statistical analysis
and participated in its design. TL, JL, QT, XL, YY and ZC
participated in the acquisition, analysis, or interpretation of
data and drafted the manuscript. All authors read and approved the
final manuscript.
Ethics approval and consent to
participate
All patients signed written informed consent forms
for participation, and this study was approved by the Ethics
Committee of Guangdong Maternal and Child Health Hospital.
Patient consent for publication
Not applicable.
Competing interests
The authors declare that they have no competing
interests.
Abbreviations:
|
PCOS
|
polycystic ovary syndrome
|
|
IR
|
insulin resistance
|
|
BW
|
body weight
|
|
BMI
|
body mass index
|
|
TT
|
total testosterone
|
|
FAI
|
free androgen index
|
|
IAUC
|
insulin area under curve
|
|
HOMA-IR
|
homeostasis model assessment of
insulin resistance
|
|
SHBG
|
sex hormone binding globulin
|
|
TG
|
triglycerides
|
|
LDL
|
low-density lipoprotein
|
|
FPG
|
fasting plasma glucose
|
|
UA
|
uric acid
|
|
HDL-C
|
high-density lipoprotein
|
|
APOC3
|
apolipoprotein C3
|
References
|
1
|
Escobar-Morreale HF: Polycystic ovary
syndrome: Definition, aetiology, diagnosis and treatment. Nat Rev
Endocrinol. 14:270–284. 2018. View Article : Google Scholar : PubMed/NCBI
|
|
2
|
Wolf WM, Wattick RA, Kinkade ON and Olfert
MD: Geographical prevalence of polycystic ovary syndrome as
determined by region and race/ethnicity. Int J Env Res Pub He.
15:E25892018. View Article : Google Scholar
|
|
3
|
Sirmans SM and Pate KA: Epidemiology,
diagnosis, and management of polycystic ovary syndrome. Clin
Epidemiol. 6:1–13. 2013. View Article : Google Scholar :
|
|
4
|
Legro RS, Arslanian SA, Ehrmann DA, Hoeger
KM, Murad MH, Pasquali R and Welt CK; Endocrine Society. Diagnosis
and treatment of polycystic ovary syndrome: An Endocrine Society
clinical practice guideline. J Clin Endocrinol Metab. 98:4565–4592.
2013. View Article : Google Scholar : PubMed/NCBI
|
|
5
|
Azziz R, Marin C, Hoq L, Badamgarav E and
Song P: Health care-related economic burden of the polycystic ovary
syndrome during the reproductive life span. J Clin Endocrinol
Metab. 90:4650–4658. 2005. View Article : Google Scholar : PubMed/NCBI
|
|
6
|
Burghen GA, Givens JR and Kitabchi AE:
Correlation of hyperandrogenism with hyperinsulinism in polycystic
ovarian disease. J Clin Endocrinol Metab. 50:113–116. 1980.
View Article : Google Scholar : PubMed/NCBI
|
|
7
|
Dunaif A, Segal KR, Futterweit W and
Dobrjansky A: Profound peripheral insulin resistance, independent
of obesity, in polycystic ovary syndrome. Diabetes. 38:1165–1174.
1989. View Article : Google Scholar : PubMed/NCBI
|
|
8
|
Morales AJ, Laughlin GA, Butzow T,
Maheshwari H, Baumann G and Yen SS: Insulin, somatotropic, and
luteinizing hormone axes in lean and obese women with polycystic
ovary syndrome: Common and distinct features. J Clin Endocrinol
Metab. 81:2854–2864. 1996.PubMed/NCBI
|
|
9
|
Cassar S, Misso ML, Hopkins WG, Shaw CS,
Teede HJ and Stepto NK: Insulin resistance in polycystic ovary
syndrome: A systematic review and meta-analysis of
euglycaemic-hyperinsulinaemic clamp studies. Hum Reprod.
31:2619–2631. 2016. View Article : Google Scholar : PubMed/NCBI
|
|
10
|
Palomba S, Falbo A, Russo T, Rivoli L,
Orio M, Cosco AG, Vero R, Capula C, Tolino A, Zullo F, et al: The
risk of a persistent glucose metabolism impairment after
gestational diabetes mellitus is increased in patients with
polycystic ovary syndrome. Diabetes care. 35:861–867. 2012.
View Article : Google Scholar : PubMed/NCBI
|
|
11
|
Zhang J, Li JM, Deng QS, Chen WF, Peng XH
and Li L: Analysis of the metabolic characteristics of polycystic
ovary syndrome under different states. Chin J Pract Gynecol Obstet.
32:446–449. 2016.
|
|
12
|
Rizzo M, Tyndall EK, Frontoni S,
Jacoangeli F, Sarlo F, Panebianco F, Mistorni A, Di Renzo L,
Calafiore R, Luca G and De Lorenzo A: Rapid and easy assessment of
insulin resistance contributes to early detection of polycystic
ovary syndrome. J Endocrinol Invest. 36:527–530. 2013.PubMed/NCBI
|
|
13
|
Okamura Y, Saito F, Takaishi K, Motohara
T, Honda R, Ohba T and Katabuchi H: Polycystic ovary syndrome:
Early diagnosis and intervention are necessary for fertility
preservation in young women with endometrial cancer under 35 years
of age. Reprod Med Biol. 16:67–71. 2017. View Article : Google Scholar : PubMed/NCBI
|
|
14
|
Li X, Guo YR, Lin JF, Feng Y, Billig H and
Shao R: Combination of Diane-35 and metformin to treat early
endometrial carcinoma in PCOS women with insulin resistance. J
Cancer. 5:173–181. 2014. View
Article : Google Scholar : PubMed/NCBI
|
|
15
|
Tam CS, Xie W, Johnson WD, Cefalu WT,
Redman LM and Ravussin E: Defining insulin resistance from
hyperinsulinemic-euglycemic clamps. Diabetes Care. 35:1605–1610.
2012. View Article : Google Scholar : PubMed/NCBI
|
|
16
|
De Souza AL, Batista GA and Alegre SM:
Assessment of insulin sensitivity by the hyperinsulinemic
euglycemic clamp: Comparison with the spectral analysis of
photoplethysmography. J Diabetes Complications. 31:128–133. 2017.
View Article : Google Scholar
|
|
17
|
Kurl S, Zaccardi F, Onaemo VN, Jae SY,
Kauhanen J, Ronkainen K and Laukkanen JA: Association between
HOMA-IR, fasting insulin and fasting glucose with coronary heart
disease mortality in nondiabetic men: A 20-year observational
study. Acta Diabetol. 52:183–186. 2015. View Article : Google Scholar
|
|
18
|
Peplies J, Jiménez-Pavón D, Savva SC, Buck
C, Günther K, Fraterman A, Russo P, Iacoviello L, Veidebaum T,
Tornaritis M, et al: Percentiles of fasting serum insulin, glucose,
HbA1c and HOMA-IR in pre-pubertal normal weight European children
from the IDEFICS cohort. Int J Obesity (Lond). 38(Suppl 2):
S39–S47. 2014. View Article : Google Scholar
|
|
19
|
Mossmann M, Wainstein MV, Gonçalves SC,
Wainstein RV, Gravina GL, Sangalli M, Veadrigo F, Matte R, Reich R,
Costa FG and Bertoluci MC: HOMA-IR is associated with significant
angiographic coronary artery disease in non-diabetic, non-obese
individuals: A cross-sectional study. Diabetol Metab Syndr.
7:1002015. View Article : Google Scholar
|
|
20
|
Viswanathan S, Unlu M and Minden JS:
Two-dimensional difference gel electrophoresis. Nat Protoc.
1:1351–1358. 2006. View Article : Google Scholar
|
|
21
|
McNamara LE, Dalby MJ, Riehle MO and
Burchmore R: Fluorescence two-dimensional difference gel
electrophoresis for biomaterial applications. J R Soc Interface.
7(Suppl 1): S107–S118. 2010. View Article : Google Scholar :
|
|
22
|
Yin JH, Li M, Xu L, Wang Y, Cheng H, Zhao
XY and Mi J: Insulin resistance determined by Homeostasis Model
Assessment (HOMA) and associations with metabolic syndrome among
Chinese children and teenagers. Diabetol Metab Syndr. 5:712013.
View Article : Google Scholar : PubMed/NCBI
|
|
23
|
Li R, Yu G, Yang D, Li S, Lu S, Wu X, Wei
Z, Song X, Wang X, Fu S and Qiao J: Prevalence and predictors of
metabolic abnormalities in Chinese women with PCOS: A
cross-sectional study. BMC Endocr Disord. 14:762014. View Article : Google Scholar
|
|
24
|
Duivenvoorden I, Teusink B, Rensen PC,
Romijn JA, Havekes LM and Voshol PJ: Apolipoprotein C3 deficiency
results in diet-induced obesity and aggravated insulin resistance
in mice. Diabetes. 54:664–671. 2005. View Article : Google Scholar : PubMed/NCBI
|
|
25
|
Lee HY, Birkenfeld AL, Jornayvaz FR,
Jurczak MJ, Kanda S, Popov V, Frederick DW, Zhang D, Guigni B,
Bharadwaj KG, et al: Apolipoprotein CIII overexpressing mice are
predisposed to diet-induced hepatic steatosis and hepatic insulin
resistance. Hepatology. 54:1650–1660. 2011. View Article : Google Scholar : PubMed/NCBI
|
|
26
|
Avall K, Ali Y, Leibiger IB, Leibiger B,
Moede T, Paschen M, Dicker A, Daré E, Köhler M, Ilegems E, et al:
Apolipoprotein CIII links islet insulin resistance to β-cell
failure in diabetes. Proc Natl Acad Sci USA. 112:E2611–E2619. 2015.
View Article : Google Scholar
|
|
27
|
Ruiz-Narváez EA, Yang Y, Nakanishi Y,
Kirchdorfer J and Campos H: APOC3/A5 haplotypes, lipid levels, and
risk of myocardial infarction in the Central Valley of Costa Rica.
J Lipid Res. 46:2605–2613. 2005. View Article : Google Scholar : PubMed/NCBI
|
|
28
|
Kavo AE, Rallidis LS, Sakellaropoulos GC,
Lehr S, Hartwig S, Eckel J, Bozatzi PI, Anastasiou-Nana M, Tsikrika
P and Kypreos KE: Qualitative characteristics of HDL in young
patients of an acute myocardial infarction. Atherosclerosis.
220:257–264. 2012. View Article : Google Scholar
|
|
29
|
Blankenhorn DH, Alaupovic P, Wickham E,
Chin HP and Azen SP: Prediction of angiographic change in native
human coronary arteries and aortocoronary bypass grafts. Lipid and
nonlipid factors. Circulation. 81:470–476. 1990. View Article : Google Scholar : PubMed/NCBI
|
|
30
|
Sacks FM, Alaupovic P, Moye LA, Cole TG,
Sussex B, Stampfer MJ, Pfeffer MA and Braunwald E: VLDL,
apolipoproteins B, CIII, and E, and risk of recurrent coronary
events in the Cholesterol and Recurrent Events (CARE) trial.
Circulation. 102:1886–1892. 2000. View Article : Google Scholar : PubMed/NCBI
|
|
31
|
Larsson M, Vorrsjö E, Talmud P, Lookene A
and Olivecrona G: Apolipoproteins C-I and C-III inhibit lipoprotein
lipase activity by displacement of the enzyme from lipid droplets.
J Biol Chem. 288:33997–34008. 2013. View Article : Google Scholar : PubMed/NCBI
|
|
32
|
Maeda N, Li H, Lee D, Oliver P, Quarfordt
SH and Osada J: Targeted disruption of the apolipoprotein C-III
gene in mice results in hypotriglyceridemia and protection from
postprandial hypertriglyceridemia. J Biol Chem. 269:23610–23616.
1994.PubMed/NCBI
|