Introduction
Deep venous thrombosis (DVT) is one of the most
common vascular diseases and is associated with high mortality and
complex therapeutic processes (1). Thrombolytics and interventional
therapies are still the mainstream treatments for DVT, but they are
limited by a low cure rate and a high postoperative recurrence rate
(2). The current therapeutic
methods are restricted, especially regarding the prolonged time for
diagnosis and treatment (3).
Considering the complex mechanisms and various regulatory factors
of DVT, studies on DVT have focused on the underlying regulatory
genes, providing a valuable foundation for the diagnosis and
treatment of DVT (4-6).
Krüppel-like factor 15 (Klf15), a transcriptional
regulatory factor, is involved in various pathophysiological
processes, such as cell differentiation, apoptosis and tumor
formation, which are closely related to cardiovascular diseases
such as hypertension, atherosclerosis and coronary heart disease
(4). Klf15 is widely expressed in
tissues and organs, especially in the heart, liver, kidneys and
skeletal muscles (7). Lu et
al (8) reported that
similarly to other members of the KLF family, Klf15 inhibits NF-κB
activation in vascular smooth muscle by interacting with p300
(Klf15-p300), thereby inhibiting down-stream target genes and
inflammatory responses. Moreover, the expression level of Klf15
significantly decreased in mouse aortic smooth muscle cells treated
with the oxidized component POVPC and human atherosclerotic
tissues, which revealed that Klf15 plays a key role in the
formation of atherosclerosis (7,8).
Studies revealing the relationship and the genetic interaction
between DVT and Klf15 are urgently needed. Therefore, transcriptome
analysis of Klf15 in a mouse inferior vena cava (IVC) thrombosis
model was performed to identify the functions of Klf15 and its
relationship with the regulatory process and formation of DVT.
High-throughput sequencing, or next-generation
sequencing, is a novel genomic research technique characterized by
high data output and involves RNA sequencing (RNA-seq);
high-throughput sequencing can be utilized in the analysis of
various transcriptional and functional regions (9). Strikingly, extensive data resources
can be provided via high-throughput sequencing to enable the
identification and screening of target genes or differentially
expressed genes (DEGs) in the whole genome, which is important for
analyzing the regulatory relationships between genes and disease
pathogenesis (10).
Previous studies have investigated the role of Klf15
in atherosclerosis (8) and
vascular smooth muscle cells (VSMCs) (11). Klf15 is a regulator of VSMC
proinflammatory activation and overexpression of Klf15 can protect
vascular endothelial cells against dysfunction (12). Although the pathogeneses of
atherosclerosis and DVT are different, endothelial cells are
important for both atherosclerosis and DVT. Disruption of the
endothelium and the release of plaque constituents into the lumen
of the blood vessel can trigger arterial thrombosis (13,14). Abnormal blood flow, altered
properties of the blood itself and changes in the endothelium can
trigger venous thrombosis. In contrast to what is observed in
atherosclerosis, venous endothelial cells remain intact, but their
dysfunction can trigger DVT (15). According to our knowledge, no
reports have studied Klf15 in DVT. The research on Klf15 in
atherosclerosis prompted the present study to hypothesize that
Klf15 can protect against DVT by affecting venous endothelial
cells. Preliminary experiments were performed in C57/BL/6 mice and
the results showed that inhibition of Klf15 induced DVT. In this
study, the regulatory relationship and genetic interactions between
DVT and Klf15 were investigated, revealing a new regulatory
mechanism in a mouse model that could contribute to the diagnosis
and treatment of DVT.
Materials and methods
Mouse and animal studies
The current study was performed with 40 C57BL/6
female mice (age, 8-10 weeks; weight, 20±3 g) that were purchased
from the SPF animal laboratory of Kunming Medical University
(Kunming, China). The mice were divided into four groups (n=10),
according to a random grouping design. Then, the mice were fed at
the experimental center of the SPF animal laboratory at Kunming
Medical University with free access to food and water, a constant
temperature of 21-25°C, a humidity level at 50-65%, under a 12-h
light/dark cycle with proper ventilation. Next, a 2-3 week feeding
period was conducted until the mice reached ≥25 g per mouse. The
mice were observed twice daily to monitor their health and
behavior. All animal experiments were performed following approval
from the Animal Experiment and Ethics Committee of Kunming Medical
University.
Generation of IVC thrombus in C57BL/6
mice
Once the weight of the mice exceeded 25 g, modeling
of IVC thrombi in C57BL/6 mice was performed in each mouse except
the Blank group. Mice were separated into four groups: The Blank
group, the DVT group, the Klf15-NC group and the Klf15-small
interfering (si)RNA group. The Blank and DVT groups were first
generated, and mice in the DVT group underwent an operation to
generate an IVC thrombus by utilizing a string to induce artificial
stenosis of the IVC for thrombus formation (16). IVC thrombosis in mice was first
modeled. After 24 h, the thrombi were acquired. During the
perioperative period, the mice were monitored twice daily and they
did not appear to be in distress or to exhibit obvious behavioral
abnormalities. After the IVC thrombi were collected for further
investigation, no other procedures were performed on the mice.
Isoflurane was used as the inhaled agent to produce general
anesthesia in mice. During the perioperative period of the
experiment, the inhalant anesthetic isoflurane was utilized to
induce and maintain general anesthesia to minimize animal pain and
suffering and limit the discomfort that can accompany scientific
research. Isoflurane was first used at 2% for induction and then at
1-1.5% for maintenance. Mice that have undergone IVC removal are
likely to experience great pain and distress; thus, euthanasia was
considered as the humane option. Euthanasia was conducted 24 h
after the IVC thrombus operation. The mice were first anesthetized
with 5% isoflurane until they stopped moving or appeared to be
unconscious. Next, cervical dislocation was conducted, separating
the cervical vertebrae from the skulls of the mice. An array of
criteria was used to confirm the success of euthanasia, including
arrest of pulse and breathing, lack of corneal reflex and
inaudibility of respiratory sounds and heartbeat sounds upon
examination with a stethoscope. The same process was performed for
the IVC of the Klf15-NC and Klf15-siRNA groups, and there was an
additional caudal vein injection with 0.9% normal saline (NS) in
the Klf15-NC group and with Klf15 siRNA: 5′-CCT GTG AAG GAG GAA CAT
T-3′ (Guangzhou RiboBio Co., Ltd.; 10 nmol per mouse) in the
Klf15-siRNA group, which was performed 24 h before the operation. A
total of 40 C57BL/6 mice were used in the present experiment, 36 of
which were euthanized by cervical dislocation under anesthesia;
four died due to hemorrhagic shock. The success of DVT modeling was
judged by direct observations of the weights of the thrombi and
vessels collected from the mice. In the present experiments, when
7-8 mm thrombi or vessels from mice were examined, most of the
thrombi weighed >10 mg and most of the vessels weighed <10
mg.
RNA isolation and RNA-seq
On the basis of morphological experiments, thrombi
in the IVC of mice and the vessels themselves were collected for
examination. According to the manufacturer's protocol, RNA was
extracted with TRIzol Reagent at 4°C. RNA purity was determined
using a NanoPhotometer spectrophotometer (IMPLEN) and the
concentration was measured using a Qubit RNA Assay kit in a
Qubit® 2.0 Fluorometer (Thermo Fisher Scientific, Inc.).
RNA integrity was assessed using the RNA Nano 6000 Assay kit of the
Bioanalyzer 2100 system (Agilent Technologies, Inc.). Then, RNA
degradation and contamination were monitored on 1% agarose gels.
Furthermore, RNA purity was assessed using the RNA Nano 6000 Assay
kit of the Bioanalyzer 2100 system (Agilent Technologies, Inc.).
Thus, qualified RNA was used as a material for later analyses and
provided samples for RNA-seq.
RNA-seq data and bioinformatics
analysis
High-throughput sequencing was used to obtain and
identify raw reads in samples. Further evaluation of the quality of
the clean reads was performed to discard low-quality reads, which
had either >50% of bases with a Q value ≤20 or >5%
unrecognized sequences ('N'). After obtaining the high-quality
clean reads, the reads were mapped to the human reference genome to
enable downstream gene analysis.
For analysis of the expression levels of transcripts
and the correlation of replicates, the fragments per kilobases per
million mapped reads (FPKM) method was utilized in Pearson's
correlation analysis to identify DEGs among each group of
transcript sequences, which was determined by genetic length and
the reads mapped to the human reference genome.
To detect the DEGs among the groups, DESeq2 was
used, which provides statistical routines for determining
differential expression in digital gene expression data using a
model based on a negative binomial distribution. The resulting
P-values were adjusted using Benjamini and Hochberg's approach for
controlling the false discovery rate. Genes with an adjusted
P<0.05 according to DESeq2 were considered differentially
expressed.
GO enrichment analysis of DEGs was implemented by
the clusterProfiler R package 3.14.3 (17), in which the gene length bias was
corrected. GO terms with corrected P<0.05 were considered
significantly enriched with DEGs. KEGG is a database resource used
to elucidate the high-level functions and utilities of biological
systems, such as the cell, organism and ecosystem, from
molecular-level information, especially large-scale molecular
datasets generated by genome sequencing and other high-throughput
experimental technologies (http://www.genome.jp/kegg/). The clusterProfiler R
package was used to test the statistical enrichment of DEGs in KEGG
pathways.
qPCR analysis of DEGs
For validation of the expression of genes and the
consistency of these two comparisons, qPCR analysis of DEGs was
conducted according to the manufacturer's protocol for
Maxima® SYBR-Green/ROX qPCR Master Mix (2X) (MBI
Fermentas; Thermo Fisher Scientific, Inc.) on an ABI
PRISM® 7300HT system (Applied Biosystems; Thermo Fisher
Scientific, Inc.). The thermocycling conditions were as follows:
Initial denaturation at 95°C for 10 min (1 cycle), followed by
denaturation at 95°C for 15 sec and annealing and extension at 60°C
for 60 sec (40 cycles). The primer sequences were obtained using
the 2−∆∆Cq method (8)
[ABI DataAssist™ v3.0 software (Thermo Fisher Scientific, Inc.)]
and were as follows: KLF15 (77 bp) forward: 5′-CTT CCC TGA ATT TCT
GTC-3′ and reverse: 5′-ATT CTT CAA TCT CCT CCA-3′; Mmp12 (88
bp) forward: 5′-CAG CAT TCC AAT AAT CCA A-3′ and
reverse: 5′-GTA TGT CAT CAG CAG AGA-3′; Mmp13 (79 bp)
forward: 5′-GTG ATG ATG ATG ATG ATG AC-3′ and
reverse: 5′-GCA GGA TGG TAG TAT GAT T-3′; Arg1 (71
bp) forward: 5′-AAC ACG GCA GTG GCT TTA-3′ and
reverse: 5′-TCA GTC CCT GGC TTA TGG-3′; Ccl2 (120 bp)
forward: 5′-TGG GTC CAG ACA TAC ATT-3′ and reverse:
5′-ACG GGT CAA CTT CAC ATT-3′; Fmo23 (88 bp) forward:
5′-GAG TCT GGG ACG ATG GCT AC-3′ and reverse:
5′-GAG ATG GCG GTG GGT AAG-3′; heme oxygenase-1
(Hmox1) (88 bp) forward: 5′-TCA CAG ATG GCG TCA
CTT-3′, and reverse: 5′-AGC GGT GTC TGG GAT
GAG-3′; Mmp19 (113 bp) forward: 5′-GAT GCT GCC GTT
TAC TCT-3′ and reverse: 5′-GGT TGG GCT CTA CTC TGT
T-3′; β-actin (87 bp) forward: 5′-TAT GGA ATC CTG TGG
CAT C-3′ and reverse: 5′-GTG TTG GCA TAG AGG TCT
T-3′.
Statistical analysis
Prism 7 (GraphPad Software, Inc.) was used for all
statistical analyses. The results from mouse thrombi (Figs. 1 and 6) are presented as the mean ± SEM. The
experiments were repeated three times. An unpaired two-tailed
Student's t-test between two groups was used for statistical
significance of differences analyzed. P<0.05 was considered to
indicate a statistically significant difference.
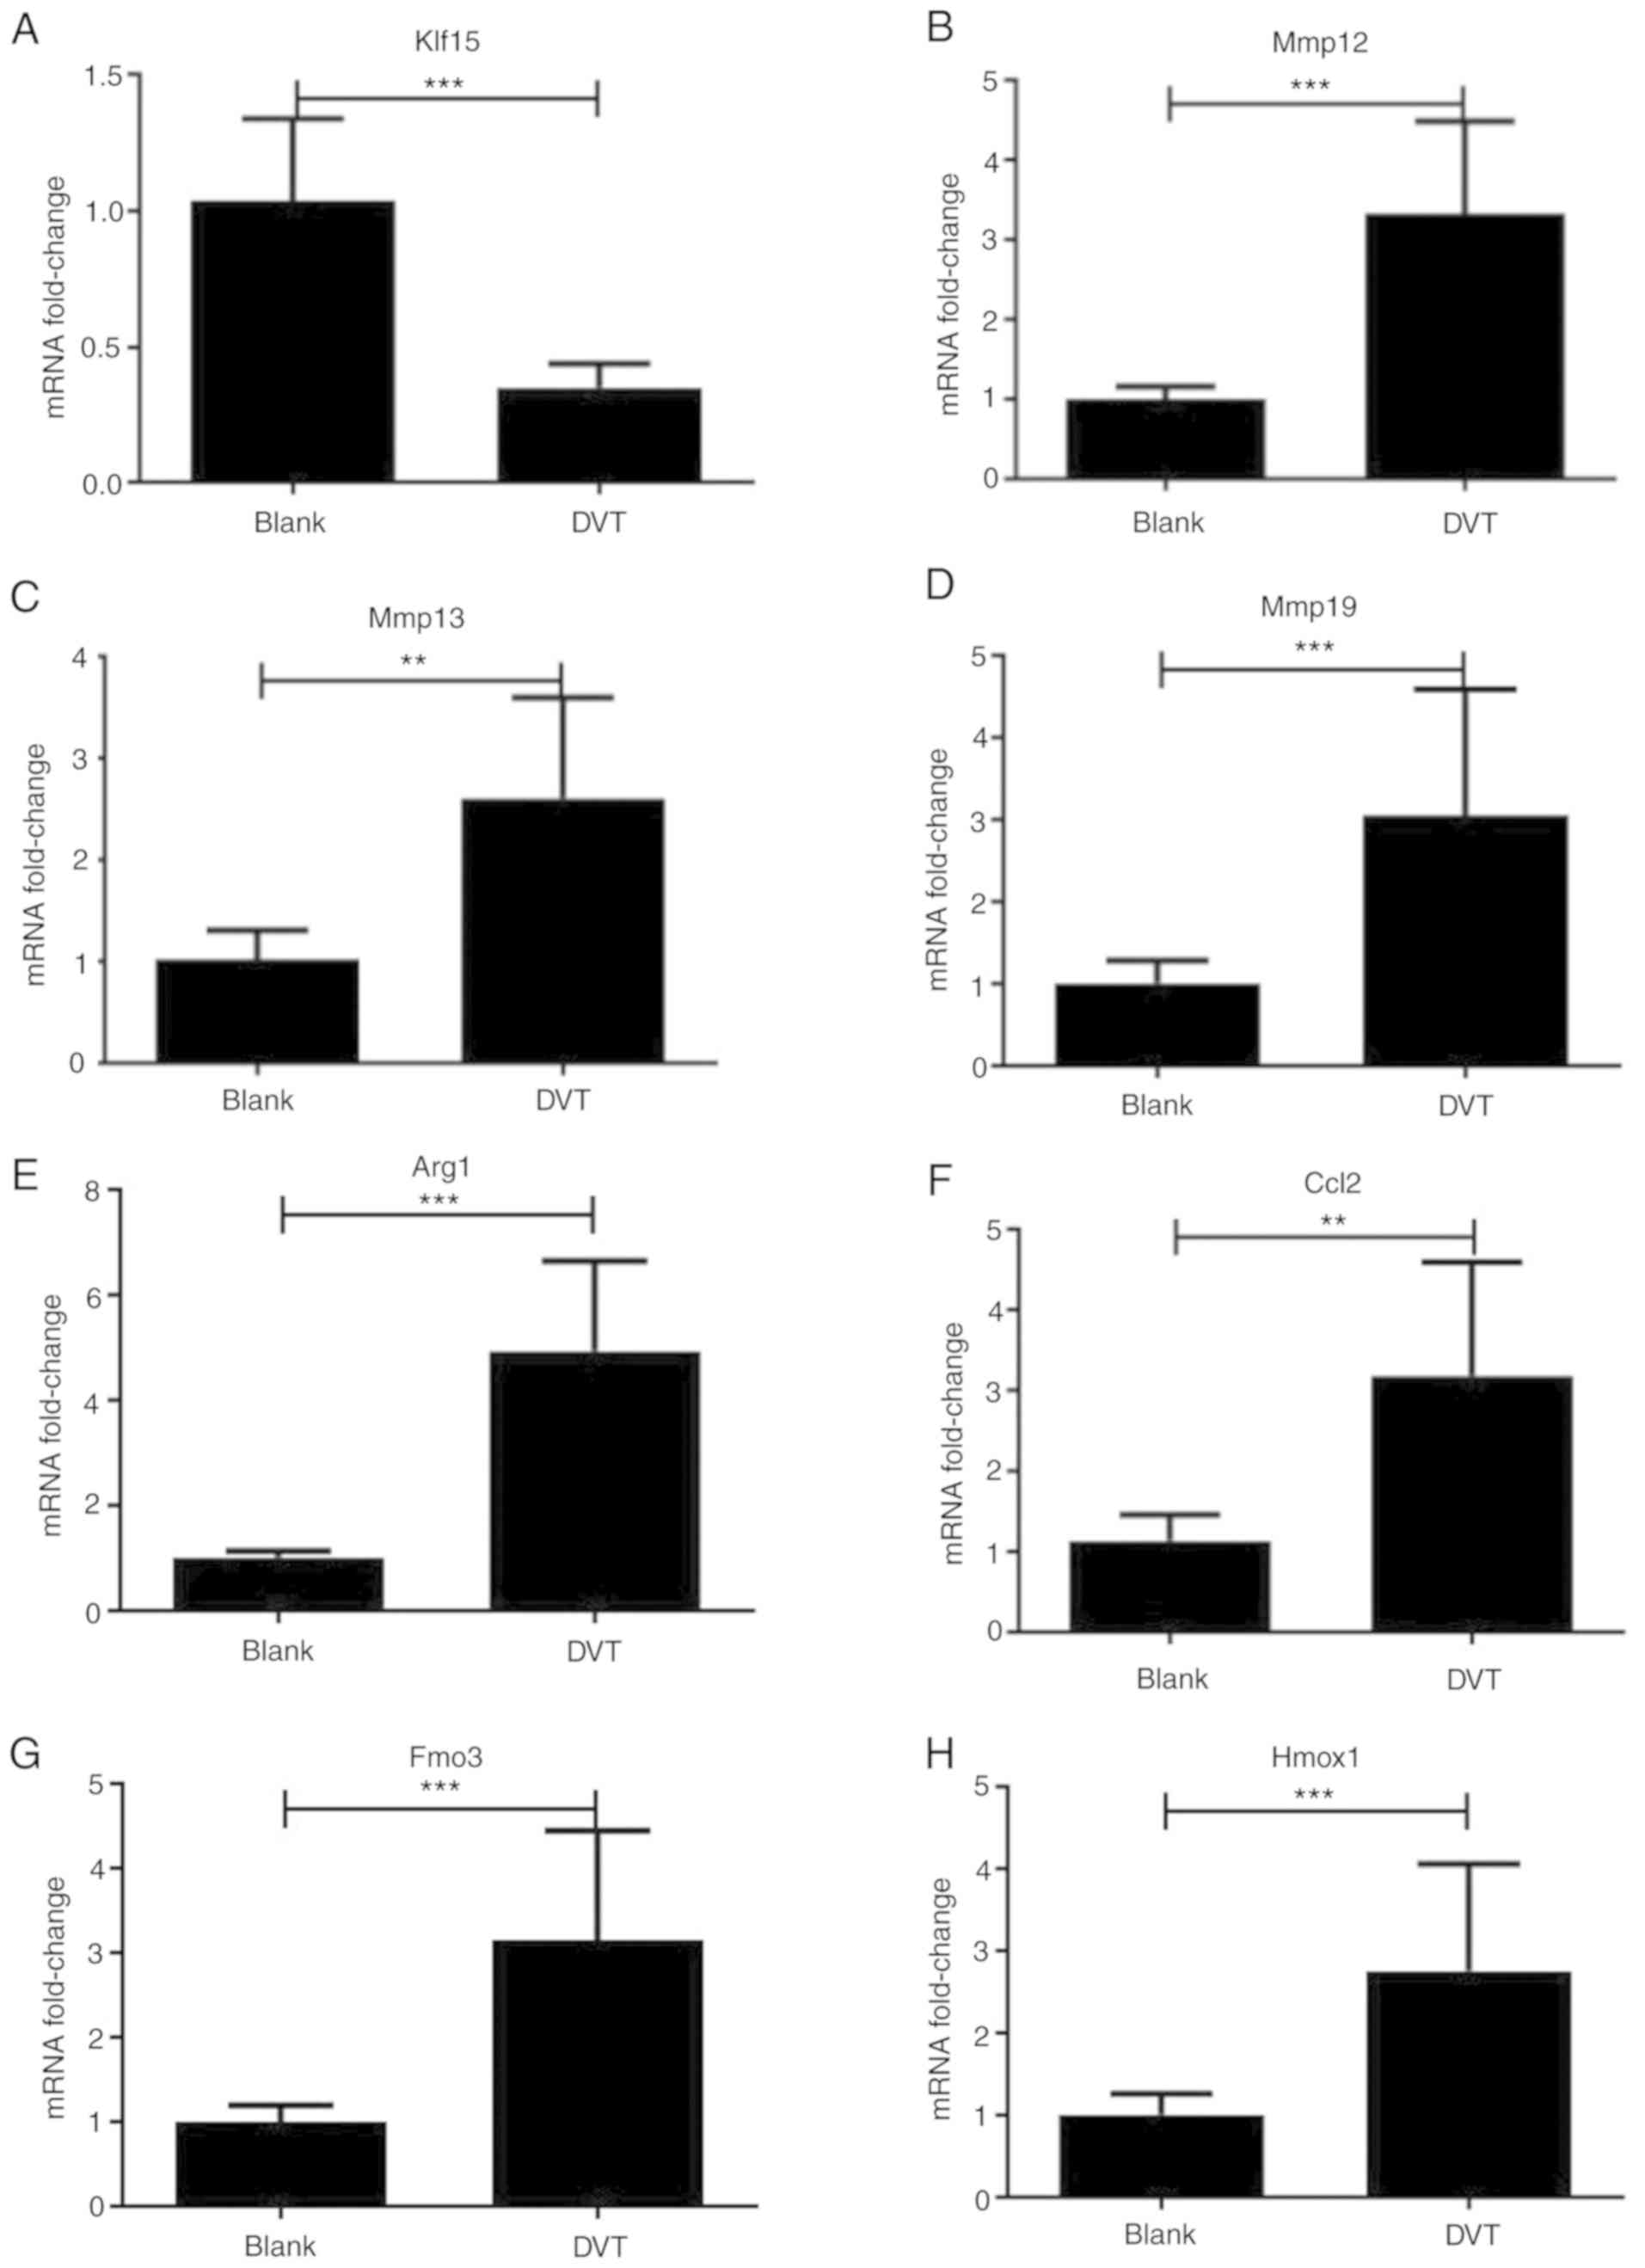 | Figure 6Quantitative PCR analysis of the
expression of 7 differentially expressed genes
**P<0.01 and ***P<0.001. The expression
trends of the detected genes were consistent with those obtained by
RNA-sequencing, including the upregulated genes (Mmp13, Mmp12,
Mmp19, Arg1, Hmox1 and Fmo3) and downregulated gene (Klf15). (A)
Compared with that in Blank group, the expression level of Klf15
decreased significantly in DVT group. ***P<0.001. (B)
The expression level of Mmp12 increased significantly in DVT group
than that in Blank group. ***P<0.001. (C) The
expression level of Mmp13 increased significantly in DVT group than
that in Blank group. **P<0.01. (D) The expression
level of Mmp19 increased significantly in DVT group than that in
Blank group. ***P<0.001. (E) Compared with that in
Blank group, the expression level of Arg1 increased significantly
in DVT group. ***P<0.001. (F) Compared with that in
Blank group, the expression level of Ccl2 increased significantly
in DVT group. **P<0.01. (G) Compared with that in
Blank group, the expression level of Fmo3 increased significantly
in DVT group. ***P<0.001. (H) Compared with that in
Blank group, the expression level of Hmox1 increased significantly
in DVT group. ***P<0.001. Klf15, Krüppel-like family
15; DVT, deep venous thrombosis. |
Results
Effect of Klf15 on thrombosis formation
and the wet weight of the mouse thrombus
Klf15 has been shown to be critical for the
initiation and progression of vascular inflammation (6). In this study, to identify the
effects of Klf15 on DVT, morphological experiments were conducted
on mice with IVC thrombi, which were divided into four groups: The
Blank group, the DVT group, the Klf15-NC group with 0.9% NS caudal
vein injection and the Klf15-siRNA group with Klf15-siRNA caudal
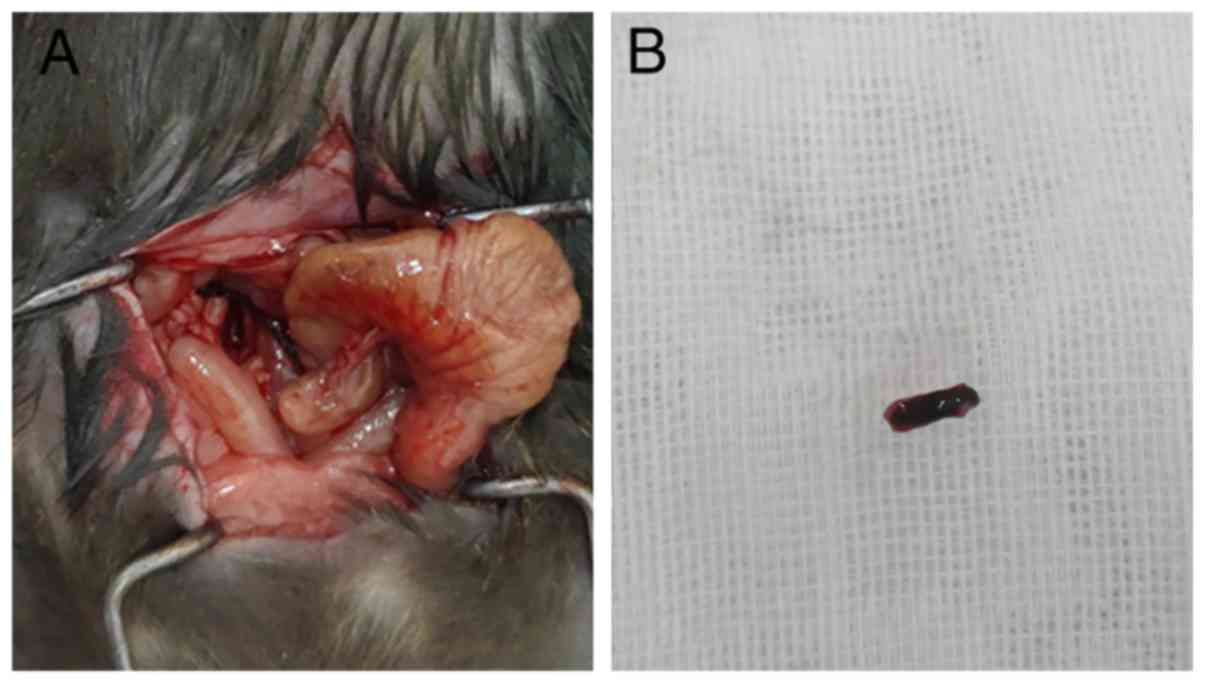
vein injection (Table I). The
vessels were removed from the mice of Blank group. If there was a
blood clot blocking the vein based on direct observations (Fig. 1A), the clot was removed from the
mouse for further examination (Fig.
1B). The results revealed that the weight of the thrombus in
the Klf15-siRNA group was increased compared with that in the
Klf15-NC group. As shown in Fig.
1C, compared with the Klf15-NC group, the Klf15-siRNA group
with Klf15-siRNA injection (and thus with significantly reduced
Klf15 expression) exhibited a significantly increased thrombus wet
weight (Fig. 1D). Thus, Klf15 is
significantly associated with thrombus formation and weight.
 | Table INumber of successful injection of
mice and successful modeling of DVT mice. |
Table I
Number of successful injection of
mice and successful modeling of DVT mice.
| Group | Blank | DVT | Klf15-NC | Klf15-siRNA |
|---|
| Sample size | 10 | 10 | 10 | 10 |
| Number of
successful injection of mice | - | - | 9 | 8 |
| Number of
successful modeling of DVT mice | - | 7 | 5 | 5 |
RNA-seq results, data quality assessment
and mapping
After performing the morphological experiments
previously described, genetic analysis was conducted by RNA-seq, a
method of high-throughput sequencing, to investigate
transcriptional gene abundance and simultaneously study active
regions of transcription.
Samples were divided into four groups: The Blank
group, the DVT group, the Klf15-NC group (0.9% NS caudal vein
injection) and the Klf15-siRNA group (Klf15-siRNA caudal vein
injection). A total of ~25.8 and 28.1 million raw reads were
collected from the DVT and Blank groups, respectively, while 29.6
and 30.3 million raw reads were obtained from the Klf15-NC and
Klf15-siRNA groups, respectively. Then, further analysis was
performed to obtain high-quality clean reads and the low-quality
reads, which had either >50% of bases with a Q value ≤20 or
>5% of unrecognized sequences ('N'), were discarded.
Consequently, ~24.8 and 26.8 million high-quality clean reads were
obtained from the DVT and Blank groups, respectively, 29.1 and 29.6
million high-quality clean reads were obtained from the Klf15-NC
and Klf15-siRNA groups, respectively. Then, the clean reads were
mapped to the human reference genome for downstream gene analyses.
As a result, the rates of mapping for the DVT group and the Blank
group were 89.40 and 90.22%, respectively, while the rates of
mapping for the Klf15-NC group and the Klf15-siRNA group were 89.26
and 90.12%, respectively, which demonstrated the quality of the
gene mapping. The results of the RNA-seq reads are listed in
Table II and the mapping results
are listed in Table III. The
high-quality reads for different groups were collected for further
analyses.
| Table IIQuality assessment of the raw
RNA-sequences reads results of the sequences. |
Table II
Quality assessment of the raw
RNA-sequences reads results of the sequences.
| Sample | Raw_reads | Clean_reads | Clean_bases | Error_rate | Q20 | Q30 | GC_pct |
|---|
| DVT1 | 26177314 | 25683459 | 7.71G | 0.03 | 97.39 | 92.99 | 50.06 |
| DVT2 | 23970627 | 22164628 | 6.65G | 0.03 | 97.01 | 92.28 | 50.38 |
| DVT3 | 27492800 | 26662217 | 8.0G | 0.03 | 97.55 | 93.50 | 50.96 |
| Blank1 | 30056705 | 27671970 | 8.3G | 0.03 | 97.73 | 93.81 | 50.95 |
| Blank2 | 26587894 | 26131760 | 7.84G | 0.03 | 97.30 | 92.87 | 50.33 |
| Blank3 | 27518969 | 26623013 | 7.99G | 0.03 | 96.92 | 92.03 | 50.23 |
| Klf15-NC1 | 23873304 | 23344387 | 7.0G | 0.02 | 98.19 | 94.79 | 50.64 |
| Klf15-NC3 | 31553809 | 31061688 | 9.32G | 0.02 | 98.28 | 95.07 | 51.05 |
| Klf15-NC4 | 33418796 | 32815907 | 9.84G | 0.02 | 98.19 | 94.84 | 51.31 |
| Klf15-siRNA_2 | 28443883 | 27658994 | 8.3G | 0.02 | 98.18 | 94.81 | 50.36 |
| Klf15-siRNA_3 | 31256846 | 30573498 | 9.17G | 0.02 | 98.26 | 94.90 | 51.13 |
| Klf15-siRNA_5 | 31209875 | 30496859 | 9.15G | 0.02 | 98.05 | 94.40 | 50.41 |
| Table IIIRead mapping results of the
sequences |
Table III
Read mapping results of the
sequences
| Sample | Total_reads | Total_map (%) | Unique_map (%) | Multi_map (%) | Splice_map (%) |
|---|
| DVT1 | 51366918 | 49046085
(95.48) | 46528972
(90.58) | 2517113 (4.9) | 17368593
(33.81) |
| DVT2 | 44329256 | 41980259
(94.7) | 39085822
(88.17) | 2894437 (6.53) | 15925579
(35.93) |
| DVT3 | 53324434 | 50898142
(95.45) | 47701078
(89.45) | 3197064 (6.0) | 19203249
(36.01) |
| Blank1 | 55343940 | 53021663
(95.8) | 49481609
(89.41) | 3540054 (6.4) | 20032572
(36.2) |
| Blank2 | 52263520 | 49811834
(95.31) | 47560000
(91.0) | 2251834 (4.31) | 18114051
(34.66) |
| Blank3 | 53246026 | 50413825
(94.68) | 48052390
(90.25) | 2361435 (4.43) | 18879029
(35.46) |
| Klf15-NC1 | 46688774 | 45469186
(97.39) | 42152166
(90.28) | 3317020 (7.1) | 16922773
(36.25) |
| Klf15-NC3 | 62123376 | 60297028
(97.06) | 55302462
(89.02) | 4994566 (8.04) | 21761027
(35.03) |
| Klf15-NC4 | 65631814 | 63630957
(96.95) | 58085965
(88.5) | 5544992 (8.45) | 23699020
(36.11) |
| Klf15-siRNA_2 | 55317988 | 53743158
(97.15) | 50929624
(92.07) | 2813534 (5.09) | 19622245
(35.47) |
| Klf15-siRNA_3 | 61146996 | 59683848
(97.61) | 53836311
(88.04) | 5847537 (9.56) | 22426460
(36.68) |
| Klf15-siRNA_5 | 60993718 | 59329105
(97.27) | 55020590
(90.21) | 4308515 (7.06) | 21394177
(35.08) |
Correlation analysis, principal component
analysis (PCA) and clustering analysis
To study the correlation and clustering of the
transcript sequences, the FPKM method was used to evaluate the
expression level of transcripts and the correlations between
replicates, which were determined in each sample by utilizing the
genetic length and the reads mapped to the human reference
genome.
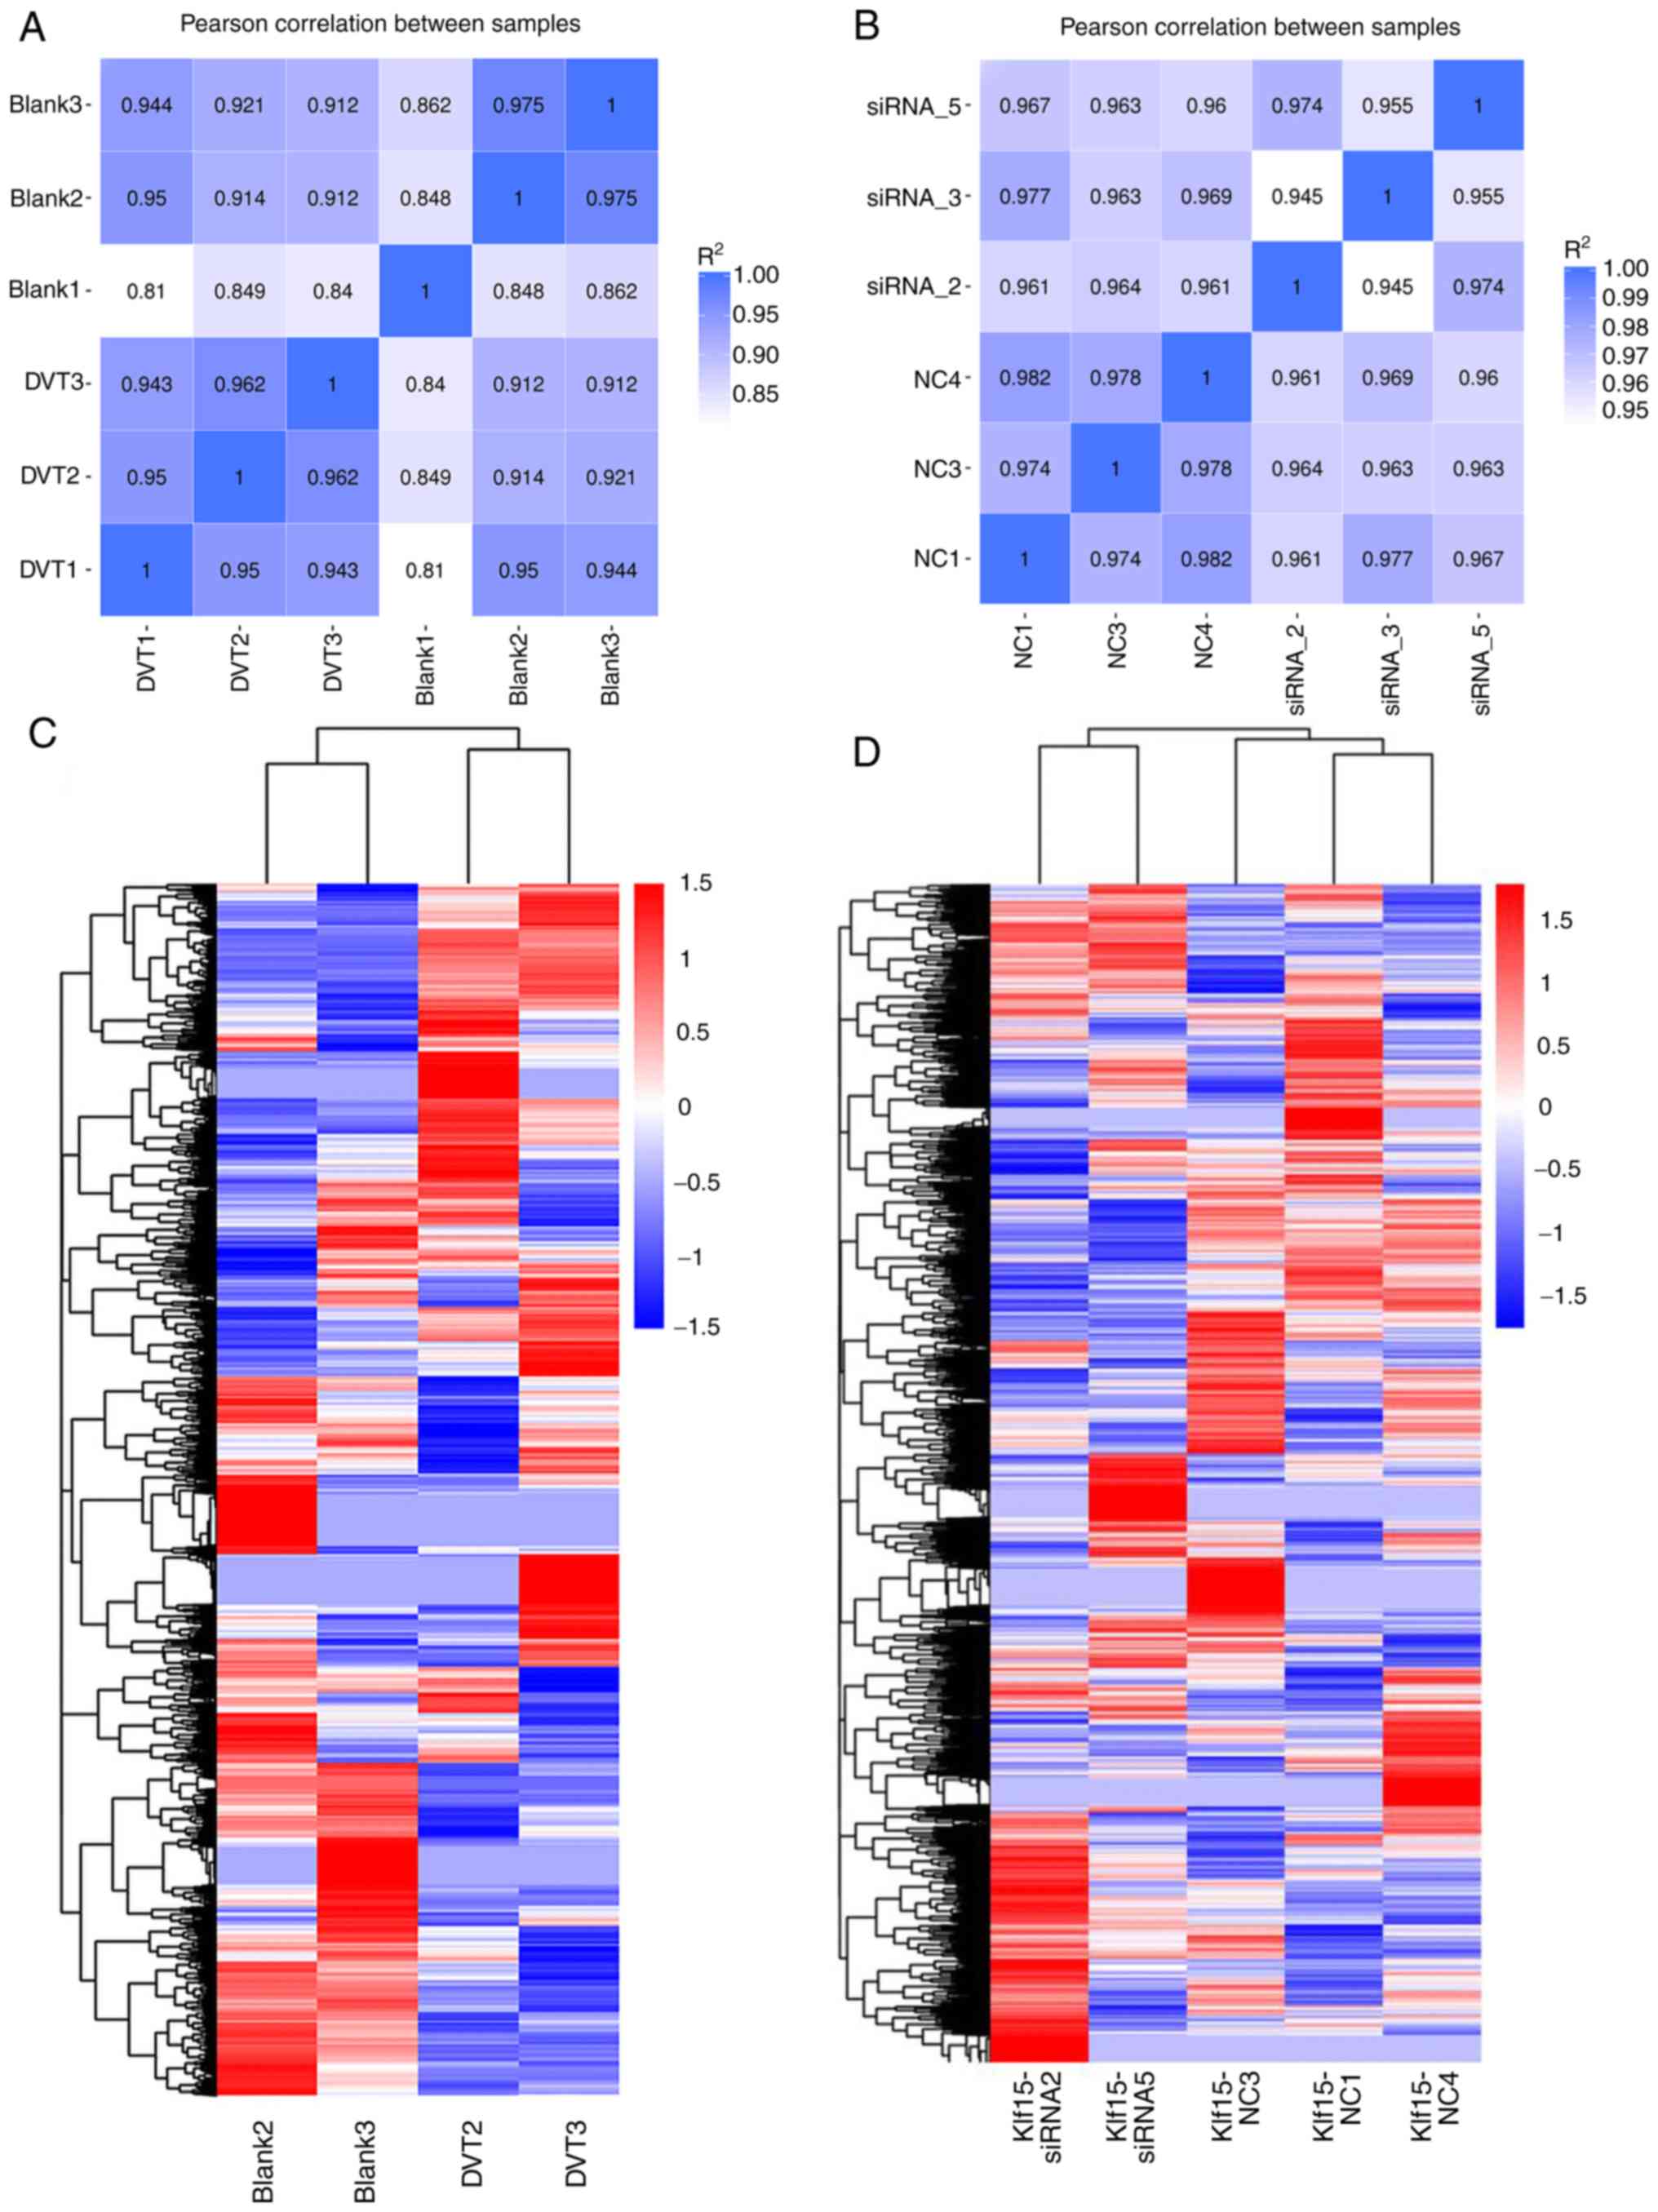
As shown in Fig. 2A
and B, except for the Blank 1 group with an R2≤0.8,
Pearson's correlation analysis indicated that the distribution of
the FPKM values were significantly consistent for all replicates
compared with each group (R2≥0.8).
Furthermore, PCA was performed to evaluate the
differences among groups and the consistency of samples within
groups, which were expected to be distant from each other in
different groups and clustered within the same group. The Blank 1
group, the DVT 1 group and the Klf15-siRNA 3 group were discarded,
as these groups exhibited poor correlations with their own groups.
Thus, clustering analysis was performed on groups of samples that
were further separated into subgroups according to the PCA results:
The Blank group (Blank 2 and Blank 3), the DVT group (DVT 2 and DVT
3), the Klf15-siRNA group (Klf15-siRNA2 and Klf15-siRNA5) and the
Klf15-NC group (NC1, NC3 and NC4). The clustering analysis showed
repeatable and correlative characteristics in the data. The results
of the clustering analysis demonstrated gene expression differences
between the Blank group and the DVT group and between the
Klf15-siRNA group and the Klf15-NC group (Fig. 2C and D).
Identification of DEGs
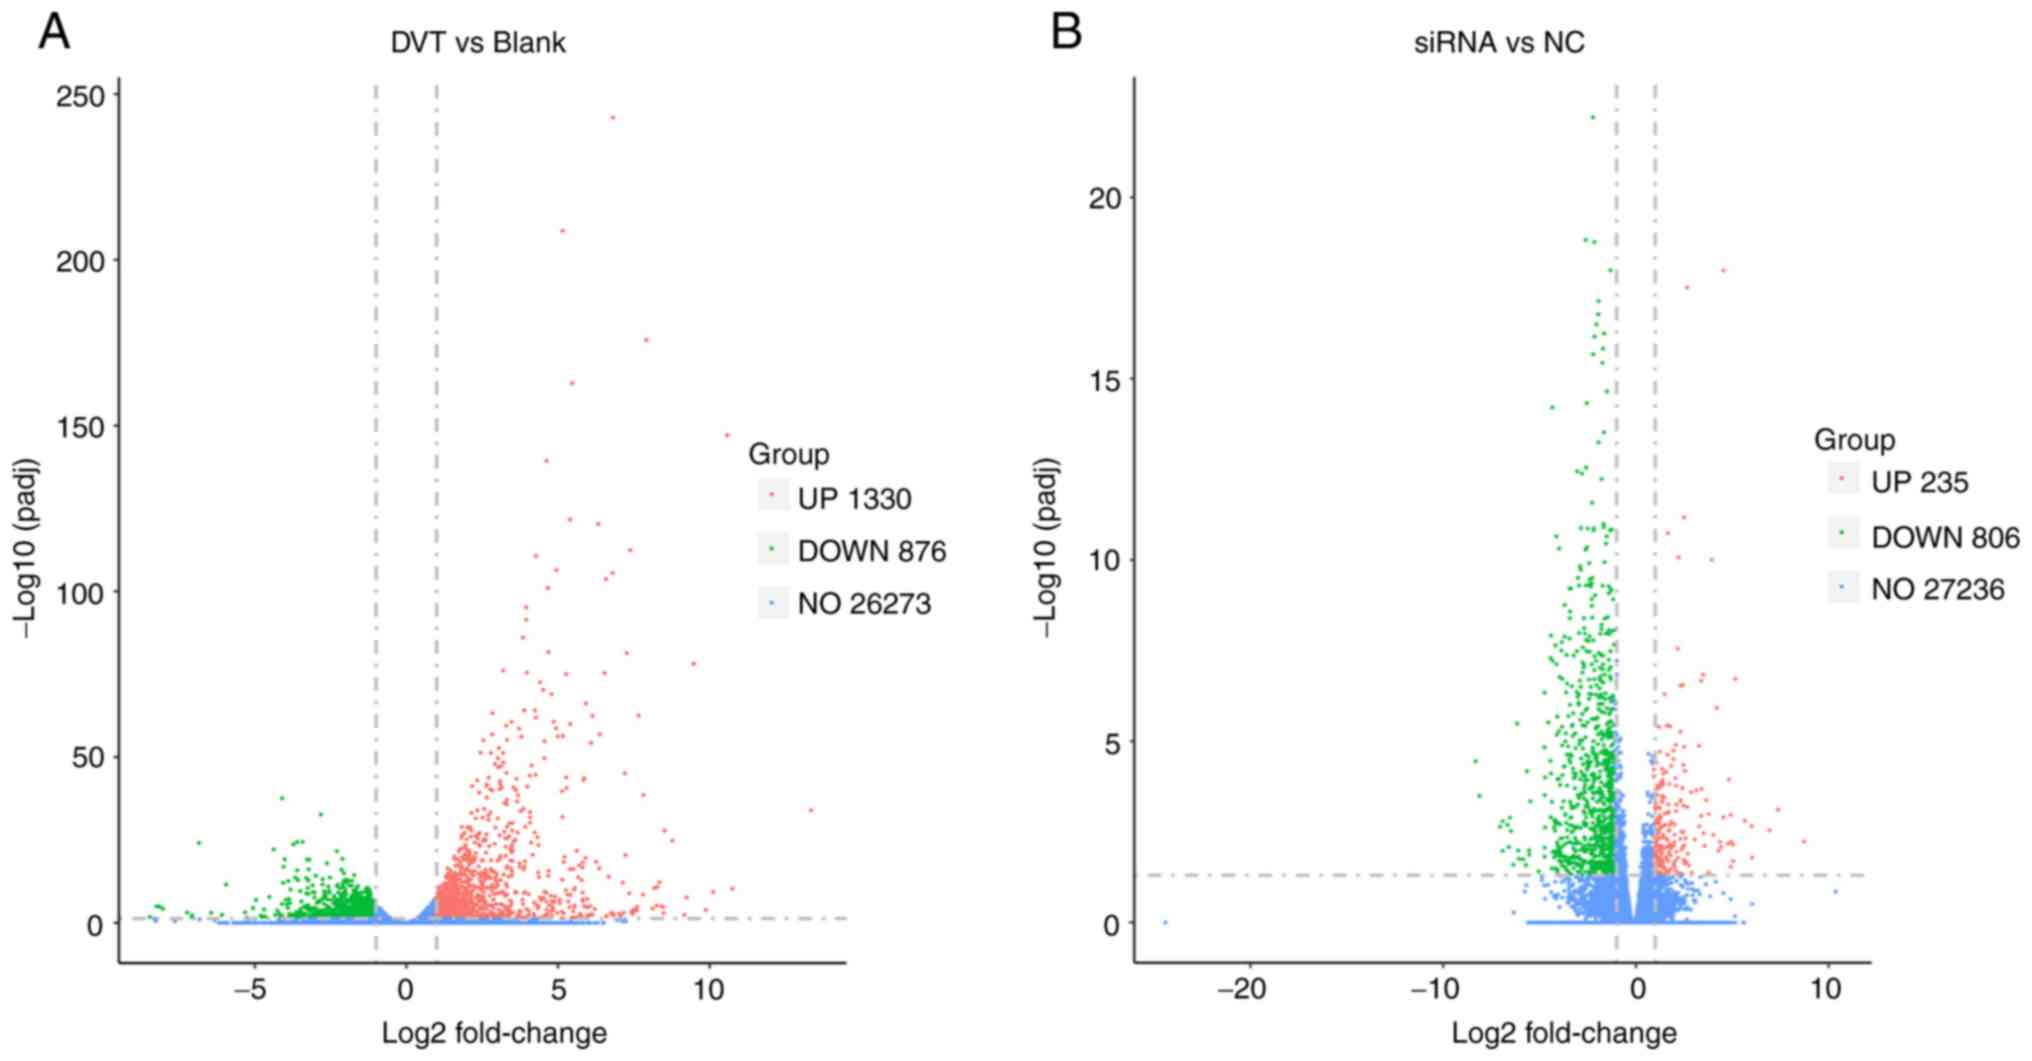
For analysis of gene expression and the DEGs, data
processing was conducted with the essential conditions of an
adjusted P<0.05 and log2-fold-change (FC) for the determination
of gene regulation, which was log2FC>1 for upregulated genes and
log2FC<-1 for down-regulated genes. In total, 2,206 DEGs were
identified from the comparison of the DVT group and Blank group,
including 1,330 upregulated genes and 876 downregulated genes,
which are represented as red points and green points in the volcano
plot, respectively (Fig. 3A).
Gene expression analysis also revealed 1,041 DEGs between the
Klf15-siRNA group and the Klf15-NC group, with 235 upregulated
genes and 806 downregulated genes (Fig. 3B). The number of DEGs in each
comparison is listed in Table
IV. As shown in Table V, the
expression levels of these genes showed significant differences in
the DVT group compared with in the Blank group and the genes mainly
clustered into three gene families; there were five genes in the
Mmp family, four genes in the IL family, and 13 genes in the
chemokine family. The expression levels of Mmp3, Mmp8, Mmp9, Mmp13
and Mmp19 in the DVT group were significantly increased compared
with those in the Blank group. The expression of Mmp12 was also
increased in the DVT group when compared with the Blank group;
however, this finding was not significant. Genes in the interleukin
(IL) family, including Il-lr2, Il-la, Il-lb and Il-6, were
expressed more highly in the DVT group than in the Blank group.
Moreover, the expression levels of genes in the Cc and Cx families
of the DVT group were higher than those of the Blank group, except
the expression level of Cc121a, which was lower in the DVT group
than in the Blank group.
| Table IVThe number of DEGs identified from
four groups. |
Table IV
The number of DEGs identified from
four groups.
| DEG set | DEGs | Upregulated | Downregulated |
|---|
| DVT_vs_Blank | 2,206 | 1,330 | 876 |
|
Klf15-siRNA_vs_NC | 1,041 | 235 | 806 |
| Table VDEGs identified in a comparison of
the DVT group and the Blank group by RNA-sequencing. |
Table V
DEGs identified in a comparison of
the DVT group and the Blank group by RNA-sequencing.
| Gene_id | DVT | Blank | log2 Fold
change | Padj | Gene_name |
|---|
|
ENSMUSG00000049723 | 78.077668 | 47.9396 | 0.707139 | 0.566752 | Mmp12 |
|
ENSMUSG00000050578 | 204.5046 | 4.875547 | 5.391707 |
3.03×10−09 | Mmp13 |
|
ENSMUSG00000043613 | 3941.1668 | 290.8774 | 3.759948 |
3.10×10−39 | Mmp3 |
|
ENSMUSG00000005800 | 3114.6048 | 63.94969 | 5.606005 |
1.10×10⁻¹⁰ | Mmp8 |
|
ENSMUSG00000017737 | 7694.2132 | 732.7235 | 3.392543 |
1.06×10⁻²⁹ | Mmp9 |
|
ENSMUSG00000025355 | 1703.9523 | 203.5787 | 3.064868 |
1.52×10⁻¹³ | Mmp19 |
|
ENSMUSG00000026073 | 3607.8063 | 48.75941 | 6.20899 |
3.12×10−63 | Il1r2 |
|
ENSMUSG00000027399 | 553.44397 | 39.4537 | 3.811049 |
9.93×10⁻¹⁹ | Il1a |
|
ENSMUSG00000027398 | 5679.7852 | 139.7907 | 5.344781 |
9.60×10−76 | Il1b |
|
ENSMUSG00000025746 | 1369.395 | 5.758426 | 7.893124 |
2.59×10−39 | Il6 |
|
ENSMUSG00000035352 | 906.99266 | 100.0886 | 3.17938 |
6.97×10⁻²¹ | Ccl12 |
|
ENSMUSG00000035385 | 3020.6374 | 95.41017 | 4.984662 |
1.14×10−08 | Ccl2 |
|
ENSMUSG00000094686 | 7.4708094 | 119.9455 | −4.02534 |
2.10×10−06 | Ccl21a |
|
ENSMUSG00000000982 | 3120.6479 | 31.87038 | 6.61243 |
3.97×10−76 | Ccl3 |
|
ENSMUSG00000018930 | 1205.0351 | 32.31576 | 5.220409 |
1.03×10⁻³² | Ccl4 |
|
ENSMUSG00000035042 | 712.57684 | 2817.25 | −1.98337 |
1.21×10⁻¹¹ | Ccl5 |
|
ENSMUSG00000018927 | 8371.4662 | 1210.417 | 2.789986 |
1.64×10−44 | Ccl6 |
|
ENSMUSG00000035373 | 2485.7371 | 79.30941 | 4.970069 |
3.32×10−07 | Ccl7 |
|
ENSMUSG00000019122 | 5063.0309 | 592.4913 | 3.095273 |
2.35×10−50 | Ccl9 |
|
ENSMUSG00000029380 | 2017.182 | 19.95151 | 6.659775 |
1.9×10−104 | Cxcl1 |
|
ENSMUSG00000061353 | 6200.4582 | 10594.49 | −0.77288 |
4.82×10−05 | Cxcl12 |
|
ENSMUSG00000021508 | 3590.1969 | 118.9011 | 4.916188 |
6.83×10−07 | Cxcl14 |
|
ENSMUSG00000018920 | 523.29727 | 975.7794 | −0.89848 | 0.00284 | Cxcl16 |
|
ENSMUSG00000058427 | 16451.23 | 10.20436 | 10.65536 |
8.05×10−148 | Cxcl2 |
|
ENSMUSG00000029379 | 9750.5765 | 0.886821 | 13.4245 |
9.92×10⁻³⁵ | Cxcl3 |
|
ENSMUSG00000029371 | 3329.7922 | 4.430165 | 9.552655 |
7.59×10−79 | Cxcl5 |
|
ENSMUSG00000029417 | 721.6049 | 682.6357 | 0.079769 | 0.889672 | Cxcl9 |
|
ENSMUSG00000026180 | 3454.5181 | 333.2202 | 3.3741 |
5.89×10−46 | Cxcr2 |
|
ENSMUSG00000045382 | 3109.524 | 812.4151 | 1.93664 |
2.84×10⁻¹⁵ | Cxcr4 |
|
ENSMUSG00000048521 | 152.50759 | 568.3105 | −1.89793 |
1.83×10−07 | Cxcr6 |
|
ENSMUSG00000026691 | 114.11276 | 14.20097 | 3.004407 | 0.005941 | Fmo3 |
|
ENSMUSG00000026580 | 1733.686 | 129.0424 | 3.747548 |
5.07×10⁻²⁸ | Selp |
|
ENSMUSG00000046223 | 3734.2897 | 435.4963 | 3.100282 |
1.12×10−47 | Plaur |
|
ENSMUSG00000005413 | 12311.935 | 735.4273 | 4.065414 |
7.15×10−42 | Hmox1 |
|
ENSMUSG00000019987 | 9944.886 | 38.99255 | 7.994212 |
1.56×10−176 | Arg1 |
As shown in Table
V, there were four DEGs (Selp, Plaur, Hmoxl and Argl) that were
detected from the comparison between the DVT group and the Blank
group, which correlated with the previously obtained results.
Notably, two DEGs were identified, Fmo3 and Mmp19,
that had not been previously detected in DVT and are listed in
Table V.
As shown in Table
VI, three genes, Klf15, Mmp12 and Mmp13, showed higher
expression in the Klf15-siRNA group than in the Klf15-NC group,
except for the level of Klf15 itself due to the caudle vein
injection of Klf15 siRNA in mice of the Klf15-siRNA group.
| Table VIDifferentially expressed genes
identified in a comparison of the Klf15-siRNA group and the
Klf15-NC group. |
Table VI
Differentially expressed genes
identified in a comparison of the Klf15-siRNA group and the
Klf15-NC group.
| Gene_id | siRNA | NC | log2 Fold
change | Padj | Gene_name |
|---|
|
ENSMUSG00000030087 | 100.70496 | 301.1934 | −1.58155 | 0.000497 | Klf15 |
|
ENSMUSG00000049723 | 647.4817 | 101.9324 | 2.665213 |
6.61×10−05 | Mmp12 |
|
ENSMUSG00000050578 | 401.39705 | 115.9458 | 1.796271 | 0.000549 | Mmp13 |
GO analysis of DEGs
Previously in this study, DEGs were identified among
different groups. Thus, GO enrichment analysis was performed to
discover the biological processes of these DEGs, which demonstrated
significant functions of gene expression in different groups. Then,
the GO terms were divided into three categories: Biological process
(BP), cellular component (CC) and molecular function (MF).
As shown in Fig. 4A
and B, the top 30 ranked GO terms of the comparison between the
DVT group and the Blank group were selected for the bar graph and
scatter plot. Consequently, 'leukocyte migration' was the most
significantly enriched term. Then, 'positive regulation of
locomotion', 'positive regulation of cell motility' and 'positive
regulation of cell migration' accounted for the most enriched terms
in the BP category. In addition, in Fig. 4C and D, the top 30 ranked GO terms
from the comparison of the Klf15-siRNA group and the Klf15-NC group
showed that 'axon, postsynapse' and 'presynapse' were the most
highly enriched terms. At the same time, 'the regulation of ion
transmembrane transport', 'signal release' and 'modulation of
synaptic transmission' were abundant in both the CC category and
the MF category.
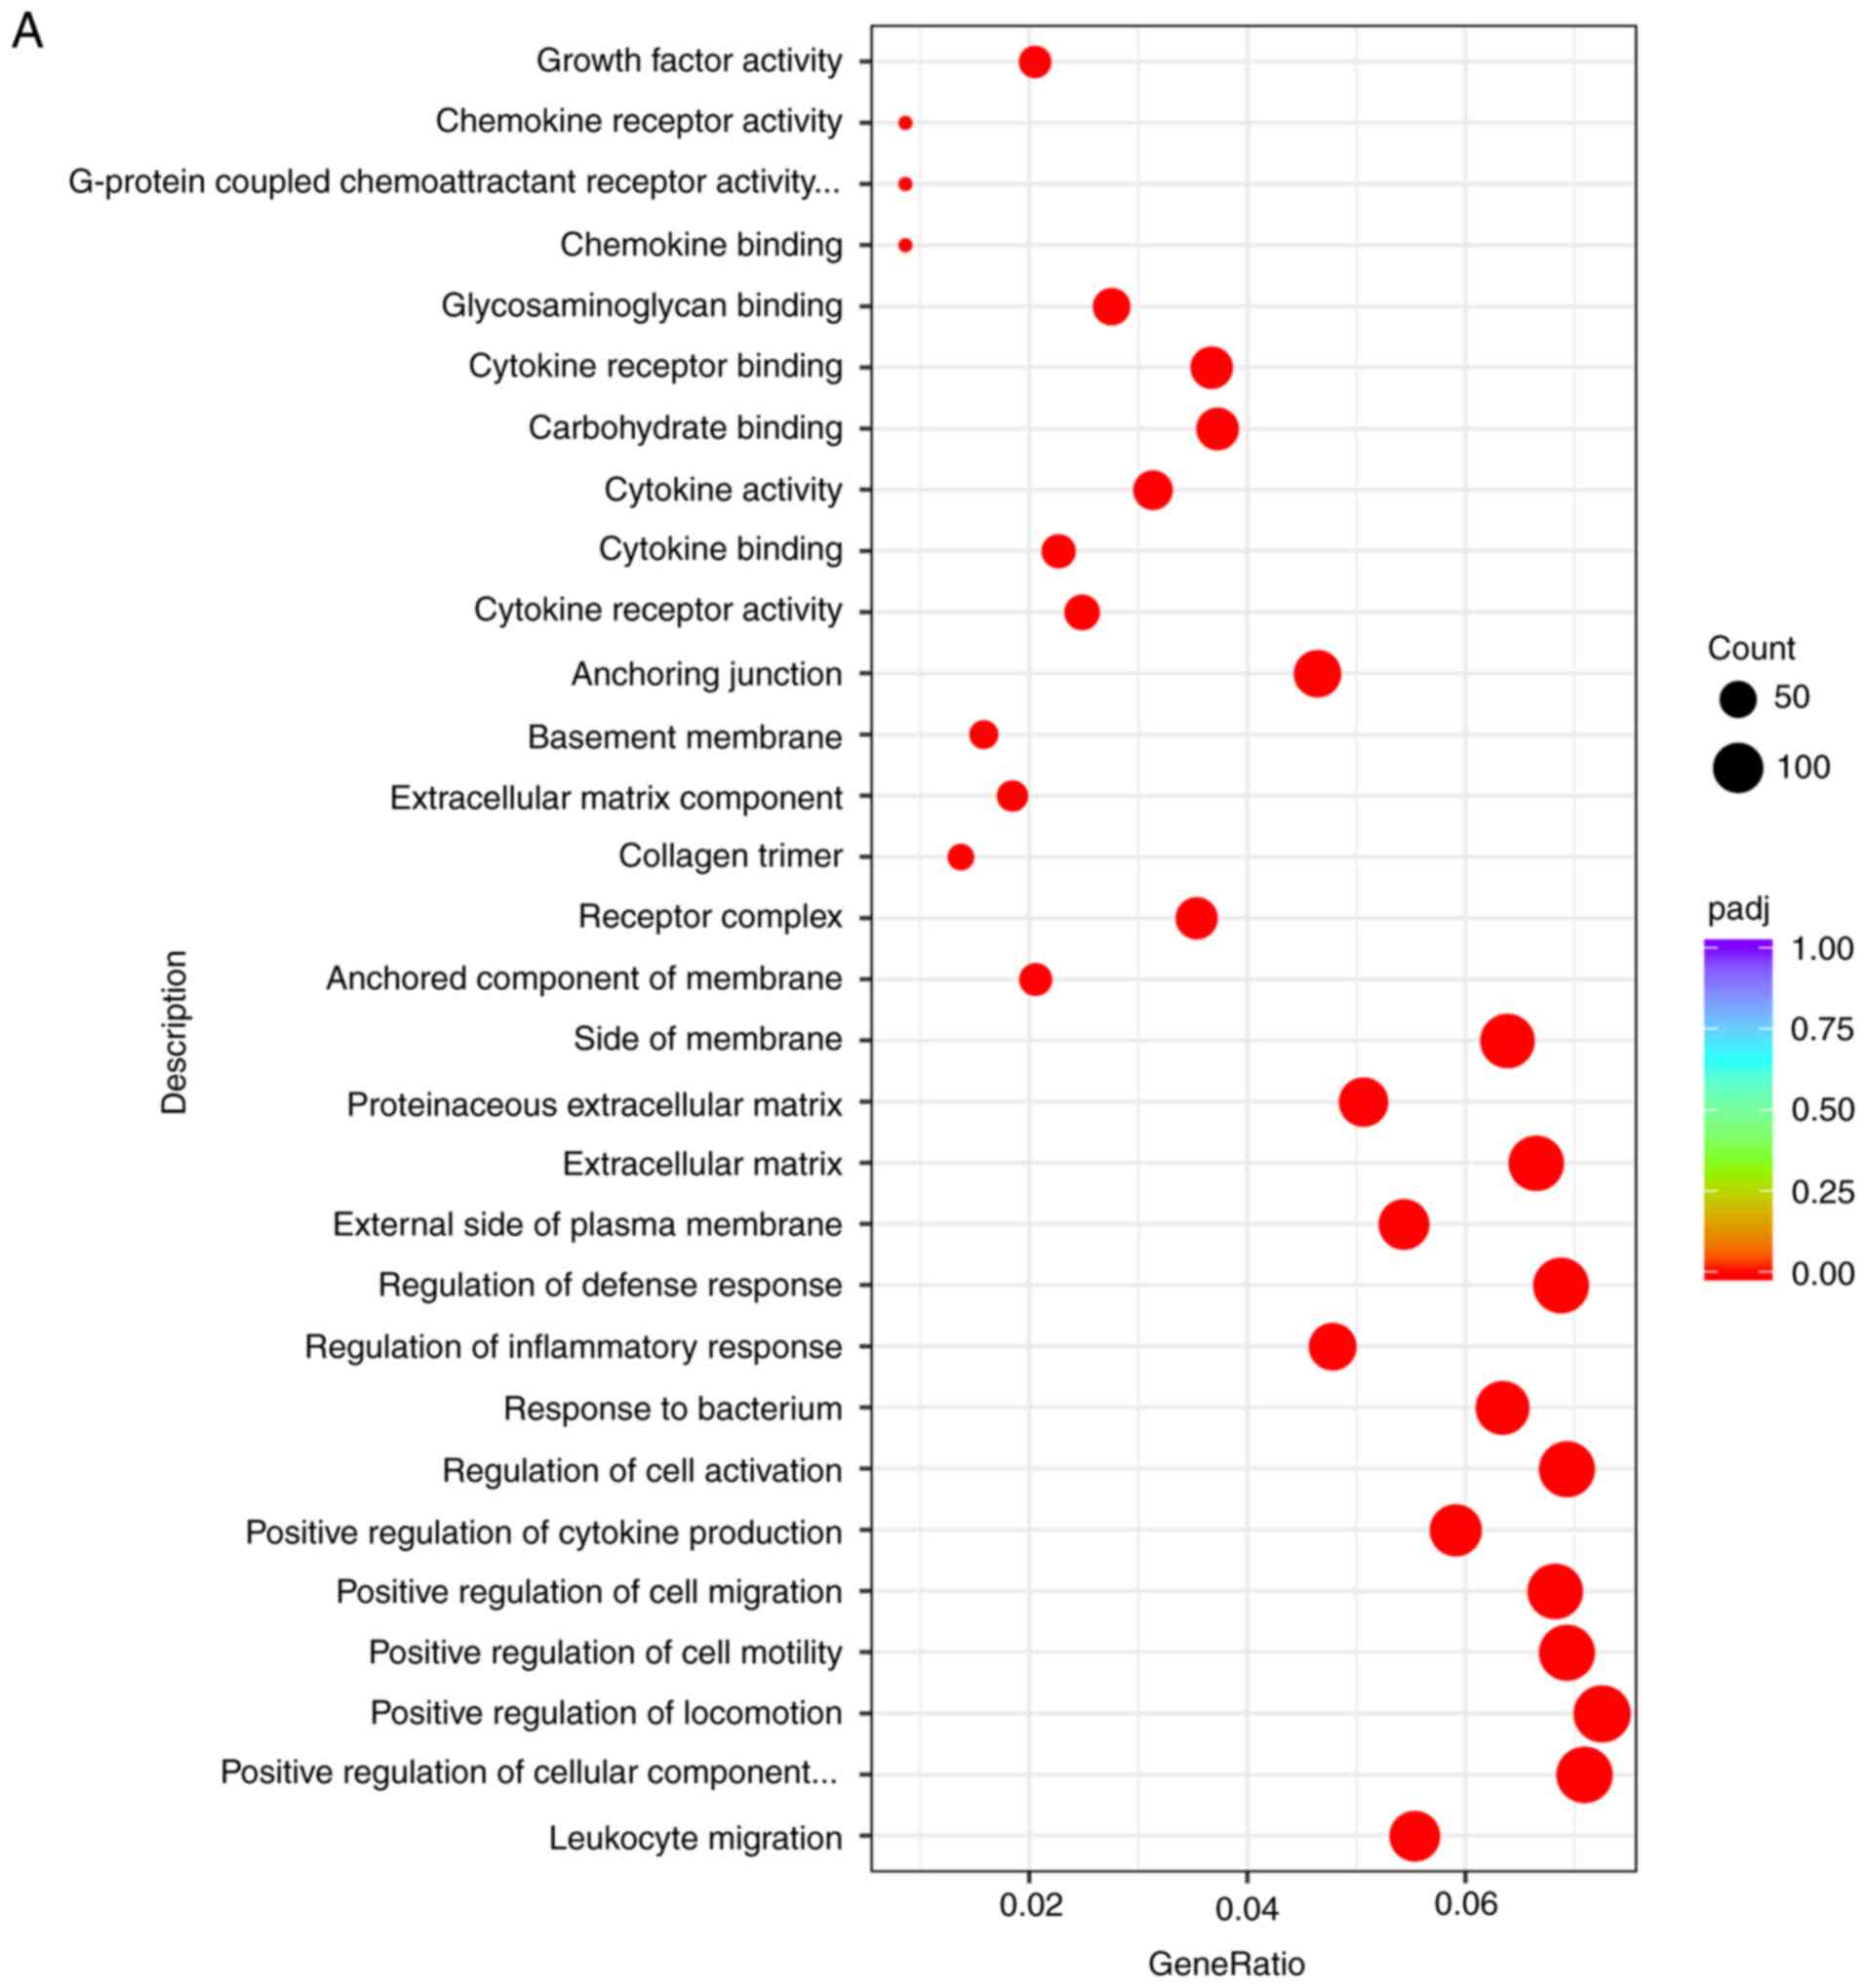 | Figure 4Bubble diagram and bar diagram of the
DEG GO terms. Bubble diagram of the top 20 ranked GO terms of the
DEGs. In the bubble diagram, the vertical axis indicates GO terms
and the horizontal axis represents the enrichment factor. The sizes
of dots indicate the number of genes in the GO term. In the bar
diagram, GO terms were divided into three categories: The red bar
represents BP, the green bar represents CC and the blue bar
indicates MF. (A) Bubble diagram of the top 30 ranked DEGs from the
comparison between the Blank group and the DVT group. (B) Bar
diagram of GO terms from the comparison between the Blank group and
the DVT group. Bubble diagram and bar diagram of the DEG GO terms.
Bubble diagram of the top 20 ranked GO terms of the DEGs. In the
bubble diagram, the vertical axis indicates GO terms and the
horizontal axis represents the enrichment factor. The sizes of dots
indicate the number of genes in the GO term. In the bar diagram, GO
terms were divided into three categories: The red bar represents
BP, the green bar represents CC and the blue bar indicates MF. (C)
Bubble diagram of the top 30 ranked DEGs from the comparison of the
Klf15-NC group and the Klf15-siRNA group. (D) Bar diagram of GO
terms from the comparison of the Klf15-NC group and the Klf15-siRNA
group. si, small interfering; Klf15, Krüppel-like family 15; DVT,
deep venous thrombosis; GO, gene ontology; BP, Biological process;
MF, molecular function; CC, cellular component; DEGs,
differentially expressed genes. |
The results of the GO analysis revealed the
distribution of genes in different biological functions, from which
information regarding DEGs that may be beneficial to further study
could be obtained.
KEGG pathway analysis of DEGs
To characterize the coordinative relations between
genes and the roles of genes in biological functions, DEGs were
analyzed by KEGG enrichment analysis, in which biochemical
metabolic and signal transduction pathways were detected from the
included DEGs.
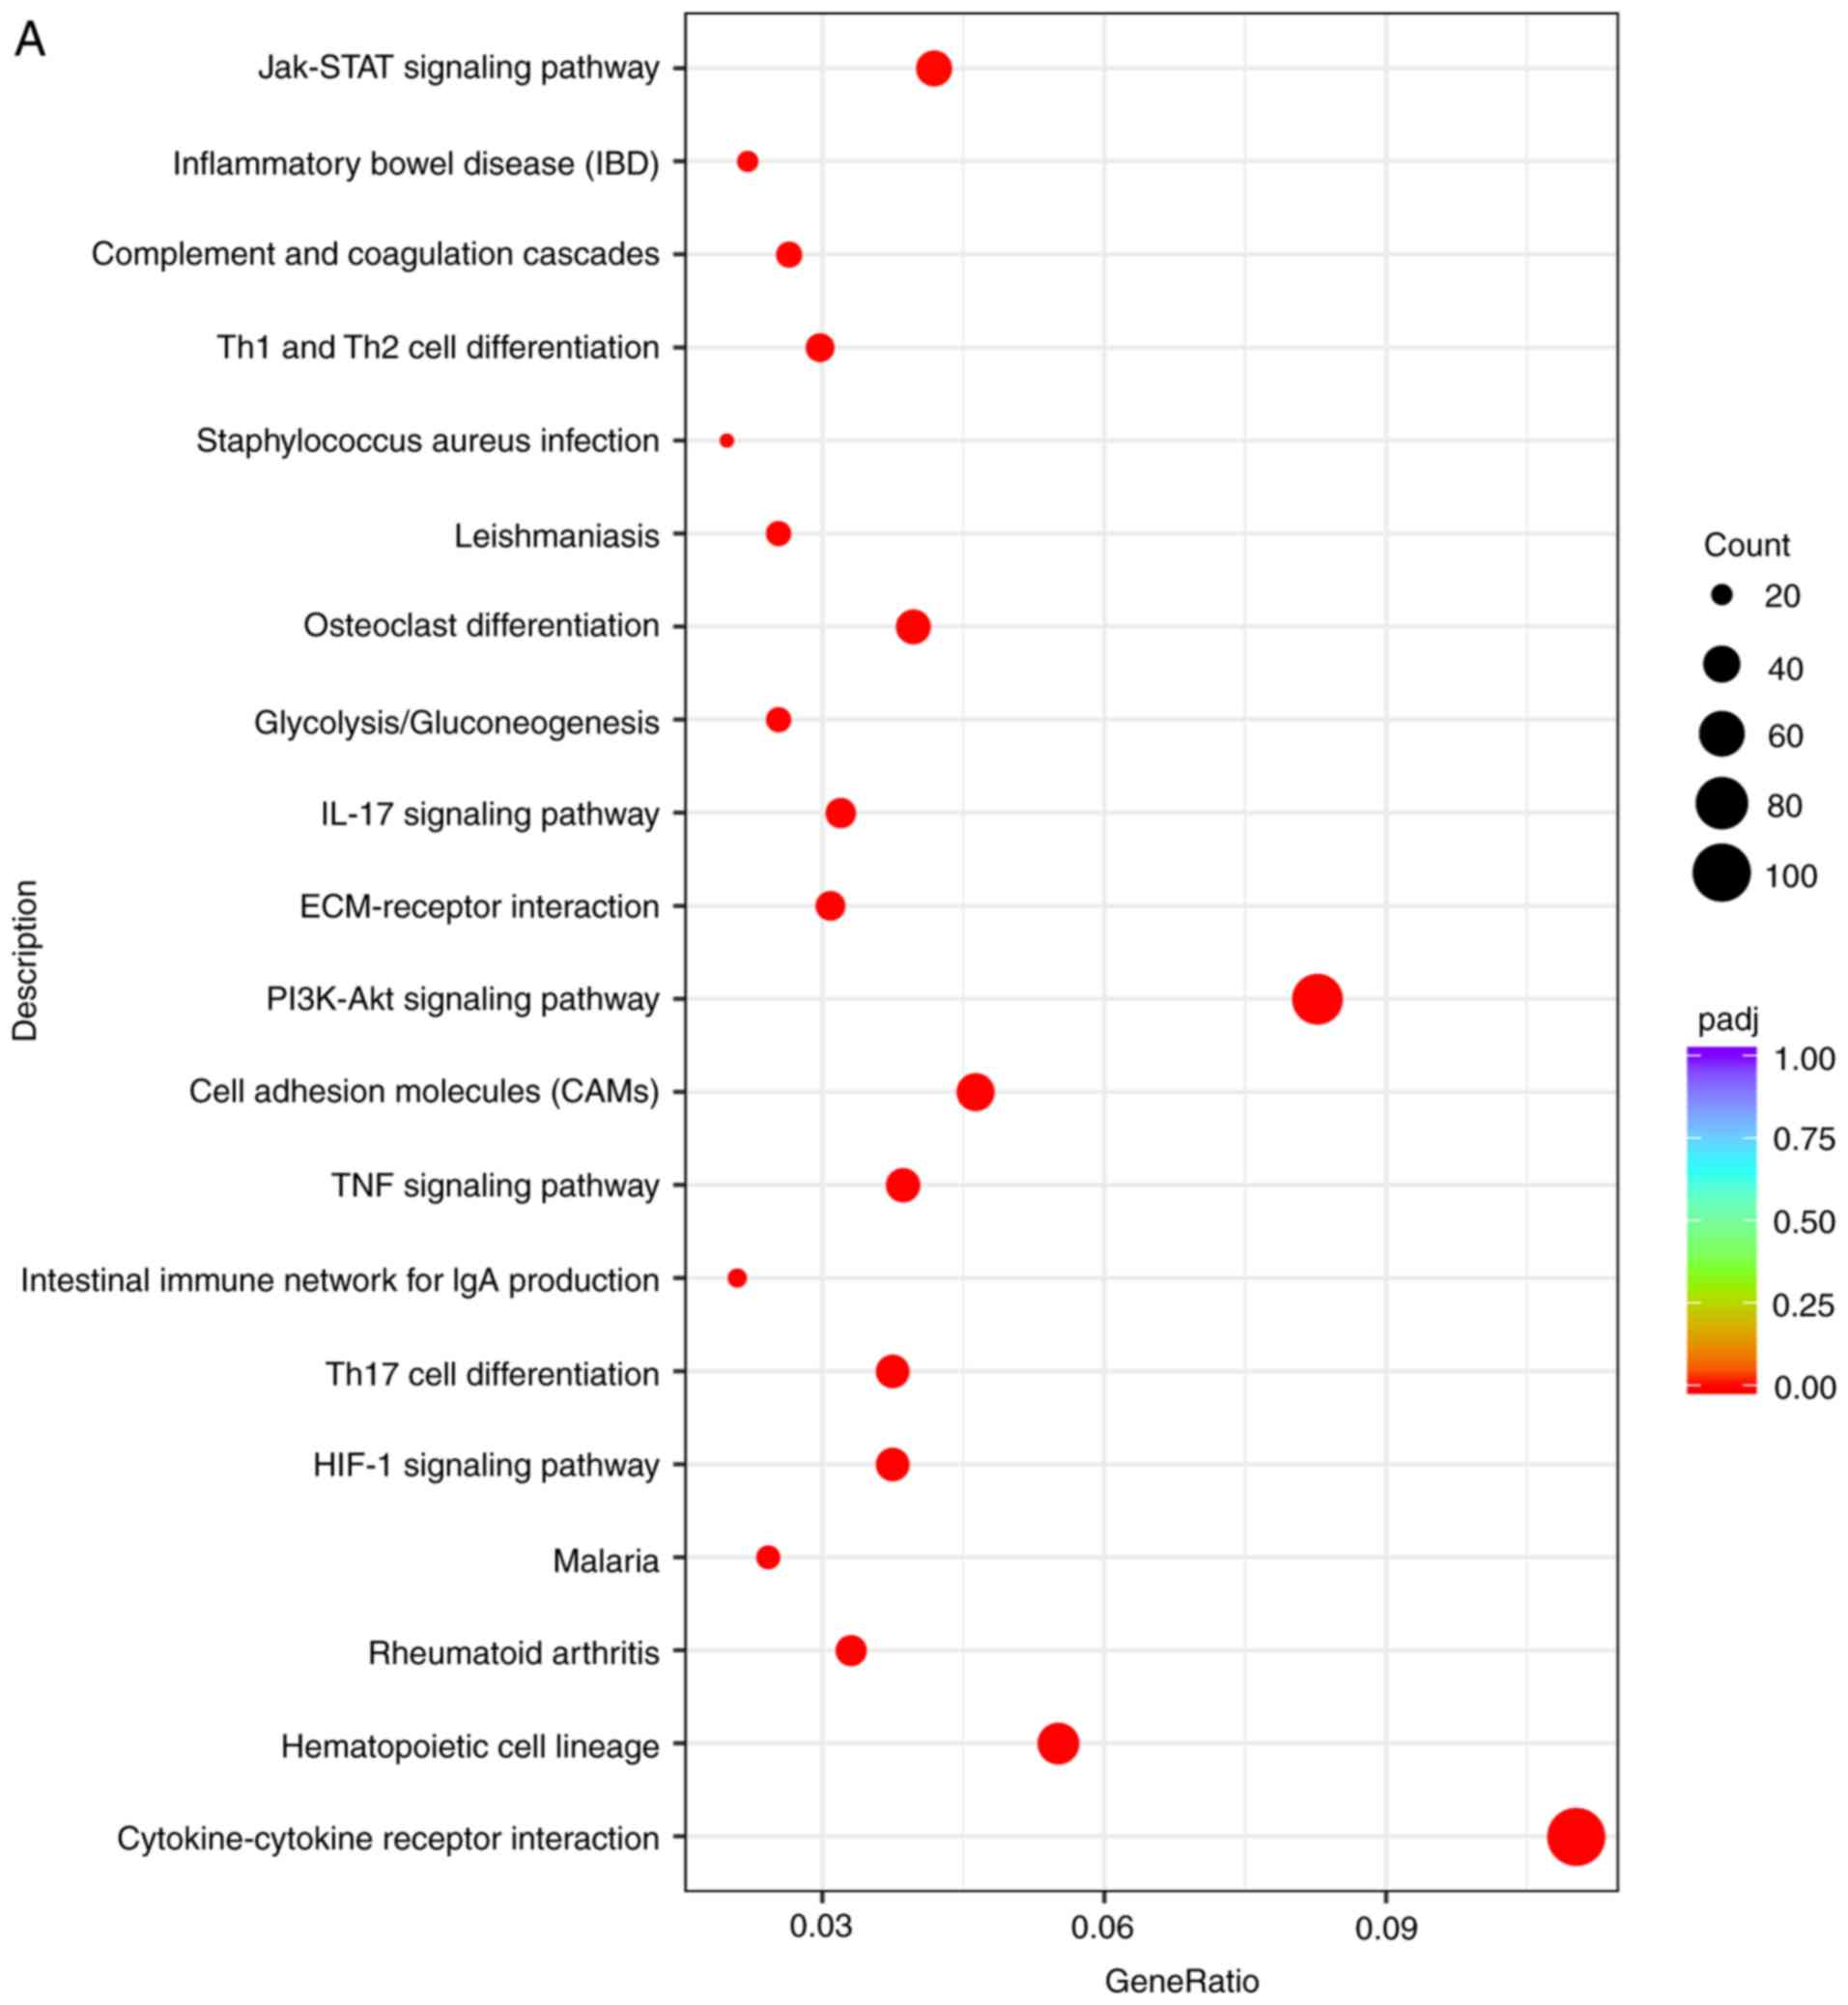
The results in Table
VII revealed that 50 pathways with significant expression
(P<0.01) were identified in the comparison between the DVT group
and the Blank group. In Fig. 5A and
B, the top 20 ranked pathways are listed in the bar graph and
bubble diagram; numerous signal transduction pathways were notably
enriched, including the 'HIF-1 signaling pathway', 'Th17 cell
differentiation', 'the intestinal immune network for IgA
production', 'TNF signaling pathway', 'cell adhesion molecules
(CAMs)', 'the PI3K-Akt signaling pathway', 'ECM-receptor
interactions', 'the Jak-STAT signaling pathway' and 'the IL-17
signaling pathway'. Moreover, BP terms, including 'the
cytokine-cytokine receptor interaction', 'hematopoietic cell
lineage', 'Th17 cell differentiation', 'CAM', 'ECM-receptor
interaction', 'glycolysis/gluconeogenesis', 'osteoclast
differentiation', 'Staphylococcus aureus infection', 'Th1
and Th2 cell differentiation', and 'complement and coagulation
cascade terms', were significantly enriched in the analysis.
| Table VIIKEGG pathway enrichment analysis of
the DVT group vs. the Blank group. |
Table VII
KEGG pathway enrichment analysis of
the DVT group vs. the Blank group.
| KEGGID | Description | Gene ratio | BgRatio | P-value | Count | Up | Down |
|---|
| mmu04060 | Cytokine-cytokine
receptor interaction | 100/907 | 234/6352 |
2.48×10⁻²⁷ | 100 | 60 | 40 |
| mmu04640 | Hematopoietic cell
lineage | 50/907 | 89/6352 |
1.65×10⁻²⁰ | 50 | 26 | 24 |
| mmu05323 | Rheumatoid
arthritis | 30/907 | 77/6352 |
7.01×10−08 | 30 | 21 | 9 |
| mmu05144 | Malaria | 22/907 | 47/6352 |
8.39×−08 | 22 | 20 | 2 |
| mmu04066 | HIF-1 signaling
pathway | 34/907 | 99/6352 |
3.48×10−07 | 34 | 31 | 3 |
| mmu04659 | Th17 cell
differentiation | 34/907 | 99/6352 |
3.48×10−07 | 34 | 13 | 21 |
| mmu04672 | Intestinal immune
network for IgA production | 19/907 | 41/6352 |
7.86×10−07 | 19 | 4 | 15 |
| mmu04668 | TNF signaling
pathway | 35/907 | 107/6352 |
8.86×10−07 | 35 | 32 | 3 |
| mmu04514 | Cell adhesion
molecules | 42/907 | 146/6352 |
3.46×10−06 | 42 | 18 | 24 |
| mmu04151 | PI3K-Akt signaling
pathway | 75/907 | 319/6352 |
4.15×10−06 | 75 | 51 | 24 |
| mmu04512 | ECM-receptor
interaction | 28/907 | 82/6352 |
4.28×10−06 | 28 | 19 | 9 |
| mmu04657 | IL-17 signaling
pathway | 29/907 | 87/6352 |
5.01×10−06 | 29 | 27 | 2 |
| mmu00010 |
Glycolysis/gluconeogenesis | 23/907 | 62/6352 |
6.36×10−06 | 23 | 19 | 4 |
| mmu04380 | Osteoclast
differentiation | 36/907 | 123/6352 |
1.13×10−05 | 36 | 34 | 2 |
| mmu05140 | Leishmaniasis | 23/907 | 65/6352 |
1.58×10−05 | 23 | 17 | 6 |
| mmu05150 | Staphylococcus
aureus infection | 18/907 | 45/6352 |
1.95×10−05 | 18 | 12 | 6 |
| mmu04658 | Th1 and Th2 cell
differentiation | 27/907 | 85/6352 |
2.85×10−05 | 27 | 7 | 20 |
| mmu04610 | Complement and
coagulation cascades | 24/907 | 73/6352 |
4.20×10−05 | 24 | 19 | 5 |
| mmu05321 | Inflammatory bowel
disease | 20/907 | 57/6352 |
6.44×10−05 | 20 | 10 | 10 |
| mmu04630 | Jak-STAT signaling
pathway | 38/907 | 143/6352 |
7.05×10−05 | 38 | 25 | 13 |
| mmu05152 | Tuberculosis | 41/907 | 160/6352 |
9.04×10−05 | 41 | 29 | 12 |
| mmu04064 | NF-κB signaling
pathway | 27/907 | 92/6352 | 0.0001319 | 27 | 16 | 11 |
| mmu05340 | Primary
immunodeficiency | 14/907 | 35/6352 | 0.0001645 | 14 | 0 | 14 |
| mmu05202 | Transcriptional
misregulation in cancer | 41/907 | 169/6352 | 0.0003243 | 41 | 27 | 14 |
| mmu05162 | Measles | 32/907 | 122/6352 | 0.0003335 | 32 | 19 | 13 |
| mmu04010 | MAPK signaling
pathway | 61/907 | 281/6352 | 0.0003692 | 61 | 49 | 12 |
| mmu05166 | HTLV-I
infection | 57/907 | 262/6352 | 0.0005396 | 57 | 31 | 26 |
| mmu05164 | Influenza A | 36/907 | 147/6352 | 0.0006105 | 36 | 27 | 9 |
| mmu00052 | Galactose
metabolism | 12/907 | 31/6352 | 0.0006857 | 12 | 11 | 1 |
| mmu05418 | Fluid shear stress
and atherosclerosis | 34/907 | 138/6352 | 0.0007639 | 34 | 31 | 3 |
| mmu05320 | Autoimmune thyroid
disease | 16/907 | 50/6352 | 0.0010955 | 16 | 6 | 10 |
| mmu00220 | Arginine
biosynthesis | 8/907 | 17/6352 | 0.001229 | 8 | 6 | 2 |
| mmu05145 | Toxoplasmosis | 27/907 | 105/6352 | 0.0013127 | 27 | 15 | 12 |
| mmu04062 | Chemokine signaling
pathway | 40/907 | 176/6352 | 0.0015037 | 40 | 27 | 13 |
| mmu04216 | Ferroptosis | 13/907 | 39/6352 | 0.0020876 | 13 | 11 | 2 |
| mmu04612 | Antigen processing
and presentation | 20/907 | 74/6352 | 0.0028603 | 20 | 9 | 11 |
| mmu05332 | Graft-versus-host
disease | 15/907 | 50/6352 | 0.0031691 | 15 | 7 | 8 |
| mmu05133 | Pertussis | 19/907 | 70/6352 | 0.0034227 | 19 | 17 | 2 |
| mmu04145 | Phagosome | 35/907 | 156/6352 | 0.0036189 | 35 | 25 | 10 |
| mmu04621 | NOD-like receptor
signaling pathway | 34/907 | 151/6352 | 0.0038603 | 34 | 30 | 4 |
| mmu05134 | Legionellosis | 16/907 | 56/6352 | 0.0040295 | 16 | 15 | 1 |
| mmu00590 | Arachidonic acid
metabolism | 17/907 | 61/6352 | 0.0040877 | 17 | 14 | 3 |
| mmu04620 | Toll-like receptor
signaling pathway | 22/907 | 87/6352 | 0.0044241 | 22 | 19 | 3 |
| mmu05230 | Central carbon
metabolism in cancer | 17/907 | 62/6352 | 0.0049021 | 17 | 16 | 1 |
| mmu05330 | Allograft
rejection | 14/907 | 48/6352 | 0.0056832 | 14 | 4 | 10 |
| mmu04940 | Type I diabetes
mellitus | 15/907 | 53/6352 | 0.0058193 | 15 | 6 | 9 |
| mmu04931 | Insulin
resistance | 25/907 | 105/6352 | 0.0058616 | 25 | 18 | 7 |
| mmu05310 | Asthma | 8/907 | 21/6352 | 0.0060726 | 8 | 1 | 7 |
| mmu05142 | Chagas disease
(American trypanosomiasis) | 24/907 | 100/6352 | 0.0061752 | 24 | 18 | 6 |
| mmu01230 | Biosynthesis of
amino acids | 18/907 | 70/6352 | 0.0079558 | 18 | 15 | 3 |
In the comparison between the Klf15-siRNA group and
the Klf15-NC group, 23 pathways with significant expression
(P<0.01) were identified and are listed in Table VIII. The top 20 ranked pathways
are shown in Fig. 5C and D. The
results revealed that several signal transduction pathways were
significantly enriched, including 'the PI3K-Akt signaling pathway',
'the Hippo signaling pathway', 'the cAMP signaling pathway' and
'the relaxin signaling pathway'. In addition, BP terms were
identified; these terms included 'the cholinergic synapse',
'neuroactive ligand-receptor interaction', 'ECM-receptor
interaction', 'dopaminergic synapse', 'nicotine addiction',
'rheumatoid arthritis', 'synaptic vesicle cycle', 'taste
transduction', 'vascular smooth muscle contraction', 'hypertrophic
cardiomyopathy (HCM)', 'serotonergic synapse', 'mucin type O-glycan
biosynthesis', 'dilated cardio-myopathy (DCM)' and 'protein
digestion and absorption' terms. Among these terms, the 'vascular
smooth muscle contraction', 'HCM' and 'DCM' terms provide crucial
information regarding the roles of Klf15 in the formation and
pathophysiological processes of vascular disease, especially
DVT.
| Table VIIIKEGG Pathways enrichment analysis of
KLF15-siRNA group vs. KLF15-NC group. |
Table VIII
KEGG Pathways enrichment analysis of
KLF15-siRNA group vs. KLF15-NC group.
| KEGGID | Description | Gene ratio | BgRatio | P-value | Count | Up | Down |
|---|
| mmu04514 | Cell adhesion
molecules | 25/352 | 144/6351 |
2.50×10−07 | 25 | 8 | 17 |
| mmu04725 | Cholinergic
synapse | 20/352 | 107/6351 |
1.23×10−06 | 20 | 0 | 20 |
| mmu04080 | Neuroactive
ligand-receptor interaction | 30/352 | 225/6351 |
5.42×10−06 | 30 | 3 | 27 |
| mmu04512 | ECM-receptor
interaction | 15/352 | 82/6351 |
3.52×10−05 | 15 | 0 | 15 |
| mmu04728 | Dopaminergic
synapse | 19/352 | 126/6351 |
5.60×10−05 | 19 | 0 | 19 |
| mmu05033 | Nicotine
addiction | 8/352 | 35/6351 | 0.0005167 | 8 | 0 | 8 |
| mmu05323 | Rheumatoid
arthritis | 12/352 | 76/6351 | 0.0008645 | 12 | 8 | 4 |
| mmu04151 | PI3K-Akt signaling
pathway | 32/352 | 325/6351 | 0.0009717 | 32 | 5 | 27 |
| mmu04721 | Synaptic vesicle
cycle | 10/352 | 59/6351 | 0.0013226 | 10 | 1 | 9 |
| mmu04742 | Taste
transduction | 9/352 | 50/6351 | 0.0014766 | 9 | 0 | 9 |
| mmu04270 | Vascular smooth
muscle contraction | 15/352 | 115/6351 | 0.0015912 | 15 | 1 | 14 |
| mmu05410 | Hypertrophic
cardiomyopathy | 12/352 | 82/6351 | 0.0017112 | 12 | 1 | 11 |
| mmu04390 | Hippo signaling
pathway | 18/352 | 152/6351 | 0.0017475 | 18 | 1 | 17 |
| mmu04726 | Serotonergic
synapse | 14/352 | 106/6351 | 0.0020024 | 14 | 0 | 14 |
| mmu00512 | Mucin type O-glycan
biosynthesis | 6/352 | 26/6351 | 0.0024822 | 6 | 1 | 5 |
| mmu05414 | Dilated
cardiomyopathy | 12/352 | 86/6351 | 0.0025876 | 12 | 0 | 12 |
| mmu04024 | cAMP signaling
pathway | 20/352 | 186/6351 | 0.003181 | 20 | 0 | 20 |
| mmu05321 | Inflammatory bowel
disease | 9/352 | 56/6351 | 0.003331 | 9 | 7 | 2 |
| mmu04974 | Protein digestion
and absorption | 11/352 | 78/6351 | 0.0035469 | 11 | 2 | 9 |
| mmu05144 | Malaria | 8/352 | 47/6351 | 0.0038607 | 8 | 2 | 6 |
| mmu04727 | GABAergic
synapse | 11/352 | 79/6351 | 0.0039219 | 11 | 0 | 11 |
| mmu04911 | Insulin
secretion | 11/352 | 79/6351 | 0.0039219 | 11 | 1 | 10 |
| mmu04926 | Relaxin signaling
pathway | 15/352 | 126/6351 | 0.0039259 | 15 | 1 | 14 |
qPCR validation of DEGs
Next, to confirm the results of the DEG analyses,
eight significant DEGs were selected from the RNA-seq results from
the comparison of the DVT and Blank groups for further qPCR
validation. As shown in Fig. 6,
the expression levels of Mmp12 and Mmp13 in the DVT group were
significantly increased compared with those in the Blank group. The
expression level of Klf15 in the DVT group decreased significantly
compared with that in the Blank group. Moreover, the levels of Mmp
19, Arg1, Ccl2, Fmo3 and Hmox1 in the DVT group were all
significantly increased compared with those in the Blank group,
which demonstrated the correlation of the results.
Discussion
DVT is one of the most common vascular diseases and
has a high mortality rate (1).
Nevertheless, the current diagnostic and therapeutic methods are
limited (18). In current DVT
studies, the mechanism and regulatory factors involved in the
formation and pathological process of DVT should be investigated to
provide a foundation for the diagnosis and treatment of DVT
(19).
Klf15 was shown to be closely related to
cardiovascular diseases such as hypertension, atherosclerosis and
coronary heart disease (20).
Klf15 is a transcriptional regulatory factor involved in various
functions, including cell differentiation, apoptosis and tumor
formation, and is expressed in various tissues and organs,
including the heart, liver, and kidneys (21). Moreover, Klf15 plays a key role in
the development of atherosclerosis (12). According to the authors'
preliminary experiments, it was found that Klf15 might also affect
thrombosis. To promote knowledge about the relationship and genetic
interaction between DVT and Klf15, this study was performed.
Numerous obstacles prevent the complete
understanding of the pathology, diagnosis and treatment of DVT. The
present study aimed to examine factors regulating the initiation
and progression of DVT and factors related to effective and
utilizable measures.
To the best of our knowledge, this is the first
study to perform high-throughput sequencing in a mouse DVT model
and to investigate the effect of Klf15 on DVT formation. The data
and analyses in the current study suggest that pathways including
TNF, PI3K-Akt, IL-17, Jak-STAT, NF-κB, and MAPK should be
considered, as such pathways were correlated with the formation of
thrombi according to the KEGG enrichment analysis of the DEGs
between the DVT and Blank groups. Previous studies (22,23) have reported that MAPK pathways are
related to vascular endothelial venous thrombosis and our
colleagues have suggested that resveratrol may exert an in
vitro antithrombotic activity by inactivating MAPK signaling
pathways (24). Moreover, KEGG
analysis of the comparison of the Klf15-siRNA group and the
Klf15-NC group indicated that PI3K-Akt play a central role in the
regulatory pathway involved in DVT formation.
The DEGs revealed by these comparisons indicated the
crucial role of certain genes in the regulation of DVT. In the
comparison of the DVT and Blank groups, the identified genes ranged
from members of the Mmp family, the IL family, and the chemokine
family to Selp, Plaur, Hmox 1 and Arg1. Fonseca et al
(25) indicated that Mmp plays a
critical role in numerous cellular processes. Li et al
(26) discovered that Mmp3
polymorphisms and upregulated protein expression in the Chinese Han
population may provide new markers associated with the evaluation
of DVT diagnosis and risk. Lenglet et al (27) performed a study on mice by
subjecting their brains to ischemic stroke and revealed
differentially expressed levels of Mmp family genes, including
significantly upregulated expression of Mmp9, 10, and 13 and Timp1.
Xiao et al (28) indicated
that Mmp8 enhanced vascular smooth muscle cell (VSMC) proliferation
and played an important role in neointima formation via ADAM10-,
N-cadherin-, and β-catenin-mediated pathways. Mmp8 enhances VSMC
proliferation, according to a study of WT and Mmp9-/- mice that
underwent stasis venous thrombosis (VT) by ligation of the IVC. The
tissues were harvested at different time points and the results
showed that the midterm vein wall collagen content was regulated by
Mmp9 (28). Thus, Mmp9 plays a
role in both vein wall responses and late thrombus resolution.
Quillard et al (29) found
that Mmp13 prevailed over Mmp8 in collagen degradation in
atheromata, thus identifying a selective target for plaque
structure formation. Based on the current analysis and previous
reports, the present study believes that the role of the MMP family
in DVT deserves further study.
Genes in the IL family were identified, including
Il-lr2, Il-la, Il-lb and Il-6, that showed higher expression in the
DVT group than in the Blank group. Gupta et al (30) demonstrated the increased
expression of NLRP3, caspase-1 and IL-1β in individuals with
clinically established VT. van Minkelen et al (31) found that IL1RN-H5H5
carriership increases the risk of VT. Analyses of the DEGs in the
chemokine families revealed that these DEGs had generally higher
expression in the DVT group than in the Blank group, with the
exception of some members mentioned in qPCR Validation of DEGs.
Among those genes in the Cc and Cx families, a study of Cxcr2 was
previously performed. Henke et al (32) found that normal DVT resolution
involved Cxcr2-mediated neovascularization, collagen turn-over and
fibrinolysis and that this process is probably primarily
monocyte-dependent. Henke and Wakefield (33) indicated that early thrombus
resolution primarily involves Cxcr2-associated plasmin activation
and Mmp-9, while later resolution involves both Cxcr2- and
Ccr2-mediated uPA cell influx and thrombus angiogenesis. According
to the above reports and our data, inflammation plays an important
role in the formation of DVT. The present study speculated that
Ccl2, a downstream gene of Klf15, may be the key factor in the
effects of Klf15 on DVT formation.
A study of the relationship between Hmox1 and DVT
was conducted by Bean et al (34) who identified a critical
cytoprotective enzyme encoded by the inducible Hmox1 gene with
anti-inflammatory, antioxidant and anticoagulant activities in the
vascular system. A (GT)n microsatellite located in the promoter of
the Hmox1 gene influences the level of the response. Peng et
al (35) stimulated HO-1
(Hmox1) production and revealed the inhibition of
platelet-dependent thrombus formation in HO-1−/− mice
compared with that in WT mice, and this inhibition may represent an
adaptive response mechanism to reduce platelet activation.
Bojic et al (36) conducted a study on mice regarding
the relationships between the peroxisome proliferator-activated
receptor (PPAR)δ agonist GW1516 in aortic inflammation and
atherosclerosis via intervention by the PPARδ agonist; this study
revealed that the progression of preestablished atherosclerosis was
inhibited by aortic inflammation and attenuated by the progression
of preestablished atherosclerosis. Furthermore, GW1516 intervention
decreased the expression of aortic proinflammatory M1 cytokines,
increased the expression of the anti-inflammatory M2 cytokine
Arg1 and attenuated the iNos/Arg1 ratio.
Samsoondar et al (37)
performed hepatic gene expression analysis on Ldlr−/−
mice fed a high-fat, high-cholesterol diet (42% kcal fat, 0.2%
cholesterol) supplemented with bempedoic acid at 0, 3, 10 and 30
mg/kg body weight. These results showed that in the full-length
aorta, bempedoic acid markedly suppressed cholesteryl ester
accumulation, attenuated the expression of proinflammatory M1 genes
and attenuated the iNos/Arg1 ratio, which
demonstrated that Ccl3 and Nos2 are marker genes for M1 macrophages
and that Arg1 may be a marker gene for M2 macrophages. To the best
of our knowledge, research and papers on the role of Arg1 in
thrombosis are scarce but based on the current data, it suggests
that Arg1 should be studied.
The present study first identified the critical
roles of Fmo3 and Mmp19 in regulating DVT. Zhu et al
(38) demonstrated that the
microbe-dependent production of trimethylamine N-oxide (TMAO)
contributes to the risk of thrombosis. Thus, a murine
FeCl3-induced carotid artery injury model was
established to confirm the impact of FMO3 suppression [via
antisense oligonucleotide (ASO) targeting] and overexpression (as a
transgene), which was examined by the plasma TMAO levels, platelet
responsiveness and thrombosis potential. The present study
demonstrated that host hepatic FMO3, the final product of the
metaorganismal TMAO pathway, participates in diet- and gut
microbiota-dependent changes in both platelet responsiveness and
thrombosis potential in vivo (37). Shih et al (39) treated WT and FMO3KO mice with
control or FMO-3 ASOs. FMO-3-ASO treatment led to the same extent
of lipid-lowering effects in the FMO3KO mice as it did in the WT
mice, indicating off-target effects. This study revealed that both
FMO3KO and WT mice fed a 0.5% choline diet showed a substantial
reduction in both TMAO and in vivo thrombosis potential.
In conclusion, a transcriptome study consisting of
two parts was performed to investigate the expression levels of
Klf15 and other related genes in C57BL/6 mice with IVC thrombi for
the first time. The experimental results indicated that 2,206 genes
were differentially expressed between the DVT group and the Blank
group, and 1,041 DEGs were identified by comparing the Klf15-siRNA
group with the Klf15-NC group. The present study confirmed that
Arg1, Ccl2 and Hmox1 are related to DVT, as previously identified,
and new genes related to the formation of DVT were identified,
including Fmo3 and Mmp19. Furthermore, to the best of our
knowledge, the present study is the first to reveal that genes such
as Mmp12 and Mmp13 are involved in the regulation of DVT; the
current results obtained via comparison of the Klf15-siRNA group
and the Klf15-NC group are especially revealing. Given the data
obtained in the present experiments, it is speculated that Klf15
may play a role in DVT by regulating inflammatory genes, some
members of the MMP family or other DEGs; however, this speculation
needs to be confirmed in the future. In the next study, cell
experiments, clinical experiments and additional animal experiments
will be performed to confirm the role of Klf15 in DVT, including
pathway regulation and whether DVT formation is regulated by Klf15
via Mmp12 and Mmp13. The present research provides new insights and
prospects for studying the mechanism of thrombosis and possible
drug targets.
Acknowledgements
Not applicable.
Funding
The present study was supported by the National
Natural Science Foundation of China (Grant. Nos. 81760029 and
81760030) and the Health Science and Technology Project of Yunnan
Province (Grant. Nos. 2017NS021 and 2018NS0106).
Availability of data and materials
The datasets used and/or analyzed during the current
study are available from the corresponding author upon reasonable
request.
Authors' contributions
XZ and RZ conceived the present study. RZ designed
the experiments. JZ and SX prepared the materials and conducted the
experiments on mice with IVC thrombi. XZ processed the data. RZ
contributed substantially to the data analysis and manuscript
revision. All authors read and approved the final manuscript.
Ethics approval and consent to
participate
All animal experiments were performed following
approval from the Animal Experimental Ethical Committee of Kunming
Medical University (Kunming, China).
Patient consent for publication
Not applicable.
Competing interest
The authors declare that they have no conflicts of
interest.
References
|
1
|
Huerta C, Johansson S, Wallander MA and
García Rodríguez LA: Risk factors and short-term mortality of
venous thromboembolism diagnosed in the primary care setting in the
United Kingdom. Arch Intern Med. 167:935–943. 2007. View Article : Google Scholar : PubMed/NCBI
|
|
2
|
Zhu L, Cheng J, Gu P, Liu Y, Liu J, Wang J
and Shen H: Therapeutic strategies of thromboembolic events in
patients with inflammatory bowel diseases: Two case reports.
Medicine (Baltimore). 98:e146222019. View Article : Google Scholar
|
|
3
|
Kandic Z, Firdus N, Kandic A, Catic L and
Kandic E: Treatment of the rectal cancer in casuistic clinic for
abdominal surgery, Clinical centre of the University of Sarajevo
(2006-2010). Acta Chir Iugosl. 59:97–101. 2012. View Article : Google Scholar
|
|
4
|
Leenders JJ, Wijnen WJ, van der Made I,
Hiller M, Swinnen M, Vandendriessche T, Chuah M, Pinto YM and
Creemers EE: Repression of cardiac hypertrophy by KLF15: Underlying
mechanisms and therapeutic implications. PLoS One. 7:e367542012.
View Article : Google Scholar : PubMed/NCBI
|
|
5
|
Payne H, Ponomaryov T, Watson SP and Brill
A: Mice with a deficiency in CLEC-2 are protected against deep vein
thrombosis. Blood. 129:2013–2020. 2017. View Article : Google Scholar : PubMed/NCBI
|
|
6
|
Brill A, Fuchs TA, Chauhan AK, Yang JJ, De
Meyer SF, Köllnberger M, Wakefield TW, Lämmle B, Massberg S and
Wagner DD: Von Willebrand factor-mediated platelet adhesion is
critical for deep vein thrombosis in mouse models. Blood.
117:1400–1407. 2011. View Article : Google Scholar :
|
|
7
|
Fan L, Hsieh PN, Sweet DR and Jain MK:
Krüppel-like factor 15: Regulator of BCAA metabolism and circadian
protein rhythmicity. Pharmacol Res. 130:123–126. 2018. View Article : Google Scholar
|
|
8
|
Lu Y, Zhang L, Liao X, Sangwung P,
Prosdocimo DA, Zhou G, Votruba AR, Brian L, Han YJ, Gao H, et al:
Kruppel-like factor 15 is critical for vascular inflammation. J
Clin Invest. 123:4232–4241. 2013. View
Article : Google Scholar : PubMed/NCBI
|
|
9
|
Trapnell C, Pachter L and Salzberg SL:
TopHat: Discovering splice junctions with RNA-Seq. Bioinformatics.
25:1105–1111. 2009. View Article : Google Scholar : PubMed/NCBI
|
|
10
|
Cui JY and Klaassen CD: RNA-Seq reveals
common and unique PXR-and CAR-target gene signatures in the mouse
liver transcriptome. Biochim Biophys Acta. 1859:1198–1217. 2016.
View Article : Google Scholar : PubMed/NCBI
|
|
11
|
Lu Y, Haldar S, Croce K, Wang Y, Sakuma M,
Morooka T, Wang B, Jeyaraj D, Gray SJ, Simon DI and Jain MK:
Kruppel-like factor 15 regulates smooth muscle response to vascular
injury-brief report. Arterioscler Thromb Vasc Biol. 30:1550–1552.
2010. View Article : Google Scholar : PubMed/NCBI
|
|
12
|
Liu B, Xu L, Yu X, Li W, Sun X, Xiao S,
Guo M and Wang H: Protective effect of KLF15 on vascular
endothelial dysfunction induced by TNF-α. Mol Med Rep.
18:1987–1994. 2018.PubMed/NCBI
|
|
13
|
Mackman N: Triggers, targets and
treatments for thrombosis. Nature. 451:914–918. 2008. View Article : Google Scholar : PubMed/NCBI
|
|
14
|
Yuping Y, Hua C and Qing Z: Advances in
the relationship between Kruppel-like factor 15 and cardiovascular
disease research. Cardiovasc Endocrinol Metab. 7:37–41. 2018.
View Article : Google Scholar : PubMed/NCBI
|
|
15
|
Mackman N: New insights into the
mechanisms of venous thrombosis. J Clin Invest. 122:2331–2336.
2012. View
Article : Google Scholar : PubMed/NCBI
|
|
16
|
Li G, Zhou R, Zhao X, Liu R and Ye C:
[Corrigendum] Correlation between the expression of IL-18 and deep
venous thrombosis. Int J Mol Med. August 27–2018.Epub ahead of
print.
|
|
17
|
Yu G, Wang LG, Han Y and He QY:
ClusterProfiler: An R package for comparing biological themes among
gene clusters. OMICS. 16:284–287. 2012. View Article : Google Scholar : PubMed/NCBI
|
|
18
|
Lee AY and Hirsh J: Diagnosis and
treatment of venous thromboembolism. Annu Rev Med. 53:15–33. 2002.
View Article : Google Scholar : PubMed/NCBI
|
|
19
|
Machlus KR, Aleman MM and Wolberg AS:
Update on venous thromboembolism: Risk factors, mechanisms, and
treatments. Arterioscler Thromb Vasc Biol. 31:476–478. 2011.
View Article : Google Scholar : PubMed/NCBI
|
|
20
|
Haldar SM, Lu Y, Jeyaraj D, Kawanami D,
Cui Y, Eapen SJ, Hao C, Li Y, Doughman YQ, Watanabe M, et al: Klf15
deficiency is a molecular link between heart failure and aortic
aneurysm formation. Sci Transl Med. 2:26ra262010. View Article : Google Scholar : PubMed/NCBI
|
|
21
|
Noack C, Haupt LP, Zimmermann WH,
Streckfuss-Bömeke K and Zelarayán LC: Generation of a KLF15
homozygous knockout human embryonic stem cell line using paired
CRISPR/Cas9n, and human cardiomyocytes derivation. Stem Cell Res.
23:127–131. 2017. View Article : Google Scholar : PubMed/NCBI
|
|
22
|
Jiang Z, Ma J, Wang Q, Wu F, Ping J and
Ming L: Circulating microRNA expression and their target genes in
deep vein thrombosis: A systematic review and bioinformatics
analysis. Medicine (Baltimore). 96:e93302017. View Article : Google Scholar
|
|
23
|
Noble S and Pasi J: Epidemiology and
pathophysiology of cancer-associated thrombosis. Br J Cancer.
102(Suppl 1): S2–S9. 2010. View Article : Google Scholar : PubMed/NCBI
|
|
24
|
Lou Z, Li X, Zhao X, Du K, Li X and Wang
B: Resveratrol attenuates hydrogen peroxide-induced apoptosis,
reactive oxygen species generation, and PSGL-1 and VWF activation
in human umbilical vein endothelial cells, potentially via MAPK
signalling pathways. Mol Med Rep. 17:2479–2487. 2018.
|
|
25
|
Fonseca FL, da Costa Aguiar Alves B,
Azzalis LA and Belardo TM: Matrix metalloproteases as biomarkers of
disease. Methods Mol Biol. 1579:299–311. 2017. View Article : Google Scholar : PubMed/NCBI
|
|
26
|
Li XP, Wan GZ, Wang GJ and Li JF:
MMP3-1171 5A/6A promoter genotype influences serum MMP3 levels and
is associated with deep venous thrombosis. Ann Vasc Surg.
34:261–267. 2016. View Article : Google Scholar : PubMed/NCBI
|
|
27
|
Lenglet S, Montecucco F, Mach F, Schaller
K, Gasche Y and Copin JC: Analysis of the expression of nine
secreted matrix metalloproteinases and their endogenous inhibitors
in the brain of mice subjected to ischaemic stroke. Thromb Haemost.
112:363–378. 2014. View Article : Google Scholar : PubMed/NCBI
|
|
28
|
Xiao Q, Zhang F, Grassia G, Hu Y, Zhang Z,
Xing Q, Yin X, Maddaluno M, Drung B, Schmidt B, et al: Matrix
metallopro-teinase-8 promotes vascular smooth muscle cell
proliferation and neointima formation. Arterioscler Thromb Vasc
Biol. 34:90–98. 2014. View Article : Google Scholar
|
|
29
|
Quillard T, Araújo HA, Franck G,
Tesmenitsky Y and Libby P: Matrix metalloproteinase-13 predominates
over matrix metal-loproteinase-8 as the functional interstitial
collagenase in mouse atheromata. Arterioscler Thromb Vasc Biol.
34:1179–1186. 2014. View Article : Google Scholar : PubMed/NCBI
|
|
30
|
Gupta N, Sahu A, Prabhakar A, Chatterjee
T, Tyagi T, Kumari B, Khan N, Nair V, Bajaj N, Sharma M and Ashraf
MZ: Activation of NLRP3 inflammasome complex potentiates venous
thrombosis in response to hypoxia. Proc Natl Acad Sci USA.
114:4763–4768. 2017. View Article : Google Scholar : PubMed/NCBI
|
|
31
|
van Minkelen R, de Visser MC,
Houwing-Duistermaat JJ, Vos HL, Bertina RM and Rosendaal FR:
Haplotypes of IL1B, IL1RN, IL1R1, and IL1R2 and the risk of venous
thrombosis. Arterioscler Thromb Vasc Biol. 27:1486–1491. 2007.
View Article : Google Scholar : PubMed/NCBI
|
|
32
|
Henke PK, Varga A, De S, Deatrick CB,
Eliason J, Arenberg DA, Sukheepod P, Thanaporn P, Kunkel SL,
Upchurch GR Jr and Wakefield TW: Deep vein thrombosis resolution is
modulated by monocyte CXCR2-mediated activity in a mouse model.
Arterioscler Thromb Vasc Biol. 24:1130–1137. 2004. View Article : Google Scholar : PubMed/NCBI
|
|
33
|
Henke PK and Wakefield T: Thrombus
resolution and vein wall injury: Dependence on chemokines and
leukocytes. Thromb Res. 123(Suppl 4): S72–S78. 2009. View Article : Google Scholar : PubMed/NCBI
|
|
34
|
Bean CJ, Boulet SL, Ellingsen D, Trau H,
Ghaji N, Hooper WC and Austin H: Increased risk of venous
thromboembolism is associated with genetic variation in heme
oxygenase-1 in Blacks. Thromb Res. 130:942–947. 2012. View Article : Google Scholar : PubMed/NCBI
|
|
35
|
Peng L, Mundada L, Stomel JM, Liu JJ, Sun
J, Yet SF and Fay WP: Induction of heme oxygenase-1 expression
inhibits platelet-dependent thrombosis. Antioxid Redox Signal.
6:729–735. 2004. View Article : Google Scholar : PubMed/NCBI
|
|
36
|
Bojic LA, Burke AC, Chhoker SS, Telford
DE, Sutherland BG, Edwards JY, Sawyez CG, Tirona RG, Yin H,
Pickering JG and Huff MW: Peroxisome proliferator-activated
receptor δ agonist GW1516 attenuates diet-induced aortic
inflammation, insulin resistance, and atherosclerosis in
low-density lipoprotein receptor knockout mice. Arterioscler Thromb
Vasc Biol. 34:52–60. 2014. View Article : Google Scholar
|
|
37
|
Samsoondar JP, Burke AC, Sutherland BG,
Telford DE, Sawyez CG, Edwards JY, Pinkosky SL, Newton RS and Huff
MW: Prevention of diet-induced metabolic dysregulation,
inflammation, and atherosclerosis in Ldlr−/− mice by
treatment with the ATP-citrate lyase inhibitor bempedoic acid.
Arterioscler Thromb Vasc Biol. 37:647–656. 2017. View Article : Google Scholar : PubMed/NCBI
|
|
38
|
Zhu W, Buffa JA, Wang Z, Warrier M,
Schugar R, Shih DM, Gupta N, Gregory JC, Org E, Fu X, et al: Flavin
monooxygenase 3, the host hepatic enzyme in the metaorganismal
trimethylamine N-oxide-generating pathway, modulates platelet
responsiveness and thrombosis risk. J Thromb Haemost. 16:1857–1872.
2018. View Article : Google Scholar : PubMed/NCBI
|
|
39
|
Shih DM, Zhu W, Schugar RC, Meng Y, Jia X,
Miikeda A, Wang Z, Zieger M, Lee R, Graham M, et al: Genetic
deficiency of flavin-containing monooxygenase 3 (Fmo3) protects
against thrombosis but has only a minor effect on plasma lipid
levels-brief report. Arterioscler Thromb Vasc Biol. 39:1045–1054.
2019. View Article : Google Scholar : PubMed/NCBI
|