Introduction
Lung cancer is a common cancer worldwide, with the
second highest mortality rate among females and the highest
mortality rate among males (1,2).
Non-small cell lung cancer (NSCLC) is the primary lung cancer type
that accounts for ~85% of lung cancer cases and includes the
following common pathological subtypes: Lung squamous cell
carcinoma (LSCC), lung adenocarcinoma (LUAD), and lung large cell
carcinoma (3,4). LSCC is more common among males,
potentially due to smoking habits (5). LSCC has distinct clinical
characteristics, and the prognosis of patients with recurrent LSCC
is poor (6). Therefore, it is
urgent to identify new molecular factors predictive of LSCC
treatment outcomes.
Methylation changes in certain tumor-associated
genes have been identified in previous studies examining
tumorigenesis, suggesting that they are critical risk factors of
tumorigenesis and molecular markers for early diagnosis (7). Promoter methylation of PR/SET domain
5 is significantly associated with lymph node metastasis and tumor
differentiation status of LSCC; therefore, this gene is a candidate
target for the diagnosis, prognosis and treatment of this cancer
(8). The drought-repressed 4 gene
has been proposed for methylation status analysis of LSCC cells,
and its low expression correlates with a poor patient prognosis
(9). Tripartite motif-containing
58/cg26157385 methylation is associated with expression of 8
prognosis-associated genes in LSCC, indicating its potential
regulatory role in the progression of LSCC (10).
Long non-coding RNAs (lncRNAs) are a class of RNAs
measuring >200 nucleotides and have pivotal functions in the
progression of numerous cancer types (11). In addition, increasing numbers of
lncRNAs with a prognostic value have been described, for example,
urothelial cancer associated and long intergenic non-coding RNA-p21
(12-14). The lncRNAs cancer susceptibility 2
and surfactant associated 1, pseudogene participate in the
regulation of tumor suppressor genes and oncogenes during the
formation of LSCC and may be used for the diagnosis, prognosis and
targeted treatment of this disease (15). Several lncRNA combination
signatures have been identified to predict LSCC prognosis (16,17). In LUAD, DNA methylation has
regulatory effects on the role of lncRNA (18); however, to the best of our
knowledge, this type of regulation in LSCC has rarely been
reported.
Despite these valuable data, the predictive
performance of methylated DNA sequences or lncRNAs is rarely
compared, and additional potential biomarkers should be
investigated to improve cancer prognosis. In the present study, the
methylation levels of DNA sequences and lncRNAs in patients with
LSCC were compared, and the levels identified to be significantly
correlated with LSCC prognosis were screened out. Furthermore,
different risk score (RS) systems were built, and the one with the
best predictive performance was selected.
Materials and methods
Data sources
Methylation data from patients with LSCC (downloaded
on March 25, 2019; platform: Illumina Infinium Human Methylation
450 BeadChip) including 372 LSCC samples and 43 healthy tissue
samples, were retrieved from The Cancer Genome Atlas (TCGA;
https://cancergenome.nih. gov/) database.
Following collation with clinical information, 293 LSCC samples
with data recurrence were selected as the training set.
With 'lung cancer' and 'Homo sapiens' as key
words, a search for methylation datasets was conducted in the Gene
Expression Omnibus (GEO; http://www.ncbi.nlm.nih. gov/geo/) database (19) using the following criteria: i)
Available histological data that could differentiate adenocarcinoma
from squamous cell carcinoma; ii) total sample size was not
<150; and iii) the clinical information associated with the LSCC
samples contained data on actual future recurrence. Following this
search, an eligible methylation dataset (accession no., GSE39279
(20); platform: Illumina
HumanMethylation450 BeadChip; validation set 1) was selected and
downloaded. There were 444 samples in the dataset, including 43
LSCC samples with data concerning future recurrence.
In addition, the methylation data on head and neck
squamous cell carcinoma (HNSC), including 530 HNSC samples and 50
healthy tissue samples, were also retrieved from TCGA to
investigate whether the predictive model for LSCC was applicable to
other squamous carcinoma types. Following collation with the
clinical information downloaded from TCGA simultaneously, 382 HNSC
samples with information on future recurrence were selected as
validation set 2.
Differential methylation analysis
According to the data corresponding to probe
locations and IDs provided in the downloaded annotation files that
contained information about protein-coding genes and non-coding
RNAs, like gene and lncRNA function, DNA location site and pathway
information, corresponding lncRNAs and genes in the methylation
data were annotated using the HUGO Gene Nomenclature Committee
(http://www.genenames.org/) database
(21), which contains records on
4,112 lncRNAs and 19,201 genes.
On the basis of the recurrence data, the LSCC
samples in the training set were classified into
recurrence-associated (the tumor recurred) and nonrecurrence (the
tumor did not recur) groups. Using the limma package (22) (v.3.34.7, https://bioconductor.org/packages/release/bioc/html/limma.html)
in the R software (23),
differentially methylated genes (DMGs) between the
recurrence-associated and nonrecurrence samples were identified.
The thresholds for significance were defined as |log2
fold change (FC)|>0.263 and false discovery rate (FDR) <0.05.
Following the addition of data on methylation levels of the DMGs in
the training set, bidirectional hierarchical clustering was
performed on the DMGs via the pheatmap package (v.1.0.8, https://cran.r-project.org/web/packages/pheatmap/index.html)
in R (24).
Analysis of correlation between the
methylation levels and expression levels of the DMGs
Data on the methylation levels and the matched
expression levels of the DMGs were extracted, and their Pearson
correlation coefficients (PCCs) were calculated using the
cor.test() function (https://stat.ethz.ch/R-manual/R-devel/library/stats/html/cor.test.html)
in R (25). P<0.05 was set as
the significance threshold. DMGs with negative PCCs were selected
for further analyses.
Construction of RS systems
Using univariate and multivariate Cox regression
analyses in R package survival (v3.1-8; https://www.rdocumentation.org/packages/survival/versions/3.1-8),
differentially methylated lncRNAs (DM-lncRNAs) and DMGs
significantly associated with overall survival and independent
prognosis factors were next screened out. A log-rank P<0.05 was
selected as the cutoff criterion.
Based on the DMGs correlating with independent
prognosis, an optimal gene combination and optimal lncRNA
combination were identified using the LASSO Cox regression model
(26) in penalized package in R
(27) (v.0.9.50; https://cran.r-project.org/web/packages/penalized/index.html).
Optimal parameter 'lambda' in the model was calculated by the
1,000-fold cross-validation likelihood (cvl) method.
In combination with prognostic coefficients of the
optimal DM-lncRNAs and DMGs, methylation status-based or
methylation level-based RS systems were built.
For the optimal combinations, cutoff values of
methylation levels of the optimal lncRNAs and genes were computed
via the X-Tile Bio-Informatics Tool (https://medicine.yale.edu/lab/rimm/research/software.aspx)
(28). The cutoff values were
determined based on the following criterion: Monte Carlo P<0.05.
The status of each sample at an lncRNA or DNA methylation level was
defined in accordance with the cutoff value of each lncRNA or gene.
When the lncRNA or DNA methylation level was increased compared
with the cutoff value, its status was set to 1.0. Otherwise, the
status was set to 0.
In combination with the regression coefficients of
each optimal lncRNA or gene and their methylation status, a RS
system was created, and the RS for each sample was calculated via
the following formula:
StatusRS=∑βRNAn×StatusRNAn;
where β and Status represent the regression coefficient of an
lncRNA or gene and the methylation status variable, respectively.
The status RS systems, based on the methylation status of the
optimal genes and optimal lncRNAs, were constructed separately as
two separate status RS systems.
RS systems based on the methylation levels of
optimal lncRNAs or optimal genes were constructed. The formula for
calculating the RS of each sample was as follows:
MethylationRS=∑βRNAn×MethylationRNAn;
where β and MethylationRNAn represent the regression
coefficient and methylation level of an lncRNA or gene,
respectively. A methylation RS system based on the methylation
levels of optimal genes and a methylation RS system based on the
methylation levels of optimal lncRNAs were built separately.
Samples in the training set were subdivided into
high- and low-risk groups based on the median of the RSs of the two
status RS systems and the two methylation RS systems. Using the
Kaplan-Meier (KM) survival curve constructed by means of R package
survival (29), associations
between the prognosis and RS systems were analyzed. Concomitantly,
the two validation sets were used to validate the results obtained.
Finally, from the four RS systems generated, the system with
optimum performance was selected through comparison of the
parameters in the training set and the two validation sets.
Construction of a nomogram survival
model
In the training set, independent prognostic factors
were selected by univariate and multivariate Cox regression
analyses via the survival package (29). The cutoff criterion was log-rank
P<0.05. According to the risk data determined by the RS system,
the associations between the independent clinical prognostic
factors and prognosis were then analyzed. Using the rms package
(v.5.1-2, https://cran.r-project.org/web/packages/rms/index.html)
(30) in R, a 5-year nomogram
survival model involving the independent clinical prognostic
factors was built.
Pathway enrichment analysis
RSs of the best RS system were used to classify the
samples in the training set into high- and low-risk groups. Using
the limma package (23),
differential expression analysis of the high- and low-risk groups
was performed to identify differentially expressed genes (DEGs)
between the two risk groups. The DEGs were screened according to
FDR <0.05 and |log2 FC|>0.263 cut-off values.
Using Gene Set Enrichment Analysis (http://software.broadinstitute.org/gsea/index.jsp)
(31), pathway enrichment
analysis of the DEG set was conducted. The pathways with P<0.05
were identified as significant.
Results
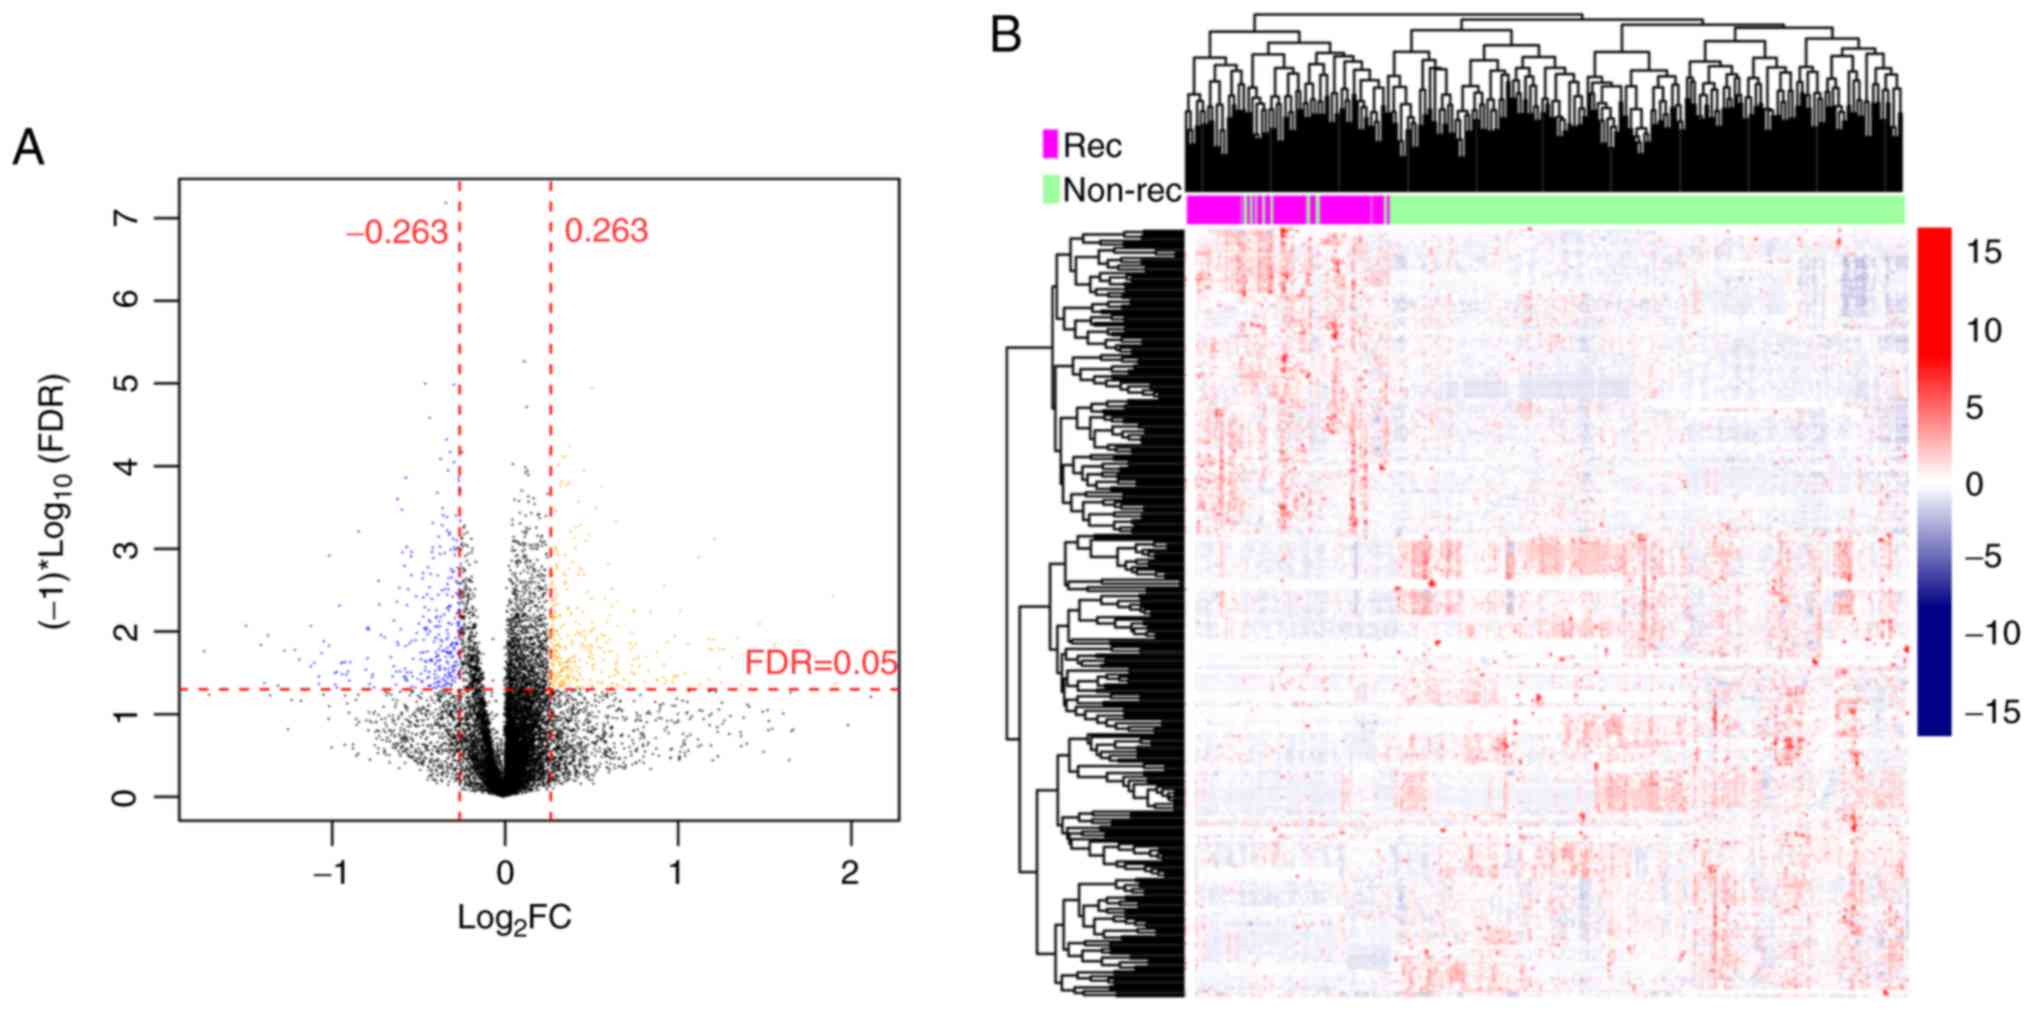
Differential-methylation analysis
On the basis of the annotation files, 1,028 lncRNAs
and 15,544 genes were selected from the methylation dataset.
According to the recurrence data, samples in the training set were
subdivided into the recurrence-associated (78 LSCC samples from
patients who later experienced cancer recurrence) and nonrecurrence
(215 LSCC samples) groups. There were 335 DMGs and DM-lncRNAs
between the recurrence-associated and nonrecurrence groups,
including 27 DM-lncRNAs, 4 hypo-methylated and 23 hypermethylated
lncRNAs, and 308 DMGs, 139 hypomethylated and 169 hypermethylated
genes (Fig. 1A). The
bidirectional hierarchical clustering heatmap for the DMGs and
GM-lncRNAs is presented in Fig.
1B.
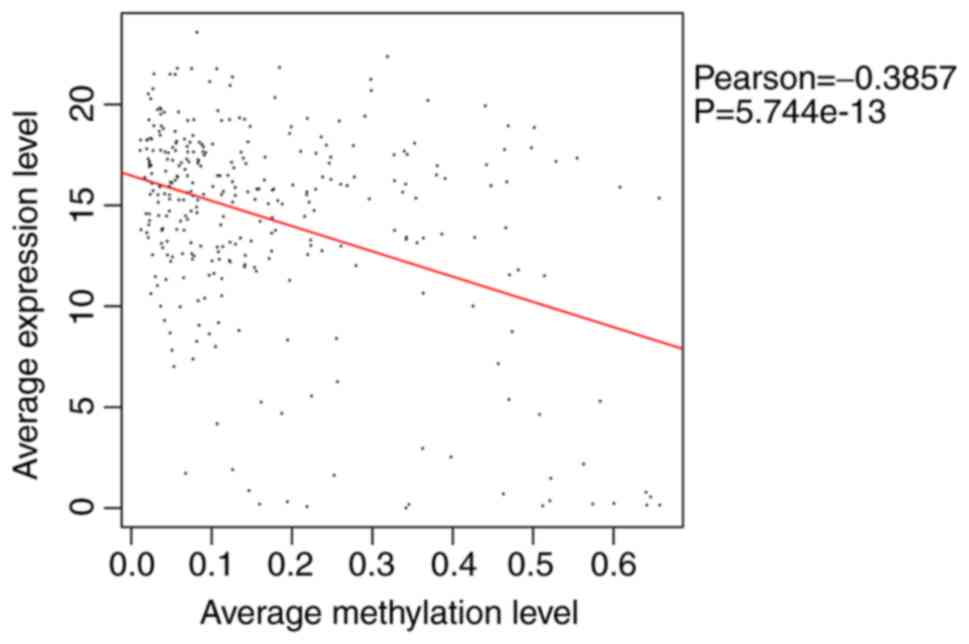
Analysis of the correlation between the
methylation levels and expression levels of the DMGs or
DM-lncRNAs
As aforementioned, the matched methylation samples
from the LSCC mRNA-seq samples were first selected, and the
methylation and expression data on the DMGs and DM-lncRNAs were
then extracted. The overall correlation between the methylation
levels and expression levels of the DMGs/DM-lncRNAs were analyzed
among the matched samples, and a significant negative correlation
(PCC=-0.3857; P=0.574×10⁻¹³) was identified (Fig. 2). A total of 181 DMGs and
DM-lncRNAs with negative PCCs, including 25 DM-lncRNAs and 156
DMGs, were identified for subsequent analyses.
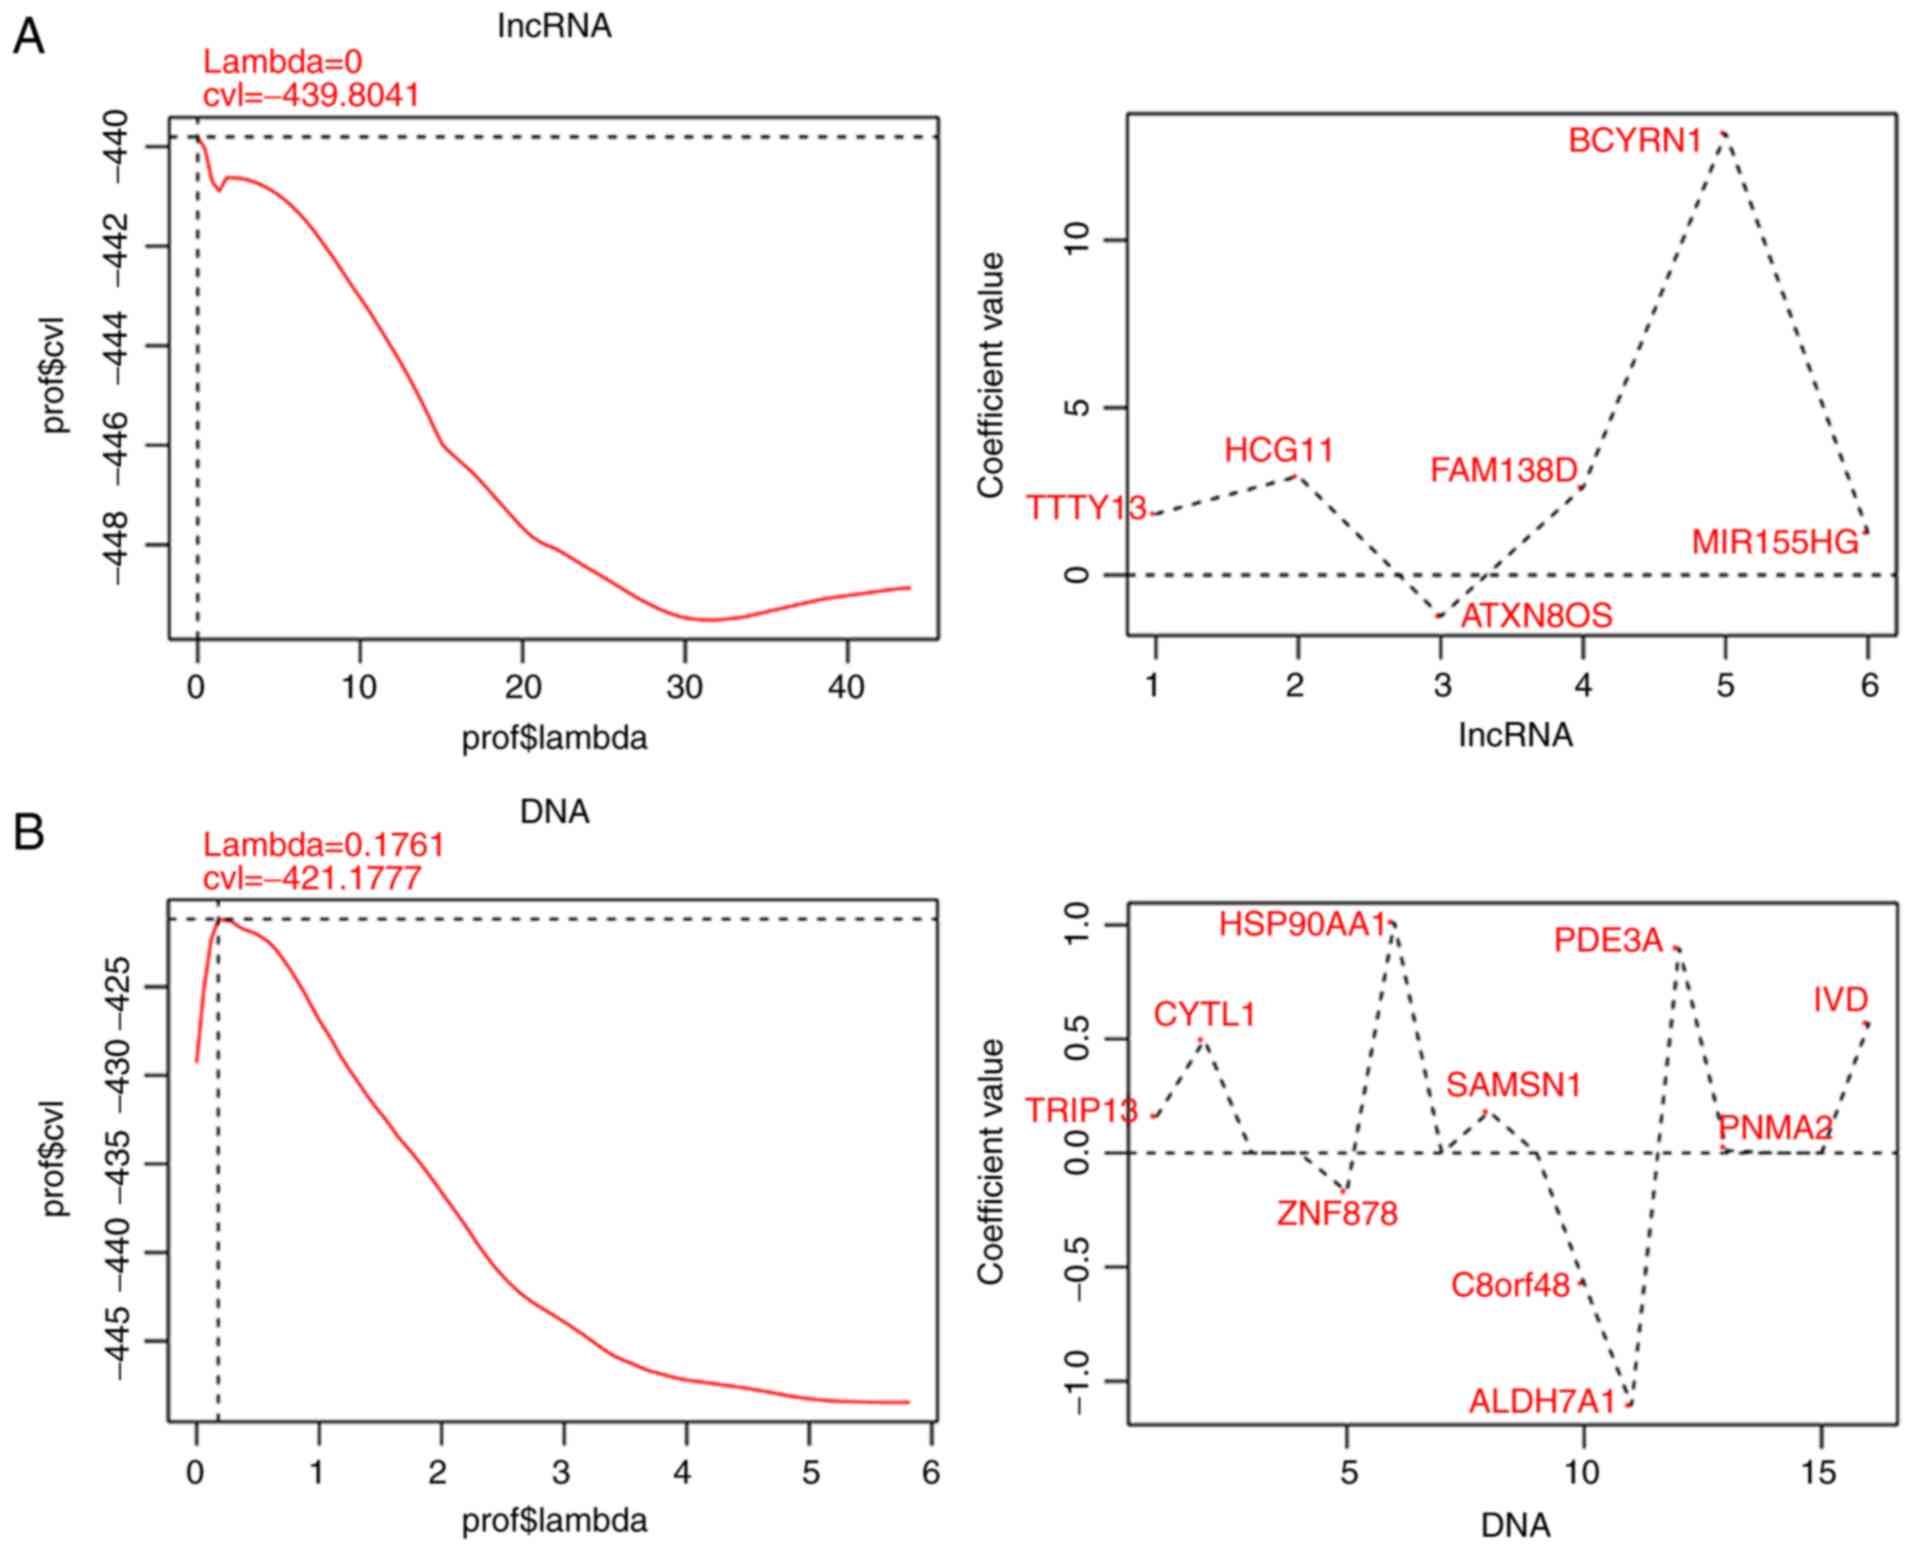
Construction of the RS system
Among the 181 DMGs and DM-lncRNAs, 105 were
identified to be associated with prognosis, including 91 DMGs and
14 DM-lncRNAs, by univariate Cox regression analysis. Then, 16 DMGs
and 6 DM-lncRNAs independently associated with prognosis were
identified from the 105 DMGs/DM-lncRNAs using multivariate Cox
regression analysis. According to the LASSO Cox regression model,
10 optimal DMGs, including aldehyde dehydrogenase 7 family member
A1 (ALDH7A1), chromosome 8 open reading frame 48
(C8orf48), cytokine-like 1 (CYTL1), heat shock
protein 90 alpha family class A member 1 (HSP90AA1),
isovaleryl-CoA dehydrogenase (IVD), phosphodiesterase 3A
(PDE3A), PNMA family member 2 (PNMA2), SAM domain,
SH3 domain and nuclear localization signals 1 (SAMSN1),
thyroid hormone receptor interactor 13 (TRIP13) and zinc
finger protein 878 (ZNF878), and 6 optimal DM-lncRNAs,
including ATXN8 opposite-strand lncRNA (ATXN8OS),
brain cytoplasmic RNA 1 (BCYRN1), family with sequence
similarity 138 member D (FAM138D), HLA complex group 11
(HCG11), MIR155 host gene (MIR155HG) and
testis-specific transcript, Y-linked 13 (TTTY13) were
finally identified in the training dataset (Fig. 3; Table I).
 | Table IGenes and lncRNAs involved in the
optimal combinations. |
Table I
Genes and lncRNAs involved in the
optimal combinations.
| Type | Gene | Locus | Coefficient | Hazard ratio | 95% CI | P-value | Cutoff |
|---|
| gene | ALDH7A1 | cg26327732 | −1.107 | 0.415 | 0.250-0.884 |
2.350×10⁻⁵ | 0.34 |
| C8orf48 | cg24727311 | −0.572 | 0.191 | 0.180-0.457 |
4.610×10⁻⁴ | 0.34 |
| CYTL1 | cg17563034 | 0.496 | 1.509 | 1.104-2.323 |
3.051×10⁻³ | 0.16 |
|
HSP90AA1 | cg23904247 | 1.012 | 4.769 | 2.041-6.111 |
1.080×10⁻⁴ | 0.53 |
| IVD | cg27529930 | 0.570 | 1.925 | 1.244-3.191 |
3.500×10⁻⁴ | 0.11 |
| PDE3A | cg26571814 | 0.899 | 1.977 | 1.745-3.979 |
9.310×10⁻⁵ | 0.34 |
| PNMA2 | cg26268277 | 0.011 | 1.123 | 1.043-2.705 |
7.295×10⁻³ | 0.48 |
| SAMSN1 | cg13951664 | 0.180 | 1.208 | 1.079-2.546 |
1.490×10⁻⁴ | 0.25 |
| TRIP13 | cg17510385 | 0.161 | 1.33 | 1.038-2.691 |
9.838×10⁻³ | 0.65 |
| ZNF878 | cg26626525 | −0.169 | 0.597 | 0.336-0.906 |
1.630×10⁻³ | 0.06 |
| lncRNA | ATXN8OS | cg25514273 | −1.227 | 0.312 | 0.088-0.704 |
7.080×10⁻³ | 0.24 |
| BCYRN1 | ch.X.1084981F | 13.198 | 5.399 | 1.028-10.38 |
1.229×10⁻² | 0.04 |
| FAM138D | cg26523196 | 2.625 | 2.854 | 1.681-4.425 |
9.330×10⁻³ | 0.73 |
| HCG11 | cg27490387 | 2.953 | 3.164 | 1.550-6.734 |
2.010×10⁻³ | 0.20 |
|
MIR155HG | cg23433889 | 1.258 | 1.431 | 1.281-3.186 |
3.341×10⁻² | 0.04 |
| TTTY13 | cg25918849 | 1.831 | 1.595 | 1.492-3.413 |
6.200×10⁻³ | 0.24 |
The cutoff values of the methylation levels of the
lncRNAs and genes in the aforementioned optimal combinations were
calculated (Table I). In
combination with the regression coefficients of the optimal genes
or lncRNAs, RS systems based on the methylation status of optimal
genes or lncRNAs were constructed. The formulas were as
follows:
Gene status RS=−1.1070 ×
StatusALDH7A1-0.5721 × StatusC8orf48 + 0.4962
× StatusCYTL1 + 1.0118 × StatusHSP90AA1 +
0.5696 × StatusIVD + 0.8992 × StatusPDE3A +
0.0109 × StatusPNMA2 + 0.1803 × StatusSAMSN1
+ 0.1612 × StatusTRIP13-0.1688 ×
StatusZNF878; and lncRNA status RS=−1.2274 ×
StatusATXN8OS + 13.1984 × StatusBCYRN1 +
2.6252 × StatusFAM138D + 2.9526 × StatusHCG11
+ 1.2577 × StatusMIR155HG + 1.8308 ×
StatusTTTY13.
In addition, RS systems based on the methylation
levels of optimal genes or lncRNAs were built. The formulas for
calculating the RSs were:
Gene methylation (methy) RS = −1.10 70 ×
MethyALDH7A1-0.5721 × MethyC8orf48 + 0.4962 ×
MethyCYTL1 + 1.0118 × MethyHSP90AA1 + 0.5696
× MethyIVD + 0.8992 × MethyPDE3A + 0.0109 ×
MethyPNMA2 + 0.1803 × MethySAMSN1 + 0.1612 ×
MethyTRIP13-0.1688 × MethyZNF878; and lncRNA
methy RS=−1.2274 × MethyATXN8OS + 13.1984 ×
MethyBCYRN1 + 2.6252 × MethyFAM138D + 2.9526
× MethyHCG11 + 1.2577 × MethyMIR155HG +
1.8308 × MethyTTTY13.
According to the median RS values, samples in the
training set, validation set 1 and validation set 2 were separately
subdivided into high- and low-risk groups. The associations between
prognosis and the results of RS systems were analyzed. The KM
curves for the methylation status-based RS systems and those for
the methylation level-based RS systems are presented in Figs. 4 and 5, respectively. These RS systems
demonstrated high levels of specificity, with the area under the
receiver operating characteristic curve >0.6 (Figs. 4 and 5), indicating accurate levels of risk
prediction. Of all the systems generated, the RS system based on
the methylation level of the 10 optimal DEGs exhibited the best
predictive performance (Table
II).
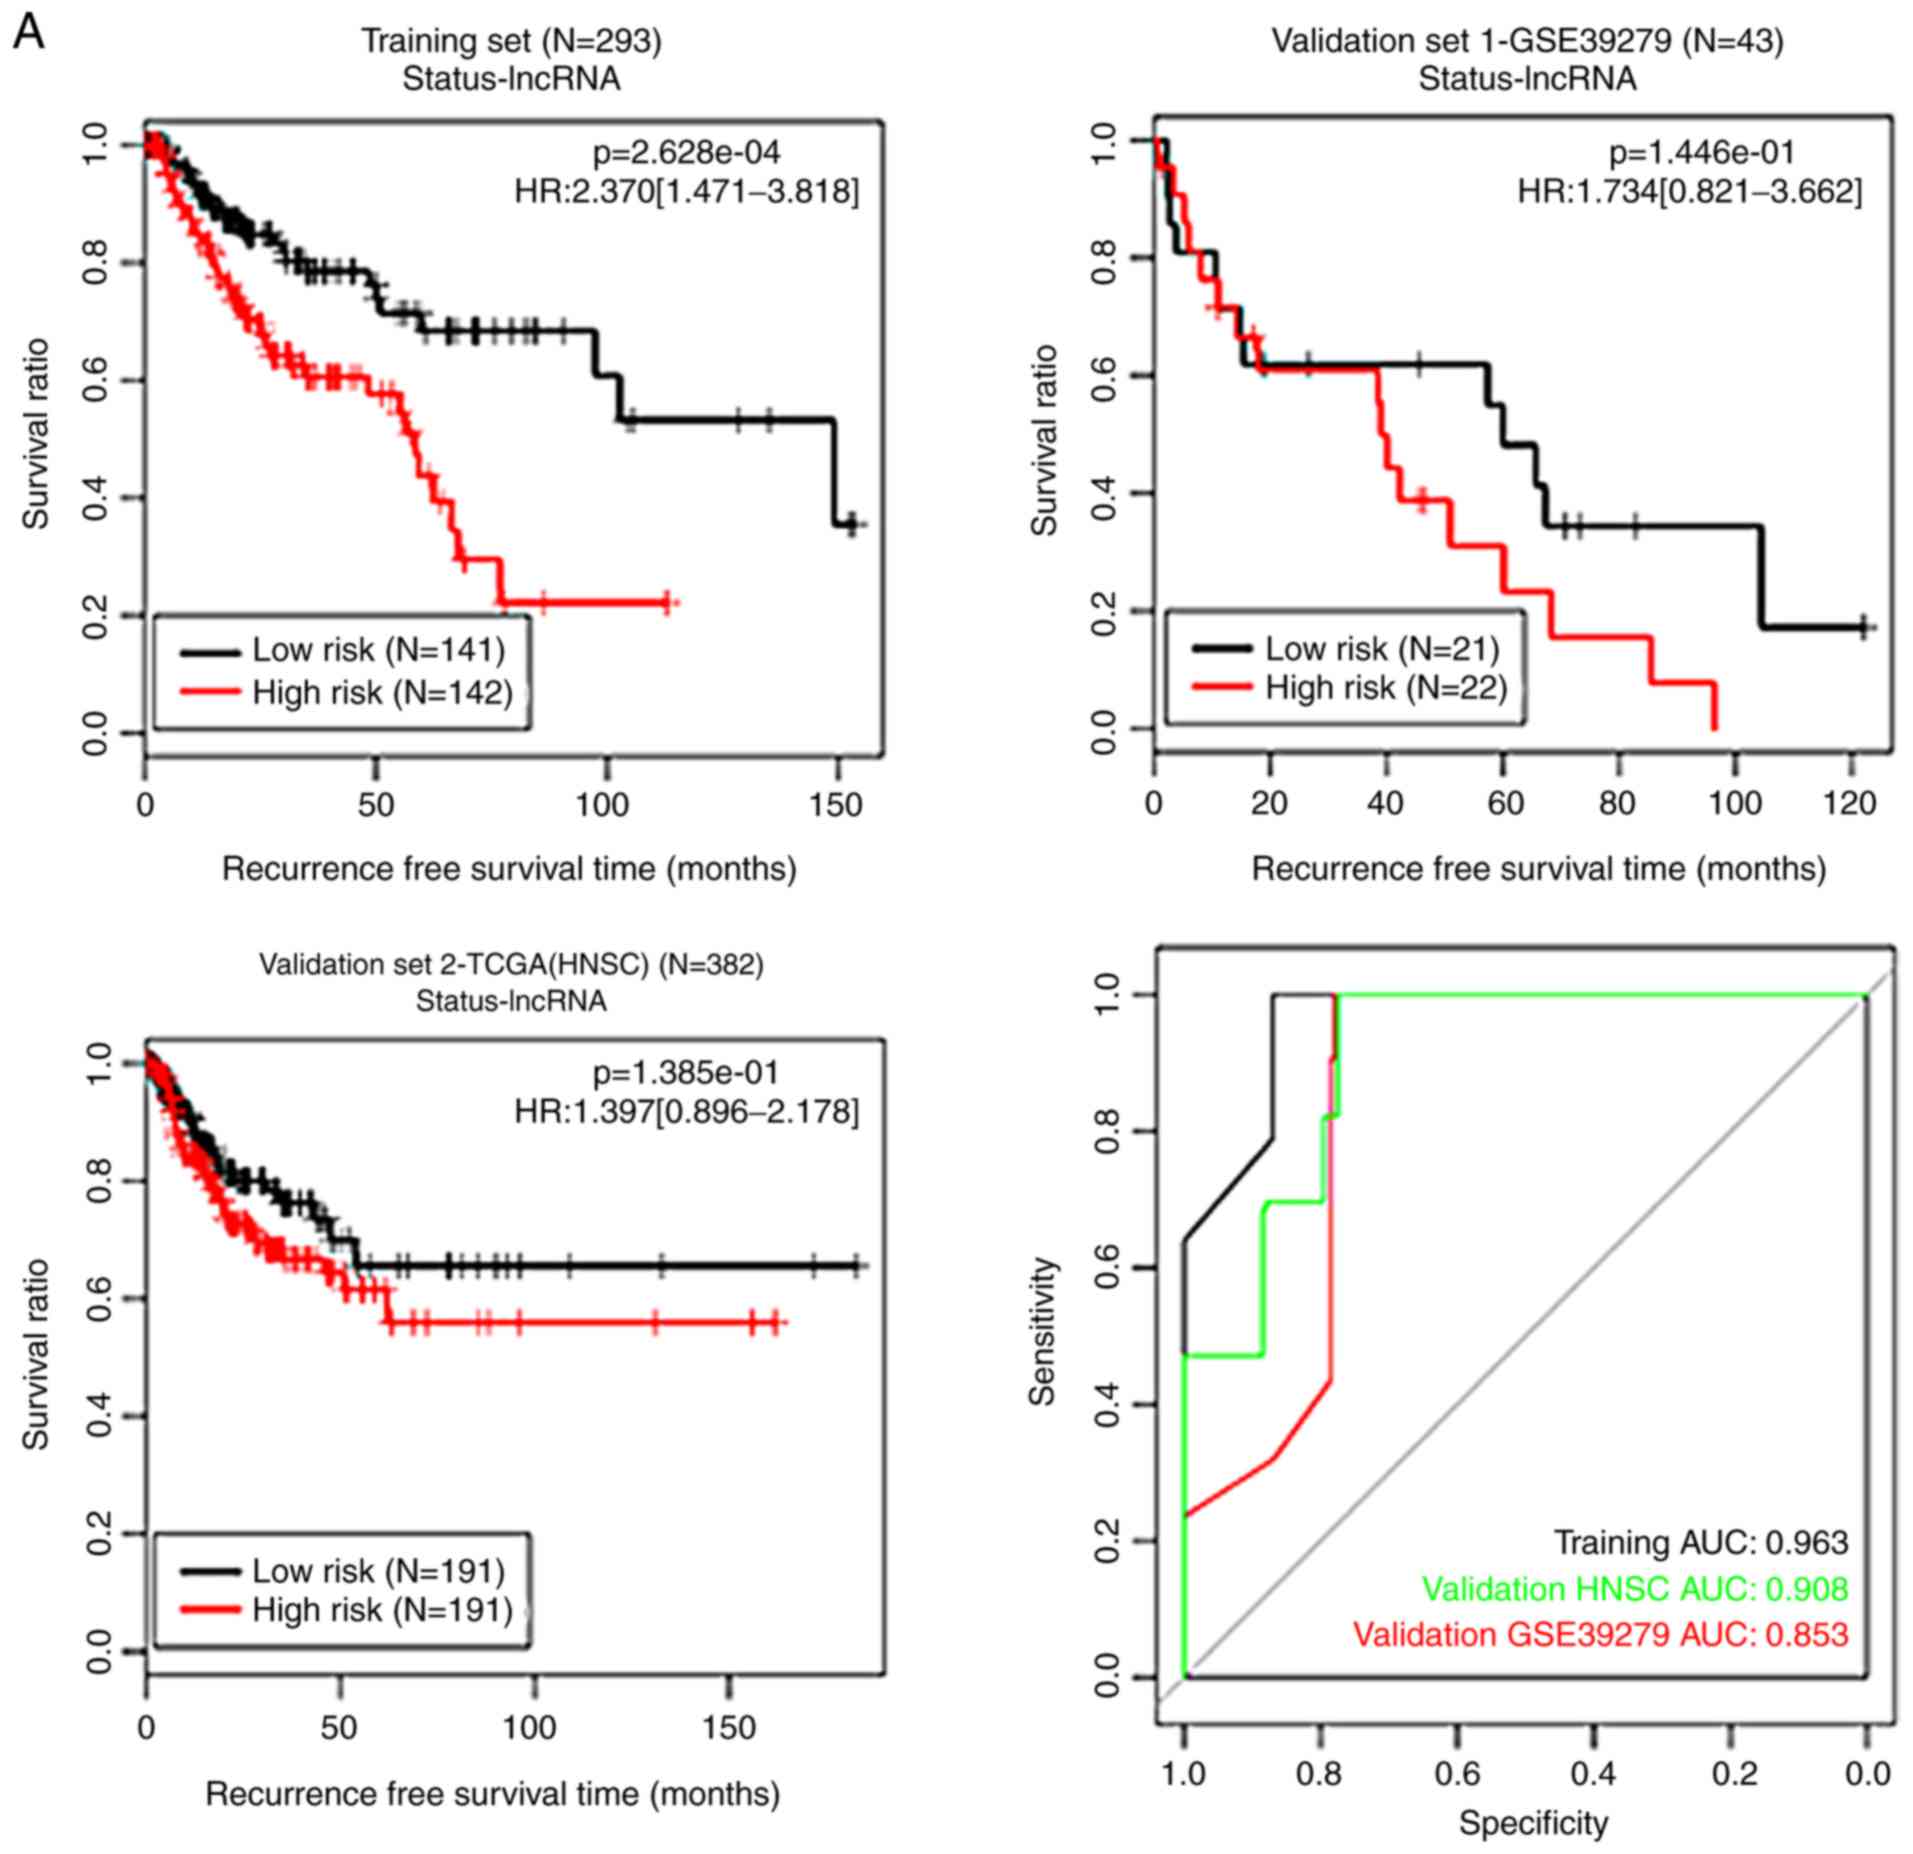 | Figure 4KM curves and ROC curves for the
methylation status-based RS systems. (A) The KM curves (black and
red curves respectively represent low- and high-risk groups) and
the ROC curve (black, red and green lines represent the training
set, validation set 1 and validation set 2, respectively) for the
lncRNA methylation status-based RS system. (B) The KM curves (blue
and purple curves respectively represent low- and high-risk groups)
and the ROC curve (black, red and green lines represent the
training set, validation set 1 and validation set 2, respectively)
for the DNA methylation status-based RS system. KM, Kaplan-Meier;
ROC, receiver operating characteristic; RS, risk score; TCGA, The
Cancer Genome Atlas; HNSC, head and neck squamous cell carcinoma;
AUC, area under the receiver operating characteristic curve;
lncRNA, long non-coding RNA; HR, hazard ratio. |
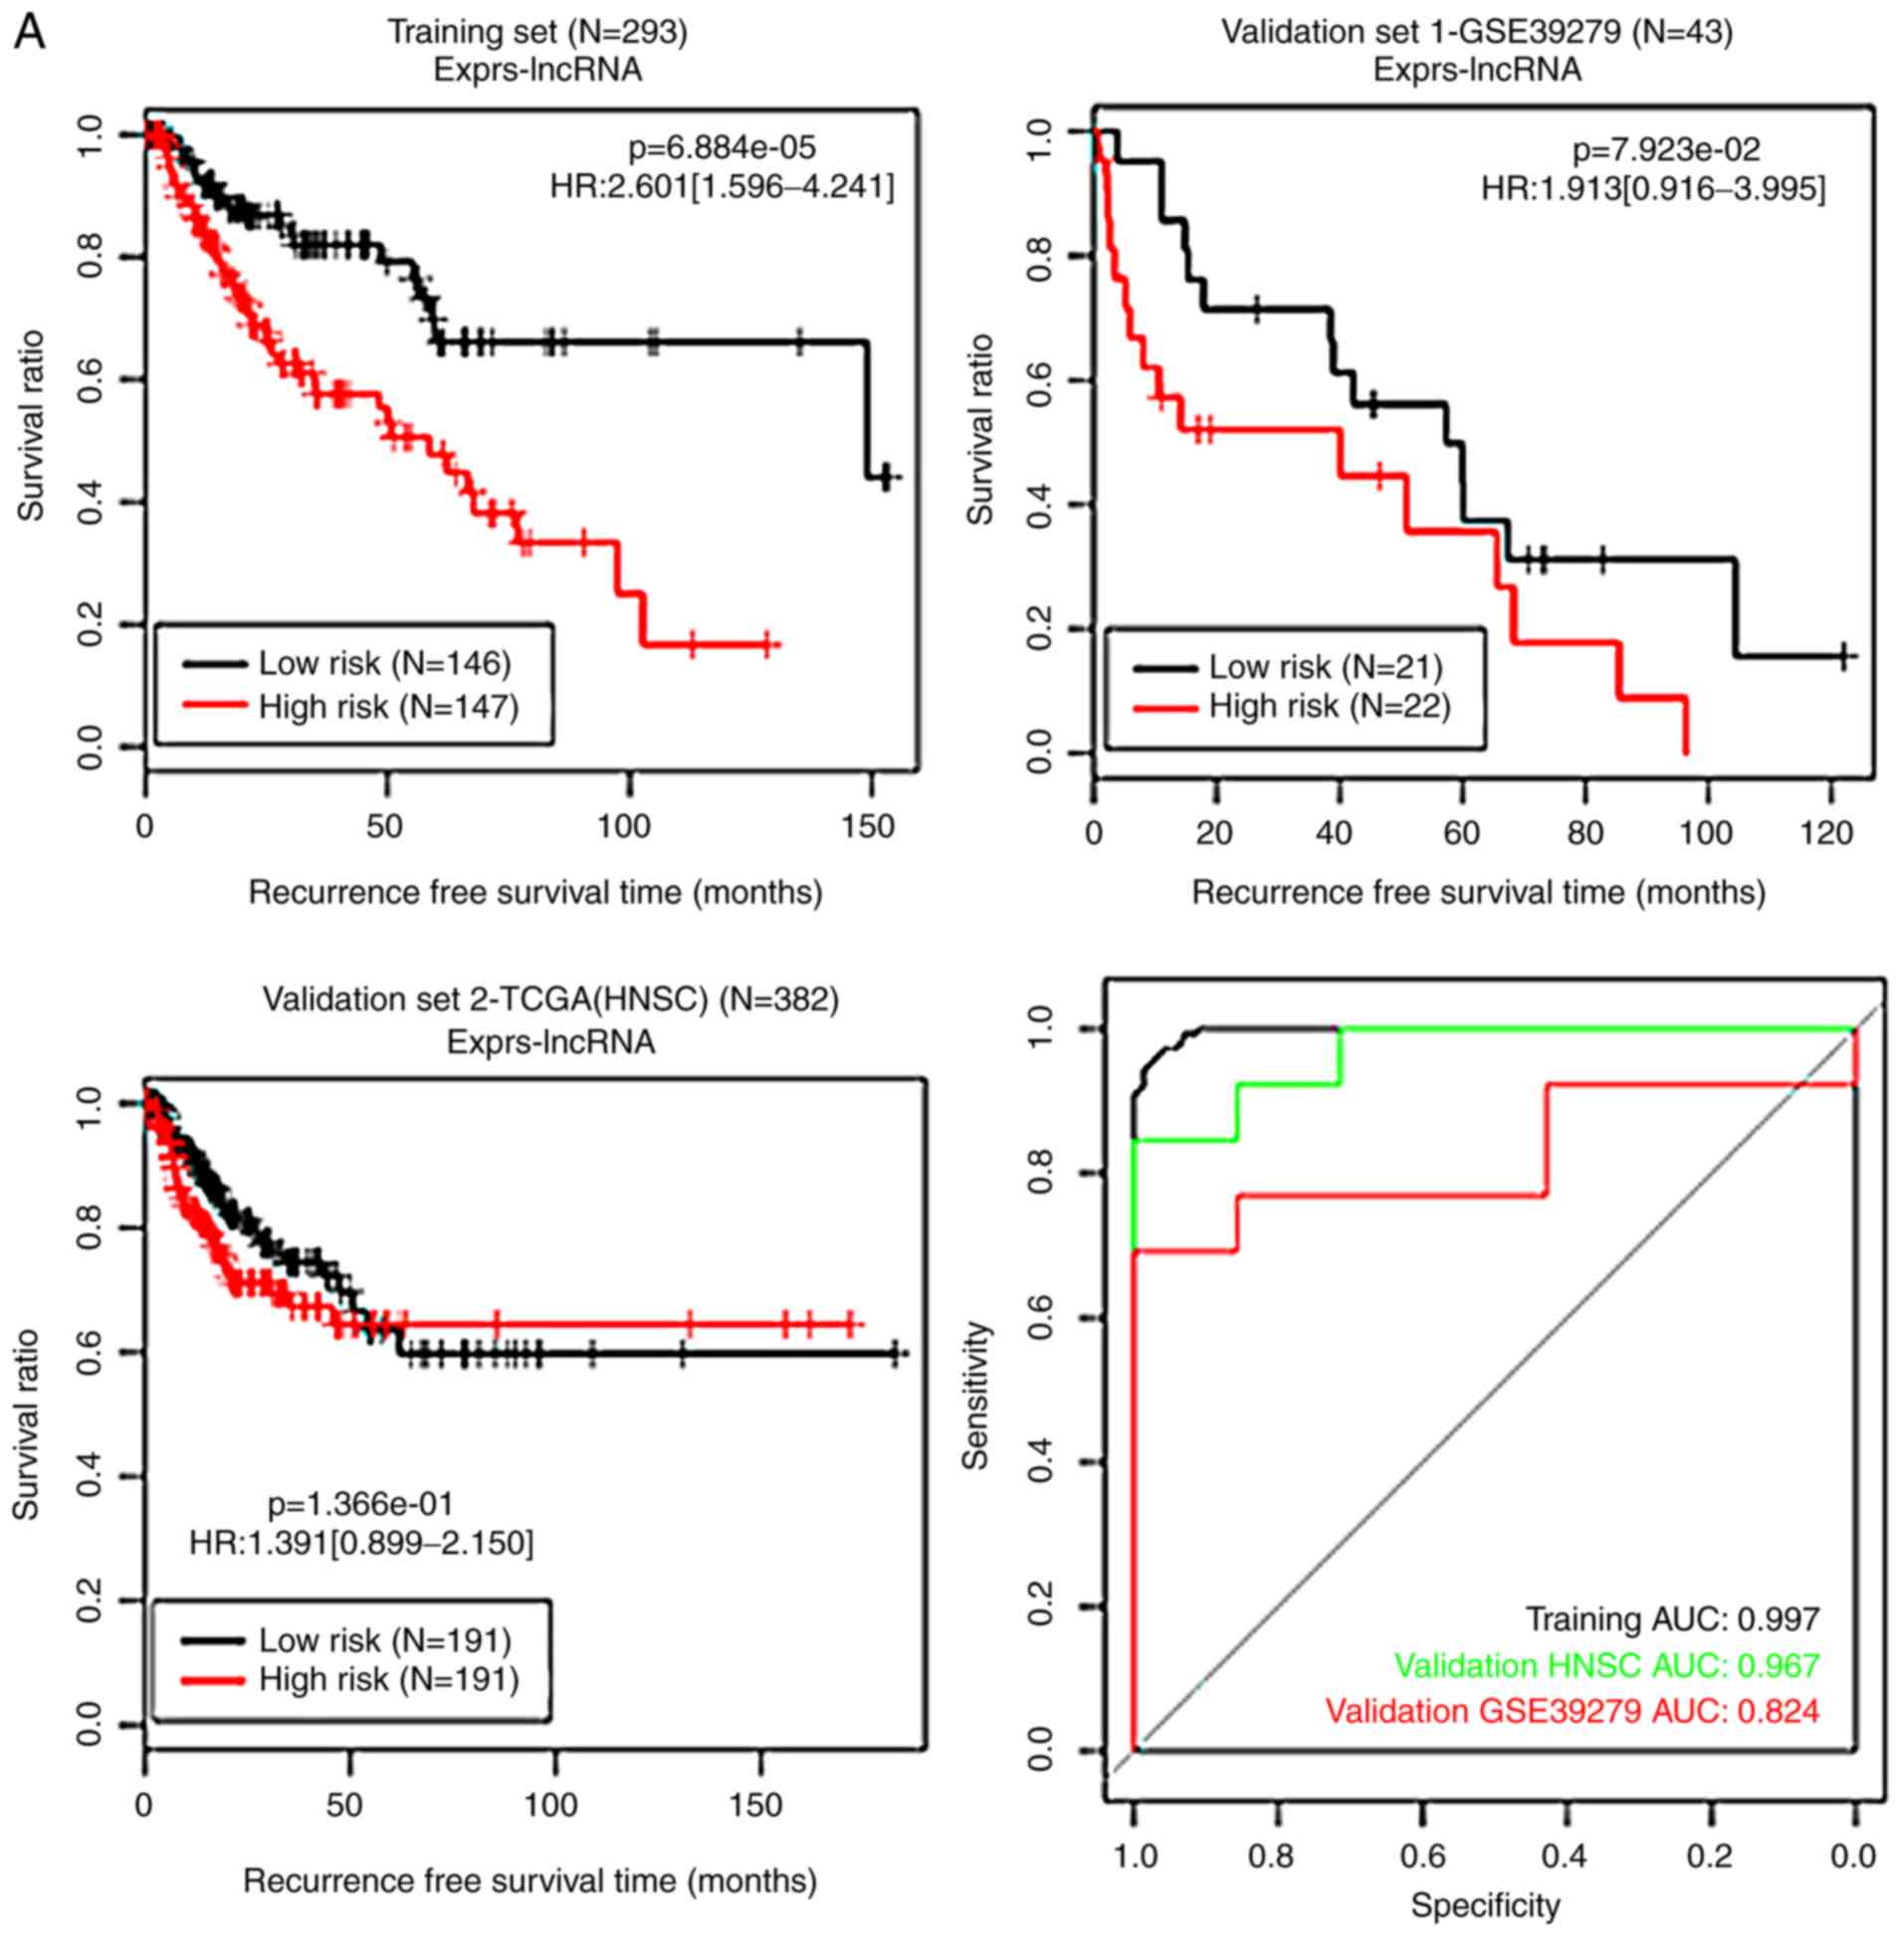 | Figure 5KM curves and ROC curves for the
methylation level-based RS systems. (A) The KM curves (black and
red curves represent low- and high-risk groups, respectively) and
the ROC curve (black, red and green lines represent the training
set, validation set 1 and validation set 2, respectively) for the
long noncoding RNA (lncRNA) methylation level-based RS system. (B)
The KM curves (blue and purple curves represent low- and high-risk
groups, respectively) and the ROC curve (black, green and red lines
represent the training set, validation set 1 and validation set 2,
respectively) for the DNA methylation level-based RS system. KM,
Kaplan-Meier; ROC, receiver operating characteristic; RS, risk
score; TCGA, The Cancer Genome Atlas; HNSC, head and neck squamous
cell carcinoma; AUC, area under the receiver operating
characteristic curve; lncRNA, long non-coding RNA; HR, hazard
ratio. |
| Table IISurvival analysis of the methylation
status-based RS system. |
Table II
Survival analysis of the methylation
status-based RS system.
A, KM survival
analysis for the methylation status-based RS system
|
|---|
| Gene product
type | Status model
(log-rank P-value)
|
|---|
| Training | HR (95% CI) | Validation 1
(GSE39279) | HR (95% CI) | Validation 2
(TCGA-HNSC) | HR (95% CI) |
|---|
| IncRNA |
2.628×10⁻⁴ | 2.370
(1.471-3.818) |
1.446×10⁻¹ | 1.734
(0.821-3.662) |
1.385×10⁻¹ | 1.397
(0.896-2.178) |
| DNA |
2.004×10⁻¹² | 6.112
(3.452-10.82) |
3.217×10⁻² | 2.213
(1.050-4.664) |
2.742×10⁻² | 1.638
(1.052-2.550) |
|
B, KM survival
analysis for the methylation level-based RS system
|
| Methylation model
(log-rank P-value)
|
| Gene product
type | Training | HR (95% CI) | Validation 1
(GSE39279) | HR (95% CI) | Validation 2
(TCGA-HNSC) | HR (95% CI) |
|
| IncRNA |
6.884×10⁻⁵ | 2.601
(1.596-4.241) |
7.923×10⁻² | 1.913
(0.916-3.995) |
1.366×10⁻¹ | 1.391
(0.899-2.150) |
| DNA |
5.928×10⁻¹² | 5.870
(3.325-10.37) |
2.209×10⁻² |
2.355(1.108-5.006) |
4.833×10⁻² | 1.551
(1.098-2.402) |
|
C, AUC of the four
RS systems
|
| Status model (ROC)
| Methylation model
(ROC)
|
| Gene product
type | Training | Validation 1
(GSE39279) | Validation 2
(TCGA-HNSC) | Training | Validation 1
(GSE39279) | Validation 2
(TCGA-HNSC) |
|
| IncRNA | 0.963 | 0.853 | 0.908 | 0.997 | 0.824 | 0.967 |
| DNA | 0.995 | 0.742 | 0.961 | 0.959 | 0.846 | 0.912 |
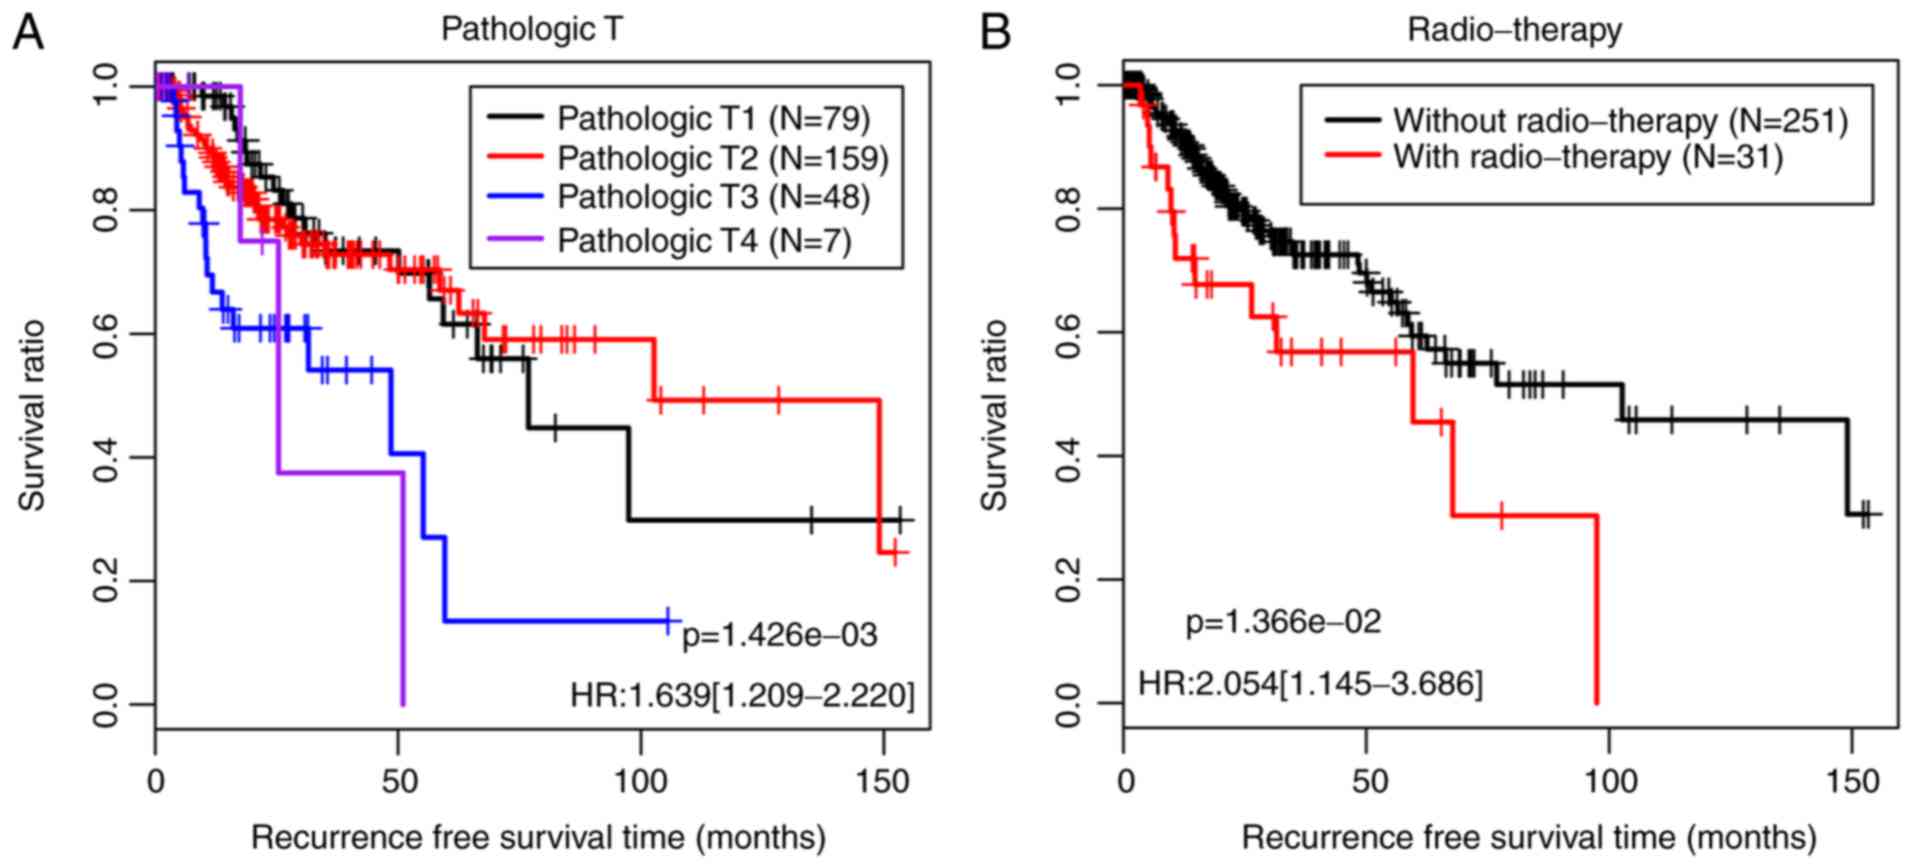
Construction of the nomogram survival
model
Independent clinical factors associating with
prognosis in the training set were identified by means of
univariate and multivariate Cox regression analyses (Table III). For both the training and
validation sets, pathological T stage, radiotherapy and DNA
methylation level-based model RS status were selected as
independent prognostic factors. The KM curves demonstrating the
correlations between pathological T/radiotherapy and prognosis are
presented in Fig. 6. The patients
with low pathological T staging and those who underwent
radiotherapy exhibited improved prognoses, which is consistent with
the outcomes observed in clinical practice.
| Table IIIScreening of the independent
prognostic factors using |
Table III
Screening of the independent
prognostic factors using
| Clinical
characteristics | TCGA (n=293) | Univariate
| Multivariate
|
|---|
| HR (95% CI) | P-value | HR (95% CI) | P-value |
|---|
| Age, years' | 67.72±8.63 | 0.988
(0.962-1.014) |
3.505×10⁻¹ | - | - |
| Sex.
male/female | 211/82 | 1.329
(0.783-2257) |
2.903×10⁻¹ | - | - |
| Pathological M
stage. M0/M1/- | 227/2/64 |
0.303(0.151-1536) |
6.074×10⁻¹ | - | - |
| Pathological N
stage, N0/N1/N2/- | 193/76/20/4 |
1.562(1.142-2.138) |
4.719×l0−3 | 0.365 (0.803-2
582) | 2.210×10⁻¹ |
| Pathological T
stage, T1/T2/T3/T4 | 79/159/48/7 | 1.639
(1209-2220) |
1.426×10⁻³ |
1.560(1.096-2.444) |
4.520×l0−2 |
| Pathological stage.
LTIHLIW- | 139/110/39/2/3 |
1.768(1.326-2.356) |
7.566×10⁻⁵ | 1.191
(0.653-2.171) |
5.681×10⁻¹ |
| Radiation therapy,
Yes/No/- | 31/251/11 |
2.054(1.145-3.686) |
1.366×10⁻² |
2.244(1.191-4227) |
1.230×10⁻² |
| Targeted molecular
therapy. Yes/No/- | 94/188/11 |
1.238(0.774-1.981) |
3.719×10⁻¹ | - | - |
| mRNA methylation
model RS status, High/Low | 146/147 |
5.870(3.325-10.37) |
5.928×l0−12 | 8.348
(4.408-15.812) |
7.420×10⁻¹¹ |
| Recurrence,
Yes/No | 78/215 | - | - | - | - |
| Recurrence free
survival time, months' | 28.28±27.45 | - | - | - | - |
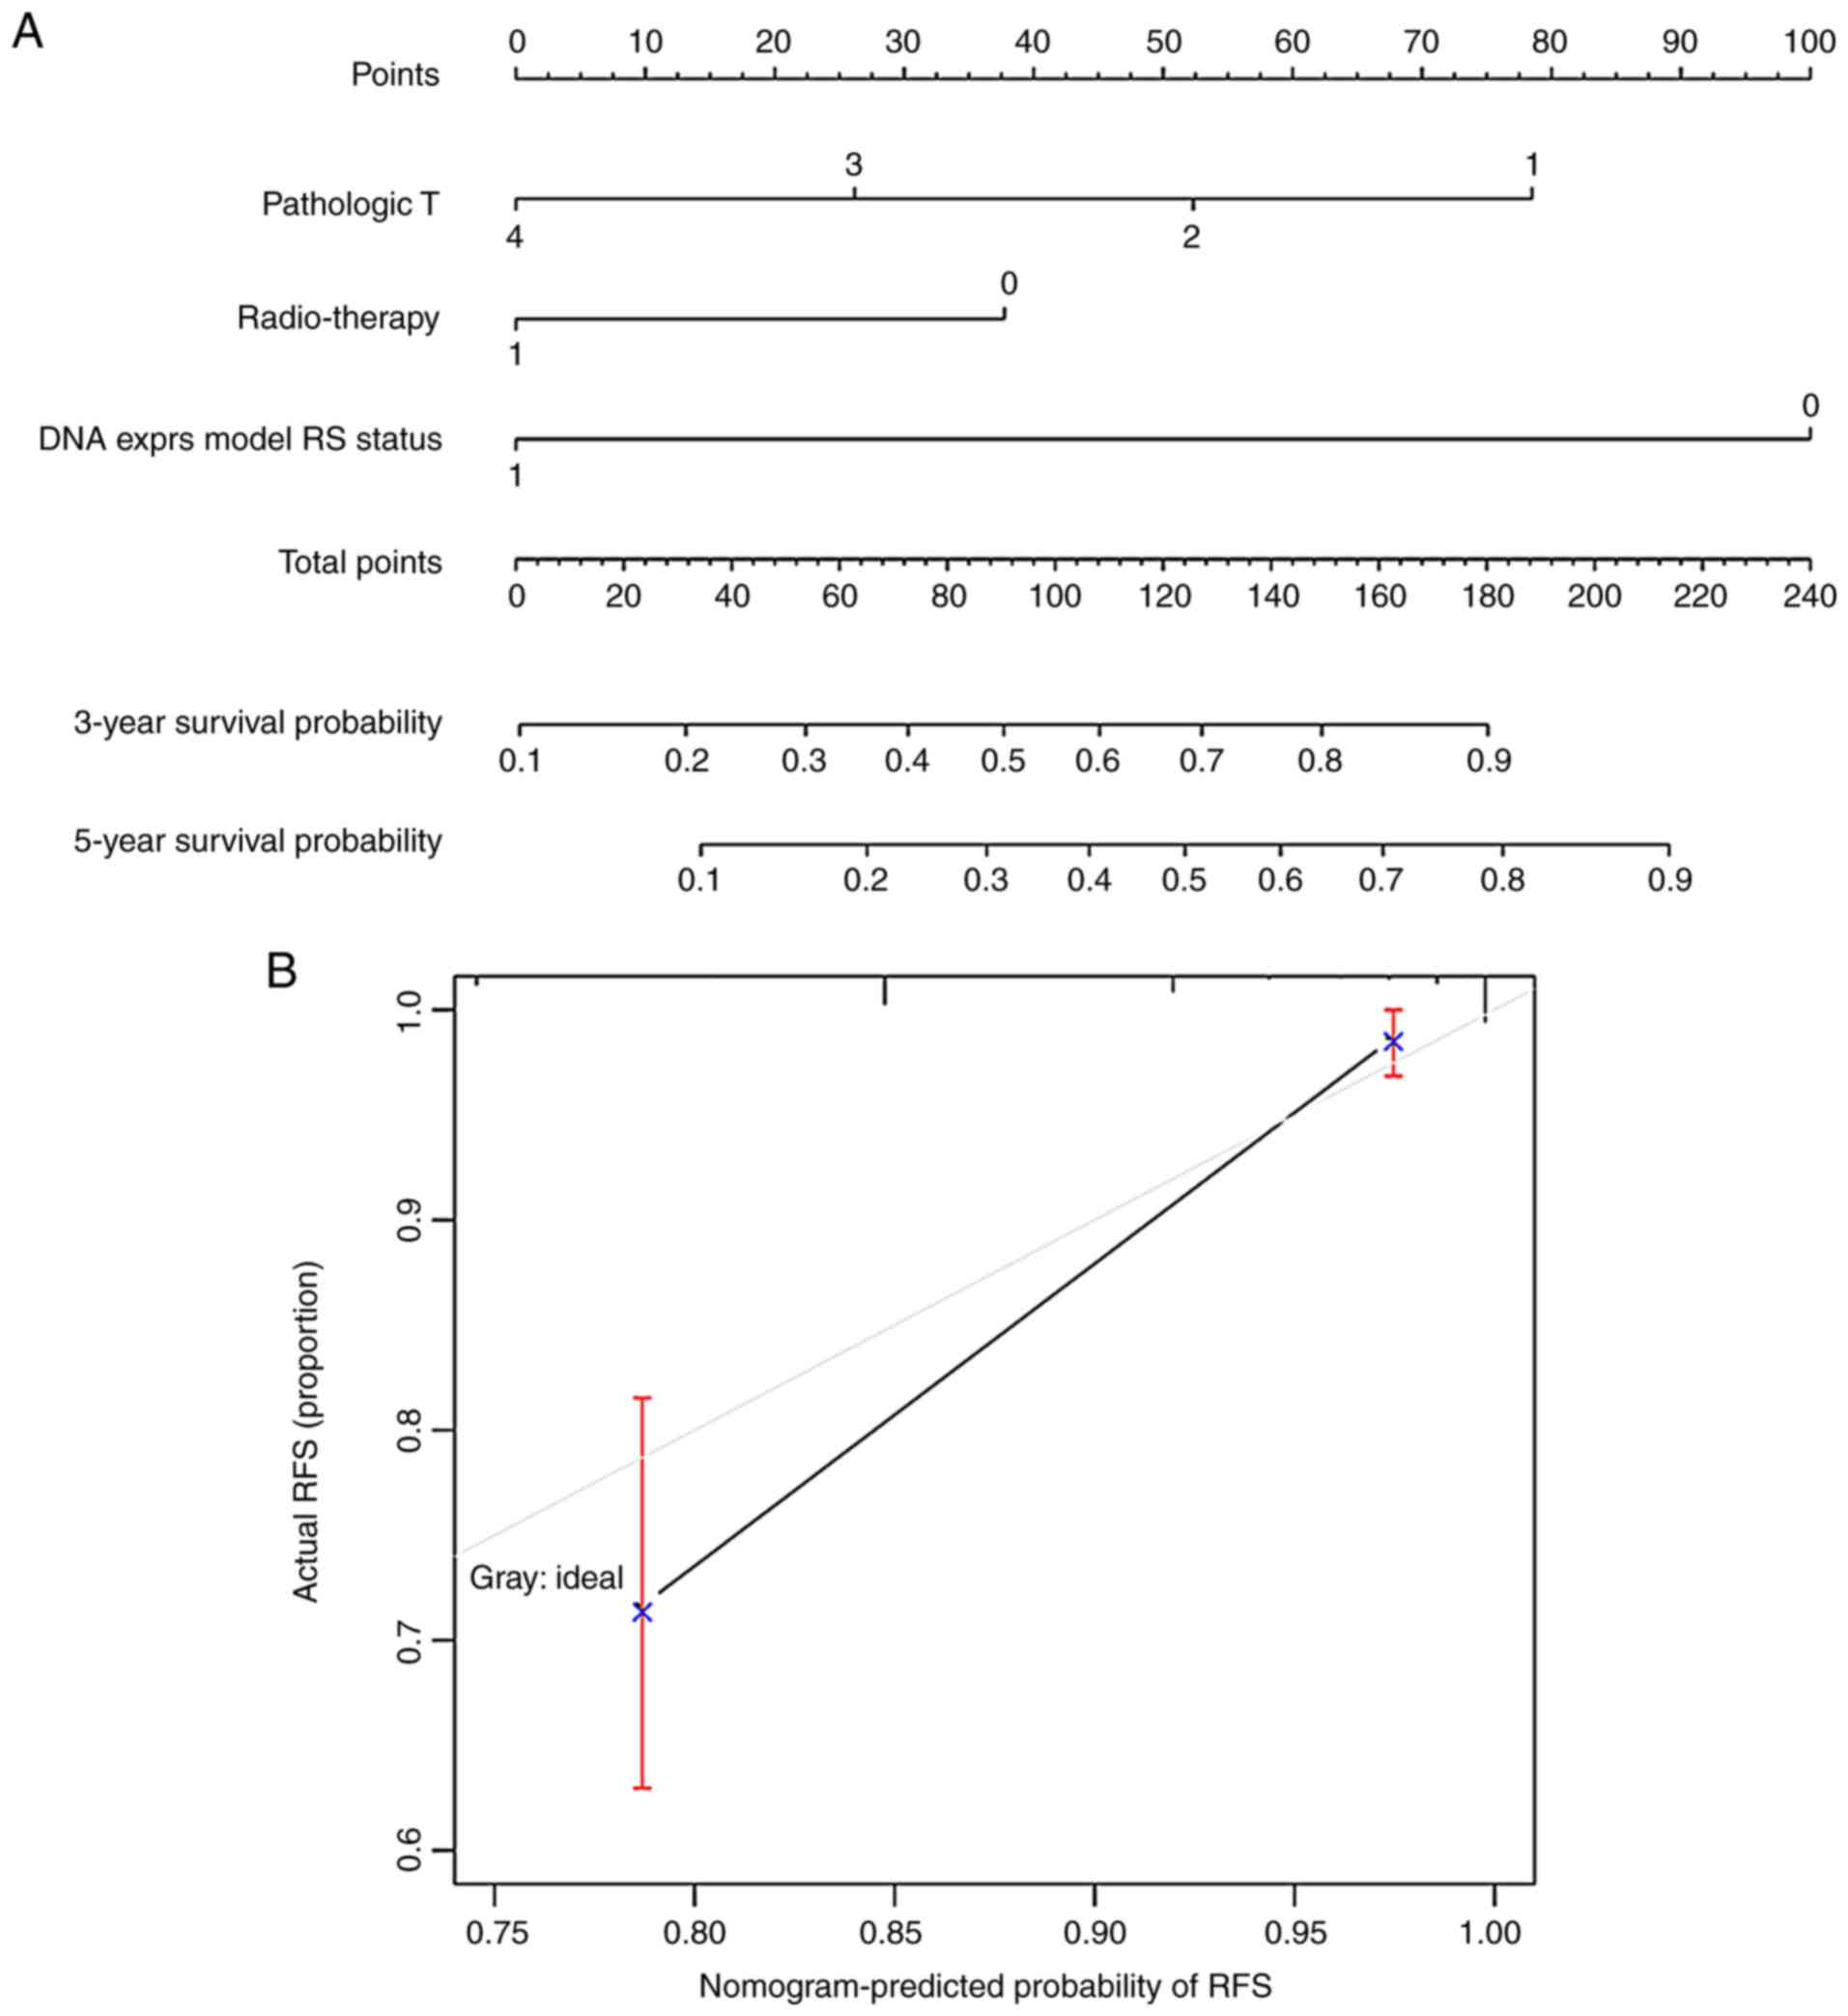
The 5-year nomogram survival model was built to
further analyze the correlation between the 3 independent
prognostic factors and prognosis; this model integrated various
clinical indicators by means of the 'points' axis in the first row
to predict the survival of patients corresponding to the samples
(Fig. 7A). In addition, the
predicted 5-year survival probability was compared to the actual
5-year survival probability, and a high level of consistency was
observed (Fig. 7B).
Pathway enrichment analysis
As aforementioned, following the addition of the RSs
of the DNA methylation level-based RS system to the analysis, the
samples in the training set were classified into either high- or
low-risk groups. A total of 820 DEGs between the two groups were
identified, including 412 upregulated genes and 408 downregulated
genes. Following pathway enrichment analysis, 3 pathways were
identified to be enriched in this set of DEGs: The calcium
signaling pathway (P=0.040944); complement and coagulation cascades
(P=0.0034123); and vascular smooth muscle contraction (P=0.0427049;
Table IV).
| Table IVPathways enriched for the
differentially expressed genes. |
Table IV
Pathways enriched for the
differentially expressed genes.
| Term | Size | ES | NES | P-value | Genes |
|---|
| hsa04020: Calcium
signaling pathway | 10 | −0.396503 | −1.114227 |
4.094×10⁻² | EDNRB, HRH1,
CALML3, PLN, LTB4R2, RYR1, BDKRB2, CALML5, ITPR2, F2R |
| hsa04610:
Complement and coagulation cascades | 10 | 0.5863498 | 2.0125692 |
3.412×10⁻³ | C3AR1, F12, FGG,
C5, F8, SERPINA1, C4BPA, C2, BDKRB2, F2R |
| hsa04270: Vascular
smooth muscle contraction | 7 | −0.537324 | −1.341176 |
4.270×10⁻² | PTGIR, CALML3,
CALML5, PRKG1, PLA2G3, PPP1R14A, ITPR2 |
Discussion
In the present study, a total of 335 DMGs and
DM-lncRNAs were identified between the recurrence-associated
samples and nonrecurrence samples of tumor tissues from patients
with LSCC. Among them, 16 DMGs and 6 DM-lncRNAs were significantly
associated with independent prognosis, and 10 optimal DMGs
(ALDH7A1, C8orf48, CYTL1, HSP90AA1,
IVD, PDE3A, PNMA2, SAMSN1,
TRIP13 and ZNF878) and 6 optimal DM-lncRNAs
(ATXN8OS, BCYRN1, FAM138D, HCG11,
MIR155HG and TTTY13) were used to construct the
methylation status-based or methylation level-based RS systems. In
the KM analysis, the 10-DMG methylation level-based RS system
exhibited the best performance. The set of DEGs between high- and
low-risk groups according to the RS system was identified to be
enriched in 3 pathways: The calcium signaling pathway; complement
and coagulation cascades; and vascular smooth muscle contraction.
As the RS system based on the 10 DMGs exhibited an improved
predictive performance compared with that based on the 6 lncRNAs,
the present study focused on the functions of these 10 DMGs in
LSCC.
Elevated expression of ALDH7A1 in prostate
cancer has been previously described, and was suggested to predict
disease progression and metastasis (32), suggesting that alteration of the
expression of this gene may control tumor progression. However, to
the best of our knowledge, studies investigating the involvement of
this gene in lung cancer are scarce. Low expression of
ALDH7A1 in tumors of surgically treated patients with NSCLC
is associated with a decreased incidence of tumor recurrence,
indicating that decreased expression of this gene may predict a
good prognosis for these patients (33). Patients with LSCC with idiopathic
pulmonary fibrosis indicate a significantly decreased methylation
level of ALDH7A1 compared with those without fibrosis
(34). This observation suggests
that methylation status of ALDH7A1 may affect other clinical
factors. In the present study, ALDH7A1 was a component of
the 10-DMG methylation level-based RS system that exhibited optimal
performance; therefore, the methylation level of this gene may
predict LSCC recurrence. Nevertheless, as the data concerning this
gene in lung cancer are limited, the specific mechanisms of action
of the ALDH7A1 protein and ALDH7A1 DNA methylation in LSCC
should be studied further.
CYTL1 has important roles in certain types of
cancer and is regulated by DNA methylation in LSCC (35). The methylation patterns of
CYTL1 are evidently different between early and late stages
of LSCC, and hypermethylation is more common in the advanced stages
(36). Although CYTL1
hypermethylation does not affect the repression activity mediated
by histone deacetylases (36),
this repression activity may be subject to the regulation between
CYTL1 hypermethylation and histone deacetylases, as the DNA
methylation level is considered to affect the binding of a histone
deacetylase to a promoter region (36,37). CYTL1 is suggested to be a
risk indicator of smoking-associated impairment of metabolic
health, as it is hypomethylated and upregulated in non-lung tissues
of smokers (38). According to
the present study, the CYTL1 gene was often methylated in
recurring LSCC tumors, suggesting that it may be a predictive
factor of LSCC recurrence.
High expression levels of HSP90AA1, heat
shock protein 90 alpha family class B member 1 and heat shock
protein 90 β family member 1 are associated with adverse outcomes
among patients with NSCLC, and therefore may serve as promising
prognostic markers and therapeutic targets in NSCLC (39). HSP90AA1 is differentially
expressed between LUAD and LSCC, and therefore its expression
profile may be used to distinguish the two subtypes (40). Nevertheless, data concerning
HSP90AA1 methylation or the effect of this gene on tumor
recurrence are scarce. PDE3A expression is low in
chemoresistant NSCLC cells due to DNA hypermethylation, and high
PDE3A expression is associated with improved survival in
patients with LUAD (41).
According to the results of the present study, methylated
PDE3A may be associated with the prognosis of LSCC.
PNMA2 is aberrantly expressed in various
types of tumor in patients with paraneoplastic syndromes;
therefore, PNMA2 may be implicated in tumorigenesis
(42). PNMA2 has been
demonstrated to be a tissue marker of small intestine
neuroendocrine tumors, and Ma2 autoantibodies in the blood are a
valuable biomarker for the diagnosis and prediction of tumor
recurrence (43). Conversely, to
the best of our knowledge, no studies on the methylation of this
gene have been published, and this parameter may be a new
prognostic indicator in LSCC, based on the results of the present
study.
Downregulation of SAMSN1 is detectable in
lung cancer cell lines and may be involved in the development of
this disease (44). Elevated
TRIP13 expression contributes to the progression of LUAD and
may be a candidate biomarker or therapeutic target in LUAD
(45). In lung cancer in Xuanwei,
TRIP13, cAMP-responsive element-binding protein 3-like 4 and
cyclin E2 exhibit concordant upregulation and frequent copy number
gains, and have been proposed as potential oncogenes in the
pathogenesis of lung cancer in this region (46). In addition, silencing of
TRIP13 can suppress cell growth and metastasis of
hepatocellular carcinoma by activating TGF-β1/SMAD3 signaling
(47). TRIP13 is 1 of the
7 hypomethylated genes in kidney renal cell carcinoma that have
been suggested as a prognostic factor (48). Downregulation of ZNF878 has
been suggested to be correlated with a poor prognosis of patients
with LUAD (49). Although
published data on SAMSN1, TRIP13, and ZNF878
methylation levels or their effects on LSCC are limited, when taken
into consideration with the results of the present study, we
hypothesize that these 3 genes may perform important functions in
LSCC progression, and their methylation levels may help to
determine an accurate prognosis of the disease.
Information on the participation of genes
C8orf48 and IVD in LSCC is scare. According to the
results of the present study, their methylation may be a prognostic
indicator of LSCC recurrence.
Despite the identification of the 10-DMG signature
that may predict the recurrence of LSCC, the present study
contained certain limitations, such as the small sample size of the
data retrieved from the database, and the lack of expression
validation experiments. In addition, the clinical information of
the LSCC samples in the training set was not compared to the
validation sets, due to the difference in platforms. Nevertheless,
this did preclude the predictive performance evaluation on risks of
the identified clinical factors, as they could be distinguished
from the AUC values. Further experiments are required to confirm
the results.
In conclusion, 335 DMGs and DM-lncRNAs, including 27
DM-lncRNAs and 308 DMGs, were identified between
recurrence-associated and nonrecurrence samples. The RS system
based on the methylation levels of the 10 optimal DMGs
(ALDH7A1, C8orf48, CYTL1, HSP90AA1,
IVD, PDE3A, PNMA2, SAMSN1,
TRIP13 and ZNF878) may help to predict the outcomes
of patients with LSCC.
Funding
The present study was supported by Suzhou Science
and Technology Development Project (grant no. SYS2018085) and the
Construction Project of Suzhou Clinical Medical Center (grant no.
Szzx201506).
Availability of data and materials
All the data used in the present study are available
from the Gene Expression Omnibus (http://www.ncbi.nlm.nih.gov/geo/; accession no.,
GSE39279) and The Cancer Genome Atlas public databases.
Authors' contributions
MZ, LS, YR, SZ, JM, PG and JL were responsible for
data collection and statistical analysis. MZ, LS and YR
participated in drafting and editing the manuscript. FG and BL were
responsible for designing the work and reviewing the manuscript. BL
obtained the funding. All authors read and approved the final
manuscript.
Ethics approval and consent to
participate
Not applicable.
Patient consent for publication
Not applicable.
Competing interests
The authors declare that they have no competing
interests.
Acknowledgments
The results shown here are in whole or part based
upon data generated by The Cancer Genome Atlas Research Network:
https://www.cancer.gov/tcga.
Abbreviations:
|
AUC
|
area under the receiver operating
characteristic curve
|
|
DEG
|
differentially expressed gene
|
|
DMG
|
differentially methylated gene
|
|
DM-lncRNA
|
differentially methylated lncRNA
|
|
FDR
|
false discovery rate
|
|
FC
|
fold change
|
|
HNSC
|
head and neck squamous cell
carcinoma
|
|
KM
|
Kaplan-Meier analysis
|
|
lncRNA
|
long non-coding RNA
|
|
LSCC
|
lung squamous cell carcinoma
|
|
NSCLC
|
non-small cell lung cancer
|
|
LUAD
|
lung adenocarcinoma
|
|
PCC
|
Pearson correlation coefficient
|
|
RFS
|
recurrence-free survival
|
|
RS
|
risk score
|
|
ROC
|
receiver operating characteristic
|
|
TCGA
|
The Cancer Genome Atlas
|
References
|
1
|
McGuire S: World cancer report 2014.
Geneva, Switzerland: World health organization, international
agency for research on cancer WHO press, 2015. Adv Nutr. 7:418–419.
2016. View Article : Google Scholar : PubMed/NCBI
|
|
2
|
Hirsch FR and Bunn PA Jr: Progressin
research on screening and genetics in lung cancer. Lancet Respir
Med. 2:19–21. 2014. View Article : Google Scholar : PubMed/NCBI
|
|
3
|
Travis WD: Update on small cell carcinoma
and its differentiation from squamous cell carcinoma and other
non-small cell carcinomas. Mod Pathol. 25(Suppl 1): S18–S30. 2012.
View Article : Google Scholar : PubMed/NCBI
|
|
4
|
Yoon SM, Shaikh T and Hallman M:
Therapeutic management options for stage III non-small cell lung
cancer. World J Clin Oncol. 8:1–20. 2017. View Article : Google Scholar : PubMed/NCBI
|
|
5
|
Tian S: Classification and survival
prediction for early-stage lung adenocarcinoma and squamous cell
carcinoma patients. Oncol Lett. 14:5464–5470. 2017.PubMed/NCBI
|
|
6
|
Toyokawa G, Kozuma Y, Matsubara T,
Haratake N, Takamori S, Akamine T, Takada K, Katsura M, Shimokawa
M, Shoji F, et al: Prognostic impact of controlling nutritional
status score in resected lung squamous cell carcinoma. J Thorac
Dis. 9:2942–2951. 2017. View Article : Google Scholar : PubMed/NCBI
|
|
7
|
Pfeifer G: Defining driver DNA methylation
changes in human cancer. Int J Mol Sci. 19:pii: E1166. 2018.
View Article : Google Scholar
|
|
8
|
Tan SX, Hu RC, Tan YL, Liu JJ and Liu WE:
Promoter methylation-mediated downregulation of PRDM5 contributes
to the development of lung squamous cell carcinoma. Tumour Biol.
35:4509–4516. 2014. View Article : Google Scholar : PubMed/NCBI
|
|
9
|
Wang W, Qi X and Wu M: Effect of DR4
promoter methylation on the TRAIL-induced apoptosis in lung
squamous carcinoma cell. Oncol Rep. 34:2115–2125. 2015. View Article : Google Scholar : PubMed/NCBI
|
|
10
|
Zhang W, Cui Q, Qu W, Ding X, Jiang D and
Liu H: TRIM58/cg26157385 methylation is associated with eight
prognostic genes in lung squamous cell carcinoma. Oncol Rep.
40:206–216. 2018.PubMed/NCBI
|
|
11
|
Bhan A, Soleimani M and Mandal SS: Long
noncoding RNA and cancer: A new paradigm. Cancer Res. 77:3965–3981.
2017. View Article : Google Scholar : PubMed/NCBI
|
|
12
|
Tong J, Ma X, Yu H and Yang J: SNHG15: A
promising cancer-related long noncoding RNA. Cancer Manag Res.
11:5961–5969. 2019. View Article : Google Scholar : PubMed/NCBI
|
|
13
|
Yao F, Wang Q and Wu Q: The prognostic
value and mechanisms of lncRNA UCA1 in human cancer. Cancer Manag
Res. 11:7685–7696. 2019. View Article : Google Scholar : PubMed/NCBI
|
|
14
|
Lu T, Wang Y, Chen D, Liu J and Jiao W:
Potential clinical application of lncRNAs in non-small cell lung
cancer. Onco Targets Ther. 11:8045–8052. 2018. View Article : Google Scholar : PubMed/NCBI
|
|
15
|
Huang GQ, Ke ZP, Hu HB and Gu B:
Co-expression network analysis of long noncoding RNAs (IncRNAs) and
cancer genes revealsSFTA1P and CASC2abnormalities in lung squamous
cell carcinoma. Cancer Biol Ther. 18:115–122. 2017. View Article : Google Scholar : PubMed/NCBI
|
|
16
|
Li S, Teng Y, Yuan MJ, Ma TT, Ma J and Gao
XJ: A seven long-noncoding RNA signature predicts prognosis of lung
squamous cell carcinoma. Biomark Med. 14:53–63. 2020. View Article : Google Scholar
|
|
17
|
Huang G, Huang Q, Xie Z, Zhou H, Cao J,
Shi L and Yang M: A nine-long non-coding RNA signature for
prognosis prediction of patients with lung squamous cell carcinoma.
Cancer Biomark. 26:239–247. 2019. View Article : Google Scholar : PubMed/NCBI
|
|
18
|
Li R, Yang YE, Yin YH, Zhang MY, Li H and
Qu YQ: Methylation and transcriptome analysis reveal lung
adenocarcinoma-specific diagnostic biomarkers. J Transl Med.
17:3242019. View Article : Google Scholar : PubMed/NCBI
|
|
19
|
Barrett T, Wilhite SE, Ledoux P,
Evangelista C, Kim IF, Tomashevsky M, Marshall KA, Phillippy KH,
Sherman PM, Holko M, et al: NCBI GEO: Archive for functional
genomics data sets-update. Nucleic Acids Res. 41(Database Issue):
D991–D995. 2013. View Article : Google Scholar
|
|
20
|
Sandoval J, Mendez-Gonzalez J, Nadal E,
Chen G, Carmona FJ, Sayols S, Moran S, Heyn H, Vizoso M, Gomez A,
et al: A prognostic DNA methylation signature for stage I
non-small-cell lung cancer. J Clin Oncol. 31:4140–4147. 2013.
View Article : Google Scholar : PubMed/NCBI
|
|
21
|
Yates B, Braschi B, Gray KA, Seal RL,
Tweedie S and Bruford EA: Genenames.org: The HGNC and
VGNC resources in 2017. Nucleic Acids Res. 45(D1): D619–D625. 2017.
View Article : Google Scholar
|
|
22
|
Ritchie ME, Phipson B, Wu D, Hu Y, Law CW,
Shi W and Smyth GK: limma powers differential expression analyses
for RNA-sequencing and microarray studies. Nucleic Acids Res.
43:e472015. View Article : Google Scholar : PubMed/NCBI
|
|
23
|
Law CW, Alhamdoosh M, Su S, Dong X, Tian
L, Smyth GK and Ritchie ME: RNA-seq analysis is easy as 1-2-3 with
limma, Glimma and edgeR. F1000Res. 5:14082016. View Article : Google Scholar
|
|
24
|
Wang L, Cao C, Ma Q, Zeng Q, Wang H, Cheng
Z, Zhu G, Qi J, Ma H, Nian H and Wang Y: RNA-seq analyses of
multiple meri-stems of soybean: Novel and alternative transcripts,
evolutionary and functional implications. BMC Plant Biol.
14:1692014. View Article : Google Scholar
|
|
25
|
Kotthaus H, Korb I, Engel M and Marwedel
P: Dynamic page sharing optimization for the R language. Acm
Sigplan Notices. 50:79–90. 2014. View Article : Google Scholar
|
|
26
|
Kong S and Nan B: Non-asymptotic oracle
inequalities for the high-dimensional Cox regression via lasso.
Stat Sin. 24:25–42. 2012.
|
|
27
|
Goeman JJ: L1 penalized estimation in the
Cox proportional hazards model. Biom J. 52:70–84. 2010.
|
|
28
|
Camp RL, Marisa DF and Rimm DL: X-tile: A
new bio-informatics tool for biomarker assessment and outcome-based
cut-point optimization. Clin Cancer Res. 10:7252–7259. 2004.
View Article : Google Scholar : PubMed/NCBI
|
|
29
|
Liu XR, Pawitan Y and Clements MS:
Generalized survival models for correlated time-to-event data. Stat
Med. 36:4743–4762. 2017. View Article : Google Scholar : PubMed/NCBI
|
|
30
|
Steyerberg EW and FRANK E HARRELL Jr:
Regression modeling strategies: With applications, to linear
models, logistic and ordinal regression, and survival analysis, 2nd
ed. Heidelberg Springer. Biometrics. 72:1006–1007. 2016. View Article : Google Scholar
|
|
31
|
Subramanian A, Tamayo P, Mootha VK,
Mukherjee S, Ebert BL, Gillette MA, Paulovich A, Pomeroy SL, Golub
TR, Lander ES and Mesirov JP: Gene set enrichment analysis: A
knowledge-based approach for interpreting genome-wide expression
profiles. Proc Natl Acad Sci USA. 102:15545–15550. 2005. View Article : Google Scholar : PubMed/NCBI
|
|
32
|
van den Hoogen C, van der Horst G, Cheung
H, Buijs JT, Lippitt JM, Guzmán-Ramírez N, Hamdy FC, Eaton CL,
Thalmann GN, Cecchini MG, et al: High aldehyde dehydrogenase
activity identifies tumor-initiating and metastasis-initiating
cells in human prostate cancer. Cancer Res. 70:5163–5173. 2010.
View Article : Google Scholar : PubMed/NCBI
|
|
33
|
Giacalone NJ, Den RB, Eisenberg R, Chen H,
Olson SJ, Massion PP, Carbone DP and Lu B: ALDH7A1 expression is
associated with recurrence in patients with surgically resected
non-small-cell lung carcinoma. Future Oncol. 9:737–745. 2013.
View Article : Google Scholar : PubMed/NCBI
|
|
34
|
Hata A, Nakajima T, Matsusaka K, Fukuyo M,
Morimoto J, Yamamoto T, Sakairi Y, Rahmutulla B, Ota S, Wada H, et
al: A low DNA methylation epigenotype in lung squamous cell
carcinoma and its association with idiopathic pulmonary fibrosis
and poorer prognosis. Int J Cancer. 146:388–399. 2020. View Article : Google Scholar
|
|
35
|
Zhu S, Kuek V, Bennett S, Xu H, Rosen V
and Xu J: Protein Cytl1: Its role in chondrogenesis, cartilage
homeostasis, and disease. Cell Mol Life Sci. 76:3515–3523. 2019.
View Article : Google Scholar : PubMed/NCBI
|
|
36
|
Kwon YJ, Lee SJ, Koh JS, Kim SH, Lee HW,
Kang MC, Bae JB, Kim YJ and Park JH: Genome-wide analysis of DNA
methylation and the gene expression change in lung cancer. J Thorac
Oncol. 7:20–33. 2012. View Article : Google Scholar
|
|
37
|
Kim SN, Kim NH, Lee W, Seo DW and Kim YK:
Histone deacetylase inhibitor induction of P-glycoprotein
transcription requires both histone deacetylase 1 dissociation and
recruitment of CAAT/enhancer binding protein beta and pCAF to the
promoter region. Mol Cancer Res. 7:735–744. 2009. View Article : Google Scholar : PubMed/NCBI
|
|
38
|
Tsai PC, Glastonbury CA, Eliot MN,
Bollepalli S, Yet I, Castillo-Fernandez JE, Carnero-Montoro E,
Hardiman T, Martin TC, Vickers A, et al: Smoking induces
coordinated DNA methylation and gene expression changes in adipose
tissue with consequences for metabolic health. Clin Epigenetics.
10:1262018. View Article : Google Scholar : PubMed/NCBI
|
|
39
|
Liu K, Kang M, Li J, Qin W and Wang R:
Prognostic value of the mRNA expression of members of the HSP90
family in non-small cell lung cancer. Exp Ther Med. 17:2657–2665.
2019.PubMed/NCBI
|
|
40
|
Lu C, Chen H, Shan Z and Yang L:
Identification of differentially expressed genes between lung
adenocarcinoma and lung squamous cell carcinoma by gene expression
profiling. Mol Med Rep. 14:1483–1490. 2016. View Article : Google Scholar : PubMed/NCBI
|
|
41
|
Tian FM, Zhong CY, Wang XN and Meng Y:
PDE3A is hyper-methylated in cisplatin resistant non-small cell
lung cancer cells and is a modulator of chemotherapy response. Eur
Rev Med Pharmacol Sci. 21:2635–2641. 2017.PubMed/NCBI
|
|
42
|
Lee YH, Pang SW and Tan KO: PNMA2 mediates
heterodimeric interactions and antagonizes chemo-sensitizing
activities mediated by members of PNMA family. Biochem Biophys Res
Commun. 473:224–229. 2016. View Article : Google Scholar : PubMed/NCBI
|
|
43
|
Cui T, Hurtig M, Elgue G, Li SC, Veronesi
G, Essaghir A, Demoulin JB, Pelosi G, Alimohammadi M, Öberg K and
Giandomenico V: Paraneoplastic antigen Ma2 autoantibodies as
specific blood biomarkers for detection of early recurrence of
small intestine neuroendocrine tumors. PLoS One. 5:e160102010.
View Article : Google Scholar
|
|
44
|
Yamada H, Yanagisawa K, Tokumaru S,
Taguchi A, Nimura Y, Osada H, Nagino M and Takahashi T: Detailed
characterization of a homozygously deleted region corresponding to
a candidate tumor suppressor locus at 21q11-21 in human lung
cancer. Genes Chromosomes Cancer. 47:810–818. 2008. View Article : Google Scholar : PubMed/NCBI
|
|
45
|
Li W, Zhang G, Li X, Wang X, Li Q, Hong L,
Shen Y, Zhao C, Gong X, Chen Y and Zhou J: Thyroid hormone receptor
interactor 13 (TRIP13) overexpression associated with tumor
progression and poor prognosis in lung adenocarcinoma. Biochem
Biophys Res Commun. 499:416–424. 2018. View Article : Google Scholar : PubMed/NCBI
|
|
46
|
Zhang Y, Xue Q, Pan G, Meng QH, Tuo X, Cai
X, Chen Z, Li Y, Huang T, Duan X and Duan Y: Integrated analysis of
genome-wide copy number alterations and gene expression profiling
of lung cancer in Xuanwei, China. PLoS One. 12:e01690982017.
View Article : Google Scholar : PubMed/NCBI
|
|
47
|
Yao J, Zhang X, Li J, Zhao D, Gao B, Zhou
H, Gao S and Zhang L: Silencing TRIP13 inhibits cell growth and
metastasis of hepatocellular carcinoma by activating of
TGF-β1/smad3. Cancer Cell Int. 18:2082018. View Article : Google Scholar
|
|
48
|
Hu F, Zeng W and Liu X: A gene signature
of survival prediction for kidney renal cell carcinoma by
multi-omic data analysis. Int J Mol Sci. 20:pii: E5720. 2019.
View Article : Google Scholar
|
|
49
|
Liu H and Zhao H: Prognosis related
miRNAs, DNA methylation, and epigenetic interactions in lung
adenocarcinoma. Neoplasma. 66:487–493. 2019. View Article : Google Scholar : PubMed/NCBI
|