Introduction
Neuritin (or Nrn1), also known as candidate
plasticity gene 15 (CPG15) (1,2),
is a neurotrophin that is involved in neural development and
neuroplasticity (3). Neuritin
promotes neurite growth and synaptogenesis in hippocampal and
cortical neurons (4,5), and is related to the recovery from
nerve injury and learning memory (6-8).
It has further been found that recombinant Neuritin (9) improves nerve regeneration following
acute spinal cord injury (10)
and sciatic nerve injury in rats (11).
AD is a chronic nervous system degenerative diseases
characterized by progressive cognitive and memory impairment
(12). Importantly, recent
studies have demonstrated that Neuritin expression is decreased in
mice with Alzheimer's disease (AD), and that Neuritin attenuates
cognitive function impairments (13,14). Given the role of Neuritin in AD,
it may thus be a novel target for the treatment of AD; however, the
mechanisms underlying the downregulation of Neuritin expression in
AD remain unclear.
Studies have demonstrated that >33% of human
genes are modulated by microRNAs (miRNAs or miRNAs) (15-17). It has also been reported that
miRNAs regulate the spatiotemporal changes in Neuritin expression
(18,19). Therefore, it was hypothesized that
specific miRNAs regulate Neuritin expression in AD and therefore
are involved in the development of AD.
In the present study, the potent analytical and
predictive capabilities of bioinformatics (20) were utilized to focus on candidate
miRNAs that may regulate Neuritin expression in AD. The association
between these candidate miRNAs and Neuritin expression in mice with
AD was then confirmed. In addition, the mechanisms responsible for
the regulatory effects of miR-199a on Neuritin expression were
investigated. The associations between the memory capacities of
APP/PS1 mice and altered miR-199a and Neuritin levels were also
investigated in an aim to elucidate the role of miR-199a in AD and
its regulatory effects on Neuritin.
Materials and methods
Analysis of microarray expression
profiling data
To search for miRNA expression profiling data in AD
from the Gene Expression Omnibus database (www.ncbi.nlm.nih.gov/geo), 'Alzheimer's disease' and
'microRNA' were used as indexes to obtain miRNA datasets. The
selection criteria for micro-array datasets of samples were those
that could extract the original data from AD and normal control
(NC) groups using R language, excluding epigenetic data. A total of
5 datasets of AD (GSE48552, GSE46579, GSE46131, GSE16759 and
GSE48028), including 67 AD samples and 38 NC samples were selected
for further analysis. Differentially expressed miRNAs (DEmiRNAs)
were screened by a matrix of miRNA expression levels in the
Bioconductor LIMMA R package. The screening threshold of DEmiRNAs
was P<0.05, |fold change|>1. Additionally, literature with
all the miRNA expression profiles of Tg2576 mice was selected for
the analysis of DEmiRNAs (21).
Screening and analyzing of the candidate
miRNAs
In total, 9 bioinformatics algorithms including
miRWalk (http://mirwalk.umm.uni-heidelberg.de/), miRNAMap
(http://mirnamap.mbc.nctu.edu.tw/), miRDB
(http://mirdb.org/), miRtarBase (http://mirtarbase.mbc.nctu.edu.tw/php/index.php),
miRNApath (http://snf-515788.vm.okeanos.grnet.gr/), PicTar5
(https://pictar.mdc-berlin.de/), starBase
(http://starbase.sysu.edu.cn/starbase2/), TargetScan
(http://www.targetscan.org/mmu_72/)
and miRanda (http://www.microrna.org/microrna/home.do), were used
to predict the miRNAs that target Neuritin (or Nrn1). Moreover, an
online Venn diagram software (http://bioinformatics.psb.ugent.be/webtools/Venn/) was
used to screen miRNAs that were both differentially expressed in AD
and that target Neuritin. Finally, TargetScan was used to predict
the differentially expressed genes (DEGs) downstream of the
candidate miRNAs that target Nrn1 (cumulative weighted context ++
score <-0.1). A Gene Ontology (GO) analysis was then performed
using the online software DAVID (https://david.ncifcrf.gov/) to analyze the function of
the targets of the candidate miRNAs, with FDR <0.05 used to
define statistical significance.
Transgenic mice with AD
APPSWE, PSEN1dE9 (APP/PS1) transgenic mice and
matched wild-type (WT) B6C3 mice were purchased from the Animal
Model Center of Nanjing University. A total of 20 APP/PS1 mice and
20 WT mice were housed under SPF conditions, 18-26°C with 40-70%
humidity under a 12:12 h light: Dark cycle, with free access to
food and water. All experimental procedures were approved by the
Animal Ethics Committee of Hangzhou Normal University.
RNA isolation and RT-qPCR
Total RNA was isolated from hippocampal and cortical
tissues using the SanPrep Column microRNA Extraction kit (Sangon
Biotech Co., Ltd.), and cDNA was synthesized by reverse
transcription using Revert Aid Premium Reverse Transcriptase
(Thermo Fisher Scientific, Inc.). Subsequently, 2X SG Fast qPCR
Master Mix (Sangon Biotech Co., Ltd.) was used to amplify the 10
candidate miRNAs. The PCR thermocycling conditions of the 10
candidate miRNAs were as follows: 95°C for 3 min, followed by 35
cycles at 94°C for 30 sec, 57°C for 30 sec, and 72°C for 30 sec,
ending at 72°C for 8 min. The miRNA expression levels were
normalized to those of U6 small nuclear RNA. Copy numbers of the 10
miRNAs were obtained using the standard curve of RT-PCR. To detect
Nrn1 mRNA levels, total RNA was isolated from cortical and
hippocampal tissue samples using TRIzol reagent (Invitrogen; Thermo
Fisher Scientific, Inc.). Equivalent amounts of RNA from each
sample were used for cDNA synthesis using the FastKing gDNA
Dispelling RT SuperMix kit [Tiangen Biotech (Beijing) Co., Ltd.].
Subsequently, the cDNAs were used for qPCR analysis. The
thermocycling conditions of Nrn1 mRNA are 95°C for 15 min, followed
by 40 cycles at 95°C for 10 sec, 60°C for 20 sec, and 72°C for 30
sec. The primer sequences are listed in Table I and the 2−ΔΔCq method
was used to analyze the level of mRNA (22).
 | Table ISequences of primers used for
RT-qPCR. |
Table I
Sequences of primers used for
RT-qPCR.
| Primer | Sequence |
|---|
| U6-F |
5′-CTCGCTTCGGCAGCACA-3′ |
| U6-R |
5′-AACGCTTCACGAATTTGCGT-3′ |
| miR-199a-5p RT |
5′-CTCAACTGGTGTCGTGGAGTCGGCAATTCAGTTGAGGAACAGGT-3′ |
| miR-199a-5p F |
5′-ACACTCCAGCTGGGCCCAGTGTTCAGACT-3′ |
| All R |
5′-TGGTGTCGTGGAGTCG-3′ |
| Mouse Nrn1-F |
5′-ATTTCACTGATCCTCGCGGT-3′ |
| Mouse Nrn1-R |
5′-CCAGTATGTGCACACGGTCT-3′ |
| Mouse GAPDH-F |
5′-CAGGAGAGTGTTTCCTCGTCC-3′ |
| Mouse GAPDH-R |
5′-TTCCCATTCTCGGCCTTGAC-3′ |
| 293T Nrn1-F |
5′-ATAGCGTATCTGGTGCAGGC-3′ |
| 293T Nrn1-R | 5′
-TGTTCGTCTTGTCGTCCAGG-3′ |
| 293T β-actin-F |
5′-GGGAAATCGTGCGTGACAT-3′ |
| 293T β-actin-R |
5′-GTCAGGCAGCTCGTAGCTCTT-3′ |
Cells and cell culture
HeLa and 293T cells from the Cell Bank of the
Chinese Academy of Sciences were cultured in Dulbecco's modified
Eagle's medium (DMEM) with 4,500 mg/l glucose (Sigma-Aldrich; Merck
KGaA) and 10% fetal bovine serum (Biological Industries). Cell
cultures were incubated in a humidified 5% CO2/95% air
environment at 37°C.
Transfection
The 293T cells with a high Neuritin expression were
plated into 6-well plates at 1×10⁶ cells/well, and were
then transfected with miR-199a mimics or a negative control (NC)
mimic (Sangon Biotech Co., Ltd.) using Lipofectamine 3000 reagent
(160 pM; Invitrogen; Thermo Fisher Scientific, Inc.). Following 12
h of incubation at 37°C, the cells were collected for western blot
and RT-qPCR analyses.
Western blot analysis
Neuritin protein levels in the 293T cells
transfected with miR-199a and NC mimics and hippocampal tissues
were detected by western blot analysis. Cells lysed in RIPA lysis
buffer (Beyotime Institute of Biotechnology) with 1% protease
inhibitor cocktail (Beyotime Institute of Biotechnology),
centrifuged at 15,777 × g for 10 min at 4°C, and the supernatant
was collected. The amount of protein was determined using BCA
protein assay kit (Beyotime Institute of Biotechnology). The sample
volume of each well is 40 µg for 293T cells or 80-100
µg for hippocampal tissues, respectively. Total protein was
electrophoresed by 12.5% SDS-PAGE and transferred to PVDF membranes
at 23 V for 43 min. Membranes were blocked with Tris-buffered
saline (TBS)/5% fat-free skim milk for 2 h at room temperature, and
then incubated with rabbit anti-Neuritin monoclonal antibody
(1:1,000; ab64186, Abcam) for 16 h at 4°C. The following day, the
membranes were incubated with secondary goat anti-rabbit IgG-HRP
antibody (1:2,500; ZB-2301, Zsgb-Bio) for 2 h at room temperature.
Finally, proteins were detected using Clarity Western ECL
substrates (Bio-Rad Laboratories, Inc.). β-actin (Zsgb-Bio) was
used as an endogenous control. Adobe photoshop CC 2015 software was
used for densitometry.
Luciferase reporter assay
HeLa cells were seeded in 24-well plates at
1×10⁵ cells/well and co-transfected with NC mimics
(Sangon Biotech Co., Ltd.) and pLUC-NC, NC mimics and pLUC-Nrn1
3′-UTR, miR-199a mimics (Sangon Biotech Co., Ltd.) and pLUC-Nrn1
3′-UTR, or miR-199a mimics and pLUC-Nrn1-mut 3′-UTR, with
Lipofectamine 3000 (Invitrogen; Thermo Fisher Scientific, Inc.).
After 12 h, the cells were lysed, and their luciferase activity was
measured using Dual-Luciferase reporter assay system and pLUC was
pmirGLO Dual-Luciferase miRNA Target Expression Vector (Promega
Corporation). To normalize the reporter signal, the mean signal of
the firefly luminescence was divided by the mean signal of
Renilla luminescence.
Morris water maze
APP/PS1 and WT mice were transferred from the
specific pathogen-free barrier to the behavioral laboratory to
adapt to the environment for 7 days. The escape platform was
located in a fixed spatial location 1 cm above the water surface on
the 1st day, and was 1 cm below the water surface from the 2nd to
5th days. According to the circadian rhythm of the animals, the
mice were placed into the water twice each night. The maximum trial
length was 60 sec, and if a mouse did not reach the platform in the
allotted time, they were manually guided to it. Upon reaching the
invisible escape platform, the mice were left on it for an
additional 5 sec to allow for a survey of the spatial cues in the
environment to guide future navigation to the platform. After each
trial, the mice were wiped dry and left in the constant temperature
heating station for 5 min to dry. Subsequently, they were placed
back in their cages. Following 5 days of task acquisition, the
probe test was performed over a period of 60 sec during which the
platform was removed to measure time and crossing times in the
target quadrant. All trials were analyzed for latency, swim speed
and swim path using AnyMaze (Clever Sys, Inc.) (23).
Statistical analysis
All experiments were performed in triplicate, and
the results are presented as the means ± standard error.
Statistical analyses were performed using R software (RStudio3.6.2,
https://www.r-project.org/), with
P<0.05 being set for statistical significance using
Student-Newman-Keuls test.
Results
Cluster analysis of DEmiRNAs in AD
The miRNA data was derived from samples of patients
with AD and AD model mice. The 5 miRNA expression datasets
(GSE48552, GSE46579, GSE46131, GSE16759 and GSE48028) and data from
the literature were enrolled (Table
II). First, quality control of the 5 datasets was conducted to
normalize the measurement data between different samples using the
R conductor package (Fig. S1).
Second, the miRNAs in GSE48552, GSE46579, GSE46131, GSE16759 and
GSE48028 were subjected to cluster analysis (Fig. 1A-E). Third, DEmiRNAs were screened
using the cut-off criteria of P-value <0.05 and |logFC|≥1 by the
LIMMA R package (Fig. 1F-J).
After analyzing the 5 miRNA expression datasets, 384 DEmiRNAs were
screened (Table SI); another 323
DEmiRNAs were screened from the literature with the full miRNA
expression profiles of Tg2576 AD model mice (21). In total, 707 DEmiRNAs were
analyzed in AD.
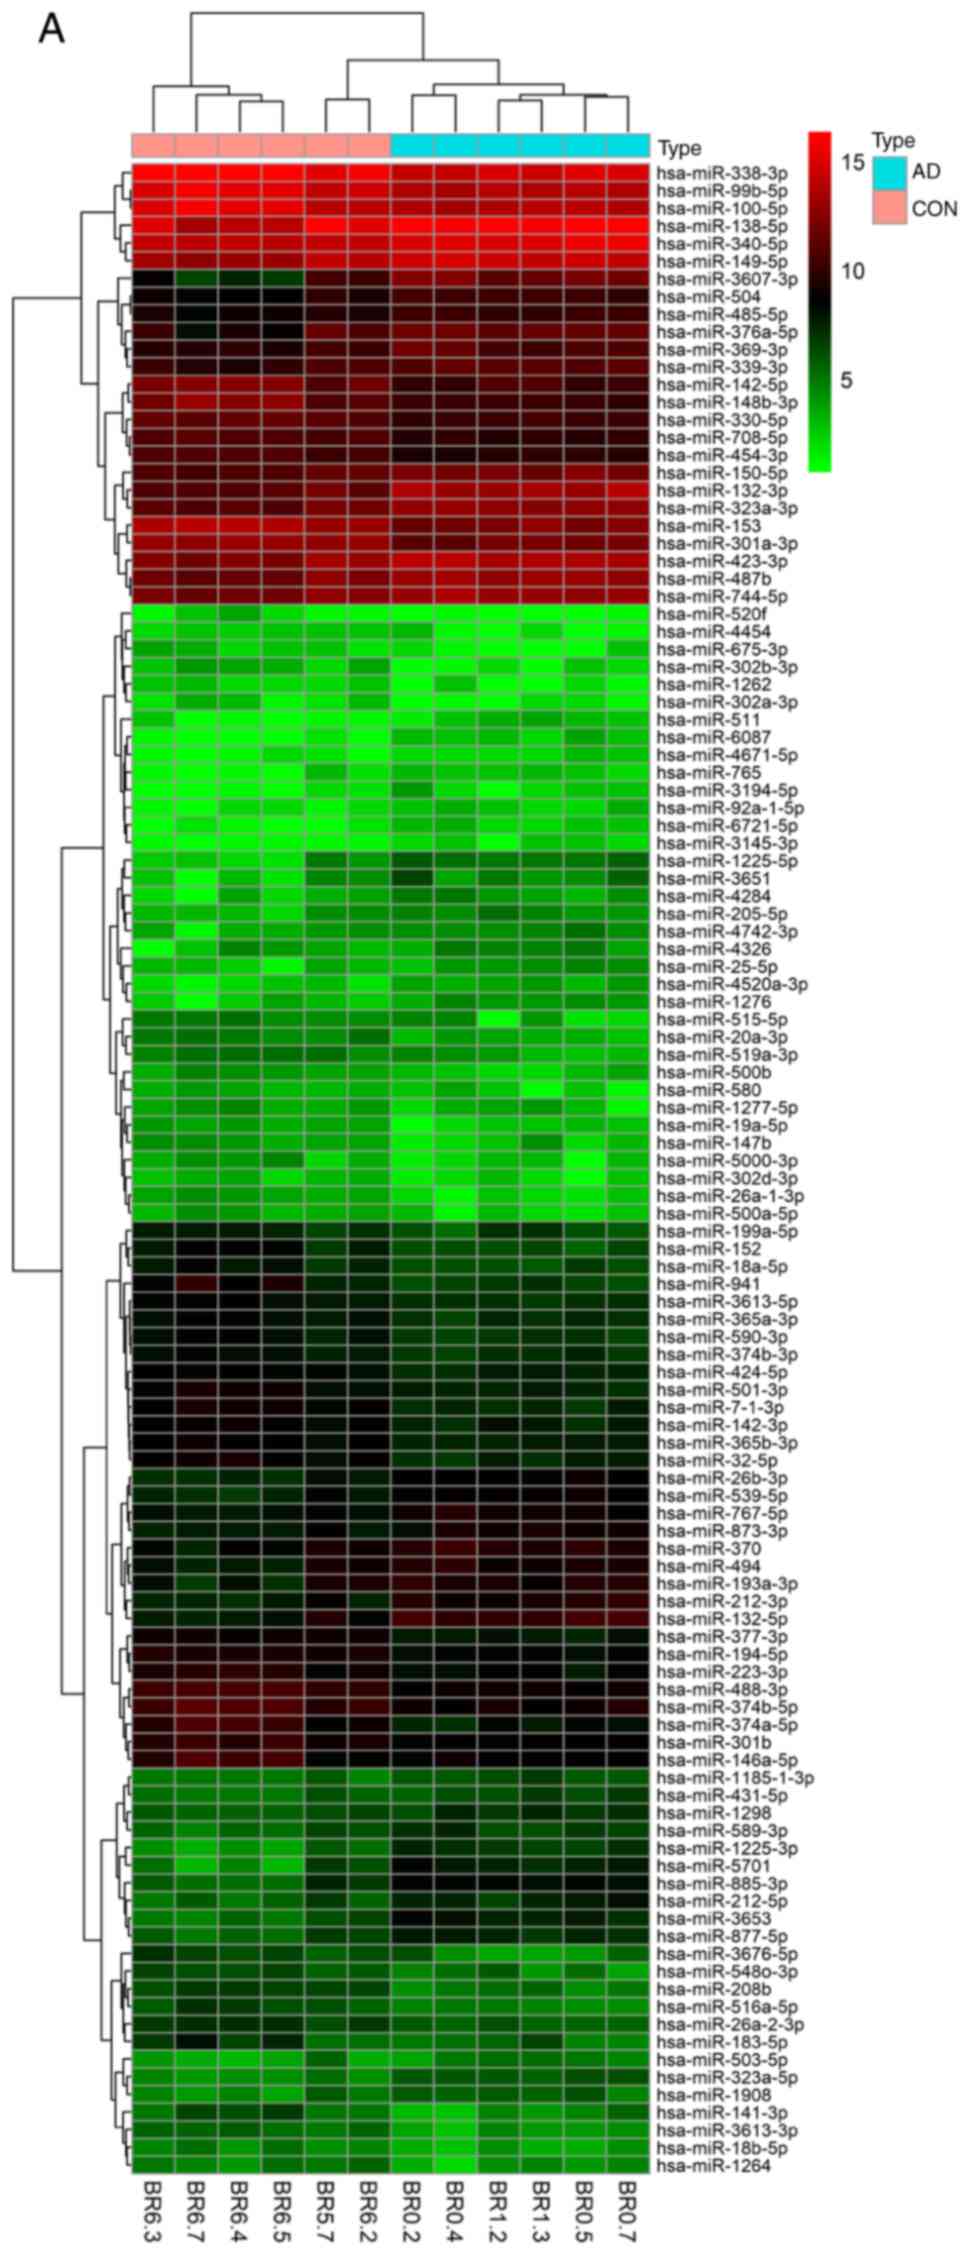 | Figure 1Cluster analysis of the miRNAs from 5
datasets. Heatmaps of DEmiRNAs from the (A) GSE48552 and (B)
GSE46579 datasets. Each row represents a miRNA and each column
represents a sample. The miRNA clustering tree is on the left, and
the sample clustering tree appears at the top. The color scale
shown at the top illustrates the relative expression level of
miRNAs: Red indicates a high relative expression, while green
indicates a low relative expression. Cluster analysis of the miRNAs
from 5 datasets. Heatmaps of DEmiRNAs from the (C) GSE46131 and (D)
GSE416759 datasets. Each row represents a miRNA and each column
represents a sample. The miRNA clustering tree is on the left, and
the sample clustering tree appears at the top. The color scale
shown at the top illustrates the relative expression level of
miRNAs: Red indicates a high relative expression, while green
indicates a low relative expression. Cluster analysis of the miRNAs
from 5 datasets. Heatmap of DEmiRNAs from the (E) GSE48028 dataset.
Each row represents a miRNA and each column represents a sample.
The miRNA clustering tree is on the left, and the sample clustering
tree appears at the top. The color scale shown at the top
illustrates the relative expression level of miRNAs: Red indicates
a high relative expression, while green indicates a low relative
expression. (F-J) Volcano plots of DEmiRNAs from the GSE48552,
GSE46579, GSE46131, GSE416759 and GSE48028 datasets,
respectively. |
| Table IIBasic information of the selected
data. |
Table II
Basic information of the selected
data.
| GEO Accession
no. | Author/(Refs.) | Publication
year | Country | Experiment
type | Platform | AD | Control | Sample type |
|---|
| GSE48552 | Lau et al
(34) | 2013 | Belgium | Non-coding RNA
profiling by high throughput sequencing | GPL11154 | 6 | 6 | Human prefrontal
cortex |
| GSE46579 | Leidinger et
al (35) | 2013 | Germany | Non-coding RNA
profiling by high throughput sequencing | GPL11154 | 48 | 22 | Human blood |
| GSE46131 | Hébert et al
(36) | 2013 | USA | Non-coding RNA
profiling by high throughput sequencing | GPL10999 | 5 | 2 | Human temporal
neocortex gray matter |
| GSE16759 | Nunez-Iglesias
et al (37) | 2010 | USA | Non-coding RNA
profiling by array | GPL8757 | 4 | 4 | Human parietal
lobe |
| GSE48028 | Wei et al
(https://www.ncbi.nlm.nih.gov/geo/query/acc.cgi?acc=GSE48028) | 2013 | China | Non-coding RNA
profiling by array | GPL17300 | 2 | 2 | Mouse
hippocampus |
| Literature | Lee et al
(21) | 2012 | Korea | miRNA
microarray | / | 2 | 2 | Mouse brain |
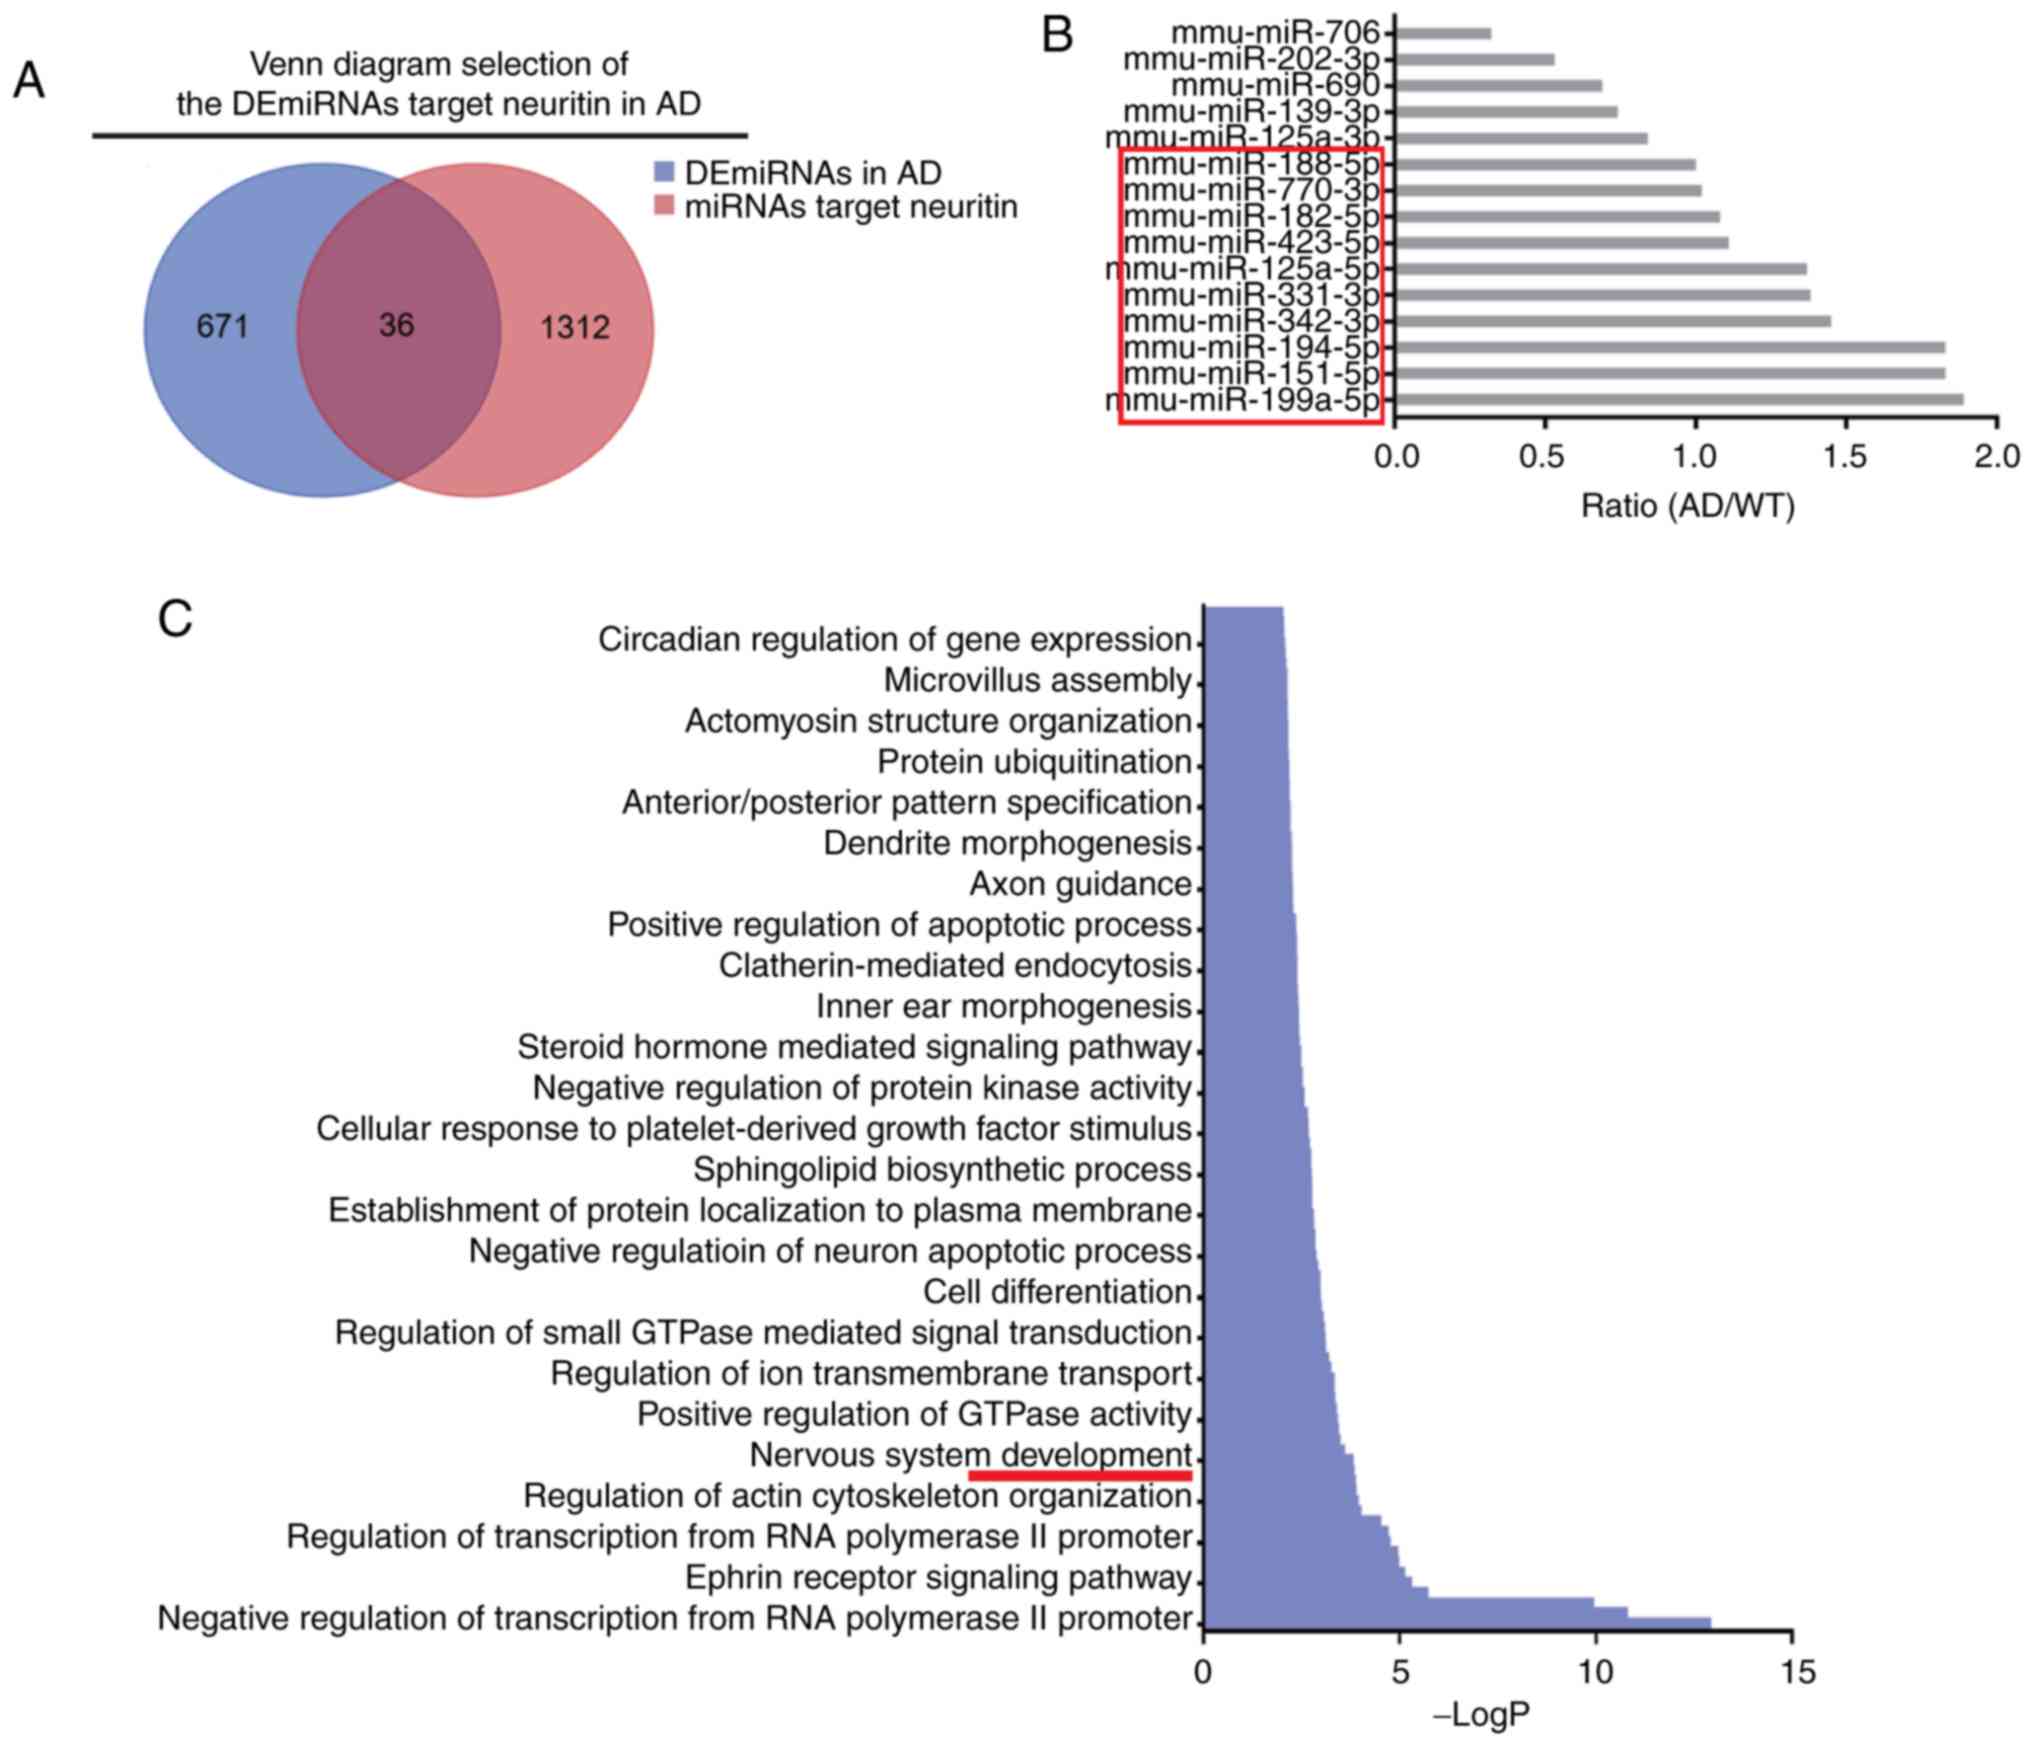
Screening candidate miRNAs
First, 1,348 miRNAs that could target the 3′-UTR of
Neuritin (or Nrn1; Table SII)
were predictively analyzed using 9 bioinformatics algorithms.
Second, 36 miRNAs that overlapped in the databases of the 1,348
miRNAs that target Neuritin and the 707 DEmiRNAs in AD were
screened (Fig. 2A). Third, 15
miRNAs with higher binding scores for Neuritin were selected
(Table III), and the 10
candidate miRNAs with the highest AD/WT ratio among these were
screened out (Fig. 2B).
Additionally, GO enrichment analysis revealed that the candidate
miRNAs were enriched in the nervous system as the biological
process (BP) (Fig. 2C), were
primarily distributed in the neuronal cell body, presynaptic
membrane, neuron projection and postsynaptic density as the
cellular component (CC) (Fig.
2D), and exhibited neurotrophin TRKA receptor binding and
tau-protein kinase activity as the molecular function (MF)
(Fig. 2E).
| Table IIIRanking of the 36 miRNAs according to
their Nrn1 binding scores. |
Table III
Ranking of the 36 miRNAs according to
their Nrn1 binding scores.
| miRNAs | Binding scores
(Nrn1) |
|---|
|
mmu-miR-199a-5p | 1 |
| mmu-miR-151-5p | 1 |
| mmu-miR-194-5p | 1 |
| mmu-miR-342-3p | 1 |
|
mmu-miR-125a-5p | 1 |
| mmu-miR-423-5p | 1 |
| mmu-miR-770-3p | 1 |
| mmu-miR-188-5p | 1 |
| mmu-miR-690 | 1 |
| mmu-miR-706 | 1 |
| mmu-miR-331-3p | 0.92 |
| mmu-miR-182-5p | 0.92 |
|
mmu-miR-125a-3p | 0.92 |
| mmu-miR-139-3p | 0.92 |
| mmu-miR-202-3p | 0.92 |
| mmu-miR-129-5p | 0.92 |
| mmu-miR-540-3p | 0.92 |
| mmu-miR-540-5p | 0.92 |
| mmu-miR-337-5p | 0.92 |
| mmu-miR-709 | 0.92 |
| mmu-miR-434-5p | 0.92 |
| mmu-miR-409-5p | 0.92 |
| mmu-miR-666-3p | 0.92 |
| mmu-miR-338-5p | 0.92 |
| mmu-miR-705 | 0.92 |
| mmu-miR-671-5p | 0.92 |
| mmu-miR-697 | 0.92 |
| mmu-miR-34b-5p | 0.85 |
| mmu-miR-324-5p | 0.85 |
| mmu-miR-532-5p | 0.85 |
| mmu-miR-296-5p | 0.85 |
| mmu-miR-380-3p | 0.85 |
| mmu-miR-574-5p | 0.85 |
| mmu-miR-878-3p | 0.85 |
| mmu-miR-96-5p | / |
| mmu-miR-384-3p | / |
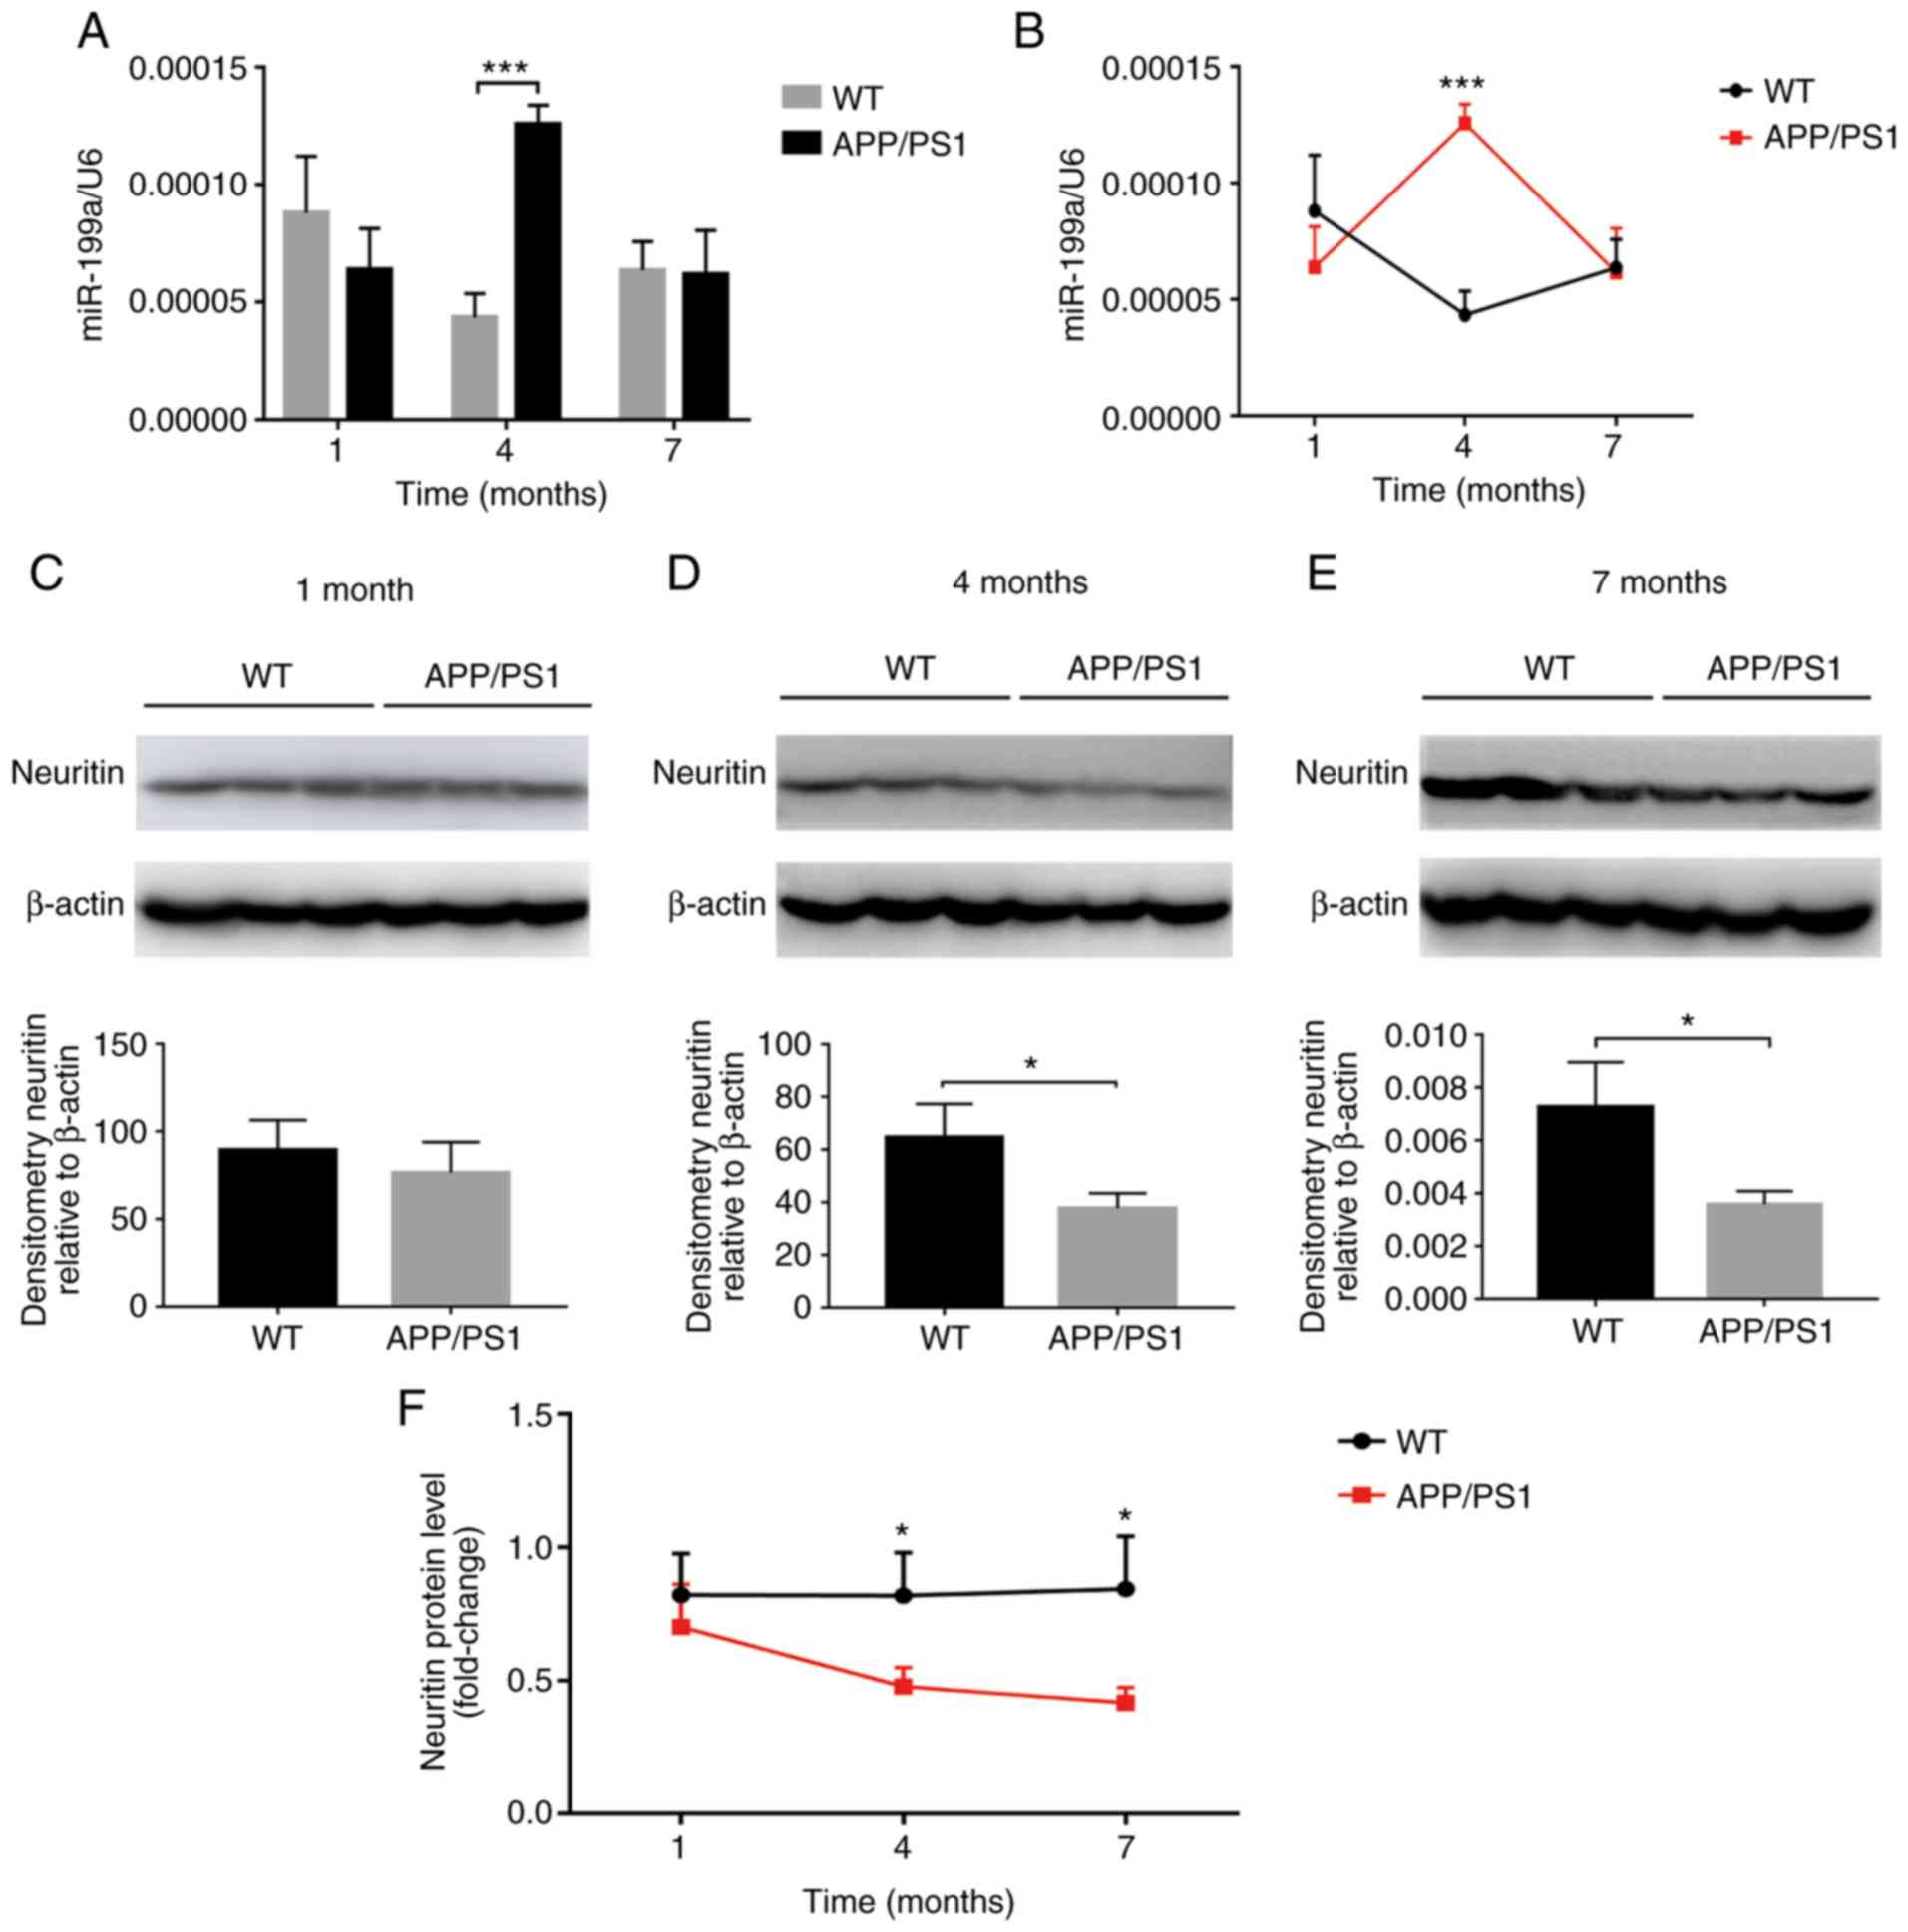
Detection of the candidate miRNAs in the
hippocampus and cortex of APP/PS1 mice
To confirm the association between the candidate
miRNAs and AD, the expression patterns of the candidate miRNAs in
hippocampal and cortical tissue from APP/PS1 (AD model) mice at 1,
4 and 7 months were examined. Compared with the WT mice, the levels
of the candidate miRNAs were altered to varying degrees in the
hippocampus of APP/PS1 mice (Table
IV), among which, miR-199a upregulation was more significant at
4 months (Fig. 3A). In addition,
the upregulated expression pattern of miR-199a remained slight
altered at 1 month, peaked at 4 months, and was attenuated at 7
months (Fig. 3B).
| Table IVDetection of candidate miRNAs in the
hippocampus and cortex of APP/PS1 mice. |
Table IV
Detection of candidate miRNAs in the
hippocampus and cortex of APP/PS1 mice.
| miRNA/U6
(×10-4) | Hippocampus
| Cortex
|
|---|
| 1 month | 4 months | 7 months | 1 month | 4 months | 7 months |
|---|
| miR-199a-5p | | | | | | |
| WT | 0.88±0.24 | 0.43±0.10 | 0.64±0.12 | 0.42±0.15 | 0.46±0.06 | 0.25±0.02 |
| APP/PS1 | 0.64±0.17 | 1.26±0.08a | 0.62±0.18 | 0.40±0.34 | 0.55±0.16 | 0.37±0.05a |
| miR-151-5p | | | | | | |
| WT | 25.07±2.90 | 26.38±3.82 | 30.81±4.26 | 21.96±7.51 | 21.30±3.37 | 15.75±2.03 |
| APP/PS1 | 23.07±1.58 | 32.23±4.67a | 30.44±3.25 | 20.75±2.79 | 20.66±2.02 | 15.48±1.62 |
| miR-342-3p | | | | | | |
| WT | 6.44±2.51 | 3.62±2.38 | 9.93±1.31 | 9.41±3.05 | 3.41±2.17 | 7.06±1.50 |
| APP/PS1 | 7.28±2.10 | 9.22±3.11 | 8.00±1.54 | 9.12±3.20 | 9.72±4.47 | 6.42±1.87 |
| miR-331-3p | | | | | | |
| WT | 17.36±2.81 | 16.76±1.59 | 17.47±2.84 | 11.35±1.33 | 12.24±1.57 | 83.29±1.48 |
| APP/PS1 | 17.40±2.43 | 17.29±2.28 | 17.11±2.01 | 14.51±1.15a | 10.78±1.46 | 91.85±2.97 |
| miR-423-5p | | | | | | |
| WT | 5.02±0.72 | 5.33±0.152 | 5.44±0.13 | 6.72±0.42 | 3.98±0.49 | 3.58±0.76 |
| APP/PS1 | 6.03±0.66a | 6.34±0.72 | 4.73±0.71 | 3.63±0.66 | 4.04±0.53 | 3.35±0.64 |
| miR-182-5p | | | | | | |
| WT | 0.01±0.00 | 0.03±0.01 | 0.02±0.01 | 0.01±0.00 | 0.11±0.04 | 0.02±0.01 |
| APP/PS1 | 0.01±0.00 | 0.05±0.01a | 0.04±0.01a | 0.01±0.01 | 0.05±0.03 | 1.89±0.01 |
| miR-188-5p | | | | | | |
| WT | 0.97±0.20 | 0.64±0.11 | 0.78±0.14 | 0.48±0.14 | 0.44±0.07 | 0.30±0.09 |
| APP/PS1 | 1.01±0.21 | 1.05±0.11a | 0.90±0.12 | 0.58±0.12 | 0.61±0.11a | 0.43±0.07a |
| miR-770-3p | | | | | | |
| WT | 3.89±2.97 | 3.11±0.47 | 2.90±0.99 | 3.68±1.85 | 2.45±0.64 | 4.57±3.05 |
| APP/PS1 | 3.88±1.73 | 2.43±0.55 | 2.72±0.57 | 2.29±1.04 | 1.94±0.46 | 1.64±0.45 |
| miR-194-5p | | | | | | |
| WT | 6.88±1.06 | 5.81±0.78 | 6.46±0.82 | 5.06±0.15 | 4.51±0.75 | 2.99±0.39 |
| APP/PS1 | 6.03±0.88 | 6.34±1.07 | 6.05±0.42 | 5.37±1.10 | 4.13±0.9.9 | 3.55±0.79 |
| miR-125a-5p | | | | | | |
| WT | 23.35±3.30 | 44.43±7.73 | 42.06±7.13 | 22.44±4.55 | 29.82±3.25 | 29.03±3.41 |
| APP/PS1 | 24.11±3.72 | 38.95±6.06 | 43.24±6.76 | 21.89±5.34 | 27.17±3.35 | 29.36±2.74 |
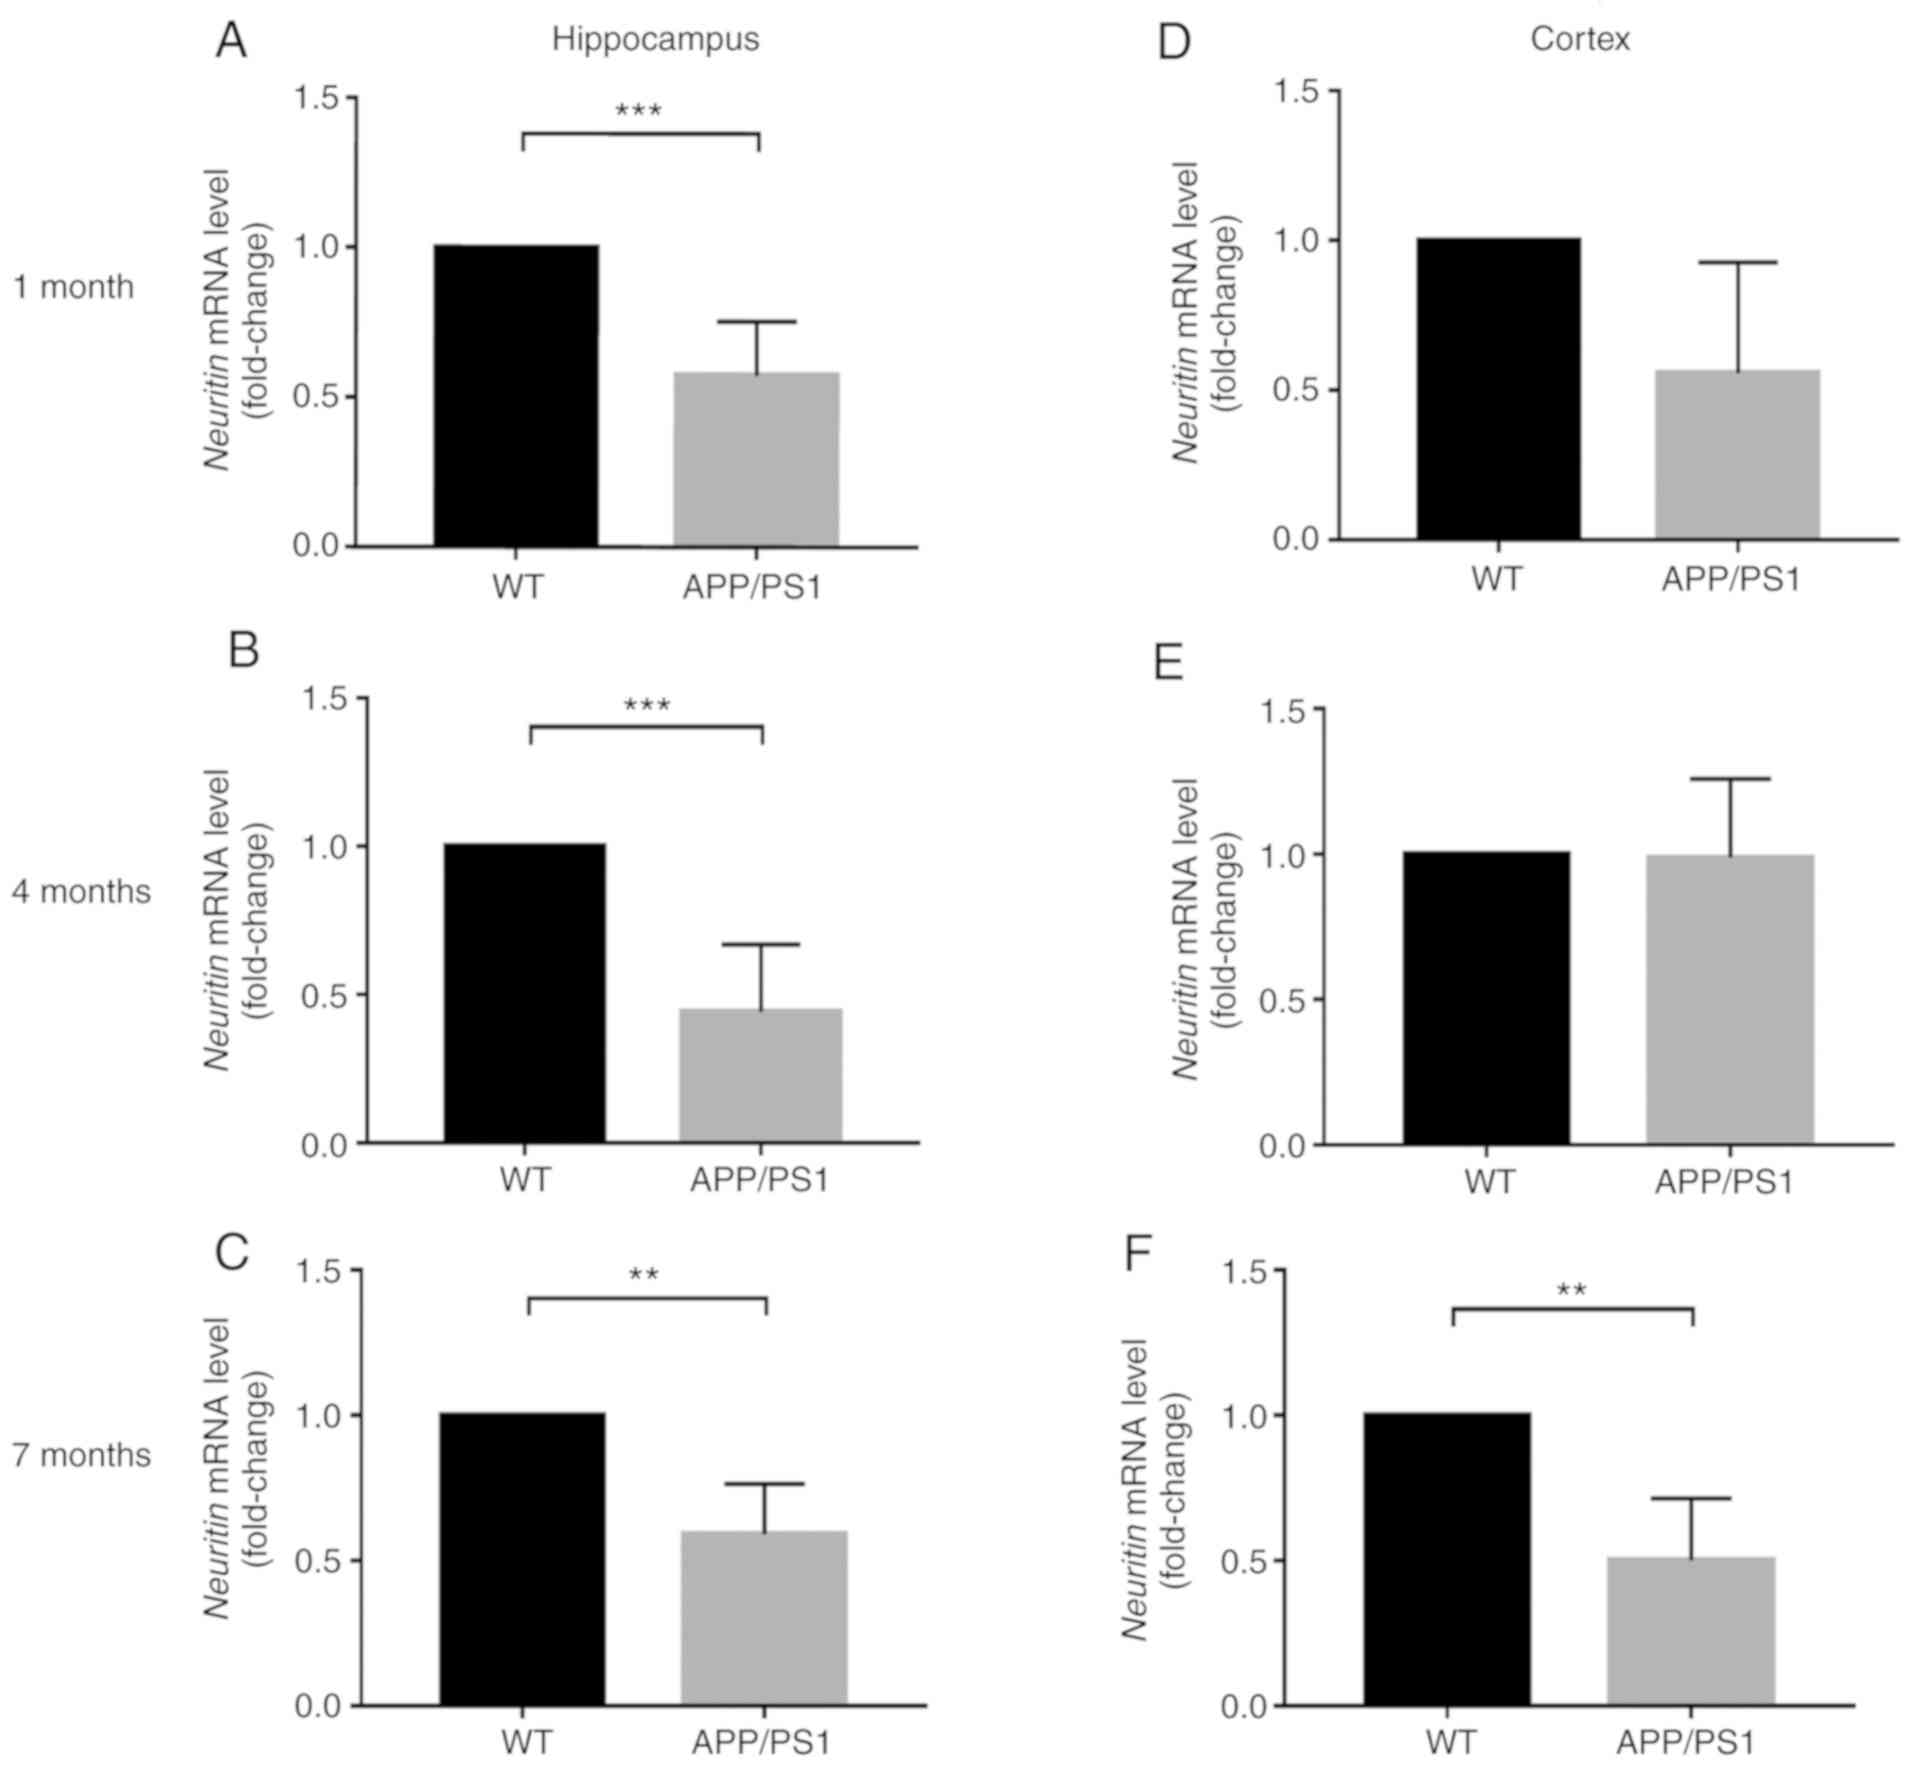
Neuritin expression in the hippocampus
and cortex of APP/PS1 mice
The neuritin mRNA levels were also measured in the
hippocampal and cortical tissues of APP/PS1 and WT mice at 1, 4 and
7 months. Compared with the WT mice, the neuritin mRNA levels in
the hippocampus of APP/PS1 mice were significantly decreased at 1,
4 and 7 months (Fig. 4).
Similarly, compared with WT mice, the Neuritin protein levels were
significantly lower in the APP/PS1 mice at 4 and 7 months (Fig. 3D and E). Although Neuritin
expression was not markedly altered at 1 month (Fig. 3C), it decreased significantly at 4
months, and exhibited a continued decline at 7 months (Fig. 3F).
miR-199a decreases Neuritin expression by
targeting the Neuritin 3′-UTR
To examine the effects of miR-199a on Neuritin
expression, miR-199a mimics were synthesized. The results revealed
that transfection with miR-199a mimics suppressed Neuritin mRNA
(Fig. 5A) and protein (Fig. 5B) expression. The site within Nrn1
that was targeted by miR199a was predicted using bioinformatics
software (Fig. 5C), and the
pLUC-Nrn1 vector that contained the miR-199a targeting sites from
the 3′-UTR of the Nrn1 transcript was constructed (Fig. 5D). It was observed that luciferase
activity was decreased in the WT luciferase reporter system
(pLUC-Nrn1); however, this decrease was reversed in the mutant
luciferase reporter system (pLUC-Nrn1-mut) following stimulation
with miRNA-199a mimic (Fig.
5E).
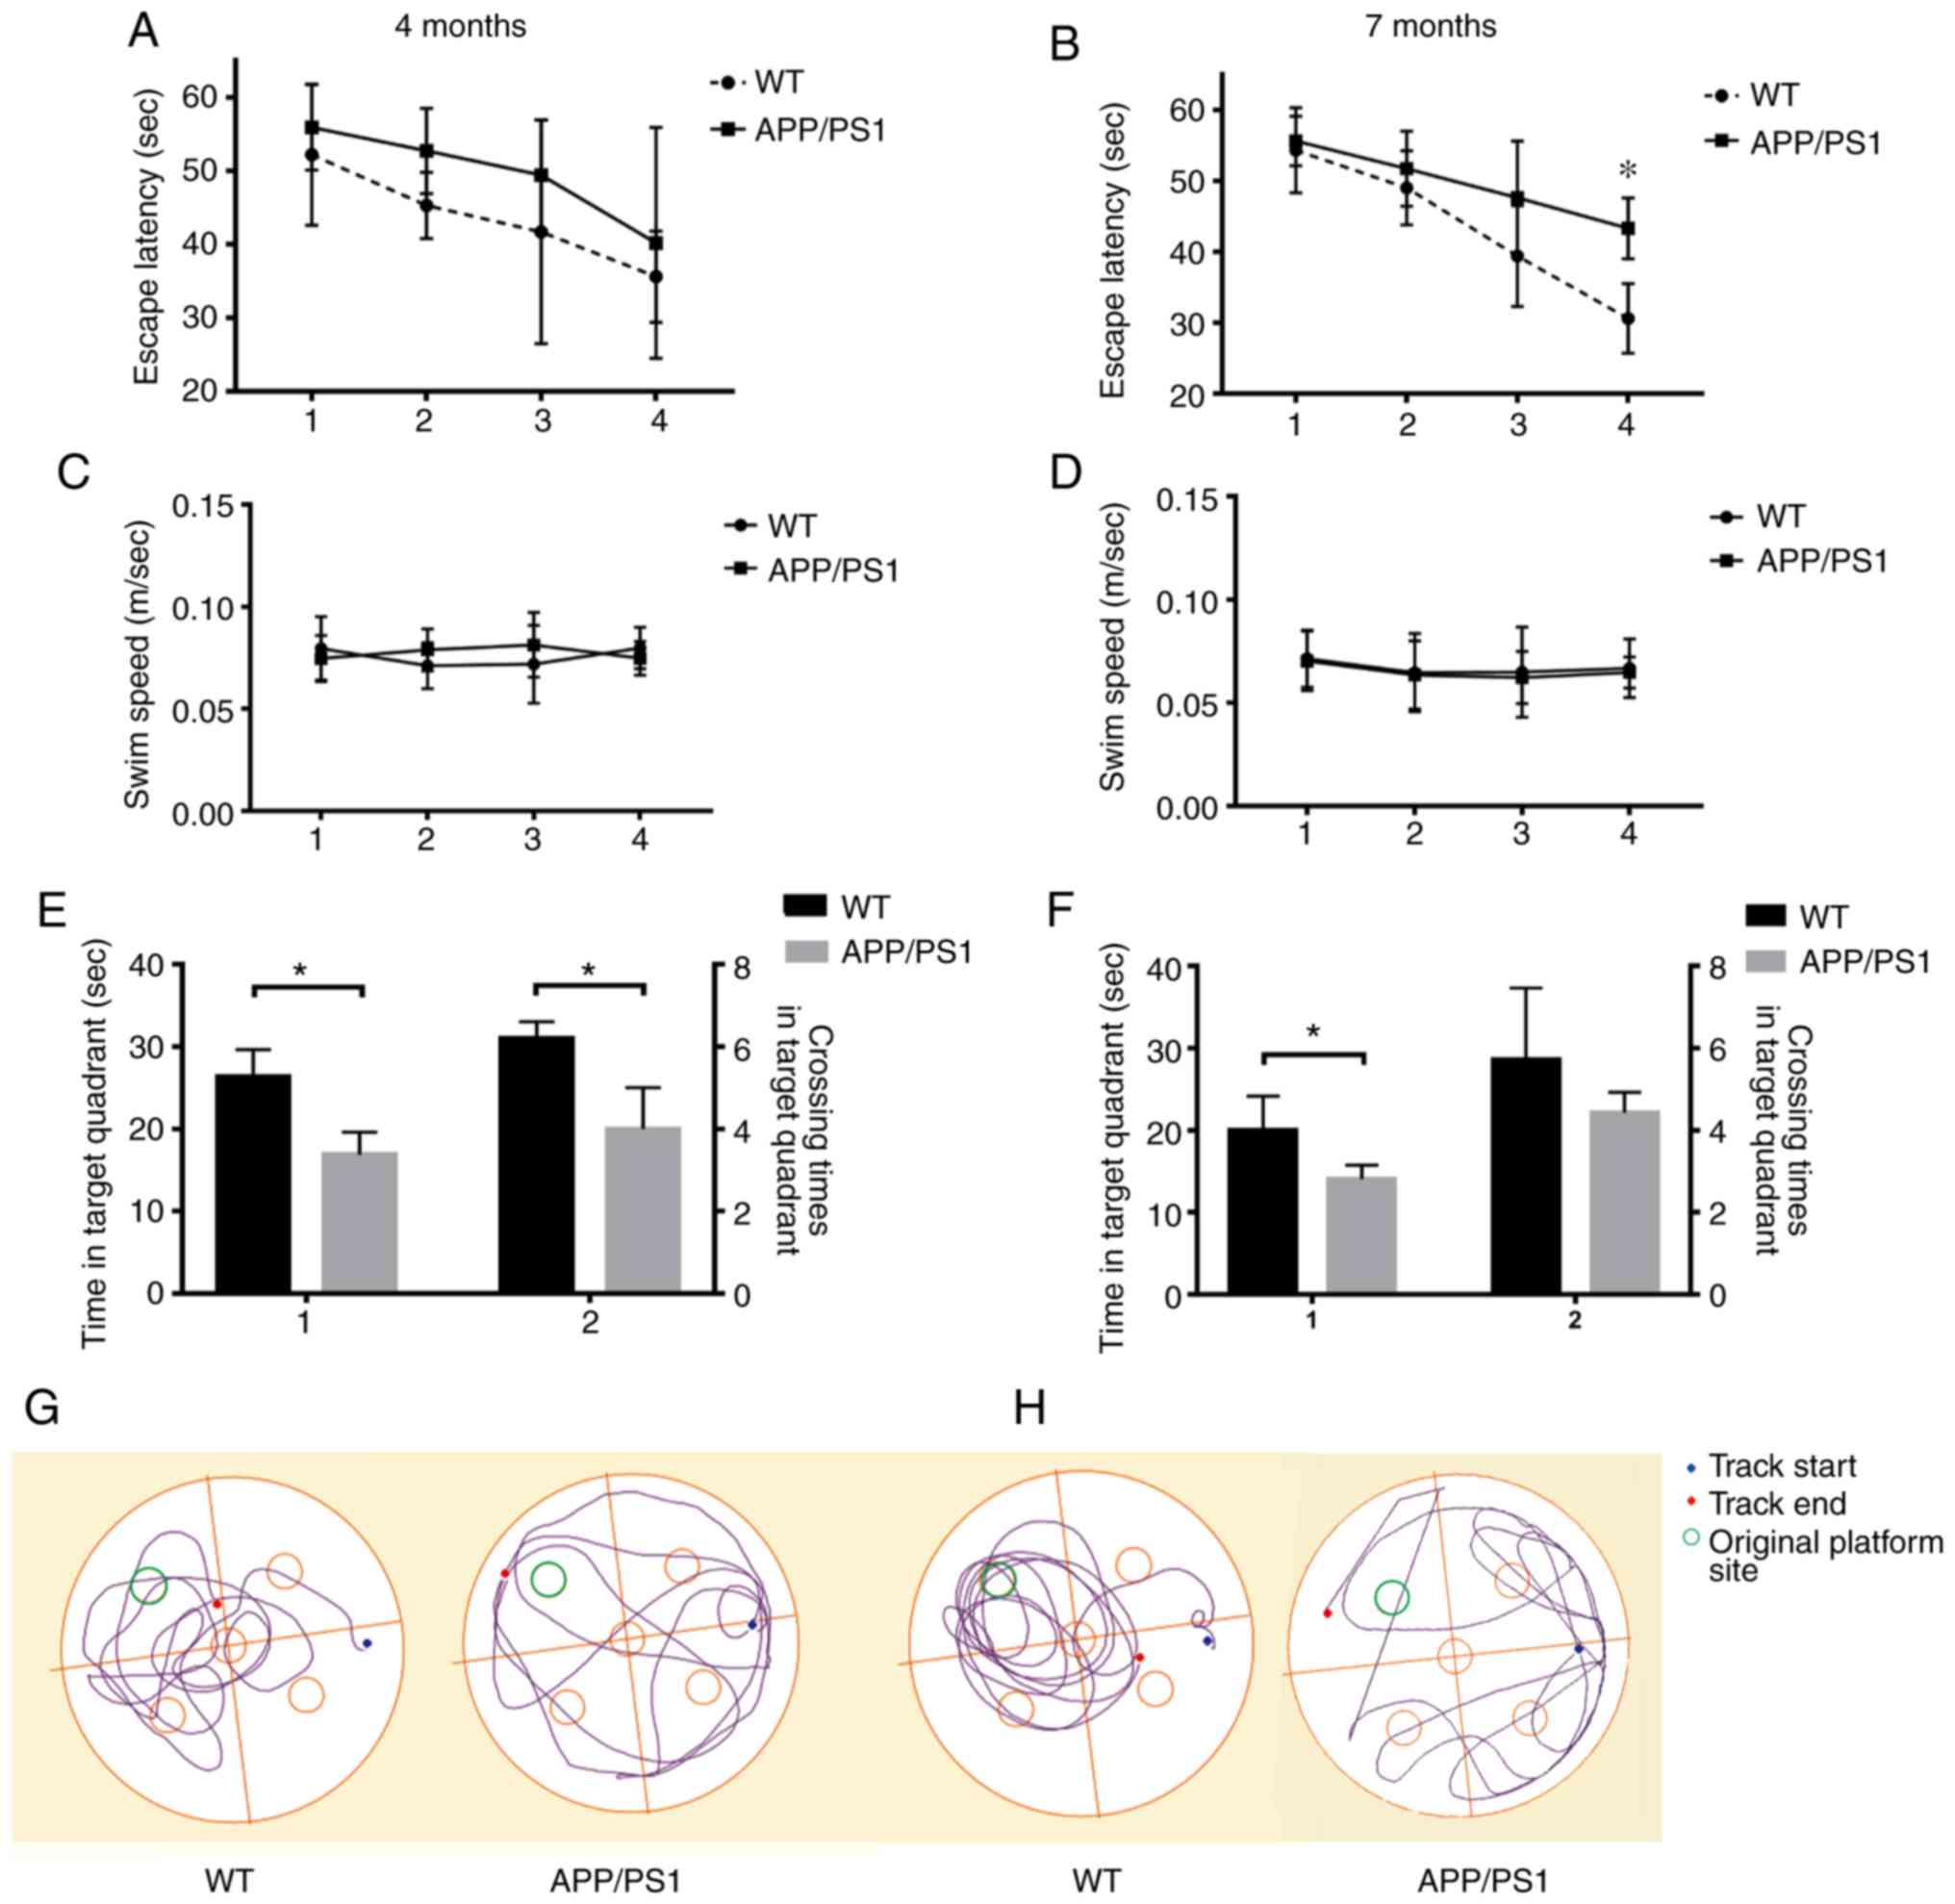
Evaluation of the spatial memory
capacities of APP/PS1 mice
The spatial memory of APP/PS1 mice was examined at 4
and 7 months using the Morris water maze test. The escape latency
(Fig. 6A and B), swim speed
(Fig. 6C and D), retention time
and crossing times in the target quadrant (Fig. 6E and F) were calculated. According
to the swimming speed of the mice, differences in the test
indicators that were caused by the different exercise abilities of
the mice were excluded. It was found that the spatial memory
capacity of the APP/PS1 mice began to decrease at 4 months compared
with the WT mice (Fig. 6E and G).
Moreover, the spatial memory capacities of the 7-month-old APP/PS1
mice were significantly decreased compared with those of the WT
mice (Fig. 6B, F and H).
Discussion
Neuritin is a neurotrophic factor that plays
multiple roles, including roles in neurite growth, synaptic
maturation and the maintenance of neuron survival, and also
mediates neural development and neuroplasticity (2-5,24-27). It has been found that Neuritin
expression is decreased in mice with AD, and that Neuritin
treatment can attenuate the synaptic deficits of AD mice (13,14). However, the mechanisms responsible
for the decreased expression of Neuritin in AD and whether miRNAs
regulate Neuritin in AD remain unclear. In the present study, it
was found that miR-199a decreased the Neuritin levels and was
involved in the development of AD.
In the present study, after clustering the
upregulated miRNAs in AD from the literature and datasets of AD
using bioinformatics analysis, 707 DEmiRNAs were recruited
(Table SI). Furthermore, the
upregulated miRNAs that can target the 3′-UTR of Neuritin were
predictively analyzed to screen out 36 miRNAs in AD that target
Neuritin (Fig. 2A). Based on
their binding scores (Table
III), 10 candidate miRNAs with higher AD/WT ratios were
selected for further analysis (Fig.
2B). Moreover, GO analysis on these 10 candidate miRNAs was
performed, which revealed that they were enriched in the nervous
system and were primarily distributed in the neuronal cell body,
presynaptic membrane and neuron projection and postsynaptic density
(Fig. 2C and D). Notably, the
distribution patterns in the nervous system of the candidate miRNAs
were consistent with those of Neuritin. Moreover, GO analysis
revealed that the candidate miRNAs mediated molecular functions,
such as neurotrophic protein TRKA receptor binding and tau kinase
activity (Fig. 2E), indicating
that the candidate miRNAs could be involved in the development of
AD.
To further confirm that these candidate miRNAs
target Neuritin from a bioinformatics perspective, the expression
of the candidate miRNAs in hippocampal and cortical tissues from
model mice with AD at different ages were detected. APP/PS1 mice
are often used as models of AD as they have the major
neuropathological features of AD, including neuronal plaques in the
hippocampus and cortex (28,29) and neurofibrillary tangles
(30,31). Compared with WT mice, the
candidate miRNAs exhibited varying degrees of altered expression in
the hippo-campus of APP/PS1 mice (Table IV). Among the altered miRNAs, the
changes in miR-199a expression were the most significant (Fig. 3A).
Neuritin expression was also detected in the
hippocampus of APP/PS1 mice at 1, 4 and 7 months of age. The
results revealed that Neuritin expression was significantly lower
in the APP/PS1 mice compared with the WT mice at 4 and 7 months of
age (Figs. 3C-E and 4A-C). Notably, the Neuritin expression
pattern was opposite to that of miRNA-199a at 4 months (the early
stages of AD). These results indicated that a high miR-199a
expression was negatively associated with Neuritin expression both
spatially and temporally in the hippocampus of APP/PS1 mice
(Fig. 3B and F); thus, both may
be involved in the development of AD.
To date, to the best of our knowledge there is no
literature available on the regulation of Neuritin by miR-199a in
AD; thus, it is unclear whether miR-199a can alter Neuritin
expression. In the present study, using miR-199a mimics, it was
found that miR-199a significantly decreased Neuritin levels
(Fig. 5A and B). To verify that
the decrease in Neuritin expression was due to direct miR-199a
binding, luciferase reporter vectors containing the WT Neuritin
3′-UTR and a mutated construct were constructed. The results
revealed that the decrease in luciferase activity was reversed
after mutating only 3 bases in the Neuritin 3′-UTR (Fig. 5E). This suggested that miR-199a
decreased the Neuritin levels by specifically binding to the Nrn1
3′-UTR.
Subsequently, the present study examined whether
miR-199a is involved in the development of AD by regulating
Neuritin expression. AD is a chronic degenerative nervous system
disease characterized by progressive cognitive and memory
impairments (32,33). Therefore, the spatial memory of
APP/PS1 mice was evaluated when miR-199a was altered. It was found
that the spatial memory ability began to decrease at 4 months and
was significantly decreased at 7 months in APP/PS1 mice (Fig. 6E and G). Of note, memory
impairment occurred at the age of 4 months, when the miR-199a
levels were at their highest. Memory loss was more pronounced at 7
months (Fig. 6B, F and H) when
Neuritin expression decreased, suggesting that miR-199a-5p is
involved in the development of AD by modulating Neuritin
expression.
In the present study, evidence regarding the
association between miR-199a and Neuritin in APP/PS1 mice was
obtained through the integration of bioinformatics and molecular
biology. It was found that miR-199a decreased the Neuritin levels
by binding the Nrn1 3′-UTR. Finally, it was found that miR-199a was
involved in the development of AD by regulating Neuritin
expression. The findings of the present study provide a new
perspective through which to better interpret the occurrence and
development of AD.
Supplementary Data
Funding
The present study was supported by the Natural
Science Foundation of China (grant no. 81771173 to JH) and the
Zhejiang Provincial Natural Science Foundation of China (grant no.
LY18H260002 to YH).
Availability of data and materials
The data used and/or analyzed during the present
study are available from the corresponding author on reasonable
request.
Authors' contributions
JH, JZ and LY contributed to the conception or
design of the study. DS contributed to the acquisition, analysis,
or interpretation of all cell-level data. GL contributed to the
acquisition, analysis, or interpretation of the AD mouse data. YH
contributed to the acquisition, analysis and interpretation of the
bioinformatics data. PZ contributed to the construction of the
vectors. DS and JH contributed to the drafting of the the article
and revising it critically for all content. All authors contributed
to revising the work critically for important intellectual
content.
Ethics approval and consent to
participate
All experimental procedures were approved by the
Animal Ethics Committee of Hangzhou Normal University.
Patient consent for publication
Not applicable.
Competing interests
The authors declare that they have no competing
interests.
Acknowledgments
The authors would like to thank the Animal Center of
Hangzhou Normal University for breeding the mice. Dr Yanmei Tao
(Institute of Life Sciences, College of Life and Environmental
Sciences, Hangzhou Normal University, Hangzhou, China) kindly
provided the Morris water maze test.
References
|
1
|
Nedivi E, Hevroni D, Naot D, Israeli D and
Citri Y: Numerous candidate plasticity-related genes revealed by
differential cDNA cloning. Nature. 363:718–722. 1993. View Article : Google Scholar : PubMed/NCBI
|
|
2
|
Nedivi E, Wu GY and Cline HT: Promotion of
dendritic growth by CPG15, an activity-induced signaling molecule.
Science. 281:1863–1866. 1998. View Article : Google Scholar : PubMed/NCBI
|
|
3
|
Naeve GS, Ramakrishnan M, Kramer R,
Hevroni D, Citri Y and Theill LE: Neuritin: A gene induced by
neural activity and neurotrophins that promotes neuritogenesis.
Proc Natl Acad Sci USA. 94:2648–2653. 1997. View Article : Google Scholar : PubMed/NCBI
|
|
4
|
Cantallops I, Haas K and Cline HT:
Postsynaptic CPG15 promotes synaptic maturation and presynaptic
axon arbor elaboration in vivo. Nat Neurosci. 3:1004–1011. 2000.
View Article : Google Scholar : PubMed/NCBI
|
|
5
|
Javaherian A and Cline HT: Coordinated
motor neuron axon growth and neuromuscular synaptogenesis are
promoted by CPG15 in vivo. Neuron. 45:505–512. 2005. View Article : Google Scholar : PubMed/NCBI
|
|
6
|
Karamoysoyli E, Burnand RC, Tomlinson DR
and Gardiner NJ: Neuritin mediates nerve growth factor-induced
axonal regeneration and is deficient in experimental diabetic
neuropathy. Diabetes. 57:181–189. 2008. View Article : Google Scholar
|
|
7
|
Fargo KN, Alexander TD, Tanzer L, Poletti
A and Jones KJ: Androgen regulates neuritin mRNA levels in an in
vivo model of steroid-enhanced peripheral nerve regeneration. J
Neurotrauma. 25:561–566. 2008. View Article : Google Scholar : PubMed/NCBI
|
|
8
|
Zhao QR, Lu JM, Yao JJ, Zhang ZY, Ling C
and Mei YA: Neuritin reverses deficits in murine novel object
associative recognition memory caused by exposure to extremely
low-frequency (50 Hz) electromagnetic fields. Sci Rep. 5:117682015.
View Article : Google Scholar : PubMed/NCBI
|
|
9
|
Zhang Y, Zhang S, Xian L, Tang J, Zhu J,
Cui L, Li S, Yang L and Huang J: Expression and purification of
recombinant human neuritin from Pichia pastoris and a partial
analysis of its neurobiological activity in vitro. Appl Microbiol
Biotechnol. 99:8035–8043. 2015. View Article : Google Scholar : PubMed/NCBI
|
|
10
|
Gao R, Li X, Xi S, Wang H, Zhang H, Zhu J,
Shan L, Song X, Luo X, Yang L and Huang J: Exogenous Neuritin
promotes nerve regeneration after acute spinal cord injury in rats.
Hum Gene Ther. 27:544–554. 2016. View Article : Google Scholar : PubMed/NCBI
|
|
11
|
Wang H, Li X, Shan L, Zhu J, Chen R, Li Y,
Yuan W, Yang L and Huang J: Recombinant hNeuritin promotes
structural and functional recovery of sciatic nerve injury in rats.
Front Neurosci. 10:5892016. View Article : Google Scholar
|
|
12
|
Scheltens P, Blennow K, Breteler MM, de
Strooper B, Frisoni GB, Salloway S and Van der Flier WM:
Alzheimer's disease. Lancet. 388:505–517. 2016. View Article : Google Scholar : PubMed/NCBI
|
|
13
|
Choi Y, Lee K, Ryu J, Kim HG, Jeong AY,
Woo RS, Lee JH, Hyun JW, Hahn S, Kim JH and Kim HS: Neuritin
attenuates cognitive function impairments in tg2576 mouse model of
Alzheimer's disease. PLoS One. 9:e1041212014. View Article : Google Scholar : PubMed/NCBI
|
|
14
|
An K, Jung JH, Jeong AY, Kim HG, Jung SY,
Lee K, Kim HJ, Kim SJ, Jeong TY, Son Y, et al: Neuritin can
normalize neural deficits of Alzheimer's disease. Cell Death Dis.
5:e15232014. View Article : Google Scholar : PubMed/NCBI
|
|
15
|
Lewis BP, Burge CB and Bartel DP:
Conserved seed pairing, often flanked by adenosines, indicates that
thousands of human genes are microRNA targets. Cell. 120:15–20.
2005. View Article : Google Scholar : PubMed/NCBI
|
|
16
|
Filipowicz W, Bhattacharyya SN and
Sonenberg N: Mechanisms of post-transcriptional regulation by
microRNAs: Are the answers in sight? Nat Rev Genet. 9:102–114.
2008. View
Article : Google Scholar : PubMed/NCBI
|
|
17
|
Chang TC and Mendell JT: MicroRNAs in
vertebrate physiology and human disease. Annu Rev Genomics Hum
Genet. 8:215–239. 2007. View Article : Google Scholar : PubMed/NCBI
|
|
18
|
Li F, Wei G, Bai Y, Li Y, Huang F, Lin J,
Hou Q, Deng R, Zhou JH, Zhang SX and Chen DF: MicroRNA-574 is
involved in cognitive impairment in 5-month-old APP/PS1 mice
through regulation of neuritin. Brain Res. 1627:177–188. 2015.
View Article : Google Scholar : PubMed/NCBI
|
|
19
|
Gao R, Wang L, Sun J, Nie K, Jian H, Gao
L, Liao X, Zhang H, Huang J and Gan S: MiR-204 promotes apoptosis
in oxidative stress-induced rat Schwann cells by suppressing
neuritin expression. FEBS Lett. 588:3225–3232. 2014. View Article : Google Scholar : PubMed/NCBI
|
|
20
|
Shen NN, Zhang ZL, Li Z, Zhang C, Li H,
Wang JL, Wang J and Gu ZC: Identification of microRNA biomarkers in
atrial fibrillation: A protocol for systematic review and
bioinformatics analysis. Medicine (Baltimore). 98:e165382019.
View Article : Google Scholar
|
|
21
|
Lee ST, Chu K, Jung KH, Kim JH, Huh JY,
Yoon H, Park DK, Lim JY, Kim JM, Jeon D, et al: MiR-206 regulates
brain-derived neurotrophic factor in Alzheimer disease model. Ann
Neurol. 72:269–277. 2012. View Article : Google Scholar : PubMed/NCBI
|
|
22
|
Livak KJ and Schmittgen TD: Analysis of
relative gene expression data using real-time quantitative PCR and
the 2(-Delta Delta C(T)) method. Methods. 25:402–408. 2001.
View Article : Google Scholar
|
|
23
|
Morris R: Developments of a water-maze
procedure for studying spatial learning in the rat. J Neurosci
Methods. 11:47–60. 1984. View Article : Google Scholar : PubMed/NCBI
|
|
24
|
Putz U, Harwell C and Nedivi E: Soluble
CPG15 expressed during early development rescues cortical
progenitors from apoptosis. Nat Neurosci. 8:322–331. 2005.
View Article : Google Scholar : PubMed/NCBI
|
|
25
|
Fujino T, Leslie JH, Eavri R, Chen JL, Lin
WC, Flanders GH, Borok E, Horvath TL and Nedivi E: CPG15 regulates
synapse stability in the developing and adult brain. Genes Dev.
25:2674–2685. 2011. View Article : Google Scholar : PubMed/NCBI
|
|
26
|
Corriveau RA, Shatz CJ and Nedivi E:
Dynamic regulation of cpg15 during activity-dependent synaptic
development in the mammalian visual system. J Neurosci.
19:7999–8008. 1999. View Article : Google Scholar : PubMed/NCBI
|
|
27
|
Fujino T, Wu Z, Lin WC, Phillips MA and
Nedivi E: cpg15 and cpg15-2 constitute a family of
activity-regulated ligands expressed differentially in the nervous
system to promote neurite growth and neuronal survival. J Comp
Neurol. 507:1831–1845. 2008. View Article : Google Scholar : PubMed/NCBI
|
|
28
|
Hansra GK, Popov G, Banaczek PO, Vogiatzis
M, Jegathees T, Goldbury CS and Cullen KM: The neuritic plaque in
Alzheimer's disease: Perivascular degeneration of neuronal
processes. Neurobiol Aging. 82:88–101. 2019. View Article : Google Scholar : PubMed/NCBI
|
|
29
|
Gouras GK, Olsson TT and Hansson O:
β-Amyloid peptides and amyloid plaques in Alzheimer's disease.
Neurotherapeutics. 12:3–11. 2015. View Article : Google Scholar
|
|
30
|
Theofilas P, Ehrenberg AJ, Nguy A,
Thackrey JM, Dunlop S, Mejia MB, Alho AT, Paraizo Leite RE,
Rodriguez RD, Suemoto CK, et al: Probing the correlation of
neuronal loss, neurofibrillary tangles, and cell death markers
across the Alzheimer's disease Braak stages: A quantitative study
in humans. Neurobiol Aging. 61:1–12. 2018. View Article : Google Scholar
|
|
31
|
Lacosta AM, Insua D, Badi H, Pesini P and
Sarasa M: Neurofibrillary tangles of Aβx-40 in Alzheimer's disease
brains. J Alzheimers Dis. 58:661–667. 2017. View Article : Google Scholar
|
|
32
|
Fainstein N, Dan-Goor N and Ben-Hur T:
Resident brain neural precursor cells develop age-dependent loss of
therapeutic functions in Alzheimer's mice. Neurobiol Aging.
72:40–52. 2018. View Article : Google Scholar : PubMed/NCBI
|
|
33
|
Friedman E, Lerer B and Kuster J: Loss of
cholinergic neurons in the rat neocortex produces deficits in
passive avoidance learning. Pharmacol Biochem Behav. 19:309–312.
1983. View Article : Google Scholar : PubMed/NCBI
|
|
34
|
Lau P, Bossers K, Janky R, Salta E,
Frigerio CS, Barbash S, Rothman R, Sierksma AS, Thathiah A,
Greenberg D, et al: Alteration of the microRNA network during the
progression of Alzheimer's disease. EMBO Mol Med. 5:1613–1634.
2013. View Article : Google Scholar : PubMed/NCBI
|
|
35
|
Leidinger P, Backes C, Deutscher S,
Schmitt K, Mueller SC, Frese K, Haas J, Ruprecht K, Paul F, Stähler
C, et al: A blood based 12-miRNA signature of Alzheimer disease
patients. Genome Biol. 14:R782013. View Article : Google Scholar : PubMed/NCBI
|
|
36
|
Hébert SS, Wang WX, Zhu Q and Nelson PT: A
study of small RNAs from cerebral neocortex of pathology-verified
Alzheimer's disease, dementia with lewy bodies, hippocampal
sclerosis, frontotemporal lobar dementia, and non-demented human
controls. J Alzheimers Dis. 35:335–348. 2013. View Article : Google Scholar : PubMed/NCBI
|
|
37
|
Nunez-Iglesias J, Liu CC, Morgan TE, Finch
CE and Zhou XJ: Joint genome-wide profiling of miRNA and mRNA
expression in Alzheimer's disease cortex reveals altered miRNA
regulation. PLoS One. 5:e88982010. View Article : Google Scholar : PubMed/NCBI
|