Introduction
Oleanolic acid (OA), a triterpenoid, is found in a
variety of foods and herbs (1).
OA has been reported to exhibit a myriad of biological activities:
It may function as an antioxidant, an anti-inflammatory (2,3),
an antimicrobial (4),
hepatoprotective (5) and
chemopreventive (6) agent, and it
also possesses immunomodulatory (7), antiarrhythmic and cardiotonic
(8) activities. A number of
studies have shown that OA has a blood pressure-lowering effect
(9,10). Bachhav et al (11) reported that OA prevents
hypertension via antioxidant and nitric oxide (NO)-releasing
actions. Oral administration of OA for 9 weeks has shown
antihypertensive effects in spontaneously hypertensive rats (SHRs)
(12) and Dahl salt-sensitive
rats (12,13), leading to a decrease in the mean
arterial blood pressure, increased urinary Na+ output, a
reduction in malondialdehyde, a marker of lipid peroxidation, and
increased superoxide dismutase and glutathione peroxidase activity
in the liver, heart and kidney (12). Oral administration of OA has also
exhibited antihypertensive effects during pressure overload-induced
cardiac remodeling in mice (14),
and in renovascular hypertensive rats (15) and an insulin-resistant rat model
of hypertension (13). Madlala
et al (16) reported that
OA resulted in the relaxation of aortic rings and mesenteric
arteries that were pre-contracted with phenylephrine or a
KCl-enriched solution. It was observed that endothelium denudation
and indomethacin partially inhibited the relaxation, whereas a NO
synthase inhibitor, N-ω-nitro-L-arginine, did not result in any
inhibitory effects. It was suggested that the activity of OA may be
mediated via endothelium-dependent and -independent mechanisms
(16).
Spontaneous hypertension is one of the most common
systemic metabolic diseases, and its causes include genetic,
environmental and behavioral factors (17,18). Research attention has focused on
investigating the role of lipids in hyper-tension (19). In a previous study, the levels of
lipid metabolites were observed to be elevated, whereas sphinganine
levels were lower, in SHRs compared with Wistar Kyoto (WKY) rats
(20). Additionally, in another
previous study, it was found that the sphingomyelin (SM)
(d18:0/14:0) level was increased in SHRs compared with in WKY rats;
the increased SM content was reported to reduce endothelial
membrane fluidity (21). Studies
have also demonstrated the involvement of sphingolipids in the
regulation of vascular tone (22,23). It was shown that sphingo-lipids
regulate NO and endothelium-derived hyperpolarizing factor
(EDHF)-mediated relaxation responses in various types of blood
vessels (24). Graessler et
al (25) found that, compared
with healthy individuals, the levels of phosphatidylcholine (PC)
and phosphatidylethanolamine (PE) lipid species, including PC
(O-36:4), PC (O-38:4), PE (O-38:5), PE (O-38:6) and PE (O-40:5),
were lower in patients with hypertension. Liu et al
(26) reported reduced levels of
PC (16:1/14:1) in SHRs compared with WKY rats, whereas higher
levels of lysoPC (22:5), ceramide (Cer) and dihydroceramide were
observed in the SHRs compared with the WKY rats.
Hu et al (27) reported that PC and triglycerides
(TGs) possess important roles in blood lipid metabolism. As an
important proinflammatory mediator, phospholipase A2
(PLA2) functions to hydrolyse PCs into lysoPCs (28). LysoPC exerts influence on numerous
processes in various cell types, and may have an important role in
inflammatory diseases (29).
Inflammation itself is also hypothesized to initiate and maintain
hypertensive episodes (30). As
the accumulation of diglycerides (DGs) triggers activation of
protein kinases C, it ultimately contributes to insulin resistance
(31,32). DGs regulate hypertension via
mechanisms such as increased renal sodium reabsorption, sympathetic
nervous system activation, transmembrane ion transport alteration
and hypertrophy of vascular smooth muscle (33). Additionally, associations of TGs
with both systolic blood pressure (SBP) and diastolic blood
pressure (DBP) have been reported in a community-dwelling sample of
Japanese adults (34). Due to the
bidirectional association that has been identified between
hypertension and endothelial dysfunction (35), an increase in TG levels may result
in hypertension. For patients with hyper-tension, Hu et al
(27) reported a positive
association between the degree of hypertension and levels of TGs.
In their study, the authors commented on the relatively higher
levels of TGs in the livers of patients with hypertension compared
with those of healthy individuals.
Numerous studies have suggested that lipid-lowering
strategies, and particularly statins, could influence blood
pressure control (36,37). The use of lipid-lowering measures
can significantly improve blood pressure control in subjects with
both hypercholesterolemia and hypertension; the amelioration of
elevated blood pressure appears to be enhanced in subjects treated
with statins (36). Valsartan
displays remarkable anti-inflammatory efficacy in patients with
hypertension that possess an elevated inflammatory burden; total
cholesterol (CHOL) and low-density lipoprotein cholesterol (LDL-C)
levels were significantly reduced following valsartan therapy
(37). Both statins and fibrates
have been shown to reduce blood pressure in clinical trials and
exhibit protective effects on arterial wall structure (38,39). These effects on blood pressure may
account for some of the clinical effects of lipid-lowering drugs on
cardiovascular risk (40). Thus,
lipid-lowering measures may provide an additional method to treat
patients with hypertension.
The main organ involved in lipid metabolism is the
liver (29). An excessive
accumulation of TGs, free fatty acids (FFAs), CHOL, PC, PE, Cer and
SM is the main cause underlying lipid metabolic disorders (41-43). These components are primarily
produced and stored in liver cells (44,45). One of the main characteristics of
hypertension is dysregulation of lipid metabolism (25,46). Previous studies have shown that
sphingolipids (24) and
phospholipids (47) exert
significant effects on hypertension, among which Cer, the precursor
of sphingosine-1-phosphate, was found to induce antiproliferative
and proapoptotic effects (48).
Additionally, sphingolipids have been shown to be involved in
processes associated with vascular tone regulation, including the
regulation of NO and EDHF responses in various types of blood
vessels (48-50).
LysoPC is produced via hydrolysis of membrane PC by
PLA2 (51). PCs have
been reported to be the most abundant phospholipids in LDL
particles (52). The most
important families under the category of PLA2s are
secreted (s)PLA2s and cytosolic PLA2s
(53). sPLA2 is
reported to promote vascular inflammation, leading to coronary
artery disease (54). Increased
sPLA2 levels were reported to be associated with
coronary artery diseases (55).
Additionally, the hydrolysis of PC by sPLA2 results in
the formation of lysoPC, and lysoPC has been reported to exert
proatherogenic and proinflammatory effects on arterial wall cells,
including the upregulation of adhesive molecules, monocyte
chemoattractant protein-1 and growth factors, cell proliferation,
cell migration, apoptosis, activation of protein kinase C and
inhibition of endothelium-dependent relaxation (56,57). It is an intracellular messenger
and is found as a major phospholipid component in chemically
modified LDL (58). LysoPC is
present in oxidized LDLs that are significantly associated with
inflammation and cardiovascular diseases (59), and performs crucial roles in a
myriad of biological activities. For example, in endothelial cells,
lysoPC has been shown to stimulate the transcription of adhesion
molecules and growth factors (60). In fatty liver, fatty acid synthase
(FAS) is associated with the accumulation of TGs (61). Elevated hepatic FAS activity and
fatty liver are observed in ob/ob mice (62), although a mechanistic link between
the two findings has yet to be established. Subjects who are
overweight and have metabolic syndrome exhibiting obesity,
inflammation and hypertension are found to have altered levels of
FAS activity/expression, which highlights the association between
FAS, and hypertension pathogenesis and metabolic dysfunction
(63,64). In addition, decreased levels of
FAS mRNA were identified in the adipose tissue of hypertensive
individuals (65). Both FAS and
PLA2 are also independent risk factors for hypertension
and metabolic dysfunction (66,67).
Lipidomics is an important branch of metabolomics,
and its primary aim is to characterize lipids, as well as lipid
metabolic pathways and networks associated with biological systems
(68). The advances that have
been achieved in mass spectrometry (MS) as a technique has rendered
the analysis of lipidomics more accurate and efficient. Lipidomics
has been developed as an efficient analytical method to be applied
in biomedical sciences (69). The
molecules of a given sample are ionized and the first spectrometer
(designated MS) separates these ions by their mass-to-charge ratio
(m/z) (70). Ions of a particular
m/z in MS are selected for further MS to split them into smaller
fragments (MS/MS) (71). Analysis
of MS/MS fragments can improve the accuracy of small molecule
identification (70).
As glycerophospholipids, sphingolipids and
glycerides have been shown to be involved in blood pressure
regulation, it was hypothesized that changes in the content of
glycerophospholipids, sphingolipids and glycerides in the livers of
SHRs may result in altered blood pressure. OA may regulate blood
pressure by regulating glycerophospholipids, sphingolipids and
glycerides in the livers of SHRs, and the inhibition of FAS and
PLA2 by OA may result in regulation of cholesterol
levels in the liver and serum lipid metabolism in SHRs. The present
study aimed to test these hypotheses.
Materials and methods
Chemicals and reagents
Lipid internal standard [(PE) (17:1/12:0)] and other
lipid standards [PC (17:0/14:1), lysoPC (18:0), Cer (18:1/18:0),
phosphatidylglycerol (PG) (17:0/20:4) and SM (18:1/12:0)] were
purchased from Avanti Polar Lipids, Inc. The chemicals (ammonium
formate, methanol, dichloromethane, isopropanol and acetonitrile)
were of high-performance liquid chromatography (HPLC)-MS grade and
obtained from Thermo Fisher Scientific, Inc. OA (purity >98%),
and DNase/RNase-free water were purchased from Beijing Solarbio
Science & Technology Co., Ltd. SYBR Premix Ex Taq™ II (Tli
RNaseH Plus), PrimeScript™ RT reagent kit with gDNA Eraser (Perfect
Real Time) and TRIzol® Total RNA Extraction kit were
purchased from Takara Bio, Inc.
Animal experiment and study design
Animal handling was performed according to the Guide
for the Care and Use of Laboratory Animals published by the
National Institutes of Health (72) and the experimental protocol was
approved by the Animal Care and Ethics Committee of Shandong
University of Traditional Chinese Medicine (approval no.
SDUTCM2018120301). A total of 20 male SHRs and 10 male WKY rats
(age, 4 weeks; weight, 200-220 g) were purchased from Beijing Vital
River Laboratory Animal Technology Co., Ltd. The SHRs were randomly
and equally divided into two groups (n=10/group): The disease
control group (SH group) and the OA treatment group (OA group). The
WKY rats served as the normal control group (NC group). The animals
were housed in an air-conditioned room (25°C, 55% humidity and a
12:12-h light/dark cycle). The animals were provided certified
standard diet and tap water ad libitum. OA was suspended in
normal saline to prepare the required concentrations for oral
administration. Following a protocol in a previous study (10), the OA group received 1.08 mg/kg OA
daily for 4 weeks. All animals received ≤2 ml of the suspension.
The NC and SH group received 2 ml normal saline. The blood pressure
of each rat was monitored every 7th day using a non-invasive blood
pressure analysis system (Softron BP-98A; Beijing Softron
Biotechnology Co., Ltd.).
At 12 h after the last treatment, the rats were
anesthetized with sodium pentobarbital (40 mg/kg, intraperitoneal)
(73) and blood samples were
collected into normal vacuum tubes via cardiac puncture. The serum
was collected by centrifuging the blood at 2,300 × g at 4°C for 10
min (74). The liver tissues were
also excised under anesthetic conditions, and the serum and liver
tissues were stored at -80°C prior to further experimentation.
Measurement of biochemical
parameters
Serum CHOL, LDL-C, high density lipoprotein
cholesterol (HDL-C) and TGs were analyzed using an automatic blood
chemistry analyzer (BS-400; Mindray Medical International
Ltd.).
Lipidomics analysis
Preparation of lipid standards
Lipid internal standard, PE (17:1/12:0), was used
for adjustment of possible inter- and intra-assay variances
(internal standardization). The lipid standards [PC (17:0-14:1),
lysoPC (18:0), Cer (18:1/18:0) and SM (18:1/12:0)] were used for
lipid family assignment (external standardization). Stock solutions
of internal standard and lipid standards were prepared by
dissolving accurately weighed amounts in 1 ml isopropanol:methanol
(2:1 v/v).
Sample preparation and lipid
extraction
Lipids were extracted from the liver samples using a
modified version of the Folch method (75). Lipids from liver samples were
extracted as previously described (21); specific details are presented in
Data S1.
Ultra-performance (UP) LC-electrospray
ionization (ESI)-MS/MS analysis
The lipid extracts were subjected to MS/MS using a
UPLC system (UltiMate 3000; Thermo Fisher Scientific, Inc.) coupled
to an ESI-quadrupole/Orbitrap mass spectrometer (Q Exactive™;
Thermo Fisher Scientific, Inc.) in both positive and negative
ionization modes. The HPLC analysis conditions and the MS
parameters were optimized in our previous study (Data S1) (20).
Data processing and biomarker
identification
The data were processed as described previously
(20,21). The multivariate statistical
analysis package SimcaP 14.1 (Umetrics AB; Sartorius Stedim Biotech
AS) was used for principal component analysis (PCA) and partial
least squares discriminant analysis (PLS-DA) (20). Various metabolites were identified
from the PCA and PLS-DA loading plots. Differential expression of
lipid biomarkers among the NC, SH and OA groups was identified on
the basis of variable importance in projection (VIP) values
(calculated using SimcaP 14.1 software), and this analysis was
followed by performing one-way ANOVA to determine statistical
significance, as well as the calculation of fold change (FC) in
biomarker expression using Mass Profiler Professional software
(v12.6.1; Agilent Technologies, Inc.). Lipid biomarkers with VIP
>1, P<0.01 and FC >2 were considered to be differentially
regulated in the SH group compared with the NC group.
The metabolites were identified based on molecular
ion peaks [(M+H)+ or (M-H)−] and MS/MS ions,
in addition to comparing the retention times with the metabolites
in the human metabolome database (HMDB; http://www.hmdb.ca), LIPID MAPS Lipidomics Gateway
(http://www.lipidmaps.org), METLIN (https://metlin.scripps.edu) and Kyoto Encyclopedia of
Genes and Genomes (KEGG; http://www.genome.jp/kegg) databases. The pathway
analysis was performed using MetaboAnalyst 4.0 software (http://www.metaboanalyst.ca). Library searches were
performed using a maximum mass deviation of 5 ppm. In addition to
comparing the mass fragment patterns with those reported in these
databases (76), the mass
fragment patterns of the lipid metabolites are presented in
Figs. S1 and S2, and the m/z
values of the metabolites are presented in Table I.
 | Table IEffects of OA on potential lipid
biomarkers associated with hypertension in liver. |
Table I
Effects of OA on potential lipid
biomarkers associated with hypertension in liver.
| Number |
tR, min | VIP value | Formula | Metabolite | Adduct ion | m/z | Fold change
| Pathway |
|---|
| SH/NCa | OA/SHa |
|---|
| 1 | 10.34 | 1.24 |
C34H67NO3 | GluCer
(d18:1/25:0) |
[M-H]− | 825.70577 | 2.11 | 0.23 | Sphingolipid
metabolism |
| 2 | 10.49 | 1.38 |
C39H68O5 | DG (36:4) |
[M+H]+ | 616.50624 | 2.34 | 0.42 | Glycerolipid
metabolism |
| 3 | 10.47 | 1.24 |
C50H95NO13 | LacCer
(d18:1/20:0) |
[M+H]+ | 917.68544 | 0.36 | 1.96 | Sphingolipid
metabolism |
| 4 | 11.93 | 1.78 |
C55H105NO13 | LacCer
(d18:1/25:0) |
[M+H]+ | 987.75350 | 0.29 | 2.28 | Sphingolipid
metabolism |
| 5 | 9.21 | 1.51 |
C26H52NO7P | LysoPC (18:1) |
[M-H]− | 521.34950 | 4.34 | 0.60 | Glycerophospholipid
metabolism |
| 6 | 11.63 | 1.10 |
C43H85O8P | PA (40:0) |
[M-H]− | 759.5954 | 2.51 | 0.43 | Glycerophospholipid
metabolism |
| 7 | 10.14 | 1.52 |
C40H76NO8P | PC (32:2) |
[M-H]− | 729.53166 | 2.19 | 0.32 | Glycerophospholipid
metabolism |
| 8 | 10.49 | 1.32 |
C42H80NO8P | PC (34:2) |
[M-H]− | 757.56290 | 2.54 | 0.32 | Glycerophospholipid
metabolism |
| 9 | 9.52 | 1.61 |
C42H76NO8P | PC (34:4) |
[M-H]− | 753.53070 | 2.05 | 0.43 | Glycerophospholipid
metabolism |
| 10 | 10.22 | 1.37 |
C37H74NO8P | PE (32:0) |
[M-H]− | 691.51380 | 0.15 | 2.78 | Glycerophospholipid
metabolism |
| 11 | 13.73 | 1.01 |
C45H93N2O6P | SM
(d18:0/22:0) |
[M-H]− | 788.67284 | 0.30 | 1.42 | Sphingolipid
metabolism |
| 12 | 16.40 | 1.52 |
C59H92O6 | TG (56:11) |
[M+H]+ | 896.68605 | 2.10 | 0.40 | Glycerolipid
metabolism |
| 13 | 15.83 | 1.60 |
C61H92O6 | TG (58:13) | [M+H]
+ | 920.68623 | 2.94 | 0.33 | Glycerolipid
metabolism |
| 14 | 11.16 | 1.31 |
C60H111NO18 | TriCer
(d18:1/24:1) |
[M-H]− | 1133.7749 | 0.12 | 8.01 | Sphingolipid
metabolism |
The effect of OA on differentially regulated markers
in SHRs was determined by performing one-way ANOVA and determining
the FC values. Biomarkers with P<0.01 between SH group and OA
group were designated as having been affected by treatment with OA.
Box plots were produced using GraphPad Prism v5.01 (GraphPad
Software, Inc.) using the log2 normalized abundance intensity
values for each lipid metabolite.
Receiver operating characteristic (ROC)
curve analysis and biomarker selection
ROC curve analysis is considered to be a viable
method for determining the clinical utility of biomarkers in
metabolomics studies (77,78).
ROC curves were constructed using SPSS 22.0 (IBM Corp.). The area
under the curve (AUC) is used to evaluate the sensitivity and
specificity of biomarkers. In the present analysis, an AUC value
>0.7 indicated that the lipids may be effective diagnostic
biomarkers (79).
Pathway impact analysis (PIA)
PIA was performed to deter-mine potential metabolic
pathways and networks influenced by hypertension by using a
web-based tool (Metaboanalyst 4.0; https://www.metaboanalyst.ca/) to perform Metabolomics
Pathway Analysis (MetPA) (80).
The differential expression of lipid species in the OA group were
consequently analyzed by MetPA as previously described (81). The impact value threshold was set
to 0.01, and pathways with an impact value above this threshold
were removed via filtration (80). The false discovery rate was
calculated to reduce the risk of a false positive using an adjusted
P<0.05 based on the Benjamini-Hochberg method (82).
Reverse transcription-quantitative PCR
(RT-qPCR) assay
The remaining liver tissues were homogenized in
liquid nitrogen, and total RNA was extracted (n=3/group) with
TRIzol reagent according to the manufacturer's protocol. The
concentration and purity of RNA were measured using an Ultra-Micro
UV Visible Spectrophotometer (Quawell Q-5000; Quawell Technology,
Inc.). RNA samples (100 ng) were dissolved in 25 µl
DNase/RNase-free water and stored at -80°C prior to further
experimentation. The PrimeScript RT reagent kit was used to
synthesize first-strand cDNAs at 42°C for 15 min. The qPCR primers
used in the present study (obtained from Shanghai Shenggong Co.,
Ltd.) were presented in Table
II. qPCR was performed using SYBR Premix Ex Taq II (Tli RNaseH
Plus) and an Applied CFX Connect Real-Time PCR Detection System
(Bio-Rad Laboratories, Inc.). The PCR cycling conditions were 95°C
for 30 sec, followed by 45 cycles of 95°C for 30 sec and 60°C for
34 sec (10). The housekeeping
gene, β-actin, was used as a reference gene for normalization of
target gene expression, and the relative expression of genes was
determined using the 2−ΔΔCq method (83). To determine the differences in the
relative expression of genes in the SH group compared with the NC
group, the NC group served for calibration purposes, and the SH
group was the experimental test group. Alternatively, to determine
the effects of OA in SHRs (comparing the relative expression of
genes in the OA group with those in the SH group), the SH group
served for calibration purposes, and the OA group served as the
experimental test groups.
| Table IIPrimer sequences. |
Table II
Primer sequences.
| Gene | Sequence
(5′-3′) |
|---|
|
sPLA2 | F:
TGTCGATATGGAAAGGCACCAA |
| R:
TAGCAGACGTCCAACTGGTTAC |
| FAS | F:
GGTAGGCTTGGTGAACTGTCTC |
| R:
TCTAACTGGAAGTGACGGAAGG |
| β-actin | F:
CATCTATGAGGGTTACGCGCT |
| R:
ATTTCCCTCTCAGCTGTGGTG |
Western blot assay for FAS and
sPLA2 proteins
Liver tissues were homogenized using RIPA lysis
buffer (Beyotime Institute of Biotechnology), and the total
extracted proteins were harvested and quantified using BCA assay
analysis (Beyotime Institute of Biotechnology) (84). Samples (20 µg protein) were
analyzed using SDS-PAGE (12% gels). Gel electrophoresis was
performed at 120 V for 2 h, followed by transfer onto a
polyvinylidene fluoride membrane (0.45 mm) at 100 V for 1 h. The
membranes were blocked in 5% non-fat milk in TBS-0.1% Tween 20
buffer for 1 h at room temperature. The membranes were then probed
with rabbit anti-FAS monoclonal antibody (1:1,500; cat. no.
ab22759; Abcam) or rabbit anti-sPLA2 polyclonal antibody
(1:1,500; cat. no. ab23705; Abcam) at 4°C overnight, followed by
horse-radish peroxidase-conjugated goat anti-rabbit secondary
antibody (1:1,000; cat. no. SE134; Beijing Solarbio Science &
Technology Co., Ltd.) for 2 h at room temperature. The protein
bands were developed using an UltraSignal ECL kit (4A Biotech Co.,
Ltd.) and normalized against β-actin (1:1,500; cat. no. K006153P;
Beijing Solarbio Science & Technology Co., Ltd.). Band
intensities were quantified using ImageJ (v1.51; National
Institutes of Health) (85).
Statistical analysis
All data are reported as the mean ± SD. Data were
analyzed using SPSS 22.0. One-way ANOVA was used to analyze three
groups, followed by Bonferroni post hoc test. A mixed two-way ANOVA
was performed to analyze the changes in blood pressure over time
within and between groups groups; Bonferroni post hoc test was used
for multiple comparisons. The confidence interval (CI) was set to
95%, and P<0.05 was considered to indicate a statistically
significant difference.
Results
OA reverses the elevated SBP and DBP
observed in SHRs
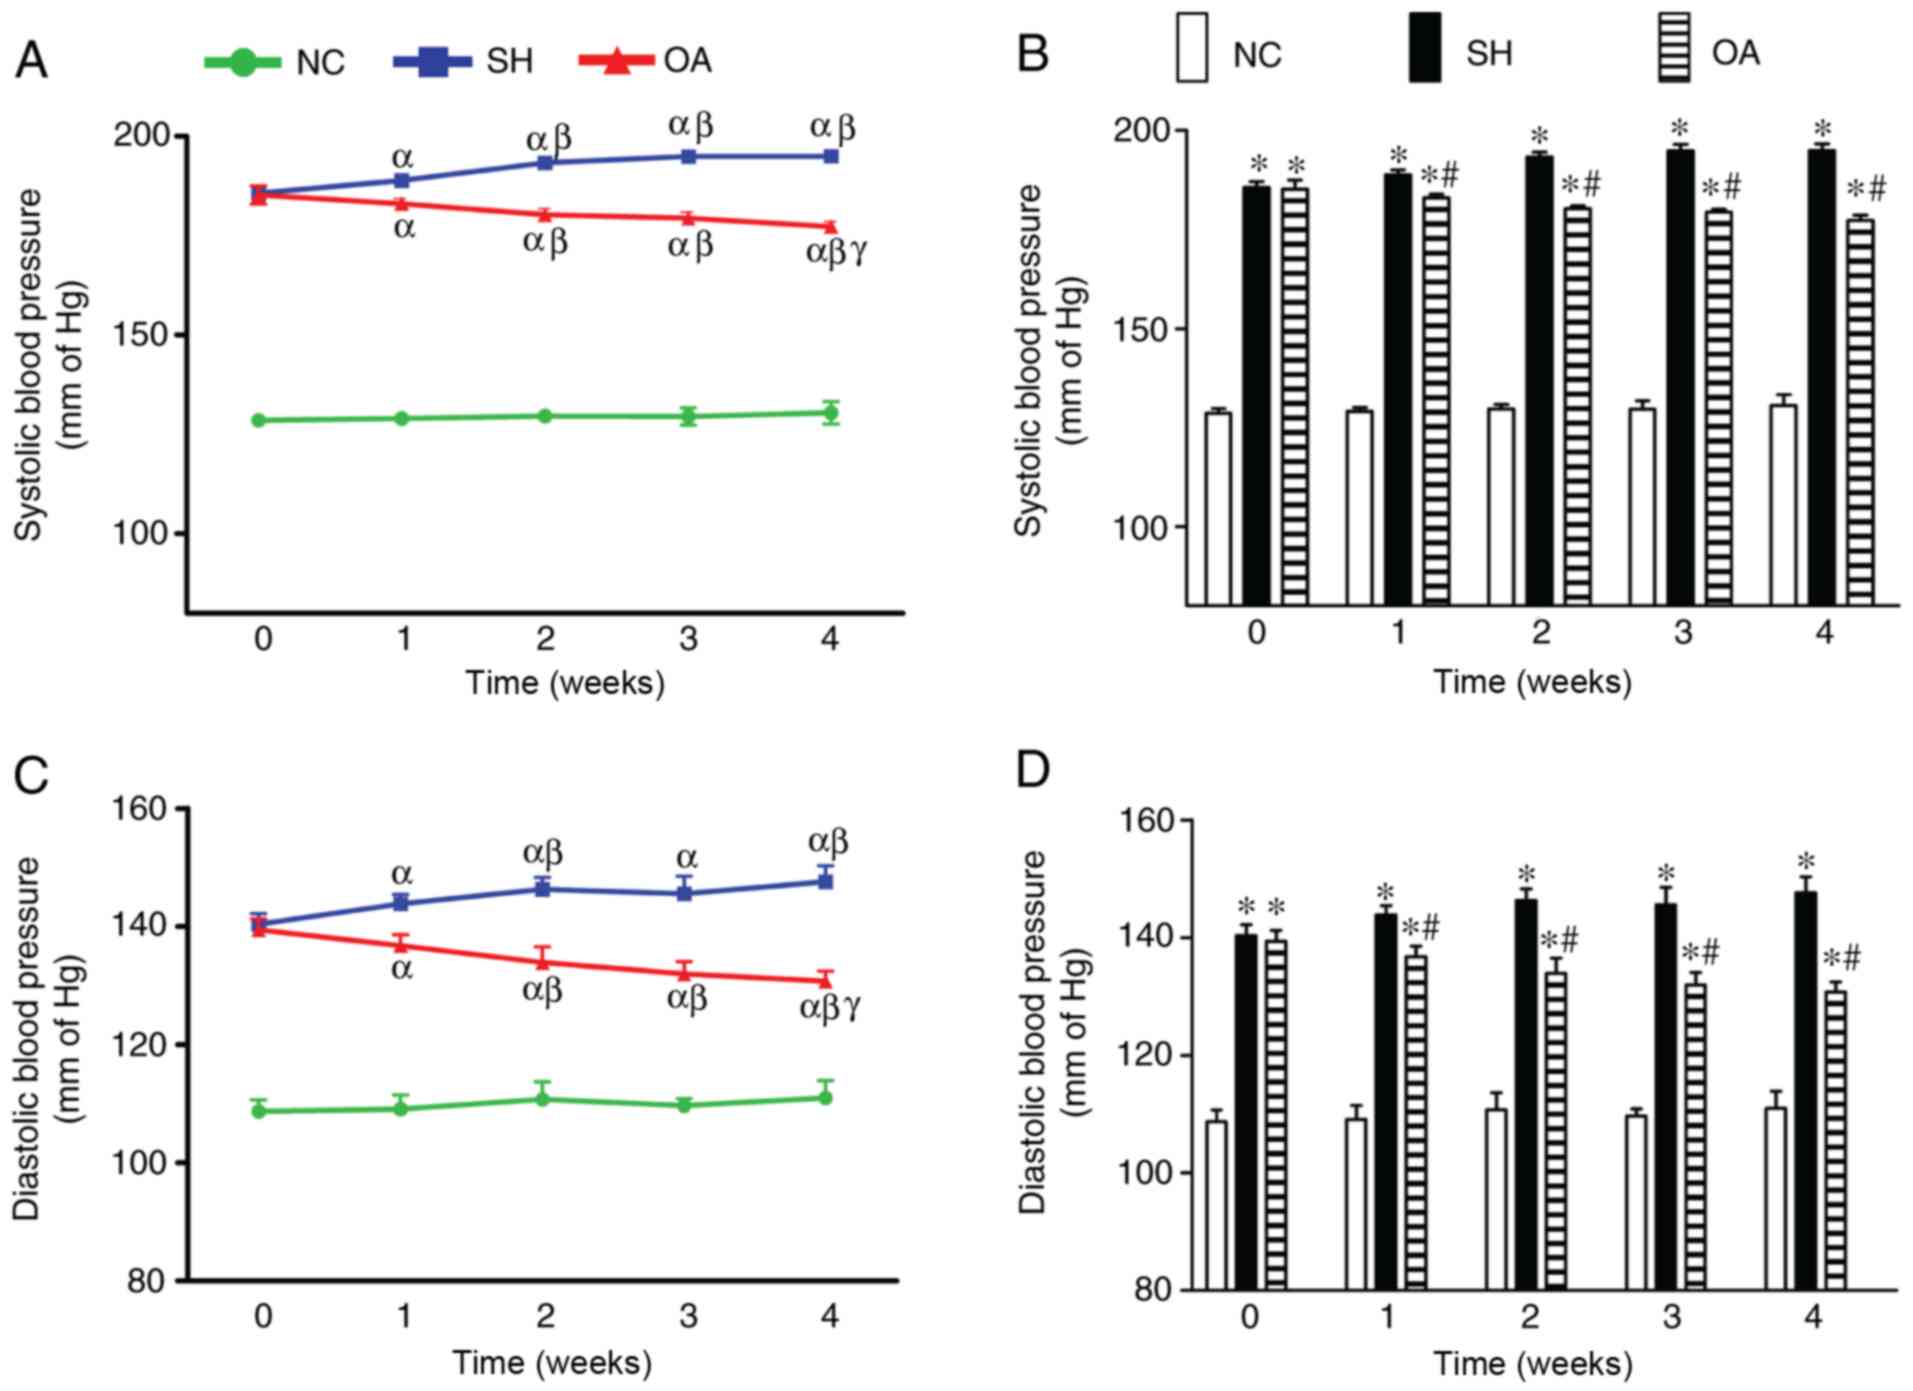
The effects of OA on SBP and DBP are shown in
Fig. 1. In the NC group, no
significant changes in SBP were identified throughout the duration
of the study, and the mean SBP throughout the experiment period was
129.44±1.90 mmHg. The SH group, however, had significantly higher
SBP compared with the NC group throughout the treatment period. In
addition, a significant increase in SBP was observed over time
throughout the experimental period. The mean SBP in the SH group
during week 0 was 185.67±1.43 mmHg, which continued to increase
over the time, reaching a peak of 194.93±1.65 mmHg at week 4.
Treatment of SHR rats with OA, however, led to a significant
reversal in the elevated SBP compared with the SH group between
weeks 1 and 4.
In the NC group, there were no notable changes in
DBP throughout the duration of the experiment, and the mean DBP
throughout the experimental period was 109.83±2.46 mmHg. The SH
group exhibited significantly higher DBP compared with the NC group
throughout the treatment period. In addition, there was a
significant increase in DBP up to week 2, after which no further
increases in DBP were noted. The mean DBP in the SH group at week 0
was 140.37±1.84 mmHg, which increased to 146.33±1.94 mmHg at week
2. OA treatment led to a significant decrease in DBP in the SHRs
across the 4 weeks.
Analysis of biochemical markers
The lipid profiles of serum TGs, CHOL, HDL-C and
LDL-C in the NC, SH and OA groups are presented in Fig. 2. The serum levels of CHOL, HDL-C
and LDL-C were significantly lower in the SH group compared with
the NC group, and TGs were significantly elevated in the SH group
compared with the NC group (P<0.01). In the OA group, the TG
level was reduced compared with the SH group (P<0.01);
conversely, LDL-C was increased compared with the SH group
(P<0.01). However, there were no significant differences in CHOL
and HDL-C levels between the SH and OA groups. Collectively, these
results demonstrated that SHRs exhibited typical pathological
features as reported in a previous study (86), and that OA regulated the serum
levels of TGs and LDL-C.
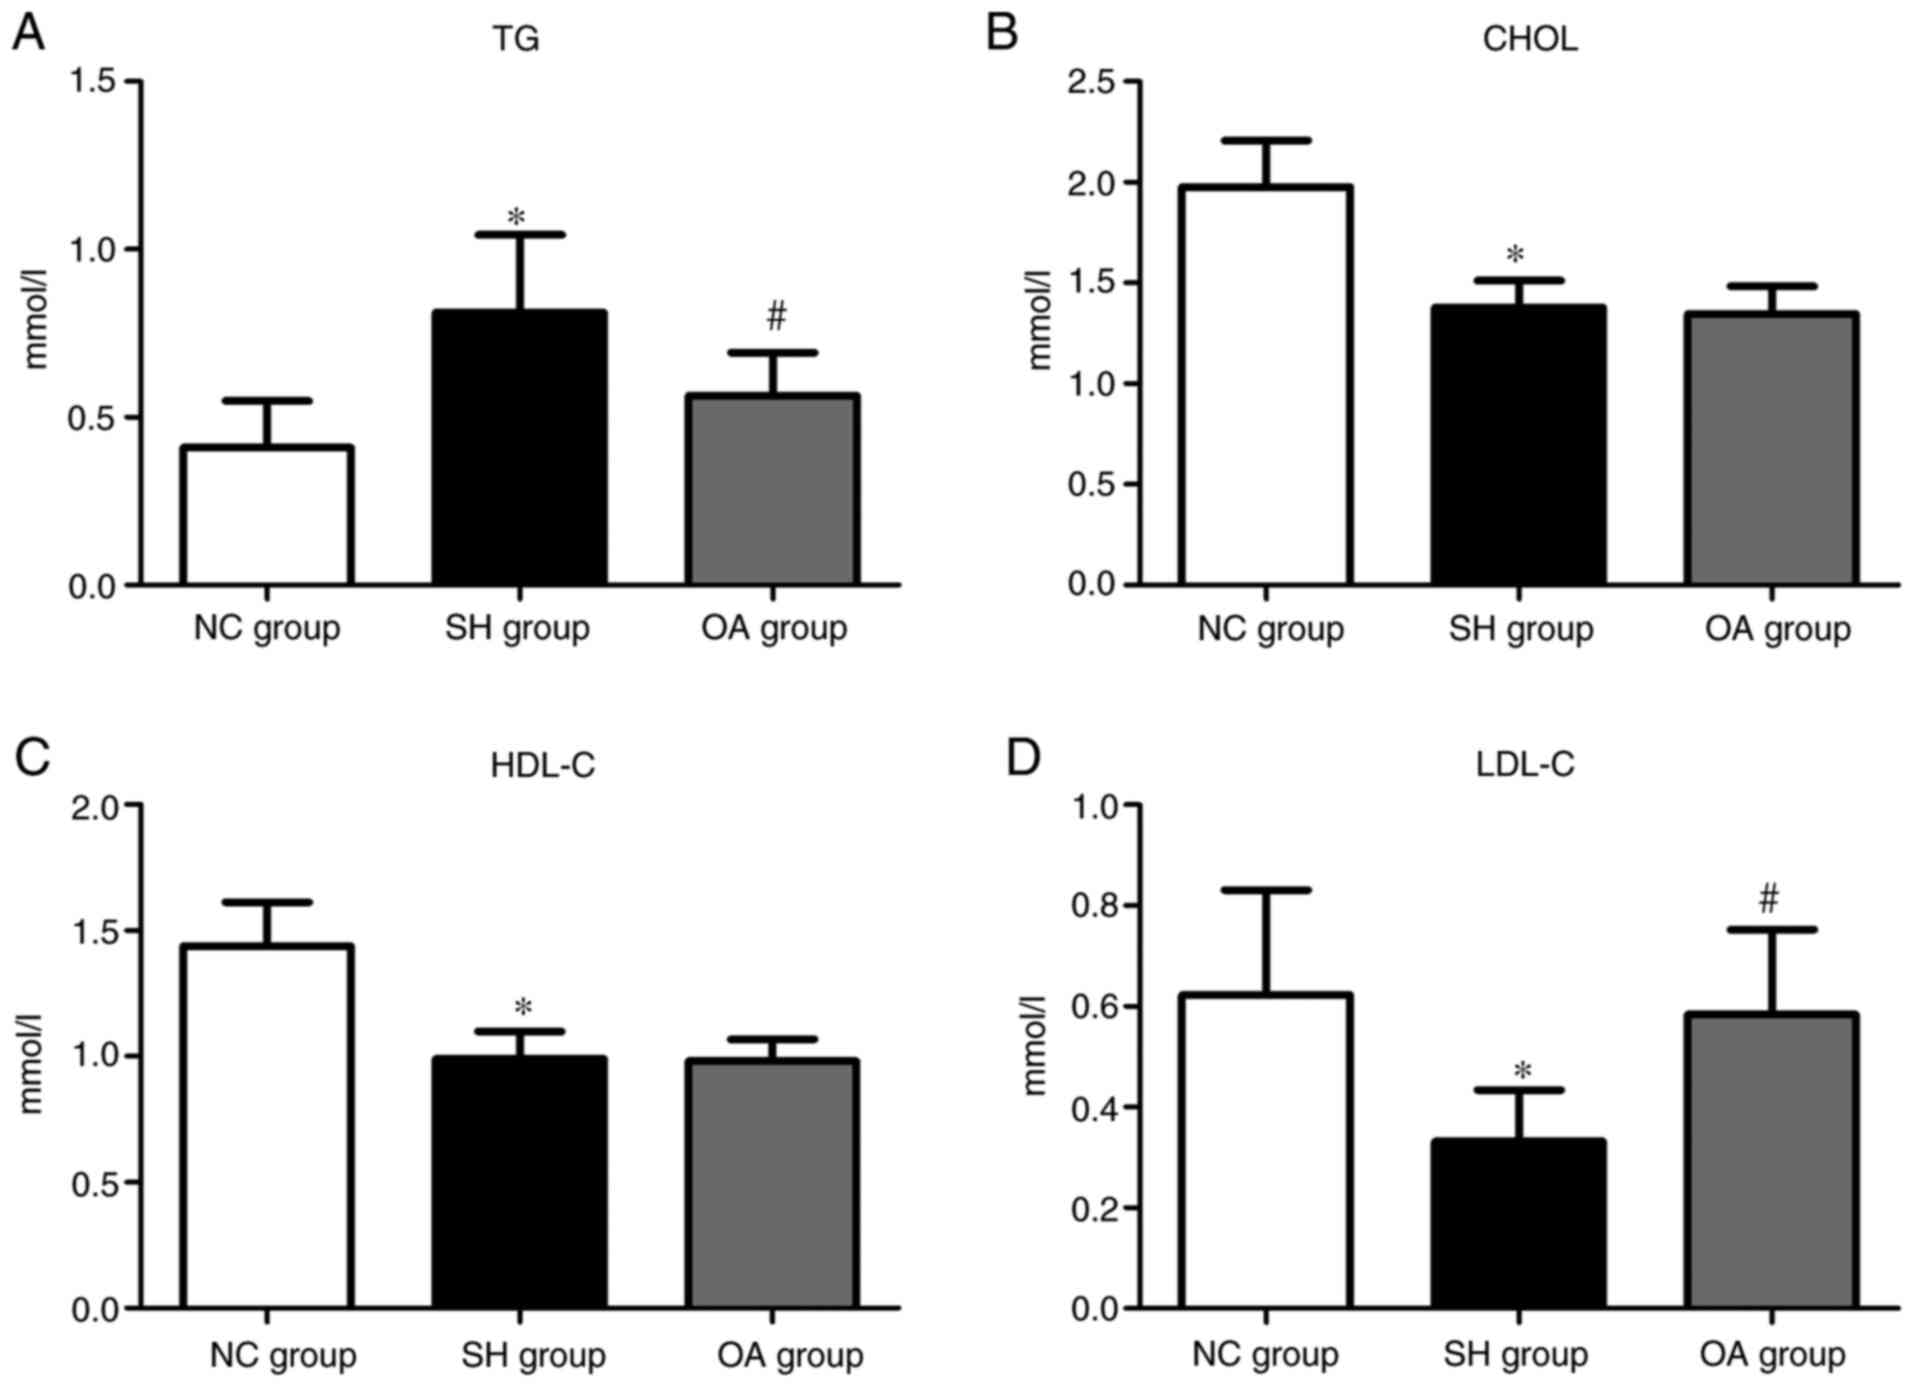 | Figure 2Levels of serum biochemical markers
among the NC, SH and OA groups. Levels of (A) TG, (B) CHOL, (C)
HDL-C and (D) LDL-C. Data are presented as the mean ± SD;
n=10/group. *P<0.01 vs. NC group;
#P<0.01 vs. SH group. NC, normal control; SH,
spontaneously hypertensive; OA, oleanolic acid; TG, triglyceride;
CHOL, total cholesterol; HDL-C, high-density lipoprotein
cholesterol; LDL-C, low-density lipoprotein cholesterol. |
Lipidomics analysis of liver
homogenates
The possible mechanism of action of OA was
subsequently determined using lipidomics analysis of liver
homogenates using UPLC-Q-Orbitrap/MS. Total ion chromatograms of
lipid extracts from liver homogenates revealed a good degree of
separation (Fig. S1). Instrument
stability and analytical repeatability were determined to confirm
that the inherent differences between groups were truly the source
of significant differences in liver metabolites in LC-MS, and to
eliminate possible interference from instrumental drift. The study
included an analysis of quality control (QC) samples during the
analytical run.
The instrument and method reproducibility were
deter-mined using one QC sample for every 6 test samples. The
relative standard deviation (RSD) of the QC sample intensity and
retention time in positive ion mode were 2.09-4.73 and 0-0.12%,
respectively, and in negative ion mode, the RSD of the QC sample
intensity and retention time were 0.62-7.04 and 0-0.12%,
respectively (Table SI). The
deviation variation of all QC samples was further determined via
PCA for method validation. The results revealed that 12 QC samples
in the positive ion mode, and 6 QC samples in the negative ion
mode, fell within 2 SDs with a 95% CI (Fig. S3). QC samples, together with test
samples, were further analyzed using the PCA and PLS-DA method
(Fig. S4). A number of QC
samples were closely clustered in score plots. These data
demonstrated that the analytical method was precise, reproducible
and suitable for the metabolomics study.
PCA was performed to determine the differential
regulation of lipid species in the three groups (NC, SH and OA),
and the resulting data are presented as score plots in Fig. 3A (positive ionization mode),
whereas Fig. 3B (negative
ionization mode) represents the sample distribution in multivariate
space. As shown in Fig. 3A and B,
the lipidomic profiles in positive and negative ionization modes of
the NC and SH groups were clearly separated, revealing the
perturbations of lipid profiles in the SH group. The R2X
predictive ability values of the PCA models were 0.509 and 0.506 in
positive and negative modes, respectively, suggesting that the data
were statistically reliable.
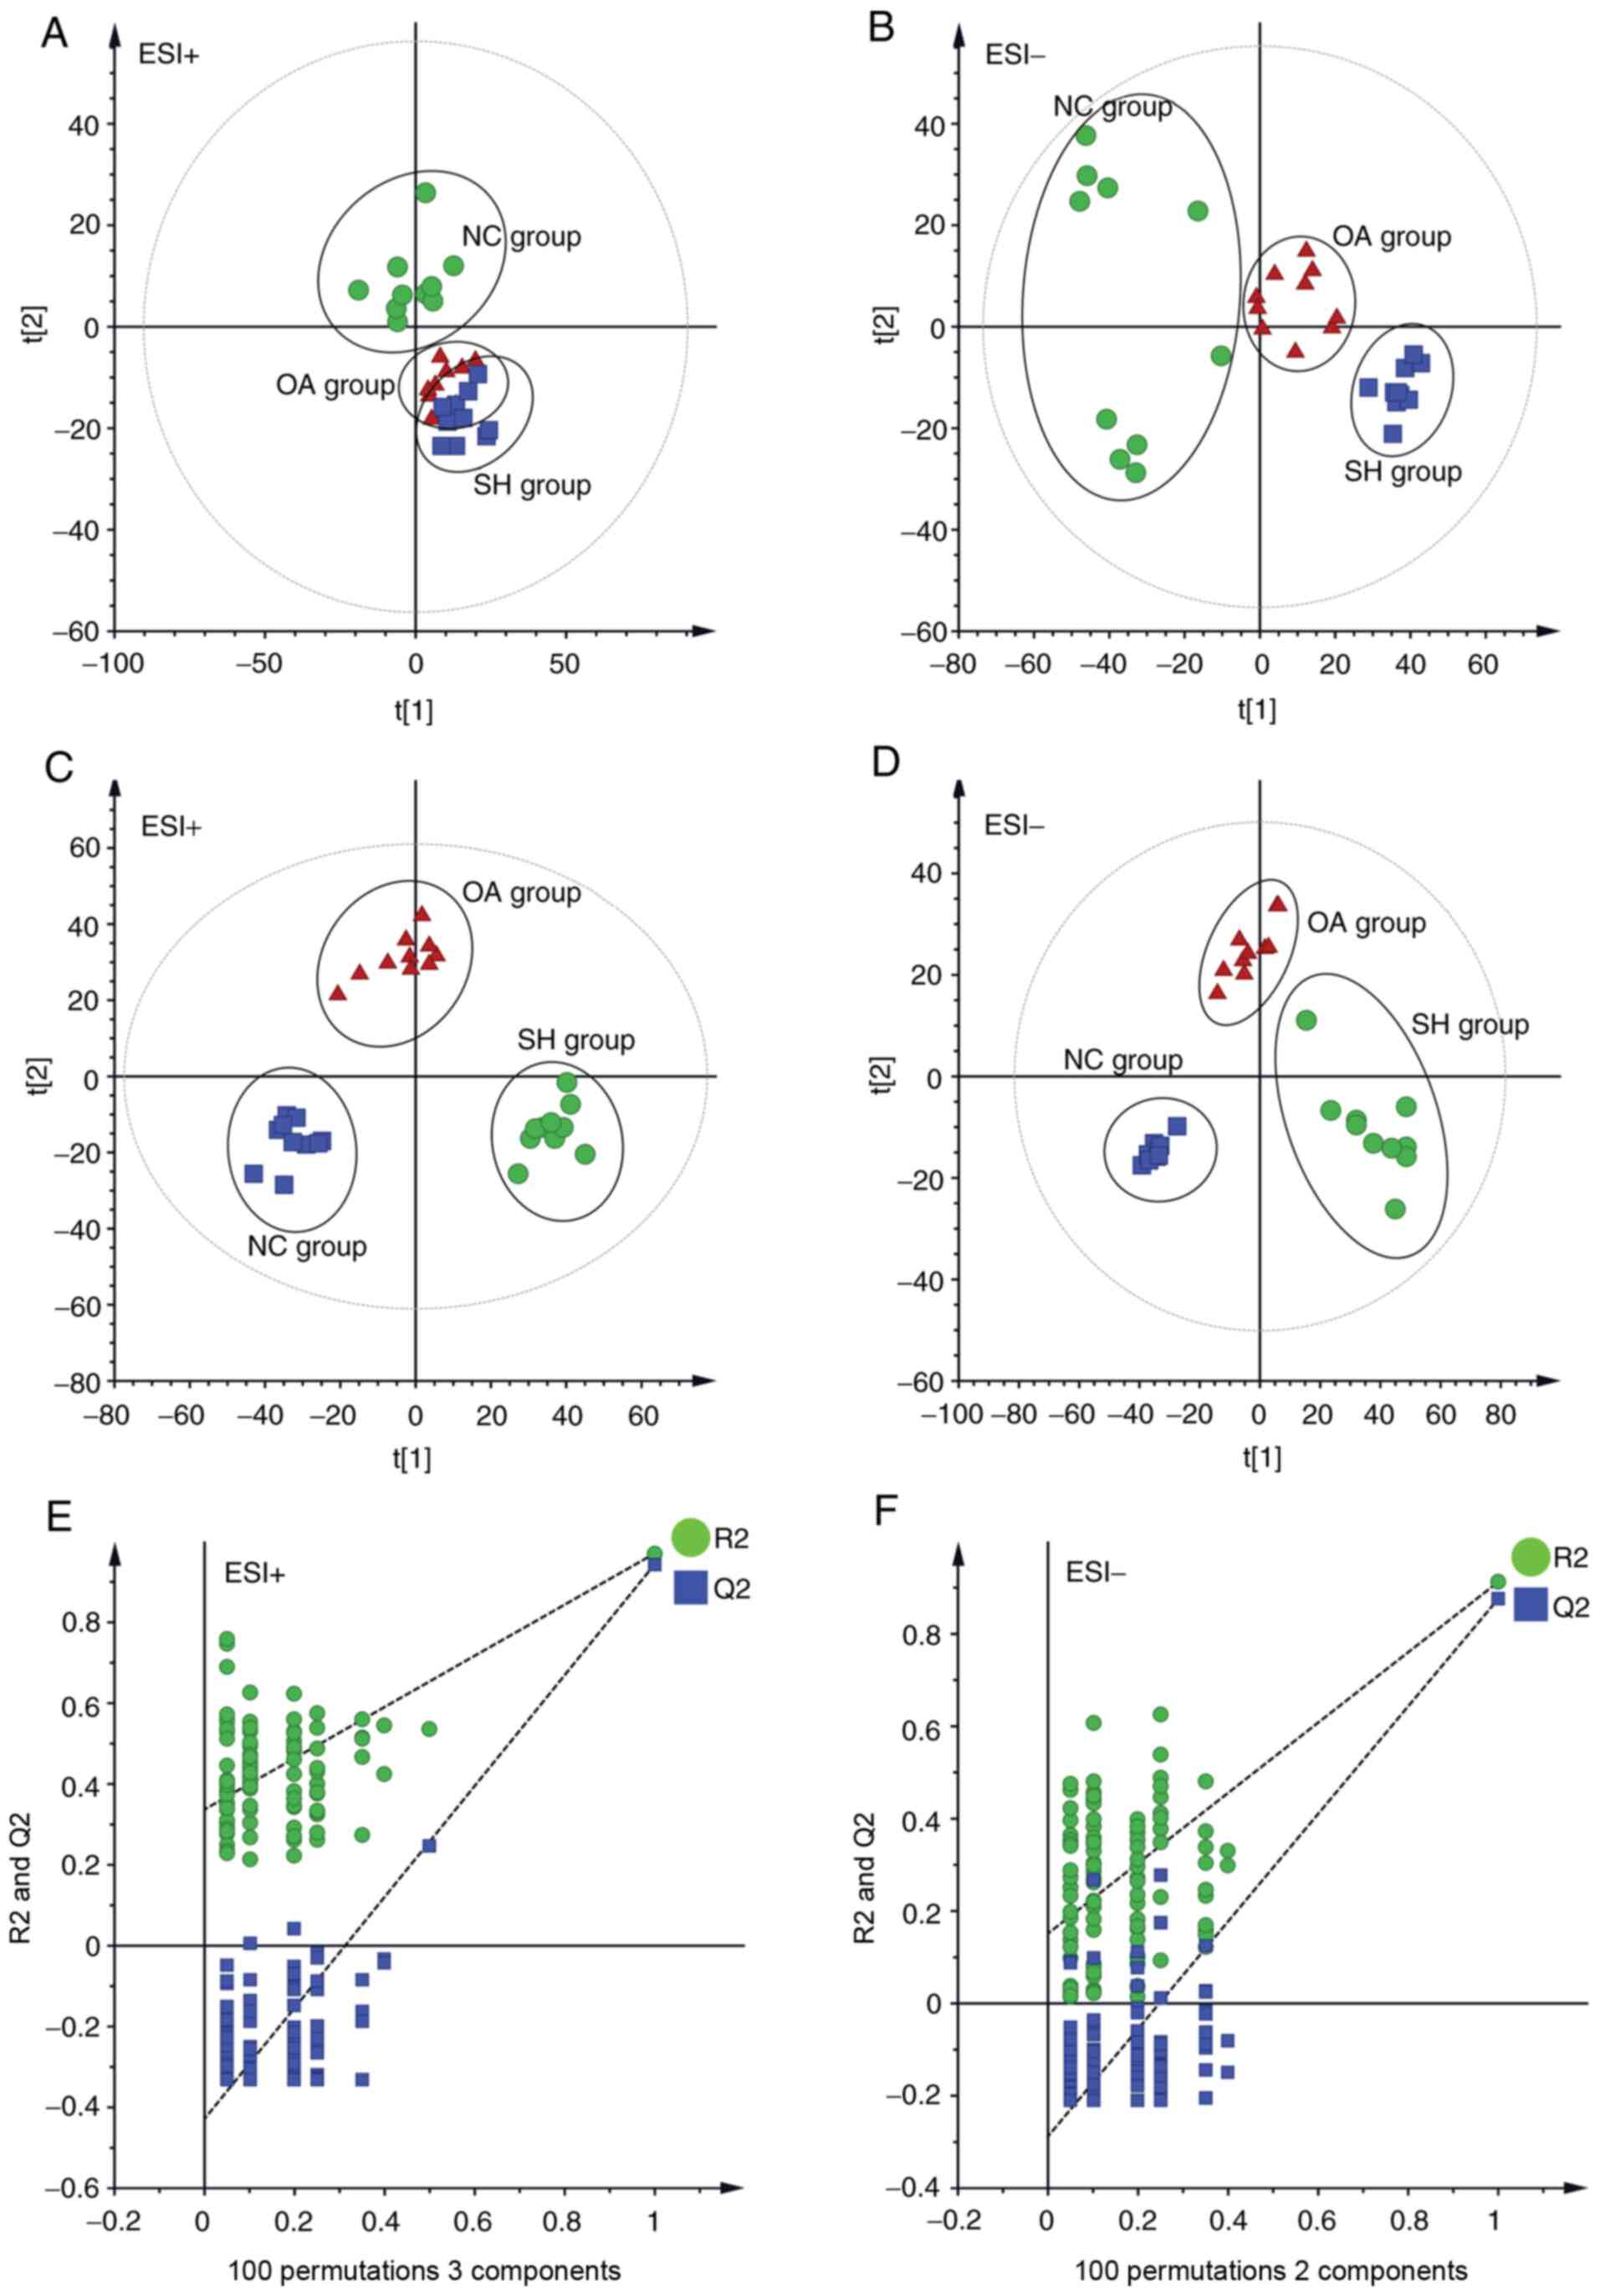 | Figure 3Multivariate data analysis of liver
lipidomics. (A) PCA score plot of the NC, SH and OA groups in the
ESI+ mode (R2=0.927). (B) PCA score plot of the NC, SH
and OA groups in the ESI- mode (R2=0.839). (C) PLS-DA
score plot of the NC, SH and OA groups in the ESI+ mode
(R2X=0.509, R2Y=0.971, Q2=0.937).
(D) PLS-DA score plot of the NC, SH and OA groups in the ESI- mode
(R2x=0.506, R2y=0.915, Q2=0.889).
(E) 100 permutation tests of the PLS-DA model in the ESI+ mode
(R2=0.337 and Q2=−0.428). (F) 100 permutation
tests of the PLS-DA model in ESI- mode (R2=0.151 and
Q2=−0.288). NC, normal control; SH, spontaneously
hypertensive; OA, oleanolic acid; PCA, principal component
analysis; PLS-DA, partial least squares discriminant analysis; ESI,
electrospray ionization. |
PLS-DA analysis was subsequently performed to
further assess the effect of OA treatment on lipid profiles in
SHRs. In PLS-DA analysis (Fig. 3C and
D), the SH and NC groups were clearly separated, which was
consistent with the findings of the PCA analysis. The lipidomics
profile of the OA group was distinct compared with that of the SH
group, suggesting that the dysregulation of lipids in SHRs was
ameliorated following treatment with OA. Distinct separation of the
NC, SH and OA groups was observed in the PLS-DA score plots. The
distribution obtained suggested that OA treatment led to a partial
recovery of the hypertension status. A permutation test was
subsequently performed to test the overfitting of PLS-DA after
modelling the data. A hundred permutation tests generated
intercepts of R2=0.337 and Q2=−0.428 in
positive mode, and R2=0.151 and Q2=-0.288 in
negative mode (Fig. 3E and F),
which demonstrated that the PLS-DA models were robust without
overfitting.
From the VIP values, it was concluded that the
contributions of the features for the model were employed to select
the potential biomarkers. Metabolite candidates with VIP >1,
P<0.01 and FC >2 were noted as potential biomarkers. Based on
the threshold, 14 lipid species in liver that were potentially
associated with the influence exerted by OA upon hypertension in
SHRs were identified (Table
I).
Liver homogenates were used to identify the
differentially expressed lipid species according to the score
plots. In the positive ionization mode, six lipid species [one PC,
two TGs, one DG and two lactosylceramides (LacCers)], and in the
negative ionization mode, seven lipid species [one lysoPC, two PCs,
one PE, one phosphatidic acid (PA), one SM and one
trihexosylceramide (TriCer)] were detected (Table I). DGs, TGs, lysoPC, PC, PE, Cer,
SM and PA were present as either [M+H]+ or
[M-H]− adducts. Lipid species were identified on the
basis of: i) Pseudomolecular ion masses ([M+H]+ or
[M-H]−); ii) MS/MS product ion analysis; and/or iii)
comparison with authentic standards or information in databases,
including HMDB, LIPID MAPS Lipidomics Gateway, METLIN and KEGG
databases. The differentially regulated lipid species are shown in
Table I, and the identification
results of lipid species according to HPLC-ESI-MS/MS are shown in
Fig. S5 and Table SII. MS and
MS/MS data of these reference standards and QC samples were
obtained by collision-induced dissociation.
Lipid metabolite analysis
Selected biomarker data were analyzed using
clustering heatmaps to determine the associations and differences
between samples (Fig. 4). In the
SH group, the concentrations of LacCer (d18:1/20:0, d18:1/25:0),
glucosylceramide (GluCer) (d18:1/25:0), SM (d18:0/22:0), TriCer
(d18:1/24:1), PE (32:0) and PA (40:0) were significantly decreased,
whereas those of lysoPC (18:1), PCs (32:2, 34:2, 34:4), TGs (56:11,
58:13) and DG (36:4) were increased (Table I).
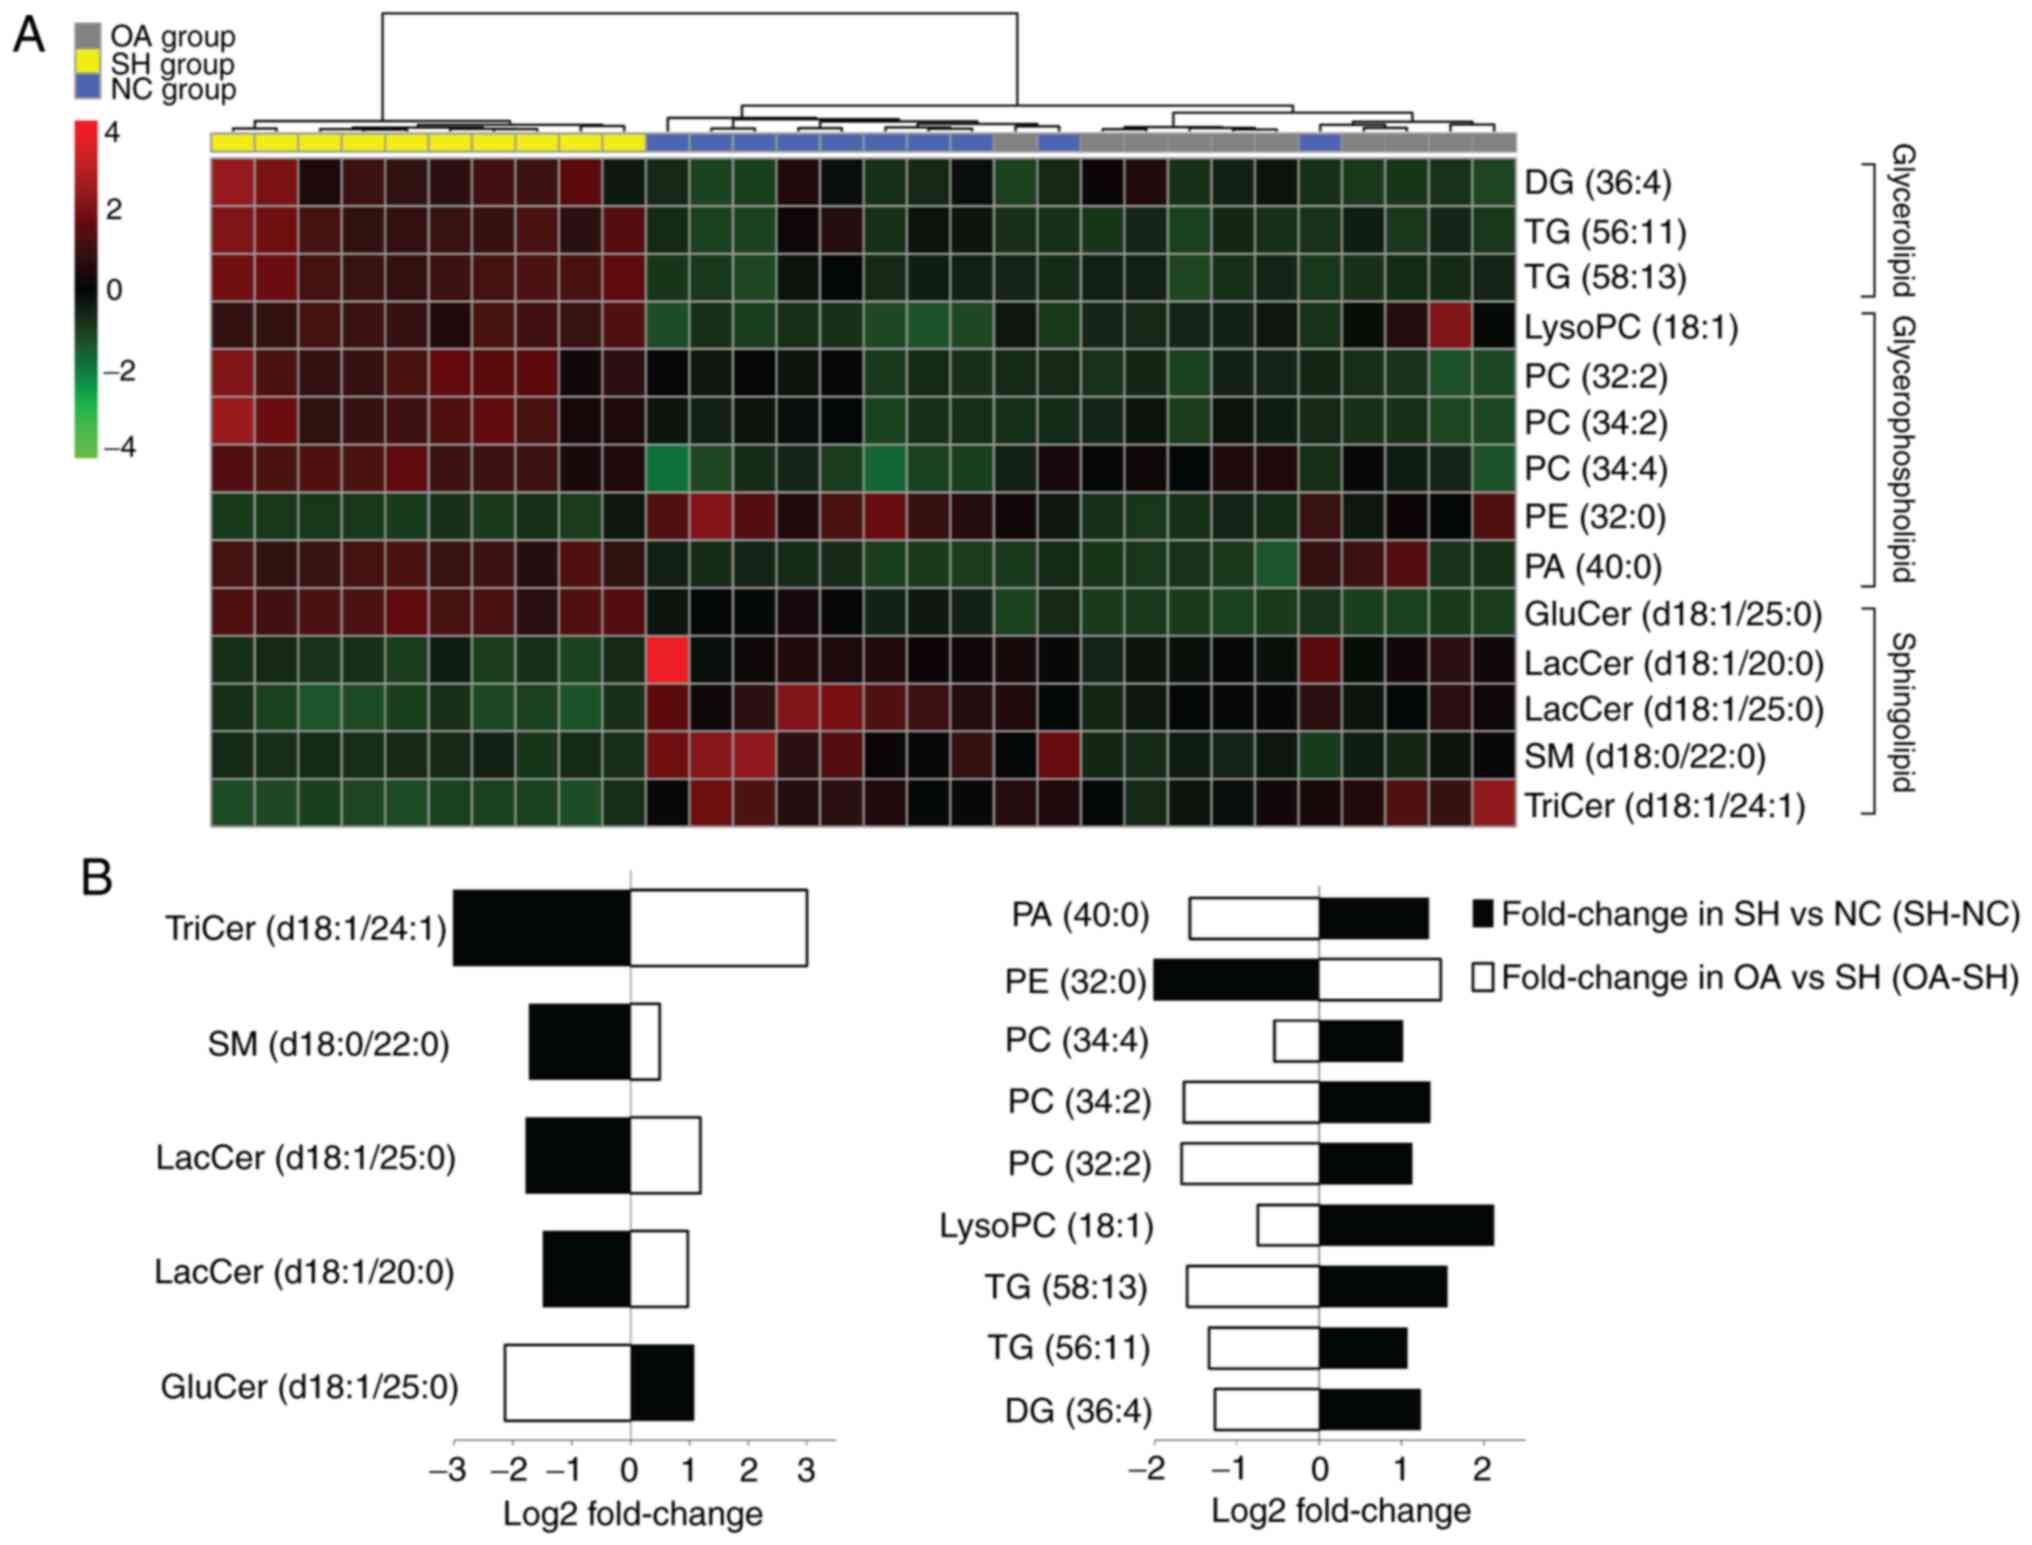 | Figure 4Lipidomics profiling of the 14
identified lipid species. (A) Heatmap showing the hierarchical
clustering of the liver lipid species in the NC, SH and OA groups,
colored by abundance intensity; the identified lipid species are
represented by each line on the graph. The scale from −4 to +4 is
colored from green through to red representing low to high
abundance, respectively. (B) Fold changes in liver lipid metabolite
levels in the NC and OA groups (n=10/group) compared with the SH
group. The log2 ratio for signals of each lipid species were
calculated and normalized to the abundance intensity. Groups were
analyzed using one-way ANOVA. NC, normal control; SH, spontaneously
hypertensive; OA, oleanolic acid; LacCer, lactosylceramide; TriCer,
trihexosylceramide; GluCer, glucosylceramide; SM, sphingomyelin;
PC, phosphatidylcholine; PE, phosphatidylethanolamine; PA,
phosphatidic acid; lysoPC, lysophosphatidylcholine; DG,
diglyceride; TG, triglyceride. |
To further understand the metabolic differences
between the NC, SH and OA groups, the lipid data were analyzed
using a heatmap. The identified lipids clearly distinguished the
metabolic profile of the SH group, and were regarded as potential
biomarkers (Fig. 4A). Additional
analysis of lipidomics data using one-way ANOVA revealed that the
significantly dysregulated lipid classes between the NC, SH and OA
groups were sphingolipids, glycerolipids and glycerophospholipids
(Fig. 4B). In liver samples
obtained at 4 weeks after treatment, the total levels of lysoPC
(18:1), PCs (32:2, 34:2, 34:4), TGs (56:11, 58:13) and DG (36:4)
were decreased compared with the SH group, whereas the levels of
LacCer (d18:1/20:0), LacCer (d18:1/25:0), GluCer (d18:1/25:0) and
SM (d18:0/22:0) were increased compared with the SH group.
ROC curve analysis and biomarker
selection
In the present analysis, ROC curves were used to
screen markers by examining the AUC values of the biomarkers in the
SH and OA groups (87). ROC
curves were performed to further identify biomarkers of
antihypertensive effects of OA. The 14 lipid species shown in
Fig. 5 with AUC values ≥0.900,
sensitivity >70% and specificity >90% (95% CI) were
considered as potential biomarkers of the lipid-regulating effects
of OA. These 14 lipid species were DG (36:4), lysoPC (18:1), PC
(32:2), PC (34:2), PC (34:4), PE (32:0), TG (56:11), TG (58:13), PA
(40:0), GluCer (d18:1/25:0), LacCer (d18:1/20:0), LacCer
(d18:1/25:0), SM (d18:0/22:0) and TriCer (d18:1/24:1). Fig. 6 presents the differences in the
levels of the key lipid biomarkers between the NC, SH and OA
groups. Collectively, these findings indicated that sphingolipids,
glycerides and glycerophospholipids represent potential biomarkers
of the lipid-regulating effects of OA.
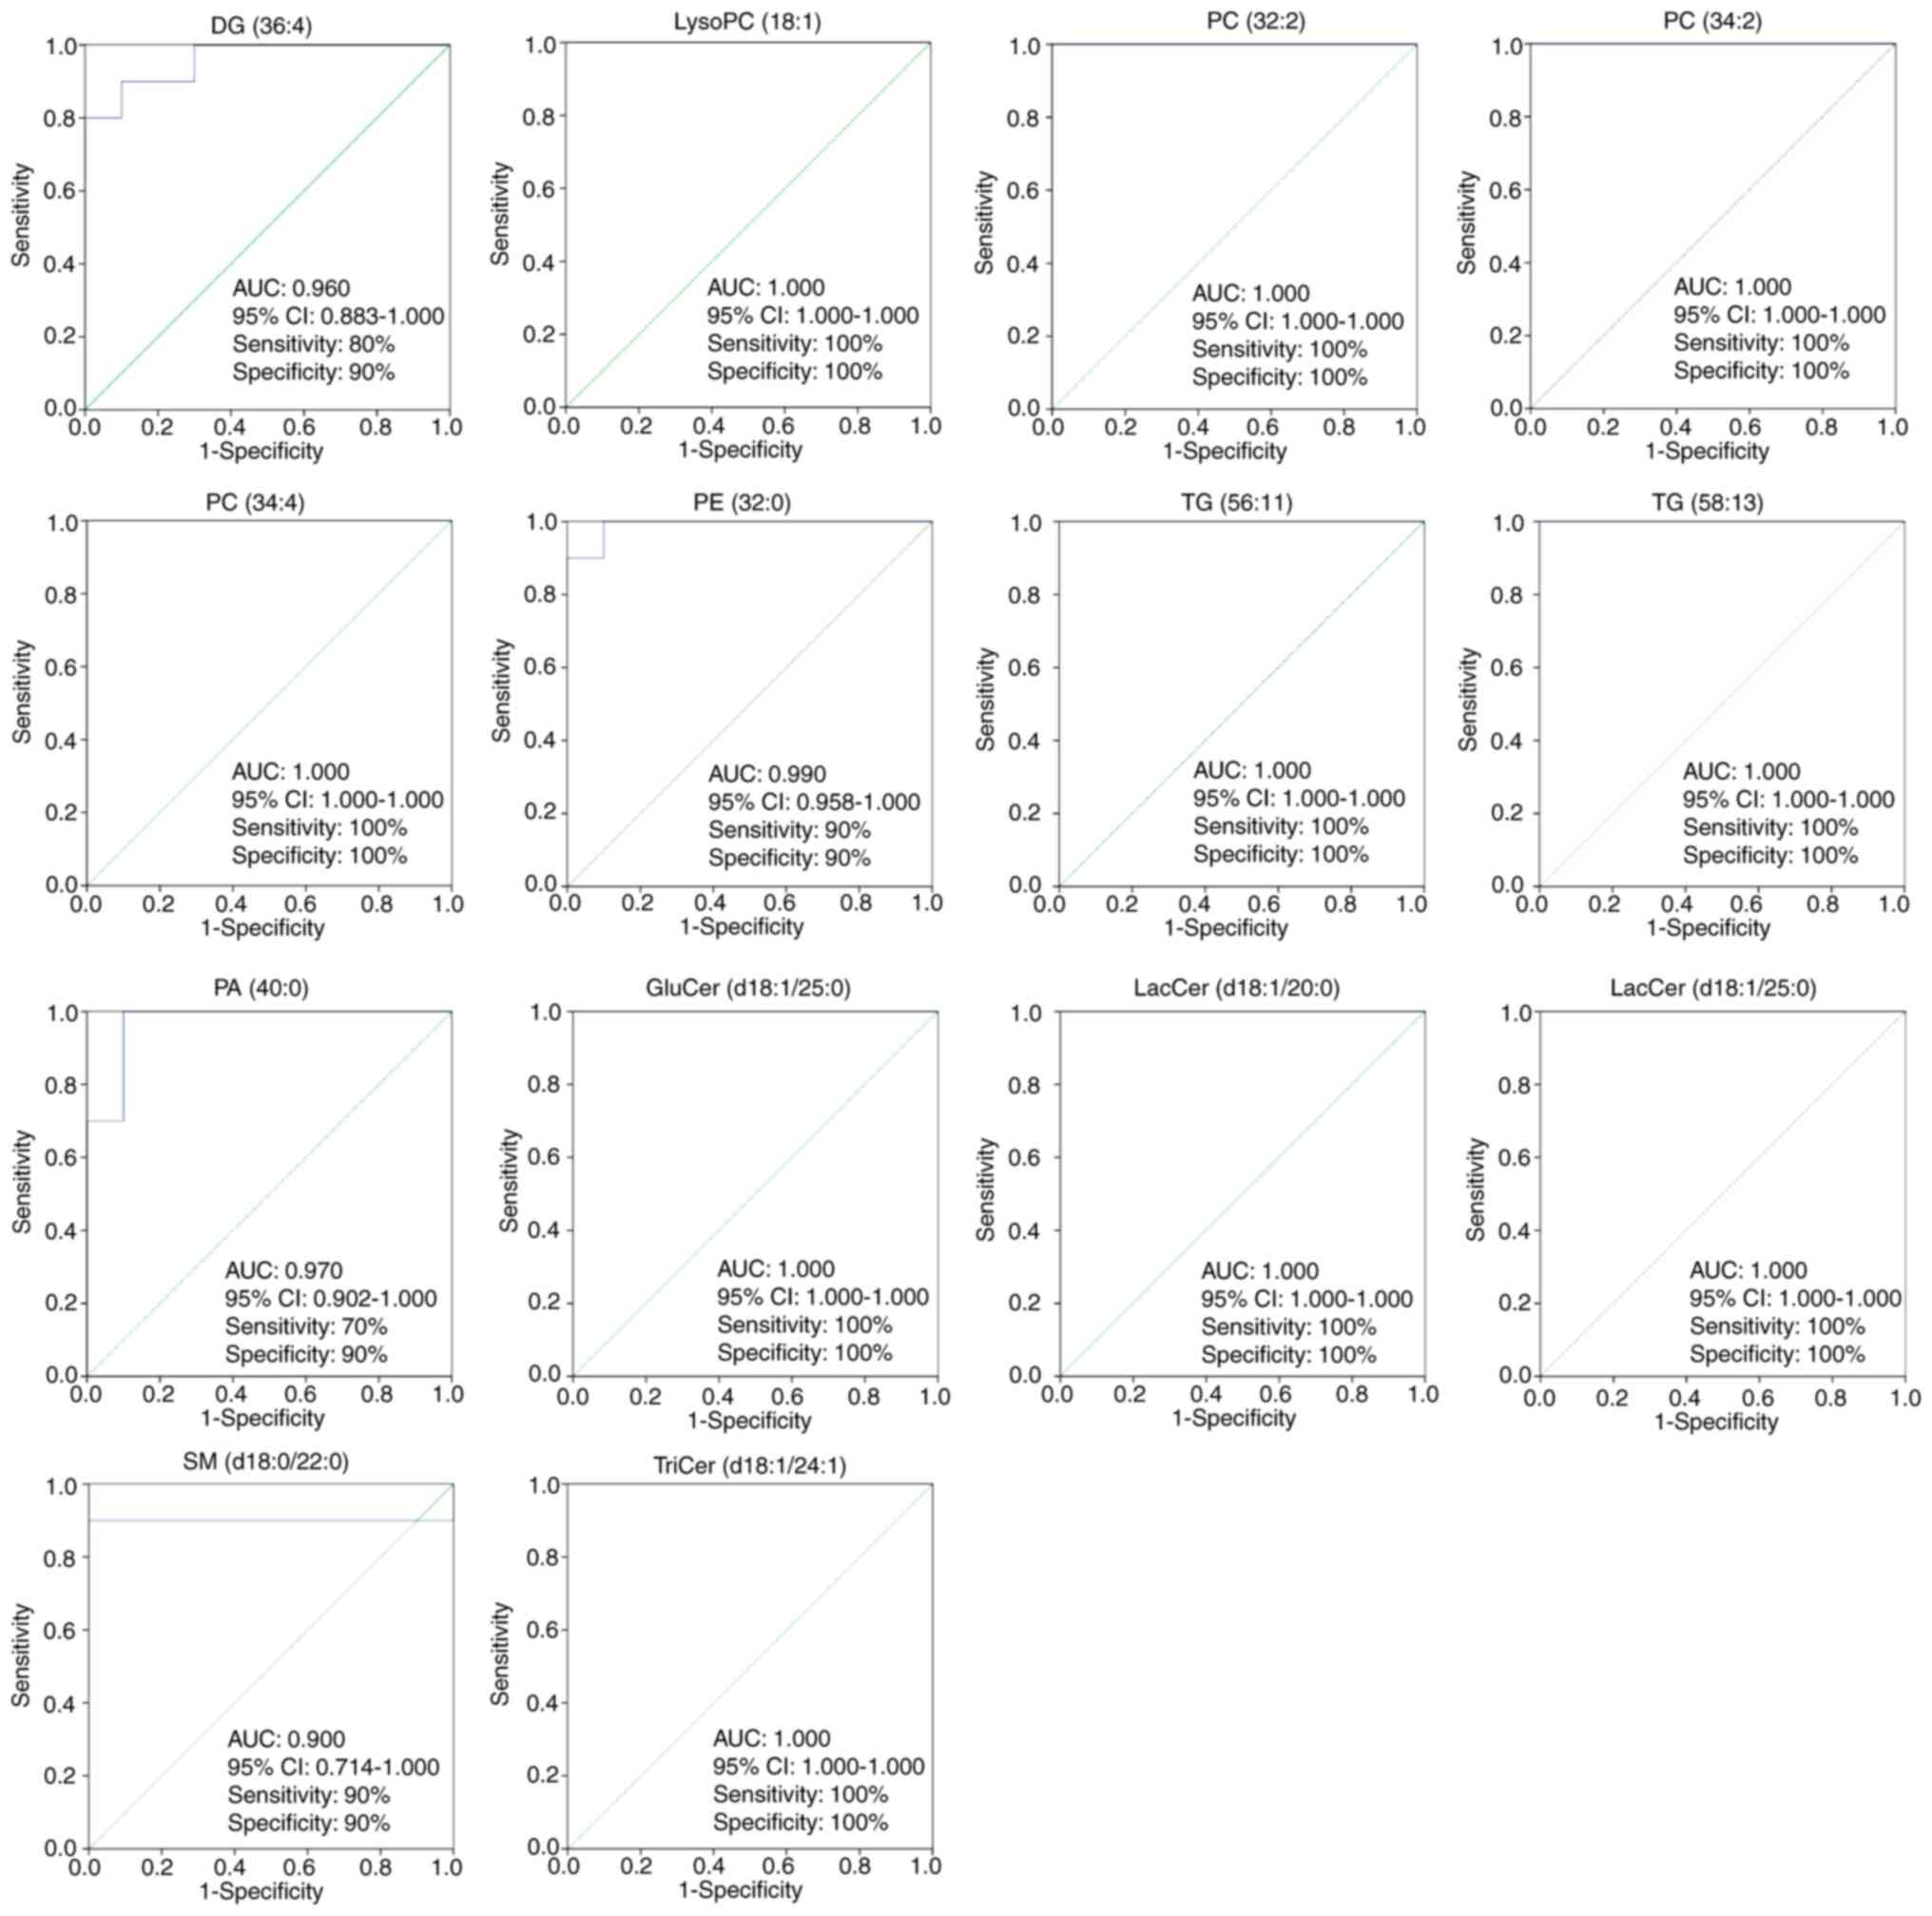 | Figure 5Partial least squares discriminant
analysis-based receiver operator characteristic curves of the 14
lipid species used for the selection of biomarkers for the
antihypertensive effects of oleanolic acid. The corresponding AUC,
95% CI, specificities, and sensitivities are presented. LacCer,
lactosylceramide; TriCer, trihexosylceramide; GluCer,
glucosylceramide; SM, sphingomyelin; PC, phosphatidylcholine; PE,
phosphatidylethanolamine; PA, phosphatidic acid; lysoPC,
lysophosphatidylcholine; DG, diglyceride; TG, triglyceride; AUC,
area under the curve; CI, confidence interval. |
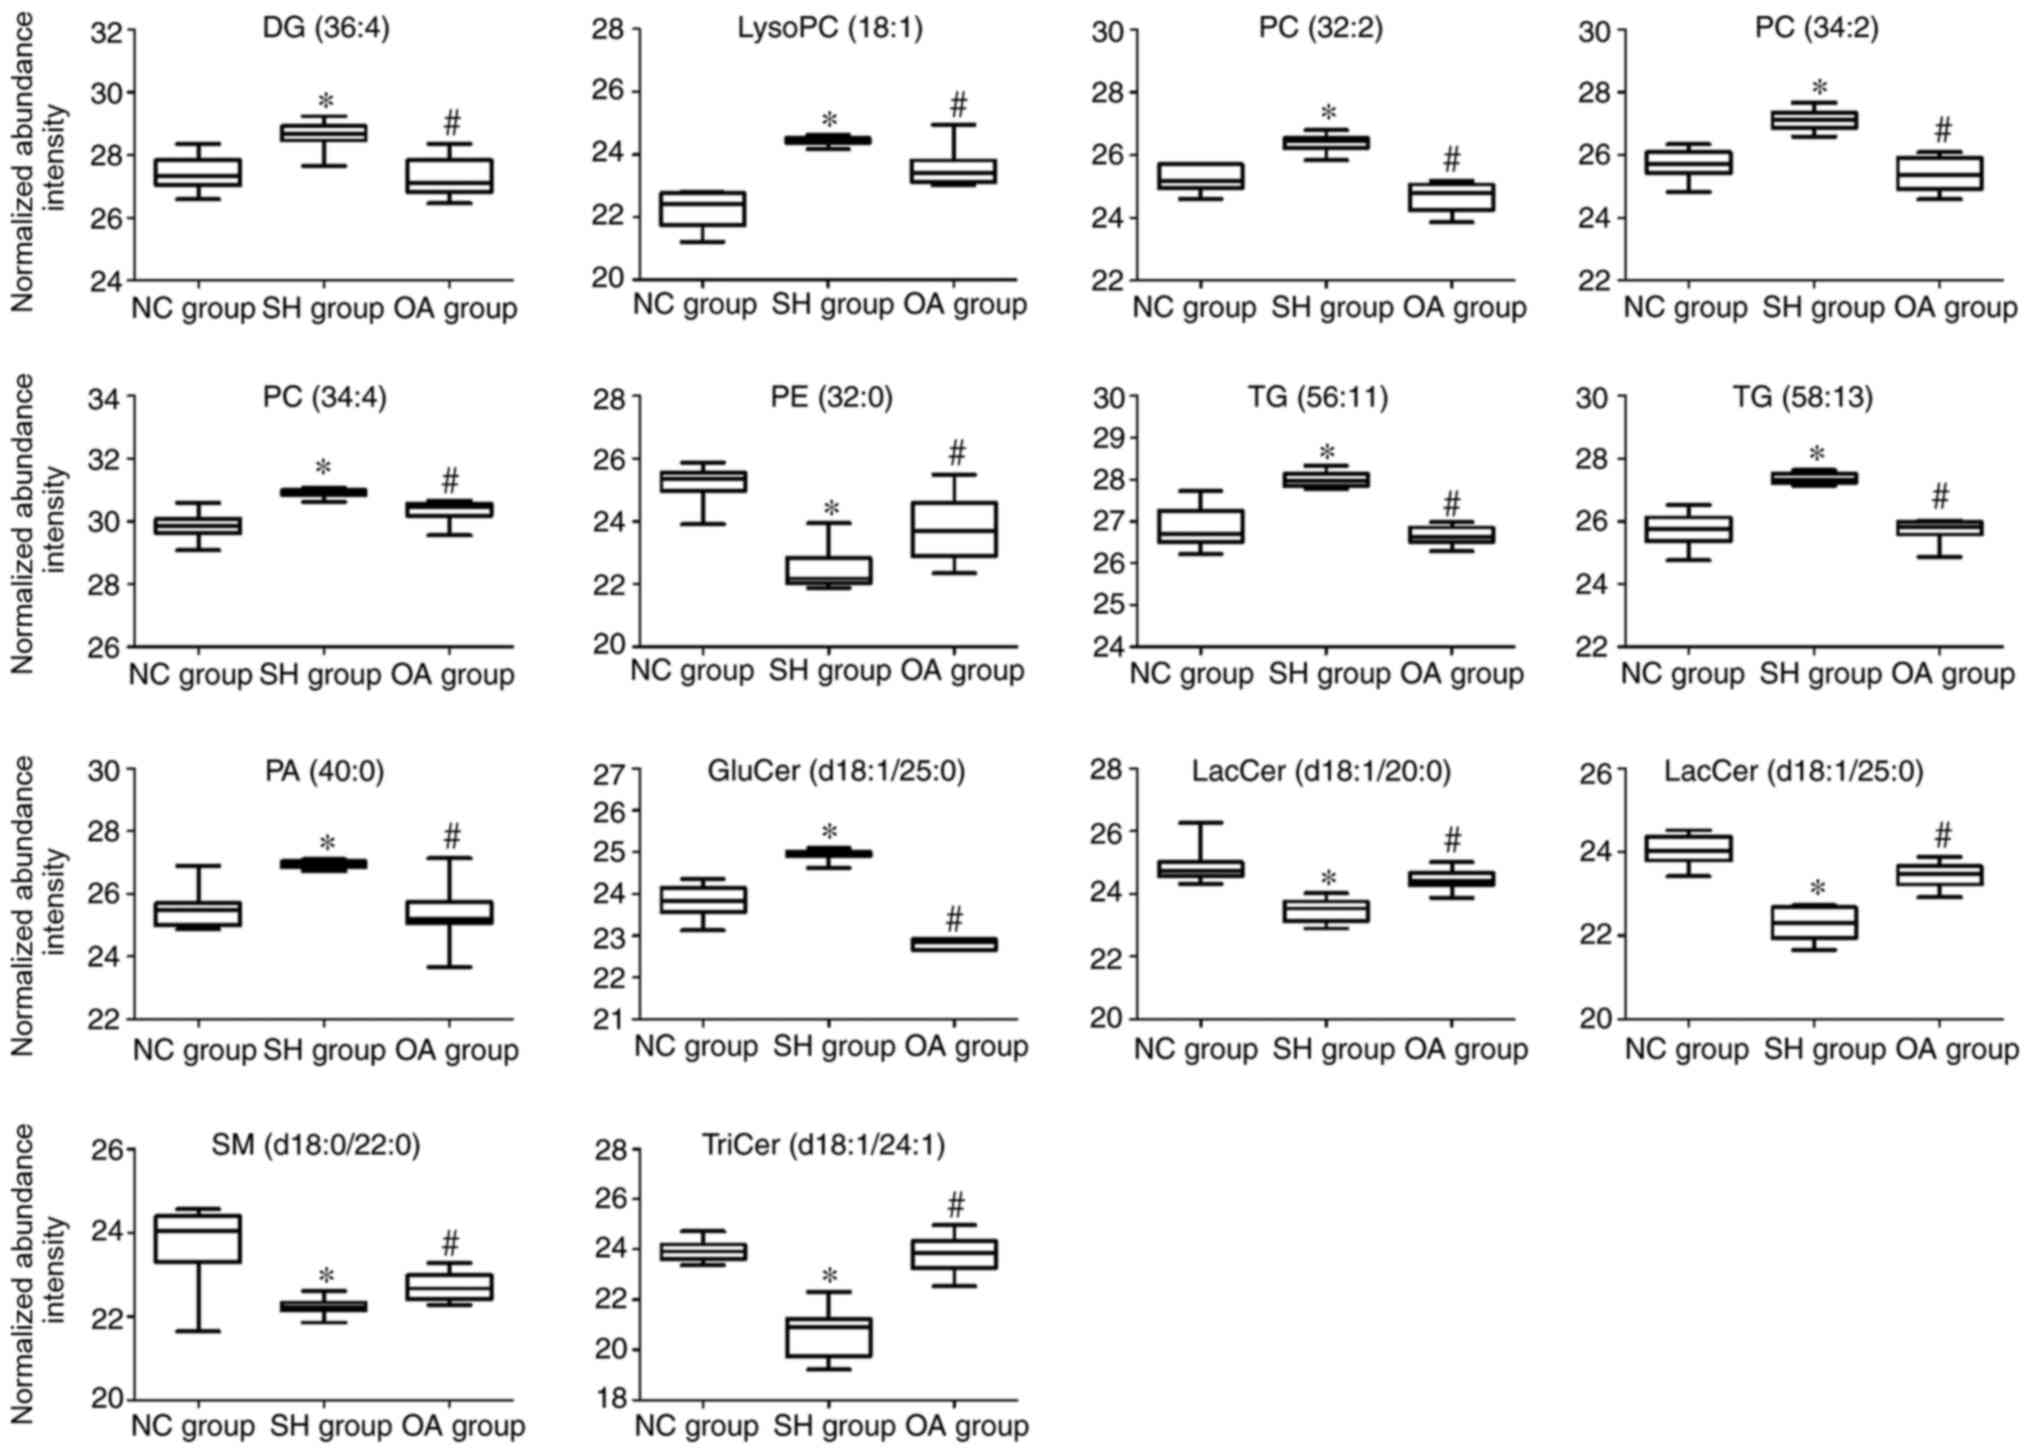 | Figure 6Box plots representing changes in
lipid biomarker levels between the NC, SH and OA groups.
*P<0.01 vs. NC group; #P<0.01 vs. OA
group. The y-axis shows the log2 normalized abundance intensity.
NC, normal control; SH, spontaneously hypertensive; OA, oleanolic
acid; LacCer, lactosylceramide; TriCer, trihexosylceramide; GluCer,
glucosylceramide; SM, sphingomyelin; PC, phosphatidylcholine; PE,
phosphatidylethanolamine; PA, phosphatidic acid; lysoPC,
lysophosphatidylcholine; DG, diglyceride; TG, triglyceride. |
PIA
PIA revealed dysregulation of eight pathways,
including 'glycerophospholipid metabolism', 'sphingolipid
metabolism', 'glycerolipid metabolism', 'linoleic acid metabolism',
'α-linolenic acid metabolism', 'glycosylphosphatidylinositol-anchor
biosynthesis', 'phosphatidylinositol signaling system' and
'arachidonic acid metabolism'. PIA of the eight pathways above is
presented in Fig. 7A and Table SIII. Fig. 7 presents that the pathways that
were responsive to hypertension were glycerophospholipid
metabolism, sphingolipid metabolism and glycerolipid metabolism.
The eight pathways were regulated by OA treatment, and may act as
targets for OA against hypertension. Additionally, eight metabolic
pathways were determined to be dysregulated in IPA based on the
quantitative enrichment analysis algorithm of MetPA (Fig. 7B) and overview of the integrated
metabolic pathway (Fig. 7C). The
false discovery rate was calculated to reduce the risk of a false
positive using an adjusted P<0.05 based on the
Benjamini-Hochberg method (88).
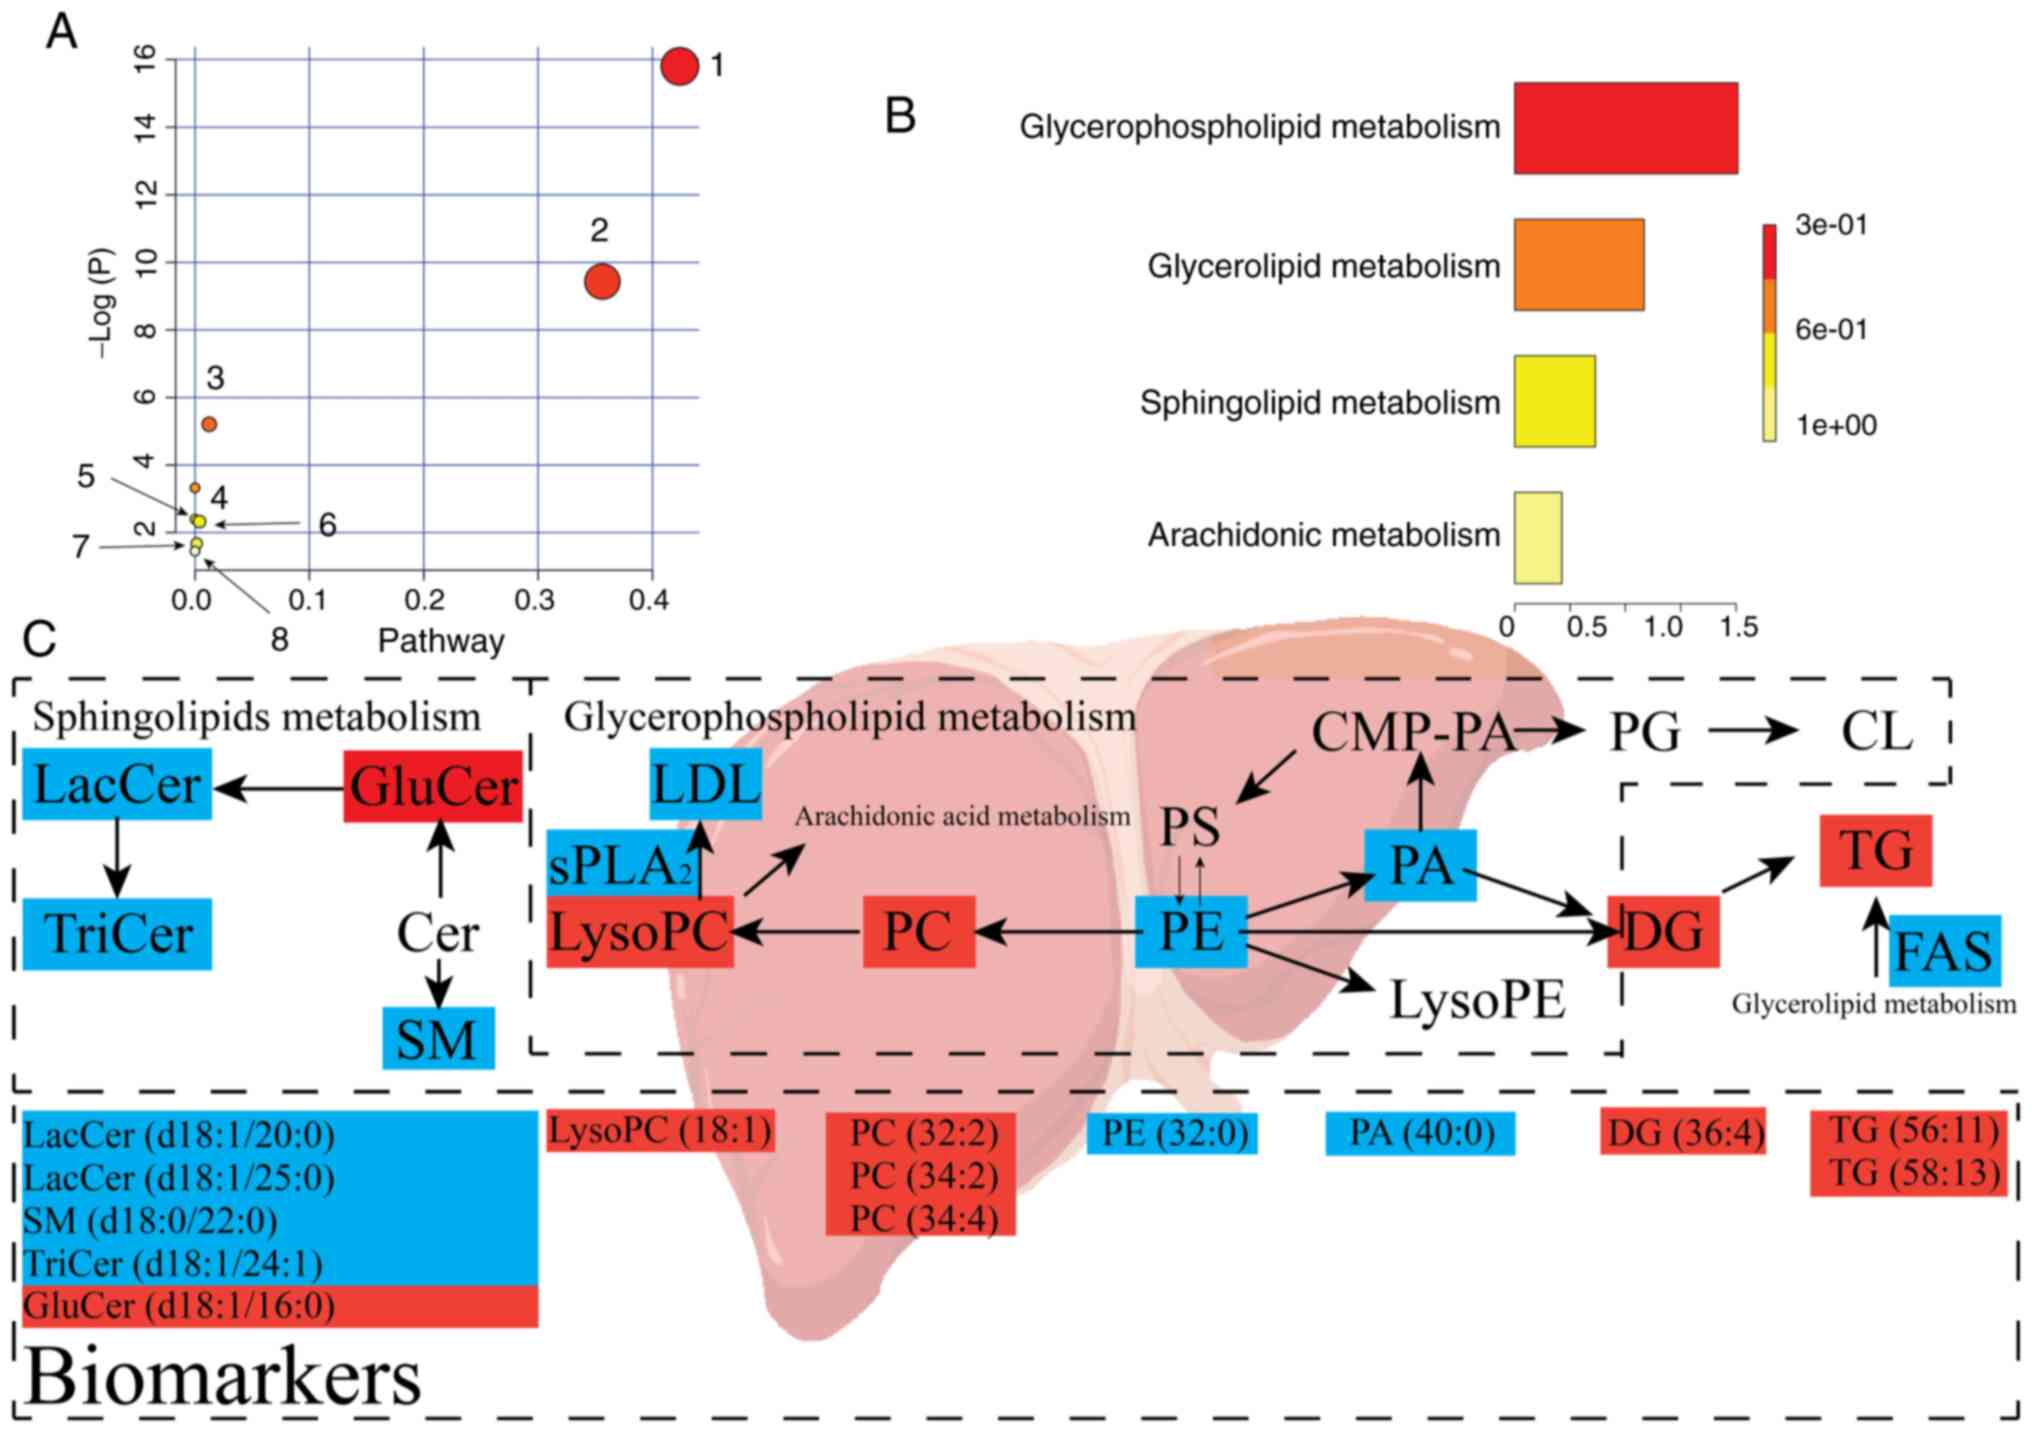 | Figure 7Lipid metabolic pathway analysis of
the identified differential lipid species. (A) Analysis of liver
lipid metabolic pathways of the identified differential lipid
species in SH rats upon treatment with oleanolic acid. The pathways
are numbered as follows: 1, sphingolipid metabolism; 2,
glycerophospholipid metabolism; 3, glycerolipid metabolism; and 4,
linoleic acid metabolism; 5, α-linolenic acid metabolism; 6,
glycosylphosphatidylinositol-anchor biosynthesis; 7,
phosphatidylinositol signaling system; 8, arachidonic acid
metabolism. (B) Quantitative enrichment analysis performed using
metabolite set enrichment analysis. (C) Lipid metabolic changes in
the development of hypertension. Upregulated metabolites are shown
in red, whereas metabolites shown in blue represent downregulated
metabolites in the SH group compared with in the NC group
(n=10/group). The treatment with OA (OA group) reversed both the
up- and down- regulated lipid species. NC, normal control; SH,
spontaneously hypertensive; LacCer, lactosylceramide; TriCer,
trihexosylceramide; GluCer, glucosylceramide; SM, sphingomyelin;
PC, phosphatidylcholine; PE, phosphatidylethanolamine; PA,
phosphatidic acid; PG, phosphatidylglycerol; PS,
phosphatidylserine; lysoPC, lysophosphatidylcholine; lysoPE,
lysophosphatidylethanolamine; CMP-PA, cytidine
monophosphate-phosphatidic acid; CL, cardiolipin; DG, diglyceride;
TG, triglyceride; LDL, low-density lipoprotein; sPLA2, secretory
phospholipase A2; FAS, fatty acid synthase. |
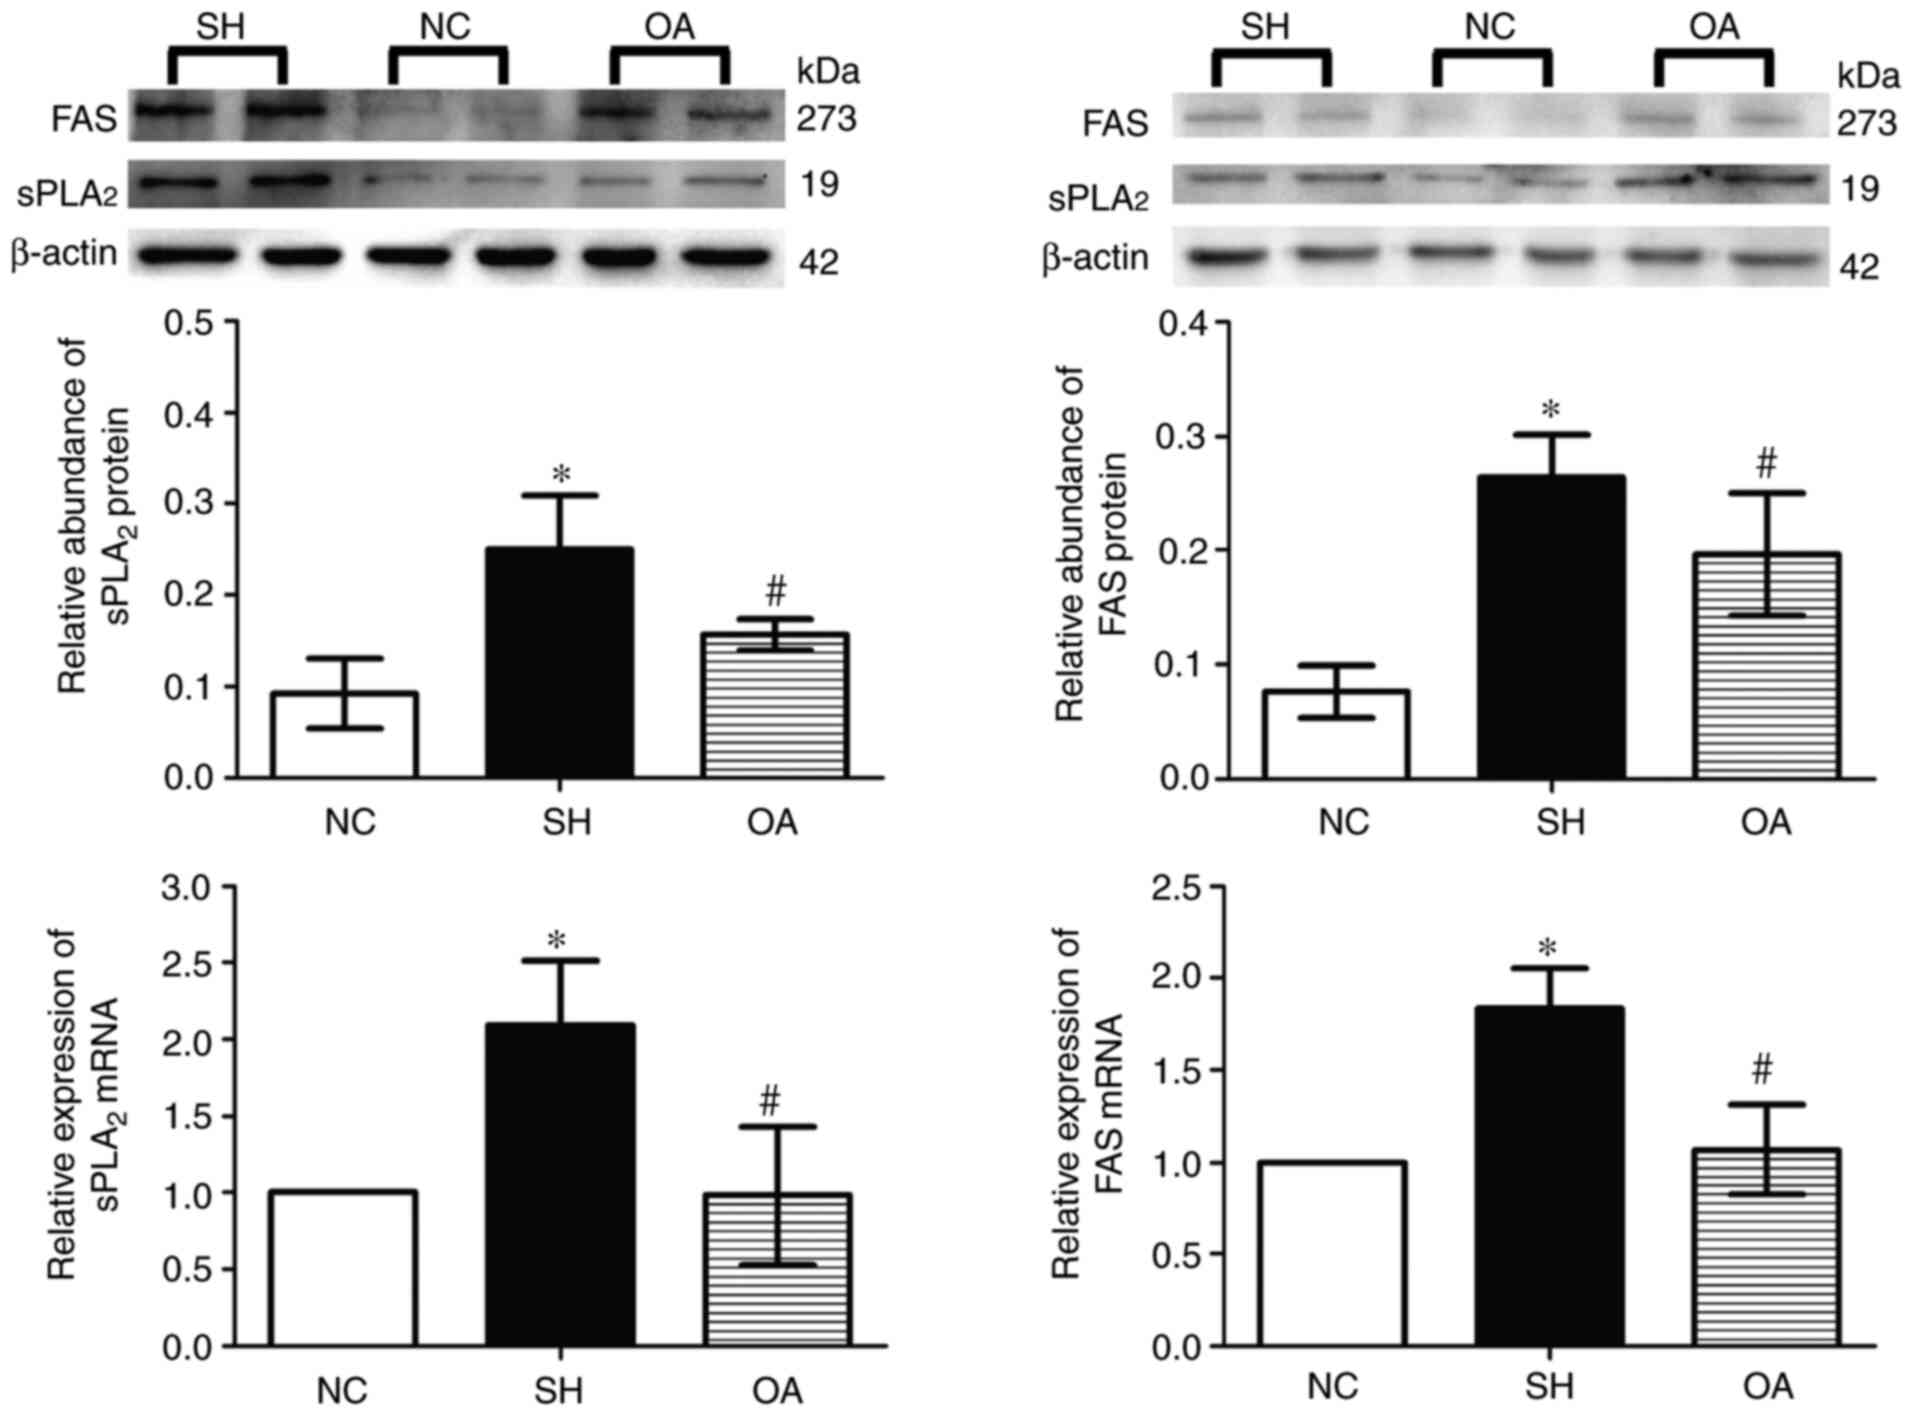
Expression of FAS and sPLA2 in
the livers of SHRs
As presented in Fig.
8, Compared with normal group, the expression levels of FAS and
sPLA2 mRNA were significantly increased in the SH group
(P<0.05). These mRNA levels were significantly reduced by OA
compared with the SH group (P<0.05). Furthermore, in SH group
the protein expression levels of sPLA2 and FAS in the
liver were increased (P<0.05) compared with those in the NC
group. OA treatment resulted in a significant decrease in
sPLA2 and FAS protein levels (P<0.05) compared with
those in the SH group.
Discussion
Hypertension has been epidemiologically proven to be
a risk factor for stroke and cardiovascular diseases (86). SHRs are known to possess lipid
metabolism abnormalities, as well as exhibiting spontaneous
hypertension (89). In the
present study, it was demonstrated that SBP and DBP in SHR rats
increased significantly with age compared with the WKY group. In
SHRs, LDL-C, HDL-C and CHOL levels were significantly lower,
whereas there was a significantly higher level of TGs.
Lipidomics analysis yields data concerning numerous
variables that are difficult to analyze according to conventional
methods. PCA is the dominant method of lipidomics analysis
(90). PLS-DA is one of the
methods that may effectively identify abnormal endogenous
substances and drug treatment targets. Using lipidomics in
conjunction with MS/MS analysis also helps to improve the accuracy
of lipid marker identification. In the present study, lipidomics
analysis was conducted, which highlighted that glycerophospholipid
metabolism and sphingolipid metabolism may serve as pathways that
could be involved in the long-term mechanisms underlying the
spontaneously hypertensive response. In addition, using lipidomics
data, it was possible to identify 14 endogenous metabolites as
potential determinants in the response to hypertension in rats. The
analyses of the candidate lipid pathways further indicated the
influence of OA on the SHRs, highlighting that treatment with OA
resulted in significant amelioration of hypertension and associated
abnormalities in lipid metabolism.
In the present study, five sphingolipid biomarkers
were selected based on univariate or multivariate statistical
analysis and MS/MS analysis. These were the main biomarkers
associated with the antihypertensive effects of OA, and they have
previously been identified in the SHR liver (91). Changes in the levels of these
sphingolipids, including significant decreases in LacCer
(d18:1/20:0), LacCer (d18:1/25:0), GluCer (d18:1/25:0), SM
(d18:0/22:0) and TriCer (d18:1/24:1), were observed in SHRs. These
results suggested that OA treatment led to a reversal of the
original alterations. A previous study showed an association
between hypertension and marked alterations in vascular
sphingolipid biology, including elevated Cer levels and signaling,
which thereby contribute to an increased vascular tone (92). Additionally, in the present study,
OA has been shown to exert marked regulatory effects on
sphingolipids. Following OA treatment, serum biochemical marker
analyses revealed that the levels of total accumulated TG were
reduced. Therefore, it is proposed that OA has antihypertensive
activity, and is able to regulate lipid metabolism disorders.
Four biomarker candidates have been identified that
may account for the effects of antihypertensive drugs; effects of
these biomarkers on the drugs captopril and valsartan in SHRs have
been identified (93-95). The emulsifying properties of PC
reduce the deposition of TGs and cholesterol on blood vessel walls
(96). Kulkarni et al
(97) suggested that a decrease
in the level of PC (34:4) may be an important cause of
hypertension. In the present study, the levels of PC (32:2), PC
(34:2) and PC (34:4) in SH group were shown to be significantly
increased compared with NC group.
LysoPCs are important biomarkers associated with
effects observed in SHRs (98).
LysoPCs, major lipid constituents of oxidized LDL, are generated
via hydrolysis of the lipid components of oxidized LDL by
lipoprotein-associated PLA2 (99,100). In the present study, the levels
of lysoPC (18:1) were increased in the SH group, but were
significantly reduced in the OA group; by contrast, lysoPC (22:6)
levels were decreased in SHRs and increased in the OA group. A
previous study demonstrated that long-chain polyunsaturated fatty
acids are more beneficial for cardiovascular disease, including
lowering blood pressure (101),
suggesting that the reduced lysoPC (18:1) levels in the SH group
may be attributable to alterations in lysoPC and PC metabolism,
leading to abnormal fatty acid metabolism.
According to a study conducted by Hu et al
(102), TGs exhibit lipotoxic
effects. An accumulation of TGs in the blood plasma was identified
in patients suffering from hypertension (27). Another study revealed that
antihypertensive drugs currently administered to patients with
hypertension only exhibit moderate effects in terms of modification
of lipid levels (21). Kulkarni
et al (97) indicated that
DG (16:0/22:5), DG (16:0/22:6) and PE (40:6) are closely linked
with hereditary hypertension. Hu et al (27) showed that the levels of plasma TGs
(C48, C50, C52, C54 and C56) trended upwards in patients with
hypertension; it was found that the levels of TGs (C53, C54, C56,
C58, C60 and C66) in the livers of patients with hypertension were
elevated compared with normal subjects. In the present study, it
was found that the levels of DG (36:4), TG (56:11) and TG (58:13)
in the SH group were significantly increased compared with the NC
group, suggesting that hypertension is associated with the
accumulation of DGs and TGs in the liver. OA regulated the
metabolism of DGs and TGs in hypertensive rats.
sPLA2 activity results in the promotion
of foam cell formation, increased proinflammatory bioactive lipid
levels and decreased HDL levels, and is an independent marker of
cardiovascular disease; inhibition of sPLA2 in SHRs has
been shown to modify LDL-C and HDL-C levels via the hydrolysis of
phospholipids (103). Therefore,
in the present study, various liver lipids and serum biochemical
markers were measured. OA treatment was shown to decrease TG levels
in the OA group compared with the SH group. Compared with the SH
group, the LDL-C levels were shown to increase in the OA group,
although no significant effects of OA on HDL-C and CHOL levels were
observed.
According to the data obtained in the present
study, LDL-C and HDL-C synthesis were both inhibited, and
cholesterol accumulation was shifted towards TGs; in the SH group,
both FAS and sPLA2 were upregulated, resulting in
accumulation of TGs and cholesterol. The present study showed that
OA downregulated the mRNA and protein levels of FAS and
sPLA2 in SHRs. The enzyme sPLA2 catalyzes the
conversion of PC into lysoPC (104). FAS is involved in de novo
lipogenesis by converting acetyl-coenzyme A into palmitate, which
is subsequently esterified into TGs in the liver (105).
In conclusion, in the present study, liver samples
of the NC, SH and OA groups were analyzed via lipidomics using
UPLC-ESI-MS/MS. Disorders in liver lipid metabolism in SHRs were
subsequently identified. Analyses implicated 14 biomarkers and
three metabolic pathways (glycerophospholipid metabolism,
sphingolipid metabolism and glycerolipid metabolism) in these
processes. All 14 biomarkers were found to be regulated by OA. The
SHRs exhibited significant increases in the levels of TGs in the
liver, and this was associated with changes in the liver
concentrations of glycerophospholipids, sphingolipids and DGs. The
changes may reflect disorders in terms of both the biosynthesis and
metabolism of glycerophospholipids and sphingolipids in SHRs.
Treatment with OA, however, was shown to result in marked
improvements in terms of blood pressure and the associated
abnormalities in the lipid metabolites.
Supplementary Data
Acknowledgments
We would like to thank the Experimental Centre of
Shandong University of Traditional Chinese Medicine for their
assistance with this study. We would also like to thank Dr
Lili-Gong and Dr Wenqing Yang for the maintenance of the
instruments used in this study, as well as Ms. Ruixue Yu and Ms.
Ana Liu for their technical support.
Funding
This study was supported by foundation from the
National Natural Science Foundation of China (grant no. 81774173),
Youth Innovation and Technology Program for the Universities of
Shandong Province (grant no. 2019KJM005), Key Technology Research
and Development Program of Shandong Province (grant no.
2018GSF119007), Natural Science Foundation of Shandong Province
(Major Basic Research Projects; grant no. ZR2018ZC1157) and
University Science and Technology Program of Shandong Province
(grant no. J17KZ004).
Availability of data and materials
The datasets used and/or analyzed during the
current study are available from the corresponding author on
reasonable request.
Authors' contributions
YL and HJ designed the study. SZ, YL and DQ
performed experiments. SZ, YL, ZT, XW, DQ, HJ and YL analyzed the
data. YL supervised the design and data interpretation. The
manuscript was drafted by SZ, YL, DQ and HJ, and edited by SZ. All
authors discussed the results and commented on the manuscript. All
authors read and approved the final manuscript.
Ethics approval and consent to
participate
The study was approved by the Animal Care and
Ethics Committee of Shandong University of Traditional Chinese
Medicine (approval no. SDUTCM2018120301).
Patient consent for publication
Not applicable.
Competing interests
The authors declare that they have no competing
interests.
References
|
1
|
Liu J: Pharmacology of oleanolic acid and
ursolic acid. J Ethnopharmacol. 49:57–68. 1995. View Article : Google Scholar : PubMed/NCBI
|
|
2
|
Somova LO, Nadar A, Rammanan P and Shode
FO: Cardiovascular, antihyperlipidemic and antioxidant effects of
oleanolic and ursolic acids in experimental hypertension.
Phytomedicine. 10:115–121. 2003. View Article : Google Scholar : PubMed/NCBI
|
|
3
|
Tsai SJ and Yin MC: Antioxidative and
anti-inflammatory protection of oleanolic acid and ursolic acid in
PC12 cells. J Food Sci. 73:H174–H178. 2008. View Article : Google Scholar : PubMed/NCBI
|
|
4
|
Jesus JA, Lago JH, Laurenti MD, Yamamoto
ES and Passero LF: Antimicrobial activity of oleanolic and ursolic
acids: An update. Evid Based Complement Alternat Med.
2015:6204722015. View Article : Google Scholar : PubMed/NCBI
|
|
5
|
Rohilla S and Bhatt DC: Significance of
hepatoprotective liver specific targeted drug delivery: A review on
novel herbal and formulation approaches in the management of
hepatotoxicity. Curr Drug Targets. 19:1519–1549. 2018. View Article : Google Scholar : PubMed/NCBI
|
|
6
|
Potočnjak I, Šimić L, Vukelić I and
Domitrović R: Oleanolic acid attenuates cisplatin-induced
nephrotoxicity in mice and chemo-sensitizes human cervical cancer
cells to cisplatin cytotoxicity. Food Chem Toxicol. 132:1106762019.
View Article : Google Scholar
|
|
7
|
Raphael TJ and Kuttan G: Effect of
naturally occurring triterpenoids glycyrrhizic acid, ursolic acid,
oleanolic acid and nomilin on the immune system. Phytomedicine.
10:483–489. 2003. View Article : Google Scholar : PubMed/NCBI
|
|
8
|
Somova LI, Shode FO and Mipando M:
Cardiotonic and antidys-rhythmic effects of oleanolic and ursolic
acids, methyl maslinate and uvaol. Phytomedicine. 11:121–129. 2004.
View Article : Google Scholar : PubMed/NCBI
|
|
9
|
Bachhav SS, Bhutada MS, Patil SP, Sharma
KS and Patil SD: Oleanolic acid prevents increase in blood pressure
and nephrotoxicity in nitric oxide dependent type of hypertension
in rats. Pharmacognosy Res. 7:385–392. 2014.PubMed/NCBI
|
|
10
|
Yu R, Yang W, Qi D, Gong L, Li C, Li Y and
Jiang H: Targeted neurotransmitter metabolomics profiling of
oleanolic acid in the treatment of spontaneously hypertensive rats.
RSC Adv. 9:23276–23288. 2019. View Article : Google Scholar
|
|
11
|
Bachhav SS, Patil SD, Bhutada MS and
Surana SJ: Oleanolic acid prevents glucocorticoid-induced
hypertension in rats. Phyther Res. 25:1435–1439. 2011. View Article : Google Scholar
|
|
12
|
Madlala HP, Van Heerden FR, Mubagwa K and
Musabayane CT: Changes in renal function and oxidative status
associated with the hypotensive effects of oleanolic acid and
related synthetic derivatives in experimental animals. PLoS One.
10:e01281922015. View Article : Google Scholar : PubMed/NCBI
|
|
13
|
Somova LI, Shode FO, Ramnanan P and Nadar
A: Antihypertensive, antiatherosclerotic and antioxidant activity
of triterpenoids isolated from Olea europaea, subspecies africana
leaves. J Ethnopharmacol. 84:299–305. 2003. View Article : Google Scholar : PubMed/NCBI
|
|
14
|
Liao HH, Zhang N, Feng H, Zhang N, Ma ZG,
Yang Z, Yuan Y, Bian ZY and Tang QZ: Oleanolic acid alleviated
pressure overload-induced cardiac remodeling. Mol Cell Biochem.
409:145–154. 2015. View Article : Google Scholar : PubMed/NCBI
|
|
15
|
Ahn YM, Choi YH, Yoon JJ, Lee YJ, Cho KW,
Kang DG and Lee HS: Oleanolic acid modulates the renin-angiotensin
system and cardiac natriuretic hormone concomitantly with volume
and pressure balance in rats. Eur J Pharmacol. 809:231–241. 2017.
View Article : Google Scholar : PubMed/NCBI
|
|
16
|
Madlala HP, Metzinger T, Van Heerden FR,
Musabayane CT, Mubagwa K and Dessy C: Vascular
endothelium-dependent and independent actions of oleanolic acid and
its synthetic oleanane derivatives as possible mechanisms for
hypotensive effects. PLoS One. 11:e01473952016. View Article : Google Scholar : PubMed/NCBI
|
|
17
|
Marteau JB, Zaiou M, Siest G and
Visvikis-Siest S: Genetic determinants of blood pressure
regulation. J Hypertens. 23:2127–2143. 2005. View Article : Google Scholar : PubMed/NCBI
|
|
18
|
Bacon SL, Sherwood A, Hinderliter A and
Blumenthal JA: Effects of exercise, diet and weight loss on high
blood pressure. Sports Med. 34:307–316. 2004. View Article : Google Scholar : PubMed/NCBI
|
|
19
|
Hinterwirth H, Stegemann C and Mayr M:
Lipidomics Quest for molecular lipid biomarkers in cardiovascular
disease. Circ Cardiovasc Genet. 7:941–954. 2014. View Article : Google Scholar : PubMed/NCBI
|
|
20
|
Tian Y, Jiang F, Li Y, Jiang H, Chu Y, Zhu
L and Guo W: Evaluation of the anti-hypertensive effect of Tengfu
Jiangya tablet by combination of UPLC-Q-exactive-MS-based
metabolomics and iTRAQ-based proteomics technology. Biomed
Pharmacother. 100:324–334. 2018. View Article : Google Scholar : PubMed/NCBI
|
|
21
|
Tian Z, Zhang S, Wang H, Chen Z, Sun M,
Sun L, Gong L, Li Y and Jiang H: Intervention of uncaria and its
components on liver lipid metabolism in spontaneously hypertensive
rats. Front Pharmacol. 11:9102020. View Article : Google Scholar :
|
|
22
|
Kerage D, Brindley DN and Hemmings DG:
Review: Novel insights into the regulation of vascular tone by
sphingosine 1-phosphate. Placenta. 35(Suppl): S86–S92. 2014.
View Article : Google Scholar : PubMed/NCBI
|
|
23
|
Cogolludo A, Villamor E, Perez-Vizcaino F
and Moreno L: Ceramide and regulation of vascular tone. Int J Mol
Sci. 20:4112019. View Article : Google Scholar :
|
|
24
|
Spijkers LJ, van den Akker RF, Janssen BJ,
Debets JJ, De Mey JG, Stroes ES, van den Born BJ, Wijesinghe DS,
Chalfant CE, MacAleese L, et al: Hypertension is associated with
marked alterations in sphingolipid biology: A potential role for
ceramide. PLoS One. 6:e218172011. View Article : Google Scholar : PubMed/NCBI
|
|
25
|
Graessler J, Schwudke D, Schwarz PE,
Herzog R, Shevchenko A and Bornstein SR: Top-down lipidomics
reveals ether lipid deficiency in blood plasma of hypertensive
patients. PLoS One. 4:e62612009. View Article : Google Scholar : PubMed/NCBI
|
|
26
|
Liu A, Chu YJ, Wang X, Yu R, Jiang H, Li
Y, Zhou H, Gong LL, Yang WQ and Ju J: Serum metabolomics study
based on LC-MS and antihypertensive effect of uncaria on
spontaneously hypertensive rats. Evidence-based Complement Altern
Med. 2018:92819462018. View Article : Google Scholar
|
|
27
|
Hu C, Kong H, Qu F, Li Y, Yu Z, Gao P,
Peng S and Xu G: Application of plasma lipidomics in studying the
response of patients with essential hypertension to
antihypertensive drug therapy. Mol Biosyst. 7:3271–3279. 2011.
View Article : Google Scholar : PubMed/NCBI
|
|
28
|
Pyttel S, Zschörnig K, Nimptsch A, Paasch
U and Schiller J: Enhanced lysophosphatidylcholine and
sphingomyelin contents are characteristic of spermatozoa from obese
men-A MALDI mass spectrometric study. Chem Phys Lipids.
165:861–865. 2012. View Article : Google Scholar : PubMed/NCBI
|
|
29
|
Law SH, Chan ML, Marathe GK, Parveen F,
Chen CH and Ke LY: An updated review of lysophosphatidylcholine
metabolism in human diseases. Int J Mol Sci. 20:11492019.
View Article : Google Scholar :
|
|
30
|
Sun GY, Shelat PB, Jensen MB, He Y, Sun AY
and Simonyi A: Phospholipases A2 and inflammatory responses in the
central nervous system. Neuromolecular Med. 12:133–148. 2010.
View Article : Google Scholar
|
|
31
|
Lara-Castro C and Garvey WT: Intracellular
lipid accumulation in liver and muscle and the insulin resistance
syndrome. Endocrinol Metab Clin North Am. 37:841–856. 2008.
View Article : Google Scholar : PubMed/NCBI
|
|
32
|
Erion DM and Shulman GI:
Diacylglycerol-mediated insulin resistance. Nat Med. 16:400–402.
2010. View Article : Google Scholar : PubMed/NCBI
|
|
33
|
Ke C, Zhu X, Zhang Y and Shen Y:
Metabolomic characterization of hypertension and dyslipidemia.
Metabolomics. 14:1172018. View Article : Google Scholar
|
|
34
|
Kawamoto R, Tabara Y, Kohara K, Kusunoki
T, Abe M and Miki T: Interaction between serum uric acid and
triglycerides in relation to prehypertension in community-dwelling
Japanese adults. Clin Exp Hypertens. 36:64–69. 2014. View Article : Google Scholar
|
|
35
|
Shimizu Y, Sato S, Koyamatsu J, Yamanashi
H, Nagayoshi M, Kadota K, Kawashiri SY, Inoue K, Nagata Y and Maeda
T: Platelets and circulating CD34-positive cells as an indicator of
the activity of the vicious cycle between hypertension and
endothelial dysfunction in elderly Japanese men. Atherosclerosis.
259:26–31. 2017. View Article : Google Scholar : PubMed/NCBI
|
|
36
|
Borghi C, Dormi A, Veronesi M, Sangiorgi Z
and Gaddi A; Brisighella Heart Study Working Party: Association
between different lipid-lowering treatment strategies and blood
pressure control in the Brisighella heart study. Am Heart J.
148:285–292. 2004. View Article : Google Scholar : PubMed/NCBI
|
|
37
|
Kintscher U, Marx N, Martus P, Stoppelhaar
M, Schimkus J, Schneider A, Walcher D, Kümmel A, Winkler R, Kappert
K, et al: Effect of high-dose valsartan on inflammatory and lipid
parameters in patients with Type 2 diabetes and hypertension.
Diabetes Res Clin Pract. 89:209–215. 2010. View Article : Google Scholar : PubMed/NCBI
|
|
38
|
Sarkar K, Sinha AK and Mehta JL: The role
of statins in endothelial dysfunction in hypertension. Curr Opin
Cardiol. 21:316–321. 2006. View Article : Google Scholar : PubMed/NCBI
|
|
39
|
Jacobson TA and Zimmerman FH: Fibrates in
combination with statins in the management of dyslipidemia. J Clin
Hypertens. 8:35–43. 2006. View Article : Google Scholar
|
|
40
|
Wierzbicki AS: Lipid lowering: Another
method of reducing blood pressure? J Hum Hypertens. 16:753–760.
2002. View Article : Google Scholar : PubMed/NCBI
|
|
41
|
Kwong E, Li Y, Hylemon PB and Zhou H: Bile
acids and sphin-gosine-1-phosphate receptor 2 in hepatic lipid
metabolism. Acta Pharm Sin B. 5:151–157. 2015. View Article : Google Scholar : PubMed/NCBI
|
|
42
|
Chen H, Chen L, Liu D, Chen DQ, Vaziri ND,
Yu XY, Zhang L, Su W, Bai X and Zhao YY: Combined clinical
phenotype and lipidomic analysis reveals the impact of chronic
kidney disease on lipid metabolism. J Proteome Res. 16:1566–1578.
2017. View Article : Google Scholar : PubMed/NCBI
|
|
43
|
Walther A, Cannistraci CV, Simons K, Durán
C, Gerl MJ, Wehrli S and Kirschbaum C: Lipidomics in major
depressive disorder. Front Psychiatry. 9:4592018. View Article : Google Scholar : PubMed/NCBI
|
|
44
|
Zhuang X, Deng ZB, Mu J, Zhang L, Yan J,
Miller D, Feng W, McClain CJ and Zhang HG: Ginger-derived
nanoparticles protect against alcohol-induced liver damage. J
Extracell Vesicles. 4:287132015. View Article : Google Scholar : PubMed/NCBI
|
|
45
|
Nguyen P, Leray V, Diez M, Serisier S, Le
Bloc'h J, Siliart B and Dumon H: Liver lipid metabolism. J Anim
Physiol Anim Nutr (Berl). 92:272–283. 2008. View Article : Google Scholar
|
|
46
|
Xie J, Jiang HQ, Li YL, Nie L, Zhou HL and
Yang WQ: Study on the intervention effects of pinggan prescription
() on spontaneously hypertensive rats based on metabonomic and
pharmacodynamic methods. Chin J Integr Med. 25:348–353. 2019.
View Article : Google Scholar
|
|
47
|
Biernacki M, Ambrożewicz E, Gęgotek A,
Toczek M and Skrzydlewska E: Long-term administration of fatty acid
amide hydrolase inhibitor (URB597) to rats with spontaneous
hypertension disturbs liver redox balance and phospholipid
metabolism. Adv Med Sci. 64:15–23. 2019. View Article : Google Scholar
|
|
48
|
Bourbon NA, Sandirasegarane L and Kester
M: Ceramide-induced inhibition of Akt is mediated through protein
kinase Czeta: Implications for growth arrest. J Biol Chem.
277:3286–3292. 2002. View Article : Google Scholar
|
|
49
|
Mulders ACM, Mathy MJ, Meyer zu Heringdorf
D, ter Braak M, Hajji N, Olthof DC, Michel MC, Alewijnse AE and
Peters SL: Activation of sphingosine kinase by muscarinic receptors
enhances NO-mediated and attenuates EDHF-mediated vasorelaxation.
Basic Res Cardiol. 104:50–59. 2009. View Article : Google Scholar
|
|
50
|
Mulders ACM, Hendriks-Balk MC, Mathy MJ,
Michel MC, Alewijnse AE and Peters SLM: Sphingosine
kinase-dependent activation of endothelial nitric oxide synthase by
angiotensin II. Arterioscler Thromb Vasc Biol. 26:2043–2048. 2006.
View Article : Google Scholar : PubMed/NCBI
|
|
51
|
Brown WJ, Chambers K and Doody A:
Phospholipase A2 (PLA2) enzymes in membrane trafficking: Mediators
of membrane shape and function. Traffic. 4:214–221. 2003.
View Article : Google Scholar : PubMed/NCBI
|
|
52
|
Cole LK, Vance JE and Vance DE:
Phosphatidylcholine biosynthesis and lipoprotein metabolism.
Biochim Biophys Acta. 1821:754–761. 2012. View Article : Google Scholar
|
|
53
|
Benrezzouk R, Terencio MC, Ferrándiz ML,
San Feliciano A, Gordaliza M, Miguel del Corral JM, de la Puente ML
and Alcaraz MJ: Inhibition of human sPLA2 and 5-lipoxygenase
activities by two neoclerodane diterpenoids. Life Sci.
64:PL205–PL211. 1999. View Article : Google Scholar
|
|
54
|
Mallat Z, Lambeau G and Tedgui A:
Lipoprotein-associated and secreted phospholipases A2 in
cardiovascular disease: Roles as biological effectors and
biomarkers. Circulation. 122:2183–2200. 2010. View Article : Google Scholar : PubMed/NCBI
|
|
55
|
Boekholdt SM, Keller TT, Wareham NJ, Luben
R, Bingham SA, Day NE, Sandhu MS, Jukema JW, Kastelein JJ, Hack CE
and Khaw KT: Serum levels of type II secretory phospholipase A2 and
the risk of future coronary artery disease in apparently healthy
men and women: The EPIC-Norfolk prospective population study.
Arterioscler Thromb Vasc Biol. 25:839–846. 2005. View Article : Google Scholar : PubMed/NCBI
|
|
56
|
Hurt-Camejo E, Camejo G, Peilot H, Oörni K
and Kovanen P: Phospholipase A(2) in vascular disease. Circ Res.
89:298–304. 2001. View Article : Google Scholar : PubMed/NCBI
|
|
57
|
Rosengren B, Peilot H, Umaerus M,
Jönsson-Rylander AC, Mattsson-Hultén L, Hallberg C, Cronet P,
Rodriguez-Lee M and Hurt-Camejo E: Secretory phospholipase A2 group
V: Lesion distribution, activation by arterial proteoglycans, and
induction in aorta by a Western diet. Arterioscler Thromb Vasc
Biol. 26:1579–1585. 2006. View Article : Google Scholar : PubMed/NCBI
|
|
58
|
Sonoki K, Iwase M, Sasaki N, Ohdo S,
Higuchi S, Takata Y and Iida M: Secretory PLA2 inhibitor indoxam
suppresses LDL modification and associated inflammatory responses
in TNFalpha-stimulated human endothelial cells. Br J Pharmacol.
153:1399–1408. 2008. View Article : Google Scholar : PubMed/NCBI
|
|
59
|
Guardiola M, Exeter HJ, Perret C,
Folkersen L, Van't Hooft F, Eriksson P, Franco-Cereceda A,
Paulsson-Berne G, Palmen J, Li K, et al: PLA2G10 gene variants,
sPLA2 activity, and coronary heart disease risk. Circ Cardiovasc
Genet. 8:356–362. 2015. View Article : Google Scholar : PubMed/NCBI
|
|
60
|
Kume N and Gimbrone MA Jr:
Lysophosphatidylcholine transcriptionally induces growth factor
gene expression in cultured human endothelial cells. J Clin Invest.
93:907–911. 1994. View Article : Google Scholar : PubMed/NCBI
|
|
61
|
Jensen-Urstad APL and Semenkovich CF:
Fatty acid synthase and liver triglyceride metabolism: Housekeeper
or messenger? Biochim Biophys Acta. 1821:747–753. 2012. View Article : Google Scholar :
|
|
62
|
Iizuka K, Miller B and Uyeda K: Deficiency
of carbohydrate-activated transcription factor ChREBP prevents
obesity and improves plasma glucose control in leptin-deficient
(ob/ob) mice. Am J Physiol Endocrinol Metab. 291:E358–E364. 2006.
View Article : Google Scholar : PubMed/NCBI
|
|
63
|
Scott CL: Diagnosis, prevention, and
intervention for the meta-bolic syndrome. Am J Cardiol. 92:35i–42i.
2003. View Article : Google Scholar
|
|
64
|
Berndt J, Kovacs P, Ruschke K, Klöting N,
Fasshauer M, Schön MR, Körner A, Stumvoll M and Blüher M: Fatty
acid synthase gene expression in human adipose tissue: Association
with obesity and type 2 diabetes. Diabetologia. 50:1472–1480. 2007.
View Article : Google Scholar : PubMed/NCBI
|
|
65
|
Mayas MD, Ortega FJ, Macías-González M,
Bernal R, Gómez-Huelgas R, Fernández-Real JM and Tinahones FJ:
Inverse relation between FASN expression in human adipose tissue
and the insulin resistance level. Nutr Metab (Lond). 7:32010.
View Article : Google Scholar
|
|
66
|
Suzuki T, Muramatsu T, Morioka K, Goda T
and Mochizuki K: ChREBP binding and histone modifications modulate
hepatic expression of the Fasn gene in a metabolic syndrome rat
model. Nutrition. 31:877–883. 2015. View Article : Google Scholar : PubMed/NCBI
|
|
67
|
Nedvedova I, Kolar D, Neckar J, Kalous M,
Pravenec M, Šilhavý J, Korenkova V, Kolar F and Zurmanova JM:
Cardioprotective regimen of adaptation to chronic hypoxia diversely
alters myocardial gene expression in SHR and SHR-mtBN
conplastic rat strains. Front Endocrinol (Lausanne). 9:8092019.
View Article : Google Scholar
|
|
68
|
German JB, Gillies LA, Smilowitz JT,
Zivkovic AM and Watkins SM: Lipidomics and lipid profiling in
metabolomics. Curr Opin Lipidol. 18:66–71. 2007.PubMed/NCBI
|
|
69
|
Yang K and Han X: Lipidomics: Techniques,
applications, and outcomes related to biomedical sciences. Trends
Biochem Sci. 41:954–969. 2016. View Article : Google Scholar : PubMed/NCBI
|
|
70
|
Lapthorn C, Pullen F and Chowdhry BZ: Ion
mobility spec-trometrymass spectrometry (IMS-MS) of small
molecules: Separating and assigning structures to ions. Mass
Spectrom Rev. 32:43–71. 2013. View Article : Google Scholar
|
|
71
|
Martano G, Leone M, D'Oro P, Matafora V,
Cattaneo A, Masseroli M and Bachi A: SMfinder: Small molecules
finder for metabolomics and lipidomics analysis. Anal Chem.
92:8874–8882. 2020. View Article : Google Scholar : PubMed/NCBI
|
|
72
|
National Research Council (US) Committee
for the Update of the Guide for the Care and Use of Laboratory
Animals: Guide for the Care and Use of Laboratory Animals. 8th
edition. National Academies Press; Washington, DC: 2011
|
|
73
|
Jones KE and Bennett DJ: Motor axon
excitability measures in the rat tail are the same awake or
anaesthetized using sodium pentobarbital. bioRxiv: doi: https://doi.org/10.1101/651927urisimplehttps://doi.org/10.1101/651927.
|
|
74
|
Ma N, Yang Y, Liu X, Kong X, Li S, Qin Z,
Jiao Z and Li J: UPLC-Q-TOF/MS-based metabonomic studies on the
intervention effects of aspirin eugenol ester in atherosclerosis
hamsters. Sci Rep. 7:105442017. View Article : Google Scholar :
|
|
75
|
Iverson SJ, Lang SLC and Cooper MH:
Comparison of the bligh and dyer and folch methods for total lipid
determination in a broad range of marine tissue. Lipids.
36:1283–1287. 2001. View Article : Google Scholar
|
|
76
|
Milne S, Ivanova P, Forrester J and Alex
Brown H: Lipidomics: An analysis of cellular lipids by ESI-MS.
Methods. 39:92–103. 2006. View Article : Google Scholar : PubMed/NCBI
|
|
77
|
Søreide K: Receiver-operating
characteristic curve analysis in diagnostic, prognostic and
predictive biomarker research. J Clin Pathol. 62:1–5. 2009.
View Article : Google Scholar
|
|
78
|
Blaise BJ, Gouel-Chéron A, Floccard B,
Monneret G and Allaouchiche B: Metabolic phenotyping of traumatized
patients reveals a susceptibility to sepsis. Anal Chem.
85:10850–10855. 2013. View Article : Google Scholar : PubMed/NCBI
|
|
79
|
Greiner M, Pfeiffer D and Smith RD:
Principles and practical application of the receiver-operating
characteristic analysis for diagnostic tests. Prev Vet Med.
45:23–41. 2000. View Article : Google Scholar : PubMed/NCBI
|
|
80
|
Miao H, Zhao YH, Vaziri ND, Tang DD, Chen
H, Chen H, Khazaeli M, Tarbiat-Boldaji M, Hatami L and Zhao YY:
Lipidomics biomarkers of diet-induced hyperlipidemia and its
treatment with poria cocos. J Agric Food Chem. 64:969–979. 2016.
View Article : Google Scholar : PubMed/NCBI
|
|
81
|
Xia J, Mandal R, Sinelnikov IV, Broadhurst
D and Wishart DS: MetaboAnalyst 2.0-a comprehensive server for
metabolomic data analysis. Nucleic Acids Res. 40(Web Server Issue):
W127–W133. 2012. View Article : Google Scholar : PubMed/NCBI
|
|
82
|
Benjamini Y and Hochberg Y: Controlling
the false discovery rate: A practical and powerful approach to
multiple testing. J R Stat Soc Ser B. 57:289–300. 1995.
|
|
83
|
Livak KJ and Schmittgen TD: Analysis of
relative gene expression data using real-time quantitative PCR and
the 2(-Delta Delta C(T)) method. Methods. 25:402–408. 2001.
View Article : Google Scholar
|
|
84
|
Zor T and Selinger Z: Linearization of the
Bradford protein assay increases its sensitivity: Theoretical and
experimental studies. Anal Biochem. 236:302–308. 1996. View Article : Google Scholar : PubMed/NCBI
|
|
85
|
Yang C, Yuan W, Yang X, Li P, Wang J, Han
J, Tao J, Li P, Yang H, Lv Q and Zhang W: Circular RNA circ-ITCH
inhibits bladder cancer progression by sponging miR-17/miR-224 and
regulating p21, PTEN expression. Mol Cancer. 17:192018. View Article : Google Scholar : PubMed/NCBI
|
|
86
|
Zhang R, Inagawa H, Kazumura K, Tsuchiya
H, Miwa T, Morishita N, Uchibori S, Hanashiro J, Masaki T, Kobara H
and Soma GI: Evaluation of a hypertensive rat model using
peripheral blood neutrophil activity, phagocytic activity and
oxidized LDL evaluation. Anticancer Res. 38:4289–4294. 2018.
View Article : Google Scholar : PubMed/NCBI
|
|
87
|
Yin J, Xie J, Guo X, Ju L, Li Y and Zhang
Y: Plasma metabolic profiling analysis of cyclophosphamide-induced
cardiotoxicity using metabolomics coupled with UPLC/Q-TOF-MS and
ROC curve. J Chromatogr B Anal Technol Biomed Life Sci.
1033-1034:428–435. 2016. View Article : Google Scholar
|
|
88
|
Kind T, Cho E, Park TD, Deng N, Liu Z, Lee
T, Fiehn O and Kim J: Interstitial cystitis-associated urinary
metabolites identified by mass-spectrometry based metabolomics
analysis. Sci Rep. 6:392272016. View Article : Google Scholar : PubMed/NCBI
|
|
89
|
Girard A, Madani S, Boukortt F,
Cherkaoui-Malki M, Belleville J and Prost J: Fructose-enriched diet
modifies antioxidant status and lipid metabolism in spontaneously
hypertensive rats. Nutrition. 22:758–766. 2006. View Article : Google Scholar : PubMed/NCBI
|
|
90
|
Dutta M, Joshi M, Srivastava S, Lodh I,
Chakravarty B and Chaudhury K: A metabonomics approach as a means
for identification of potential biomarkers for early diagnosis of
endometriosis. Mol Biosyst. 8:3281–3287. 2012. View Article : Google Scholar : PubMed/NCBI
|
|
91
|
Jiang H, Shen Z, Chu Y, Li Y, Li J, Wang
X, Yang W, Zhang X, Ju J, Xu J and Yang C: Serum metabolomics
research of the anti-hypertensive effects of Tengfu Jiangya tablet
on spontaneously hypertensive rats. J Chromatogr B Anal Technol
Biomed Life Sci. 1002:210–217. 2015. View Article : Google Scholar
|
|
92
|
Fenger M, Linneberg A and Jeppesen J:
Network-based analysis of the sphingolipid metabolism in
hypertension. Front Genet. 6:842015. View Article : Google Scholar : PubMed/NCBI
|
|
93
|
Penna C, Tullio F, Moro F, Folino A,
Merlino A and Pagliaro P: Effects of a protocol of ischemic
postconditioning and/or capto-pril in hearts of normotensive and
hypertensive rats. Basic Res Cardiol. 105:181–192. 2010. View Article : Google Scholar
|
|
94
|
Lin CH, Lee SY, Zhang CC, Du YF, Hung HC,
Wu HT and Ou HY: Fenretinide inhibits macrophage inflammatory
media-tors and controls hypertension in spontaneously hypertensive
rats via the peroxisome proliferator-activated receptor gamma
pathway. Drug Des Devel Ther. 10:3591–3597. 2016. View Article : Google Scholar :
|
|
95
|
Jiang H, Nie L, Li Y and Xie J:
Application of ultra-performance liquid chromatography coupled with
mass spectrometry to metabonomic study on spontaneously
hypertensive rats and intervention effects of Ping Gan
prescription. J Sep Sci. 35:483–489. 2012. View Article : Google Scholar : PubMed/NCBI
|
|
96
|
Ye X, Kong W, Zafar MI and Chen LL: Serum
triglycerides as a risk factor for cardiovascular diseases in type
2 diabetes mellitus: A systematic review and meta-analysis of
prospective studies. Cardiovasc Diabetol. 18:482019. View Article : Google Scholar : PubMed/NCBI
|
|
97
|
Kulkarni H, Meikle PJ, Mamtani M, Weir JM,
Barlow CK, Jowett JB, Bellis C, Dyer TD, Johnson MP, Rainwater DL,
et al: Plasma lipidomic profile signature of hypertension in
mexican american families: Specific role of diacylglycerols.
Hypertension. 62:621–626. 2013. View Article : Google Scholar : PubMed/NCBI
|
|
98
|
Tokumura A, Fujimoto H, Yoshimoto O,
Nishioka Y, Miyake M and Fukuzawa K: Production of lysophosphatidic
acid by lysophospholipase D in incubated plasma of spontaneously
hypertensive rats and Wistar Kyoto rats. Life Sci. 65:245–253.
1999. View Article : Google Scholar : PubMed/NCBI
|
|
99
|
Kim J, Choi JN, Choi JH, Cha YS, Muthaiya
MJ and Lee CH: Effect of fermented soybean product (Cheonggukjang)
intake on metabolic parameters in mice fed a high-fat diet. Mol
Nutr Food Res. 57:1886–1891. 2013. View Article : Google Scholar : PubMed/NCBI
|
|
100
|
Murugesan G and Fox PL: Role of
lysophosphatidylcholine in the inhibition of endothelial cell
motility by oxidized low density lipoprotein. J Clin Invest.
97:2736–2744. 1996. View Article : Google Scholar : PubMed/NCBI
|
|
101
|
Liu JC, Conklin SM, Manuck SB, Yao JK and
Muldoon MF: Long-chain omega-3 fatty acids and blood pressure. Am J
Hypertens. 24:1121–1126. 2011. View Article : Google Scholar : PubMed/NCBI
|
|
102
|
Hu C, Hoene M, Zhao X, Häring HU,
Schleicher E, Lehmann R, Han X, Xu G and Weigert C: Lipidomics
analysis reveals efficient storage of hepatic triacylglycerides
enriched in unsaturated fatty acids after one bout of exercise in
mice. PLoS One. 5:e133182010. View Article : Google Scholar : PubMed/NCBI
|
|
103
|
Ivandic B, Castellani LW, Wang XP, Qiao
JH, Mehrabian M, Navab M, Fogelman AM, Grass DS, Swanson ME, de
Beer MC, et al: Role of group II secretory phospholipase A2 in
atherosclerosis: 1. Increased atherogenesis and altered
lipoproteins in transgenic mice expressing group IIa phospholipase
A2. Arterioscler Thromb Vasc Biol. 19:1284–1290. 1999. View Article : Google Scholar : PubMed/NCBI
|
|
104
|
Dutra FL, Vieira DP, Coelho FS, Adade CM,
Atella GC, Silva Neto MAC and Lopes AH: Lysophosphatidylcholine
triggers cell differentiation in the protozoan parasite
herpetomonas samuelpessoai through the CK2 pathway. Acta Parasitol.
65:108–117. 2020. View Article : Google Scholar
|
|
105
|
Singh N, Shafiq M, Jagavelu K and Hanif K:
Involvement of fatty acid synthase in right ventricle dysfunction
in pulmonary hypertension. Exp Cell Res. 383:1115692019. View Article : Google Scholar : PubMed/NCBI
|