Introduction
Type 2 diabetes mellitus (T2DM) is a multifactorial
disease, and its prevalence has been increasing yearly over the
past century. The pathogenesis of this disease is considered to be
very complex. One of the main factors of this pathogenesis is the
blockade of the insulin signaling pathway, leading to insulin
resistance (1), which is mainly
manifested by the insensitivity of the target organ of insulin to
insulin signals.
Resveratrol (RSV) is a polyphenolic compound found
in a variety of plants. It is a natural phytoalexin that exists
mainly in the trans structure. It has been detected in
>70 plants, including eucalyptus and banyan, and dietary sources
mainly include red grapes, mulberries and red wine, with the
highest content found in the Chinese traditional medicine,
Polydatin (2,3). Metformin (MET) is a first-line
anti-diabetic drug that is widely used in the treatment of T2DM. It
mainly reduces blood glucose levels by inhibiting the secretion of
liver glucose and increasing the sensitivity to insulin (4). A previous study demonstrated that
RSV plays a beneficial role in improving insulin resistance and
treating T2DM and related complications through a variety of
biological effects, including anti-inflammatory, antioxidant,
cardiovascular and neuroprotective effects (5). MET exerts similar effects to RSV,
and its beneficial effects on human health have been demonstrated
to be even more prominent than those of RSV (6).
Long non-coding RNAs (lncRNAs) have a length of ~200
nucleotides. lncRNAs were originally considered to be 'noise' in
genome transcription without a biological function. However, recent
studies have indicated that lncRNAs are involved in a number of
important regulatory processes, such as genomic imprinting and
chromatin modification (7), and
play a role in the treatment of T2DM (8). In spite of this information, the
functional mechanisms of the majority of lncRNAs remain unclear.
The authors have previously studied lncRNA expression profiling
following treatment with RSV to improve insulin resistance
(9). To the best of our
knowledge, no studies to date have reported an analysis of lncRNA
expression profiles resulting from RSV and MET treatment for
high-fat diet (HFD)-induced liver insulin resistance in mice. The
present study thus aimed to explore the potential role of RSV and
MET in improving liver insulin resistance through lncRNAs and to
provide novel concepts and targets for the treatment of T2DM.
Materials and methods
Animals
The animal experimental protocol was approved by the
Ethics Committee of the People's Hospital of Hebei Province and
complied with international regulations for the management of
experimental animals. A total of 40 male C57BL/6J mice (6 weeks
old, weighing 21.0-23.0 g) were purchased from Beijing Weitong
Lihua Experimental Animal Center [license no. SCXK (Beijing)
2016-0006] and maintained at the Animal Laboratory of the Clinical
Research Center of Hebei General Hospital under a 12-h light/dark
cycle with free access to food and water.
Animal food
Animal food was purchased from Beijing Huafukang
Biotechnology Co., Ltd. [ordinary feed D12450J (calorie
composition: 20% protein, 70% carbohydrate and 10% fat; 3.85
kcal/g) and high-fat feed D12492 (calorie composition: 20% protein,
carbohydrates 20 and 60% fat; 5.24 kcal/g)].
Establishment of animal models
The C57BL/6J mice were randomly divided into the
control (CON, n=10) and HFD (n=30) groups. The CON group was
provided with ordinary feed, and the HFD group was provided with
the high-fat feed. After 8 weeks, an intraperitoneal glucose
tolerance test (IPGTT) was performed. According to the weight of
the mice, 2 g/kg glucose in saline were injected intraperitoneally,
and the blood glucose concentration was measured by blood sampling
from the tail vein using a blood glucose meter (Johnson &
Johnson) at 0, 15, 30, 60 and 120 min, as previously described
(10,11). The area under the curve (AUC) was
calculated to confirm a glucose metabolic disorder and to determine
whether the insulin resistance model was successfully
established.
RSV and MET treatments
The mice in the HFD group were randomly divided into
three groups as follows: 10 mice in the HFD control group, 10 mice
in the HFD + RSV group, and 10 mice in the HFD + MET group. RSV
(Sigma-Aldrich; Merck KGaA) at a concentration of 100 mg/kg/day and
MET (Sangon Biotech (Shanghai) Co., Ltd.) at a concentration of 250
mg/kg/day were administered to the mice. The CON and HFD groups
were administered a 0.9% sodium solution containing 0.1% DMSO
daily. The sodium solution was administered to the stomach, and the
IPGTT was performed after 8 weeks. The doses of RSV and MET were
similar to those used in previous studies using rodents (12,13). RSV was used at 100 mg/kg/day and
MET at 250 mg/kg/day in preliminary experiments to attenuate
insulin resistance. A previous study proved that RSV (100
mg/kg/day) used in mice did not cause damage to liver function
(14). In addition, in a
previous study, the authors demonstrated that 100 mg/kg/day RSV did
not damage liver function (15).
Animal and food weights were recorded weekly throughout the
experiment.
Tissue collection
Following 8 weeks of RSV and MET treatments, and 72
h after the final IPGTT, 3 mice from each group were randomly
selected and injected intraperitoneally with insulin
(Sigma-Aldrich; Merck KGaA) at 1.5 IU/40 g at 20 min prior to
anesthesia (mice were anesthetized by an intraperitoneal injection
of 2% pentobarbital sodium at 45 mg/kg). All mice were euthanized
by cervical dislocation, and blood was then collected by cardiac
puncture. The liver was rapidly excised and weighed; a small
section was fixed in 4% paraformaldehyde, and the remaining tissues
were rapidly frozen in liquid nitrogen and then transferred to a
−80°C freezer for storage.
Quantitative insulin sensitivity check
index (QUICKI)
According to the fasting blood glucose and insulin
concentration, a QUICKI was obtained (16). QUICKI value=1/(lgI0 + lgG0),
where I0 is fasting insulin and G0 is fasting blood glucose.
Hematoxylin and eosin (H&E)
staining
The liver tissue samples fixed in 4%
paraformaldehyde were dehydrated with gradient alcohol solutions
(100, 95, 80 and 75%), embedded in paraffin, and then sectioned
serially at a thickness of 5 µm. The sections were
deparaffinized and stained with hematoxylin for 5 min at 25°C
(Wuhan Servicebio Technology Co., Ltd.). The sections were then
differentiated with 70% ethanol for 10 sec, followed by washing
with distilled water. Finally, the sections were stained with eosin
for 5 min at 25°C (Wuhan Servicebio Technology Co., Ltd.),
dehydrated and sealed with resin. The morphological characteristics
of the liver sections were observed under a light microscope (Nikon
Corporation).
Oil Red O staining
The collected tissues were frozen and sectioned at a
thickness of 5-10 nm. The sections were placed in an Oil Red O
solution for 5-15 min at 25°C (Wuhan Servicebio Technology Co.,
Ltd.) while being protected from light and then differentiated with
75% alcohol, followed by washing with distilled water. After
staining the nuclei with hematoxylin for 2 min at 25°C), the
sections were washed with distilled water until the nuclei became
blue for 5-10 min and then sealed glycerin-gelatin. The
morphological characteristics of the sections were observed under
an optical microscope (Nikon Corporation).
Western blot analysis
Total protein was extracted from the liver tissues
using RIPA buffer (Wuhan Servicebio Technology Co., Ltd.) and the
protein concentration was determined using a BCA kit (Thermo Fisher
Scientific, Inc.). SDS-PAGE separation gels (8, 10 and 12%) were
prepared at various concentrations according to the molecular
weight of the target protein. Following electrophoresis, the
proteins were transferred to a PVDF membrane that was blocked with
5% dry skim milk for 3 h at 25°C. Primary antibodies diluted in
blocking solution were as follows: β-actin (mouse antibody,
1:1,000; cat. no. 3700S); t-PI3K (rabbit antibody, 1:2,000; cat.
no. 4249S); p-PI3K (Tyr 458; rabbit antibody, 1:1,000; cat. no.
17366S); t-Akt rabbit antibody, 1:2,000; cat. no. 4691S); p-Akt
(Ser 473) rabbit antibody, 1:1,000 cat. no. 4060S) (all from Cell
Signaling Technology, Inc.); forkhead box O1 (FOXO1) (rabbit
antibody, 1:1,000; cat. no. 18592-1-AP); glucose-6-phosphatase
catalytic subunit 1 (G6PC) (rabbit antibody, 1:2,000 cat. no.
22169-1-AP) (all from ProteinTech Group, Inc.); phosphoenolpyruvate
carboxykinase 1 (PCK1; PEPCK) (rabbit antibody, 1:1,000 cat. no.
702748; Thermo Fisher Scientific, Inc.); HRP-labeled goat
anti-rabbit IgG antibody and goat anti-mouse IgG antibody (1:8,000;
cat. no. L3012-2; and 1:3,000, cat. no. L3032-2 respectively; both
from Signalway Antibody LLC). The primary antibodies were incubated
with the membrane at 4°C overnight, followed by washing three times
(10 min each time) with TBST (20% Tween), followed by incubation
with the secondary antibodies at room temperature for 50 min, and
washing three times (10 min each time) with TBST (20% Tween). A gel
imaging instrument was used to capture specific protein bands.
ImageJ software 1.8.0 (National Institutes of Health) was used to
measure the densitometric values of the protein bands.
Normalization was performed by incubating the same membrane with an
antibody against β-actin for 2 h at 25°C).
Reverse transcription-quantitative
polymerase chain reaction (RT-qPCR)
Total RNA was extracted from the mouse liver tissues
using TRIzol® reagent (Thermo Fisher Scientific, Inc.),
and the RNA concentration was determined using a NanoDrop 2000
(Thermo Fisher Scientific, Inc.). RNA was reverse transcribed into
cDNA (RR047A) using a PrimeScript™ RT reagent kit with a gDNA
Eraser kit and amplified using a SYBR® Premix Ex Taq™ II
kit (RR820A; Takara Bio, Inc.). PCR was performed using the Applied
Biosystems 7300 apparatus (Applied Biosystems; Thermo Fisher
Scientific, Inc.) at 95°C for 10 min, followed by 40 cycles for 15
sec at 95°C, 15 sec at 95°C and 15 sec at 60°C. The
2−ΔΔCq method (17)
was used to normalize the gene expression levels to β-actin. The
primer sequences are listed in Table
I. Primers for the lncRNAs were designed by Shanghai Simomics
based on lncRNA sequences from the NONCODE database (http://www.noncode.org/).
 | Table ISequences of primers used for reverse
transcription-quantitative PCR used in the present study. |
Table I
Sequences of primers used for reverse
transcription-quantitative PCR used in the present study.
| Gene | Forward primer
(5′-3′) | Reverse primer
(5′-3′) |
|---|
| Actin |
GGCGCTTTTGACTCAGGATT |
GGGATGTTTGCTCCAACCAA |
|
NONMMUT022720.2 |
CTCACCTCCATTTCCTTCCATAT |
AGACCTCACCTGATCTCCACCC |
|
NONMMUT020098.2 |
TTATGTAGTGCCTTCCATTGTCC |
CTCTTCCATAGCCAGAACTGCA |
|
NONMMUT051900.2 |
GTGGCTGGACAGTTCCTACCTT |
ATAACTCGCCCACCGCACT |
|
NONMMUT051843.2 |
AGGCTAAGAGCAGCAGCAAGT |
AAGCACCAACTGCATACTCCC |
|
NONMMUT042412.2 |
CTGACCGACTGGCAAGTGAATA |
TGTGCGGACATAGATGCTGAA |
|
NONMMUT006741.2 |
TCAGTTAAGCAGCACAATGGC |
AGTATTCTTACCCACTGAGCCATC |
|
NONMMUT148967.1 |
CTCCAACCCACCAACAGCATA |
AAACAACGGTGGCATGGAATA |
|
NONMMUT034936.2 |
CCAGCCACTCTGCACTTTGTT |
AGTCCTATCTGTCCACCCTCCG |
| PI3K |
ACTTTGTGACCTTCGGCTT |
TCCTGTACTTCTGGATCTTTAA |
| Akt |
AAGGAGGTCATCGTCGCCAA |
ACAGCCCGAAGTCCGTTATC |
| FOXO1 |
AAGGCCATCGAGAGCTCAGC |
GATTTTCCGCTCTTGCCTCC |
| G6PC |
TTGCATTCCTGTATGGTAGTGG |
TAGGCTGAGGAGGAGAAAACTG |
| PEPCK |
GTGCTGGAGTGGATGTTCGG |
CTGGCTGATTCTCTGTTTCAGG |
High-throughput sequencing
A total of four liver samples each were selected
from the CON, HFD, HFD + RSV and HFD + MET groups, and total RNA
was extracted using an RNeasy mini kit (Qiagen GmbH) and TruSeq™
RNA sample preparation reagents (Illumina, Inc.). A cassette
(Illumina, Inc.) was used to construct a sequencing library. The
purified library was verified using the Qubit® 2.0
Fluorometer (Thermo Fisher Scientific, Inc.) and an Agilent 2100
Bioanalyzer (Agilent Technologies, Inc.) for the insert size and
calculated molarity. Finally, sequencing was performed on an
Illumina NovaSeq 6000 (Illumina, Inc.). The library was constructed
and sequenced by Shanghai Simomics. The high-throughput sequencing
results were uploaded to the Gene Expression Omnibus database
(accession no. GSE137840).
Identification and expression analyses of
lncRNAs and mRNAs
Fragments were counted within each gene segment to
calculate the fragments per kilobase million (FPKM) value for each
gene (18). The differential
expression of genes between groups was then analyzed. After
calculating the P-value, multiple hypothesis test correction was
performed by controlling the false discovery rate (FDR). The
corrected P-value is termed the Q-value. Fold changes in
differential expression were calculated based on the FPKM value,
and the log2 (fold change) was then calculated to subsequently
screen differentially expressed genes, as previously described
(19). Both lncRNAs and mRNAs
were obtained from databases [lncRNAs: RefSeq (https://www.ncbi.nlm.nih.gov/refseq/),
Ensembl (https://asia.ensembl.org/index.html) and GenBank
(https://www.ncbi.nlm.nih.gov/); mRNAs:
NONCODE (http://www.noncode.org/) and
Ensembl].
Gene Ontology (GO) and Kyoto Encyclopedia
of Genes and Genomes (KEGG) enrichment analysis
To investigate the main biological functions and
pathways related to the differentially expressed genes, each gene
was annotated based on the GO and KEGG databases. Fisher's exact
test or Chi-squared test were used to calculate the number of
differentially expressed genes, and the hypergeometric test was
then used for statistical analysis to select the GO and KEGG
entries that were significantly enriched for the differentially
expressed genes. After the calculated P-value was corrected by
multiple hypothesis testing, a Q-value ≤0.05 was used as the
threshold. Meeting this condition was defined as the GO and KEGG
results that were significantly enriched for differentially
expressed genes.
lncRNA target gene prediction
The mRNA that interacts with lncRNA is termed the
target gene of lncRNA. cis target gene prediction involved
the identification of mRNAs in the 10 kb range of lncRNA upstream
and downstream on the genome as the target gene of the lncRNA. The
prediction of trans target genes was based on the principle
of sequence complementary pairing, using blast alignment to obtain
mRNA complementary to lncRNA. RNAplex 0.2 software (University of
Leipzig, Leipzig, Germany) was used to calculate the thermodynamic
parameter values of lncRNAs and mRNAs following complementary
pairing. The result above the software threshold ranges was
selected as the target gene of the lncRNA.
Statistical analysis
All data were analyzed using SPSS 22.0 software
(SPSS, Inc.). The results are expressed as the mean ± standard
deviation. An independent samples t-test (Student's t-test) was
used for two-sample comparisons with data demonstrating a normal
distribution. Multiple groups were compared using one-way analysis
of variance (ANOVA) followed by Tukey's or Tamhane's test.
P<0.05 was considered to indicate statistically significant
differences. For lncRNA and mRNA expression, significant level
changes were expressed as a Q-value <0.05, and the absolute
value of fold change was greater than or equal to twice the
change.
Results
Establishment of the mouse model of
HFD-induced insulin resistance
At the end of week 8, IPGTTs were performed on the
two groups of mice. The mice in the HFD group had significantly
higher blood glucose levels than those in the CON group at 0, 30,
60 and 120 min (Fig. 1A).
Compared with the CON group, the AUC in the HFD group was
significantly increased (Fig.
1B), indicating that the model of insulin resistance was
successfully established.
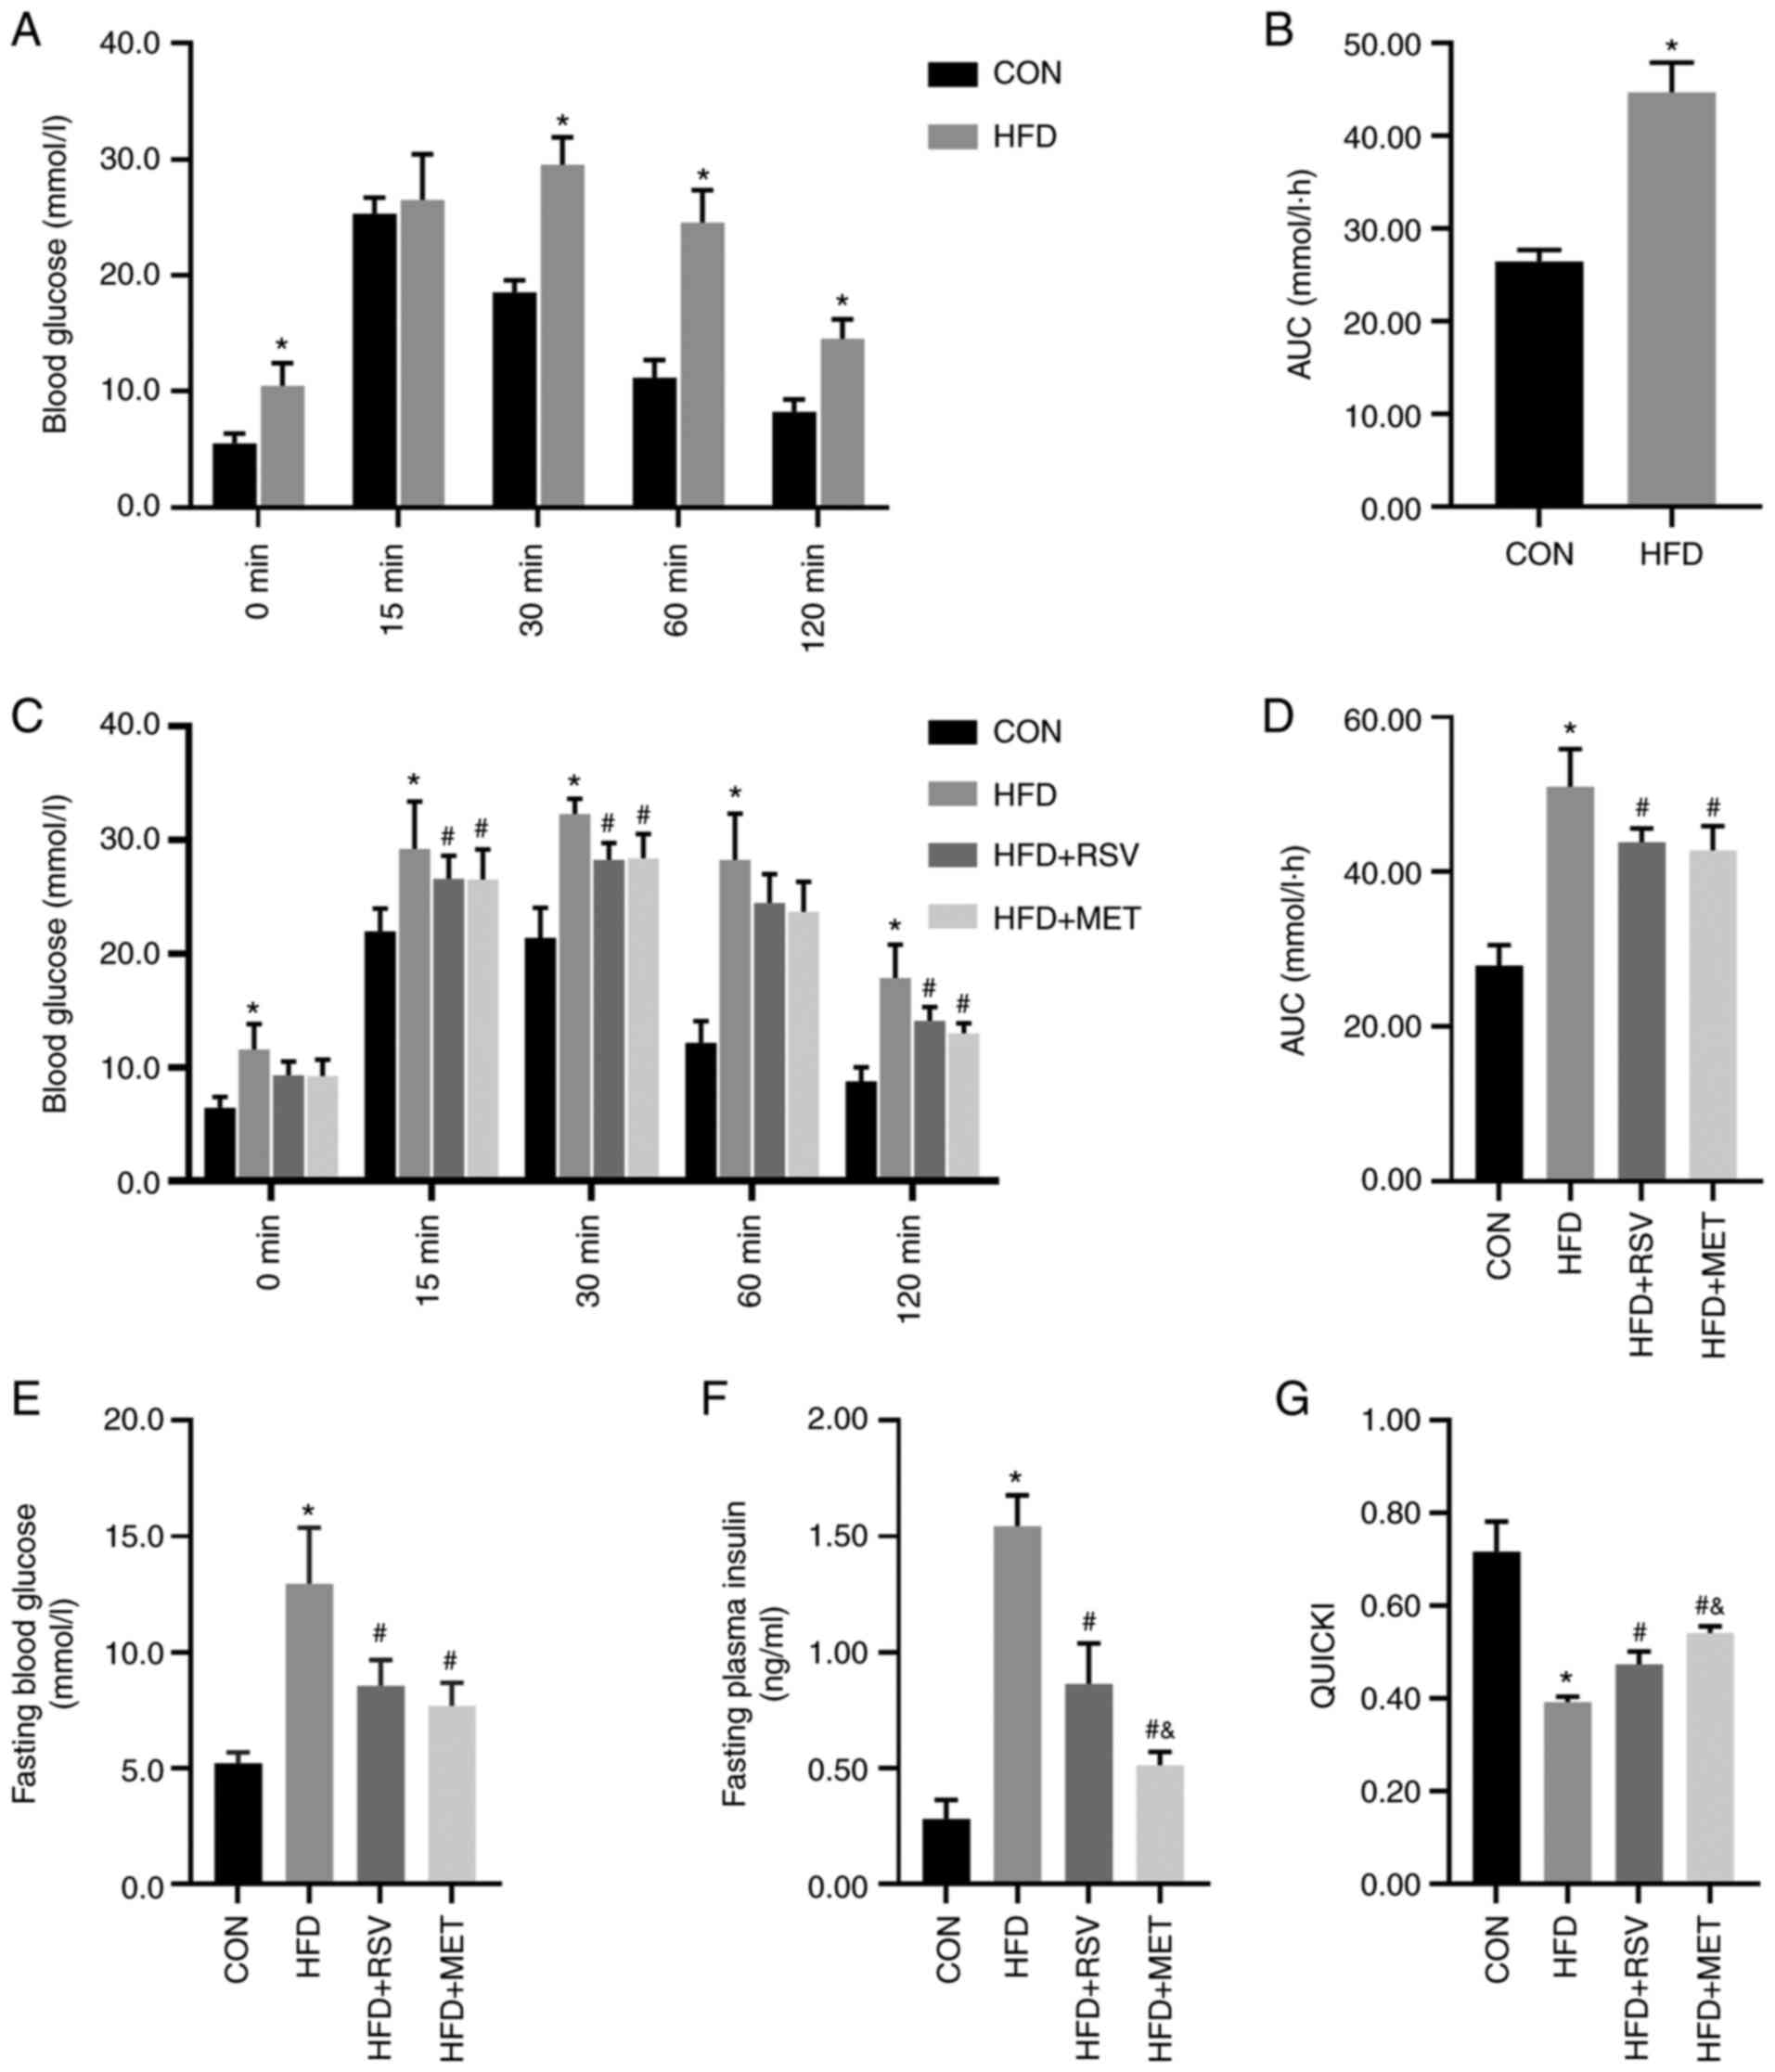 | Figure 1RSV and MET intervention and the IPGTT
results before and after 8 weeks of being fed the HFD, and insulin
sensitivity after RSV and MET treatment. After 8 weeks of high-fat
diet. (A) Blood glucose levels at 0, 15, 30, 60 and 120 min after
the IPGTT. (B) AUC of glucose. (C) Blood glucose levels at 0, 15,
30, 60 and 120 min after the IPGTT, (D) AUC of glucose, (E) fasting
blood glucose levels, (F) fasting blood insulin levels, and (G)
QUICKI after 8 weeks of treatment. Data are presented as the mean ±
SD (n=10). One-way ANOVA was used for statistical analysis followed
by Tukey's or Tamhane's multiple comparison tests.
*P<0.05 vs. CON; #P<0.05 vs. HFD; and
&P<0.05 vs. HFD + RSV. RSV, resveratrol; MET,
metformin; HFD, high-fat diet; IPGTT, intraperitoneal glucose
tolerance test; AUC, area under the curve; QUICKI, quantitative
insulin sensitivity check index. |
Changes in general indices of mice in
each group following treatment with RSV and MET for 8 weeks
As shown by the results of the IPGTT, compared with
the CON group, the HFD group had significantly higher blood glucose
levels at 0, 15, 30, 60 and 120 min (Fig. 1C). Compared with the HFD group,
the HFD + RSV and HFD + MET groups had significantly decreased
blood glucose levels at 30, 60 and 120 min. No statistically
significant difference in glucose levels was observed between the
HFD + MET and HFD + RSV groups (Fig.
1C). Compared with the CON group, the AUC in the HFD group was
significantly increased. Compared with the HFD group, the AUC in
the HFD + RSV and HFD + MET groups was significantly decreased.
Similarly, compared with the HFD + RSV group, the AUC in the HFD +
MET group did not differ significantly (Fig. 1D).
Blood glucose, insulin and QUICKI
Compared with the CON group, the fasting blood
glucose and insulin levels in the HFD group were significantly
increased and the QUICKI value was significantly decreased.
Compared with the HFD group, the fasting blood glucose and insulin
levels in HFD + RSV and HFD + MET groups were significantly
decreased, and the QUICKI value was significantly increased.
Compared with the HFD + RSV group, significant differences were
observed in fasting blood glucose levels in the HFD + MET group,
the insulin level was significantly decreased and the QUICKI value
was significantly increased (Fig.
1E-G).
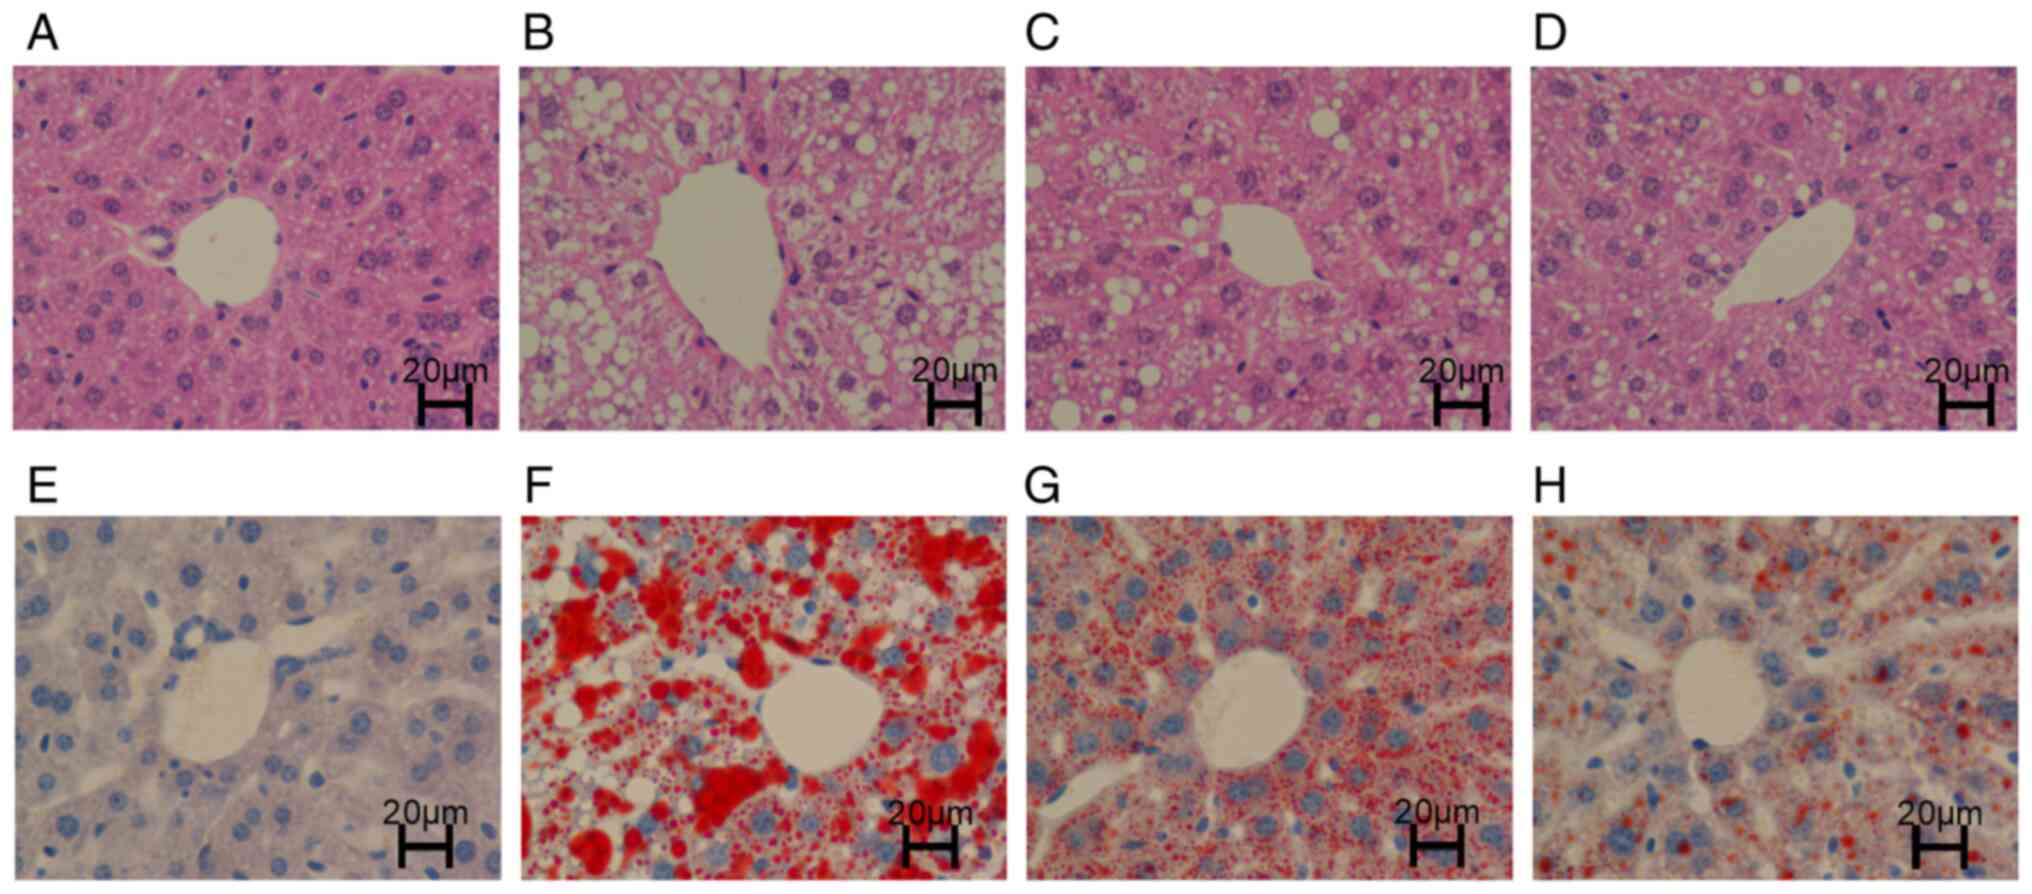
H&E staining
The liver structure of the mice in the CON group was
clear and intact, the cytoplasm was uniformly stained red, and
essentially, no lipid droplets were vacuolated (Fig. 2A). However, the structure in the
HFD group was disordered and fuzzy, and a large number of large
lipid droplet vacuoles were observed in the cytoplasm (Fig. 2B). The liver structures in the
HFD + RSV and HFD + MET groups were clear, and the cytoplasm was
stained red. A small number of smaller lipid droplet vacuoles were
observed in the cytoplasm. Compared with the HFD + RSV group, the
number of lipid droplet vacuoles was markedly decreased in the HFD
+ MET group (Fig. 2C and D).
Oil Red O staining
The liver structure in the CON group was clear with
blue nuclei (Fig. 2E). In the
HFD group, a large number of orange-red lipid droplets were
deposited, and a large number of lipid droplet vacuoles were
observed in the cytoplasm (Fig.
2F). Compared with the HFD group, the orange-red lipid droplet
deposition and lipid droplet vacuoles were markedly decreased in
the HFD + RSV group. Compared with the HFD + RSV group, the
orange-red lipid droplet deposition and lipid droplet vacuoles were
markedly decreased in the HFD + MET group. Orange-red lipid
droplets were less evident, and intracellular cytoplasmic lipid
droplet vacuoles were essentially absent (Fig. 2G and H).
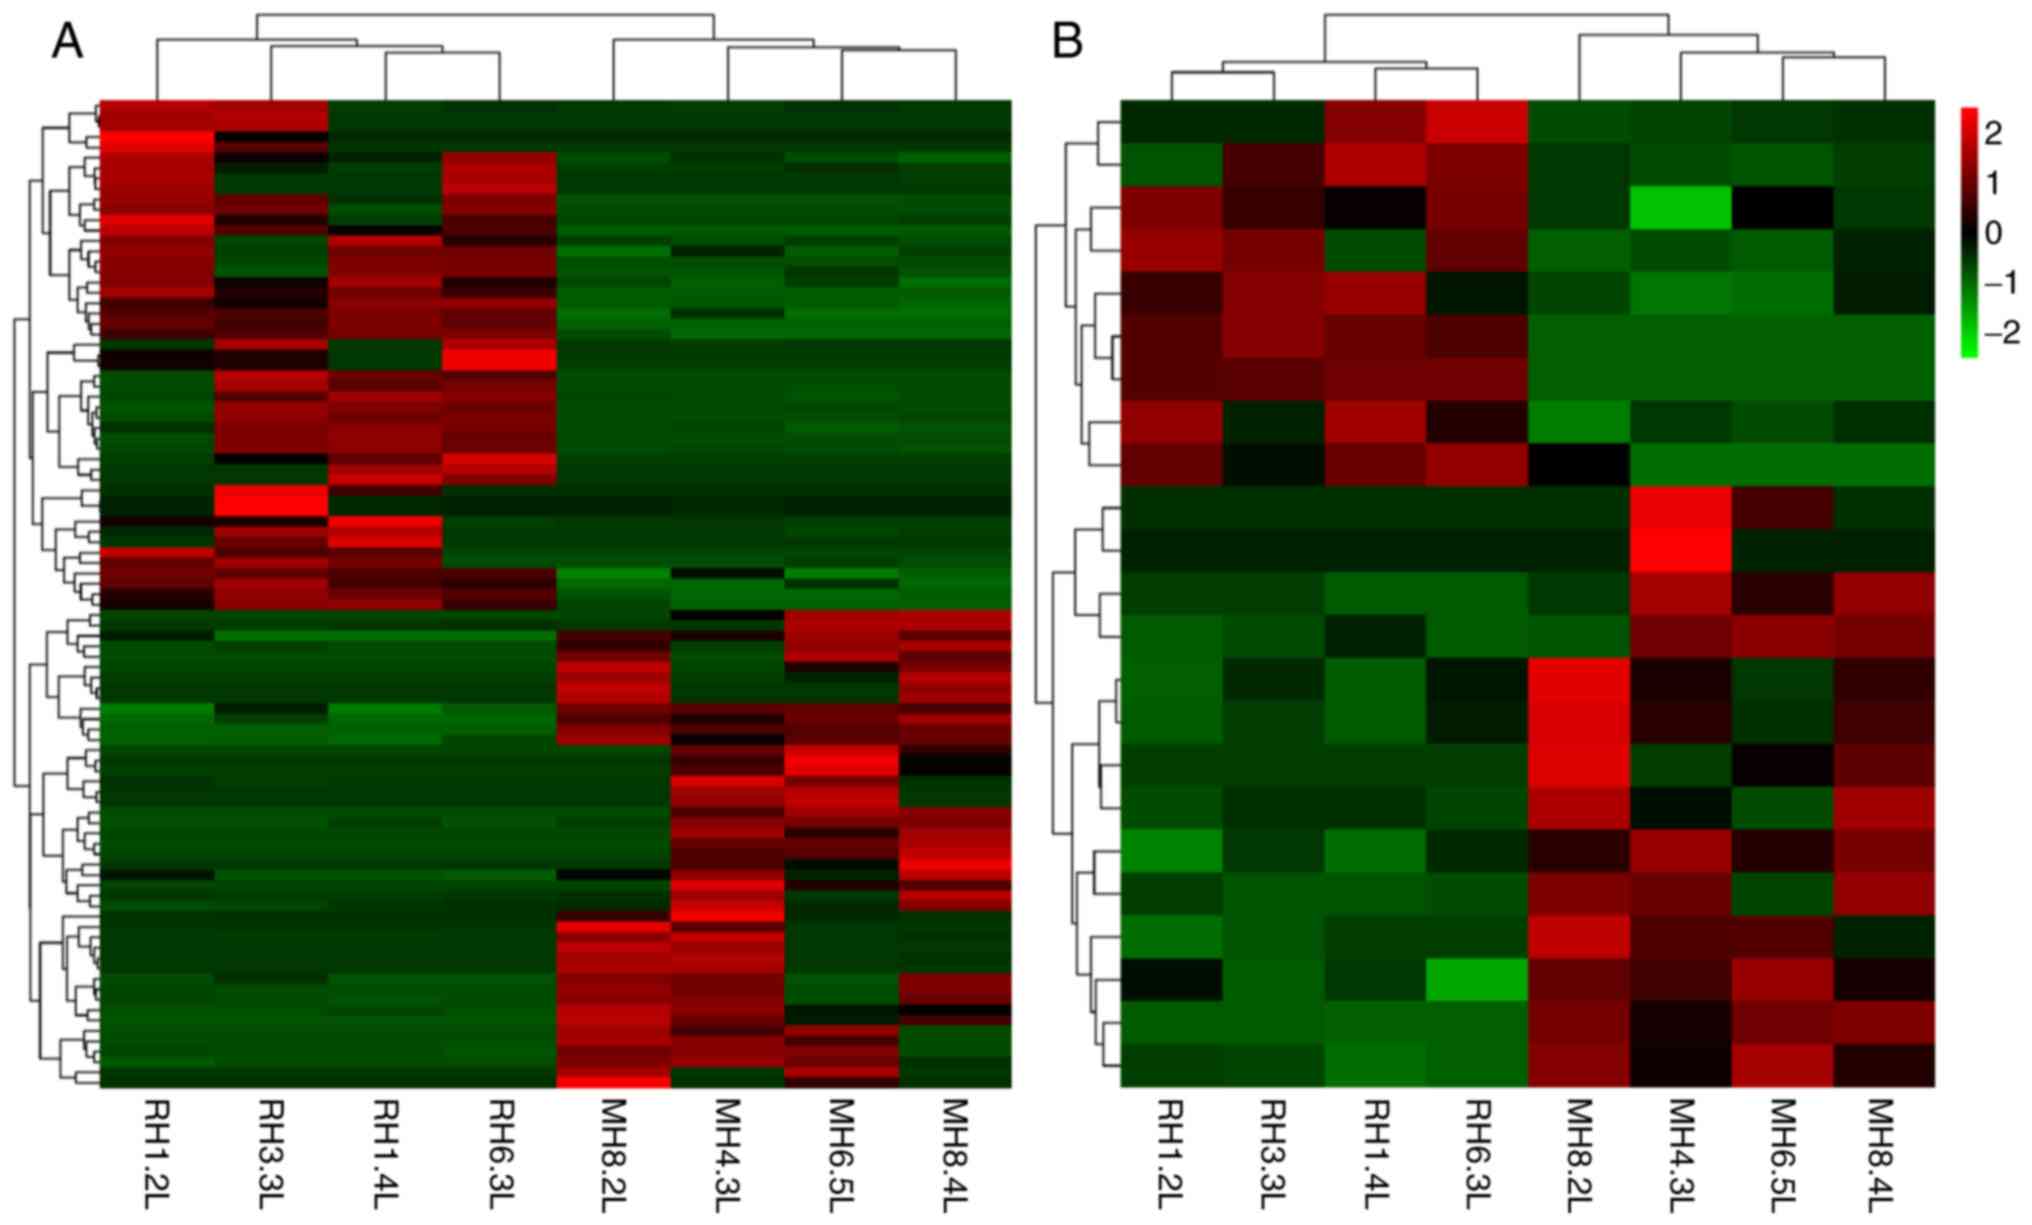
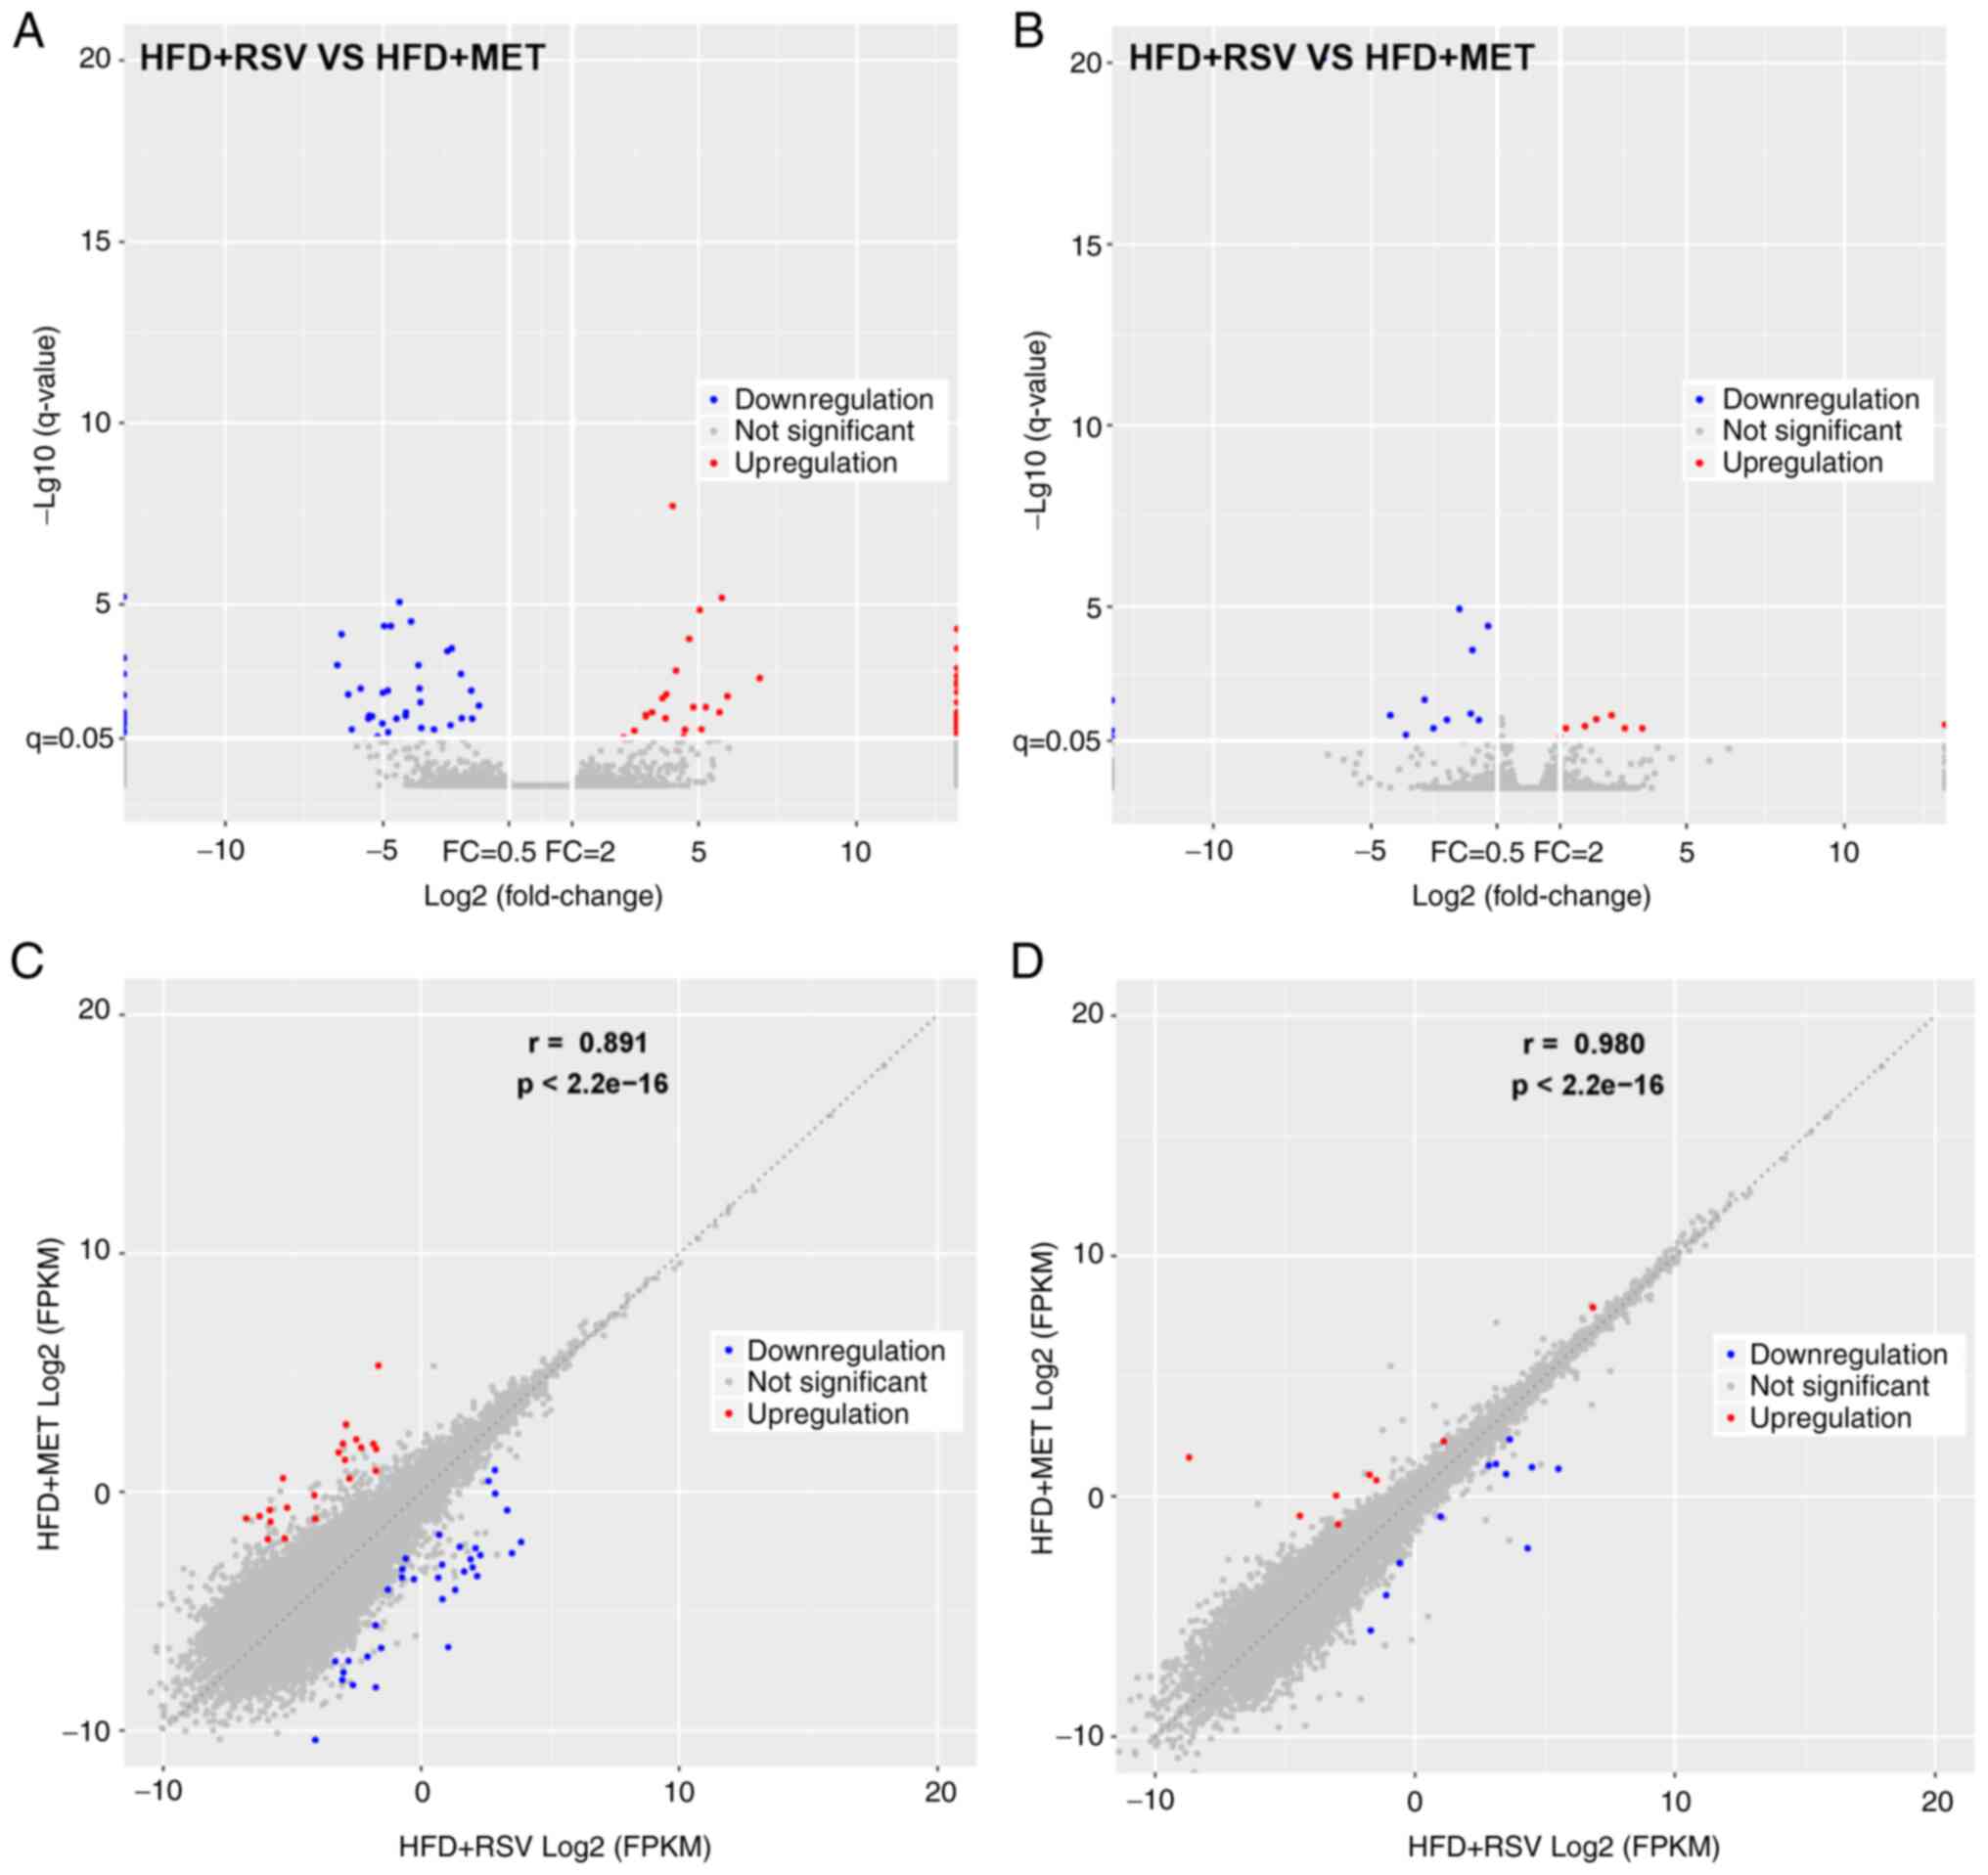
Expression profiles of lncRNAs and
mRNAs
The expression of lncRNAs and mRNAs in the livers of
mice in the HFD + RSV and HFD + MET groups was determined using
high-throughput sequencing and comparisons were made between the
groups. A total of 55 differentially expressed lncRNAs (21
upregulated and 34 downregulated) (Table II) and 19 mRNAs with a
differential expression (8 upregulated and 11 downregulated)
(Table III) were detected. A
heatmap (Fig. 3A and B), volcano
plot (Fig. 4A and B) and scatter
plot (Fig. 4C and D) were used
to reveal the trend distribution and approximate numbers of lncRNAs
and mRNAs with a differential expression.
| Table IIExpression patterns of lncRNAs in
mice fed a high-fat diet and treated with resveratrol (HFD + RSV),
or a high-fat diet and treated with metformin (HFD + MET). |
Table II
Expression patterns of lncRNAs in
mice fed a high-fat diet and treated with resveratrol (HFD + RSV),
or a high-fat diet and treated with metformin (HFD + MET).
| Sequence name | Log2 (fold
change) | Q-value | Regulation (HFD +
RSV vs. HFD + MET) |
|---|
|
NONMMUT005824.2 | 6.945314896 | 0.001103259 | Up |
|
NONMMUT115986.1 | 5.919352903 | 0.003509737 | Up |
|
NONMMUT006741.2 | 5.740878779 | 6.66935E-06 | Up |
|
NONMMUT057779.2 | 5.667763678 | 0.009685873 | Up |
|
NONMMUT142367.1 | 5.237843416 | 0.006999248 | Up |
|
NONMMUT029743.2 | 5.101371421 | 0.028598401 | Up |
|
NONMMUT042412.2 | 5.046285872 | 1.44559E-05 | Up |
|
NONMMUT063026.2 | 4.847521228 | 0.006999248 | Up |
|
NONMMUT054509.2 | 4.713077677 | 9.15681E-05 | Up |
|
NONMMUT141988.1 | 4.577511628 | 0.029246228 | Up |
|
NONMMUT072307.2 | 4.527671546 | 0.04528547 | Up |
|
NONMMUT148967.1 | 4.292139587 | 0.000683204 | Up |
|
NONMMUT059852.2 | 4.183739876 | 1.96211E-08 | Up |
|
NONMMUT025403.2 | 3.987442869 | 0.003079426 | Up |
|
NONMMUT060871.2 | 3.958045958 | 0.014100955 | Up |
|
NONMMUT049810.2 | 3.863840709 | 0.00397755 | Up |
|
NONMMUT019208.2 | 3.533115587 | 0.009730051 | Up |
|
NONMMUT114839.1 | 3.337496324 | 0.012511971 | Up |
|
NONMMUT034936.2 | 3.333006304 | 0.011416228 | UP |
|
NONMMUT018410.2 | 2.975401761 | 0.030868204 | Up |
|
ENSMUST00000168978 | 2.631296088 | 0.047219725 | Up |
|
ENSMUST00000206358 | −7.561291886 | 1.21828E-26 | Down |
|
NONMMUT001350.2 | −6.43793958 | 0.000481319 | Down |
|
NONMMUT139135.1 | −6.306143865 | 6.77556E-05 | Down |
|
NONMMUT051900.2 | −6.09393297 | 0.003117525 | Down |
|
NONMMUT023599.2 | −5.982081496 | 0.028601178 | Down |
|
NONMMUT012522.2 | −5.701207169 | 0.002142543 | Down |
|
NONMMUT153354.1 | −5.453670717 | 0.014465309 | Down |
|
NONMMUT036927.2 | −5.428733989 | 0.012009699 | Down |
|
NONMMUT041613.2 | −5.334514214 | 0.012511971 | Down |
|
NONMMUT012373.2 | −5.164885661 | 0.045254749 | Down |
|
NONMMUT060208.2 | −5.008870996 | 0.019601564 | Down |
|
ENSMUST00000181220 | −4.99779716 | 0.002812713 | Down |
|
NONMMUT020098.2 | −4.951796068 | 4.02751E-05 | Down |
|
NONMMUT146959.1 | −4.834859279 | 0.002445414 | Down |
|
NONMMUT144581.1 | −4.826441656 | 0.034149857 | Down |
|
NONMMUT051843.2 | −4.741021643 | 4.02751E-05 | Down |
|
NONMMUT152719.1 | −4.561542794 | 0.014465309 | Down |
|
NONMMUT017165.2 | −4.468435793 | 8.73827E-06 | Down |
|
NONMMUT144108.1 | −4.273674469 | 0.012078574 | Down |
|
NONMMUT002990.2 | −4.266195398 | 0.009730051 | Down |
|
NONMMUT068763.2 | −4.10312612 | 3.01531E-05 | Down |
|
NONMMUT004068.2 | −3.866535764 | 0.000481319 | Down |
|
NONMMUT153572.1 | −3.834650085 | 0.002142543 | Down |
|
NONMMUT012873.2 | −3.807527476 | 0.005135465 | Down |
|
ENSMUST00000210097 | −3.77697909 | 0.02615524 | Down |
|
NONMMUT003373.2 | −3.374798374 | 0.028601178 | Down |
|
NONMMUT008156.2 | −2.945595627 | 0.000198272 | Down |
|
NONMMUT016564.2 | −2.848305902 | 0.021844713 | Down |
|
NONMMUT087168.1 | −2.809338304 | 0.000167272 | Down |
|
NONMMUT078378.1 | −2.520230112 | 0.000848005 | Down |
|
NONMMUT022720.2 | −2.494349474 | 0.014100955 | Down |
|
ENSMUST00000194058 | −2.195755365 | 0.002445414 | Down |
| MSTRG.5260.1 | −2.16480654 | 0.014465309 | Down |
|
NONMMUT145427.1 | −1.950332233 | 0.006382243 | Down |
| Table IIIExpression patterns of mRNAs in mice
fed a high-fat diet and treated with resveratrol (HFD + RSV), or a
high-fat diet and treated with metformin (HFD + MET). |
Table III
Expression patterns of mRNAs in mice
fed a high-fat diet and treated with resveratrol (HFD + RSV), or a
high-fat diet and treated with metformin (HFD + MET).
| Gene name | Log2 (fold
change) | Q-value | Regulation (HFD +
RSV vs. HFD + MET) |
|---|
| Usp50 | 10.30770702 | 2.7191E-101 | Up |
| Capn11 | 3.604562962 | 0.022920926 | Up |
| Gm45301 | 3.05478554 | 0.022920926 | Up |
| Gm20427 | 2.635920148 | 0.010059961 | Up |
| Gm15622 | 2.14891265 | 0.012986671 | Up |
| Zfp872 | 1.789734813 | 0.019946447 | Up |
| Wdr81 | 1.184060009 | 0.022920926 | Up |
| G6pc | 1.003683239 | 0.037709999 | Up |
| Gm10774 | −6.495776415 | 7.6787E-21 | Down |
| Mt2 | −4.377392087 | 0.010059961 | Down |
| Epo | −3.8837058 | 0.034838444 | Down |
| Mt1 | −3.289829351 | 0.003737438 | Down |
| 9330175E14Rik | −3.009727309 | 0.022920926 | Down |
| Gm20634 | −2.583854697 | 0.013400526 | Down |
| Gm38253 | −2.191694611 | 1.16607E-05 | Down |
| Gm8242 | −1.830508486 | 0.009095243 | Down |
| Pcsk9 | −1.774792296 | 0.000159695 | Down |
| Tff3 | −1.570997721 | 0.013618716 | Down |
| Tspan4 | −1.278414166 | 3.46456E-05 | Down |
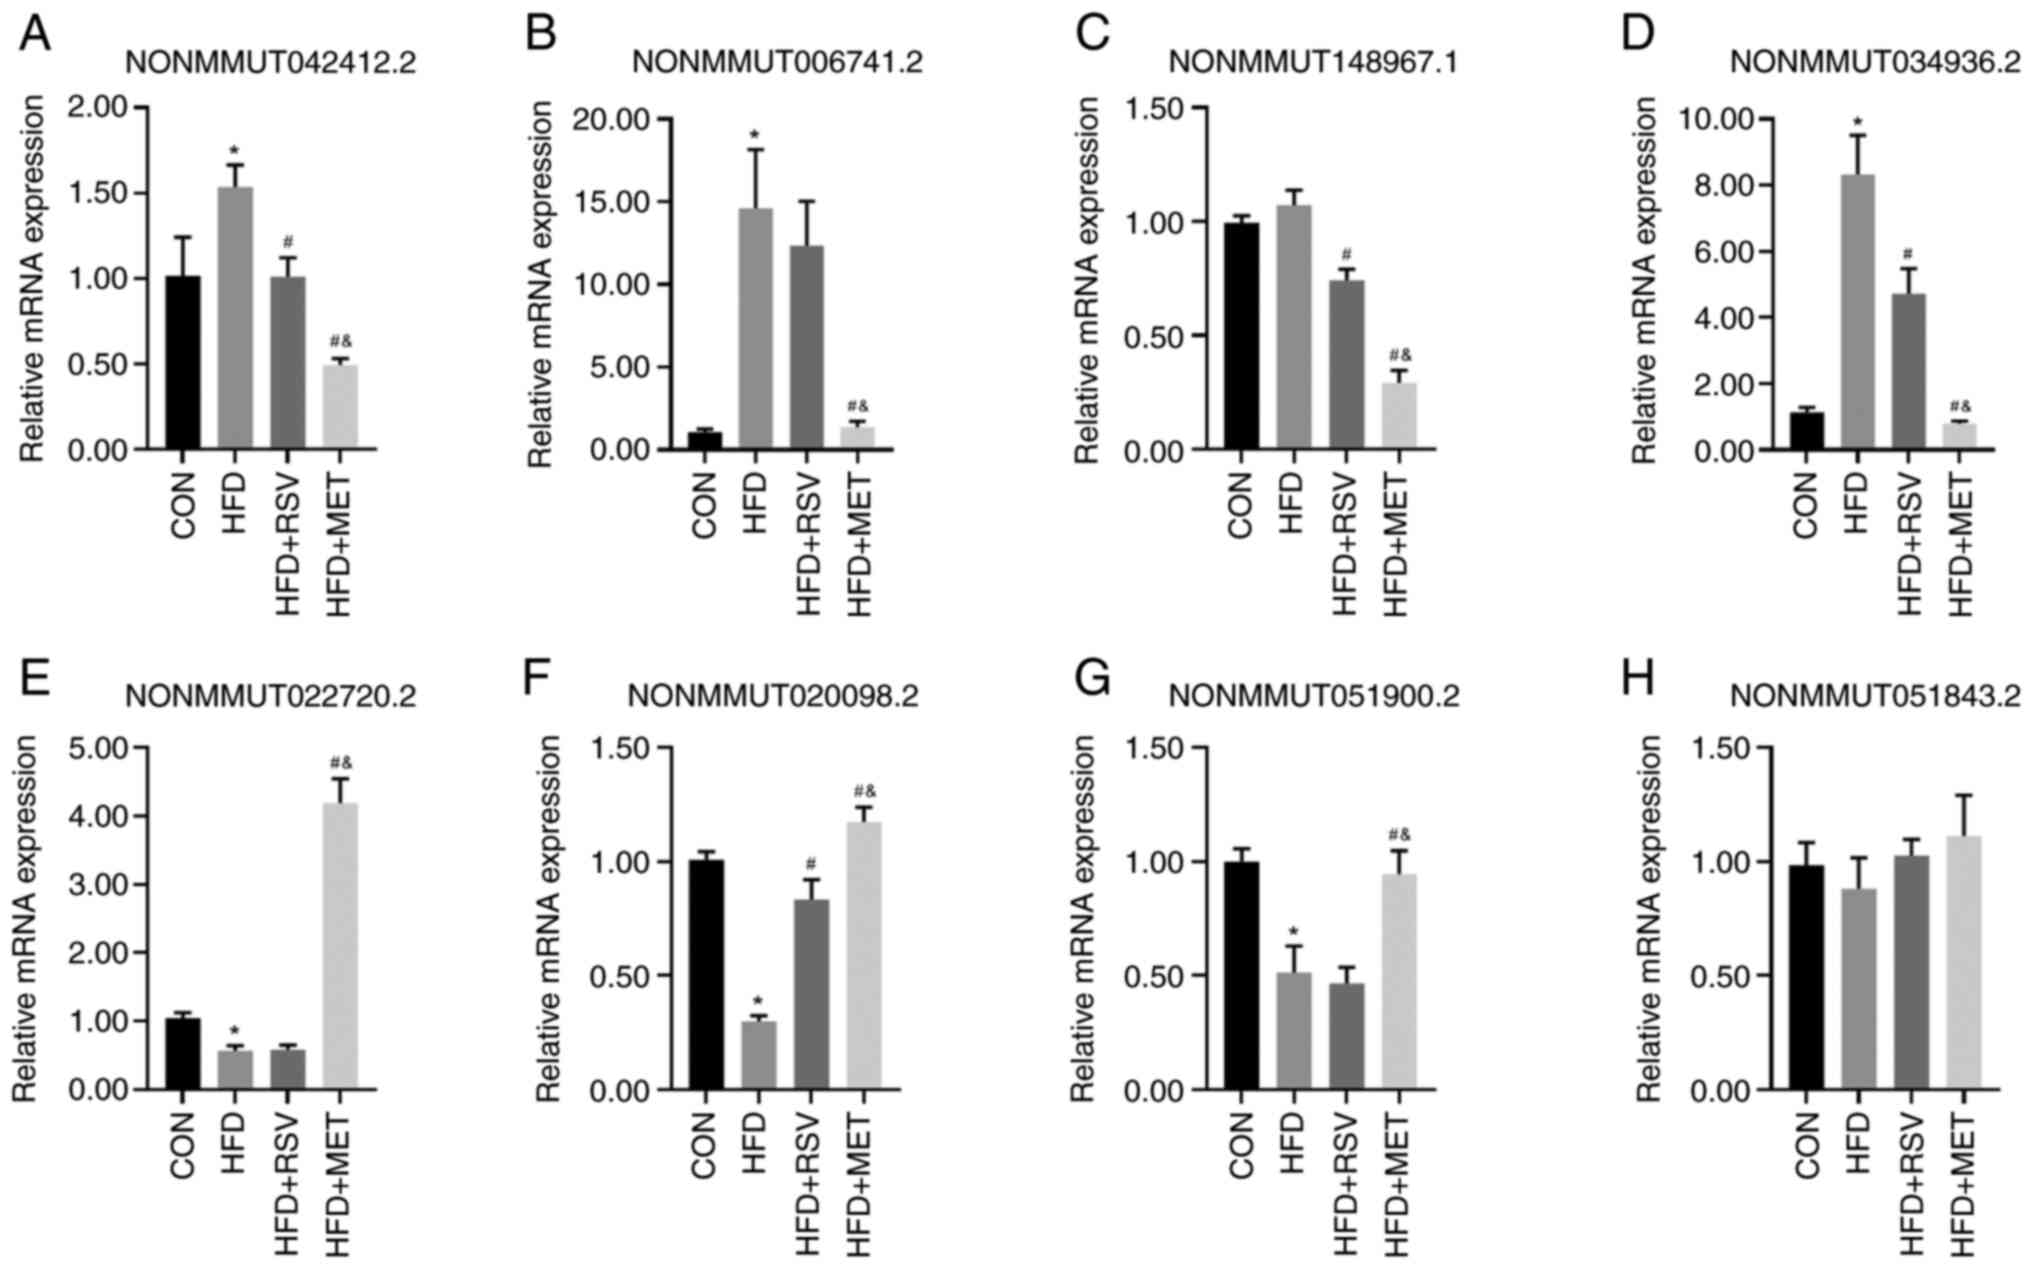
Validation of lncRNA expression using
RT-qPCR
From the 55 lncRNAs with a differential expression
in the HFD + RSV and HFD + MET groups, four randomly selected
lncRNAs upregulated in the HFD + RSV group (NONMMUT042412.2, NON
MMU T0 06741.2, NON MMU T148967.1 and NONMMUT034936.2) (Fig. 5A-D) and four lncRNAs
downregulated in the HFD + RSV group (NONMMUT022720.2,
NONMMUT020098.2, NONMMUT051900.2 and NONMMUT051843.2) (Fig. 5E-H) were used to verify the
sequencing results using RT-qPCR. Apart from NONMMUT051843.2, the
expression levels of the other seven lncRNAs were consistent with
the sequencing results in the HFD + RSV and HFD + MET groups.
Compared with the CON group, apart from the expression levels of
NONMMUT148967.1 and NONMMUT051843.2 in the HFD group, those of the
other lncRNAs differed significantly. Compared with the HFD group,
apart from the expression levels of NONMMUT006741.2,
NONMMUT022720.2, NONMMUT051900.2 and NONMMUT051843.2, those of the
other lncRNAs in the HFD + RSV group differed significantly.
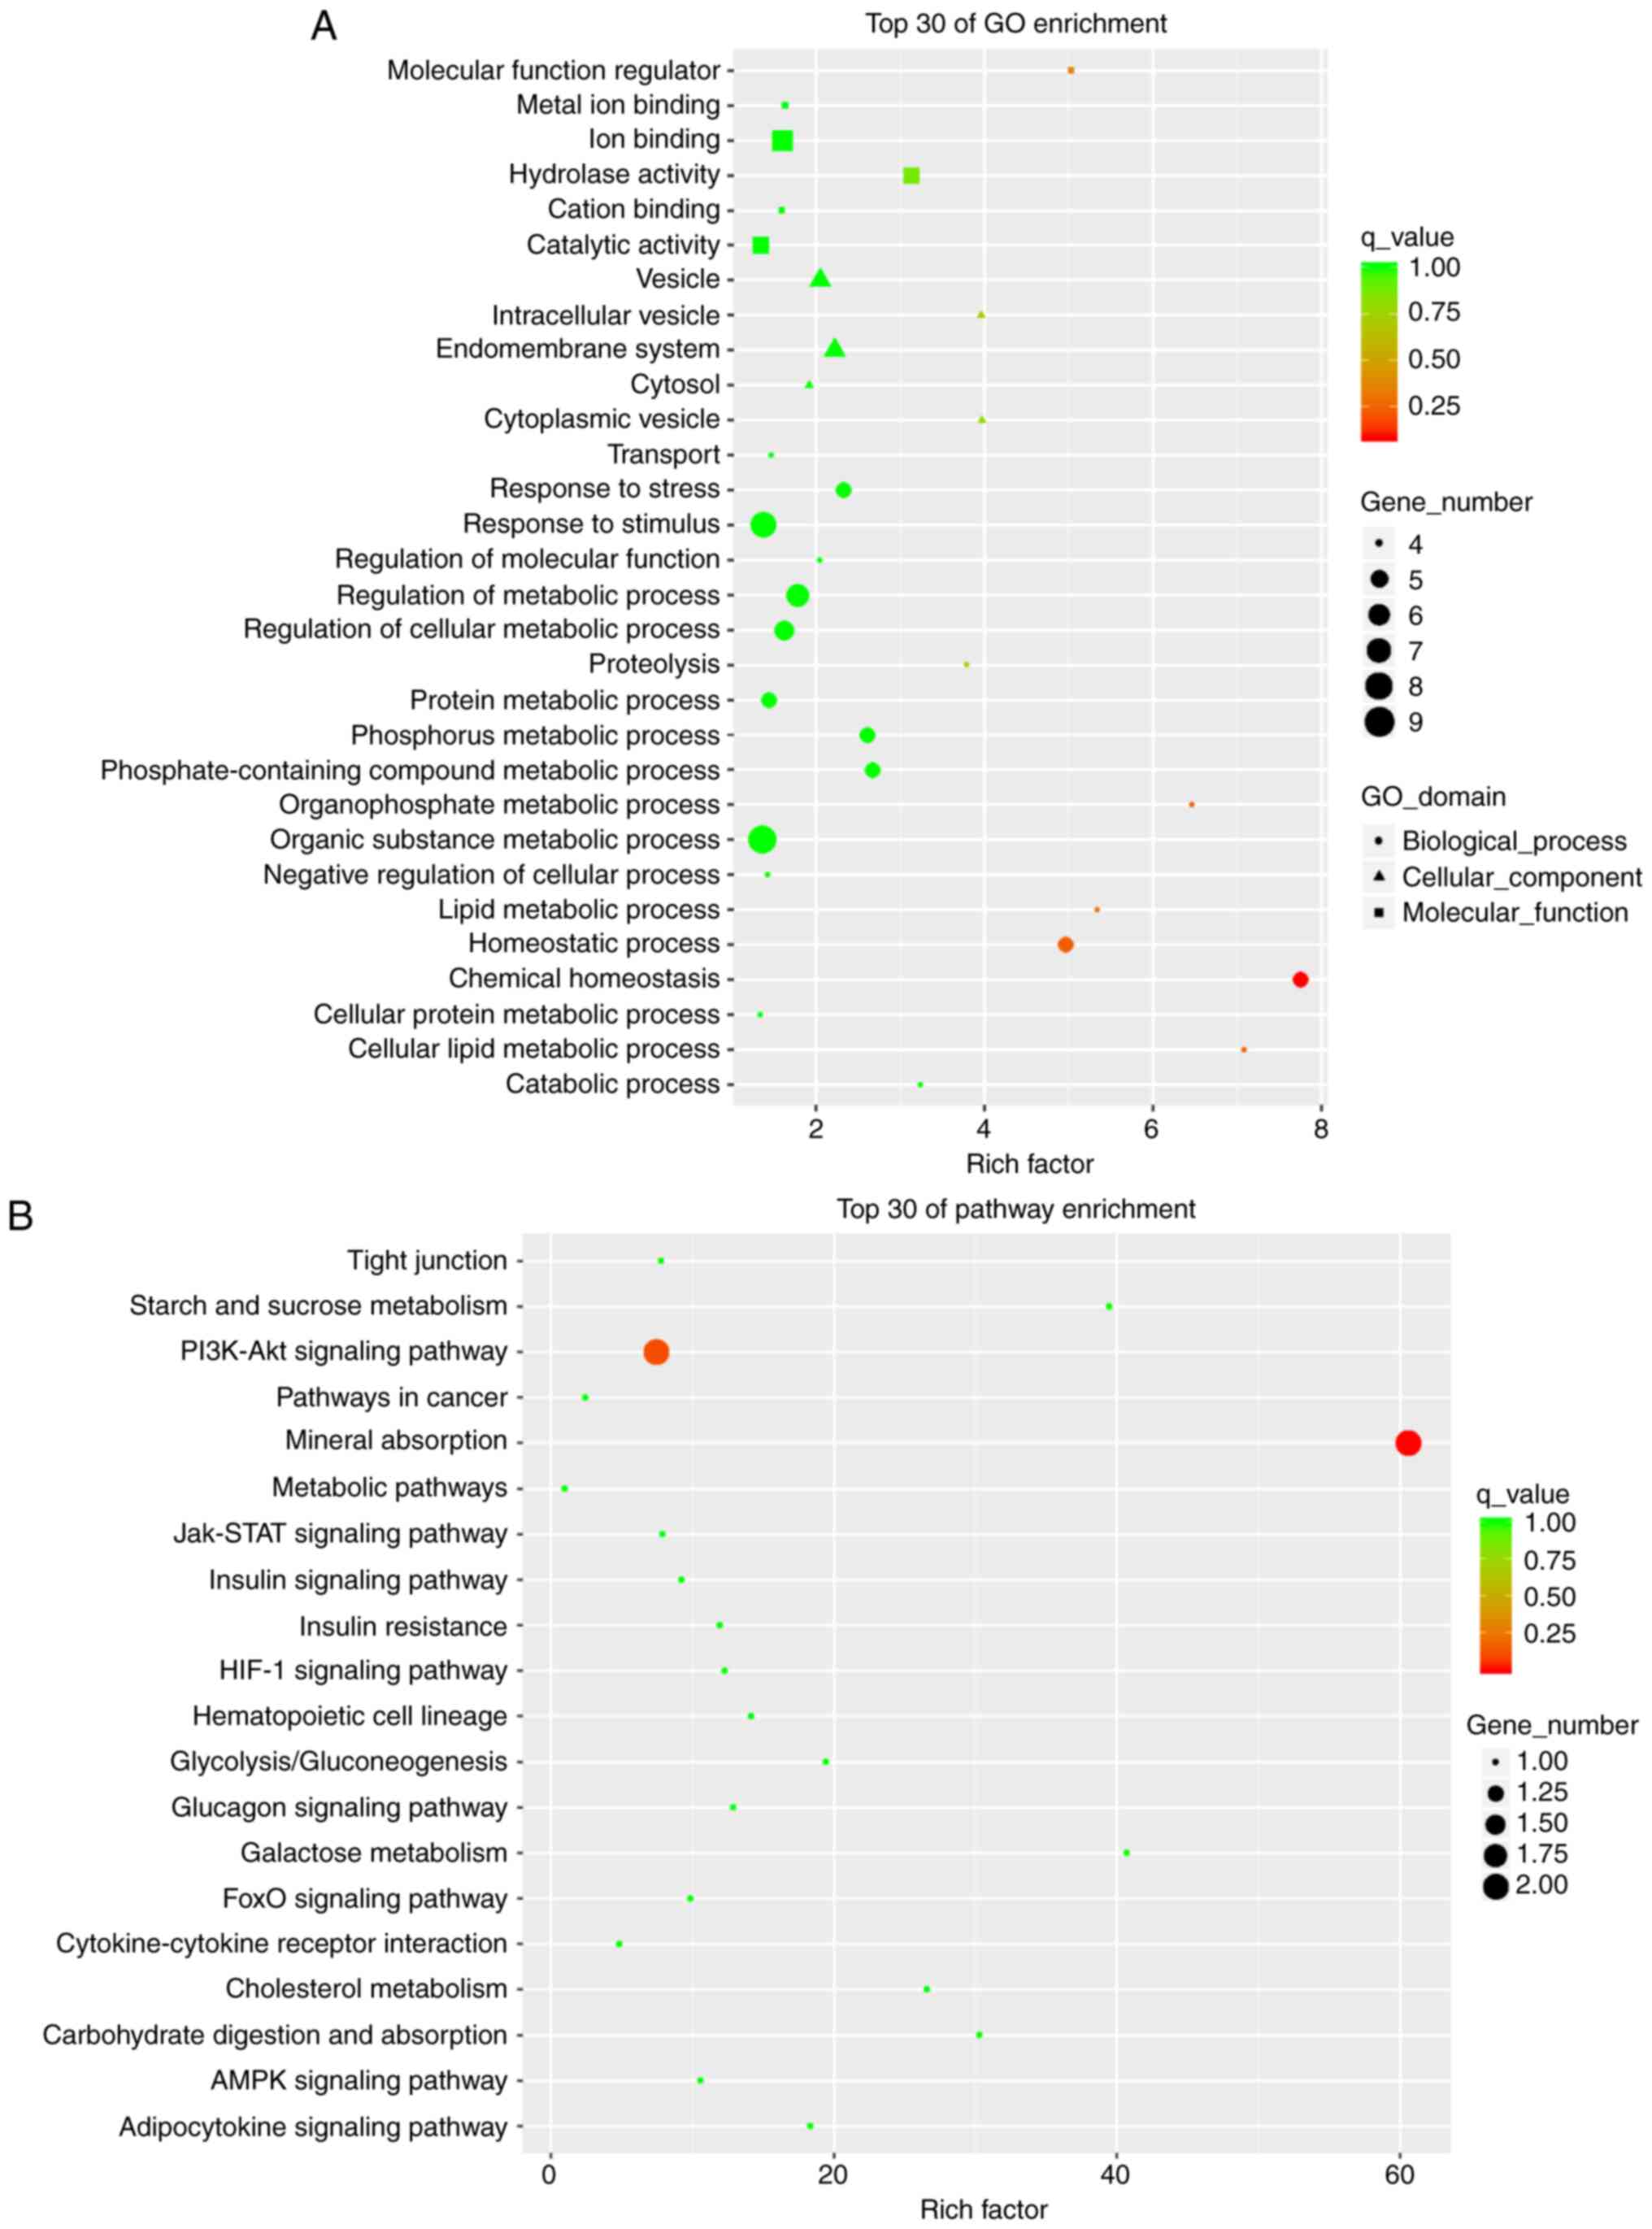
GO and KEGG enrichment analyses
GO analysis includes 'Biological Process (BP)',
'Molecular Function (MF)' and 'Cellular Component (CC)'. The
meaningful BPs in the top 30 mRNA enrichments of the GO analysis
mainly included 'chemical homeostasis', 'homeostatic process' and
'cellular lipid metabolic process'. CC mainly included 'cytoplasmic
vesicle' and 'intracellular vesicle'. MF included 'molecular
function regulator' and 'hydrolase activity' (Fig. 6A). KEGG pathway analysis revealed
the signaling pathways in which mRNAs with major differences were
involved. The top 30 pathway enrichments included 'mineral
absorption' and the 'PI3K-Akt signaling pathway'. Among these, the
PI3K/Akt signaling pathway is related to the liver insulin
resistance model of the HFD-fed mice (Fig. 6B). This pathway We selected and
the closely related target gene predicted was G6PC through pathway
analysis. Among the eight verified lncRNAs, NONMMUT034936.2
exhibited a similar trend in expression as this target gene, as
discussed below.
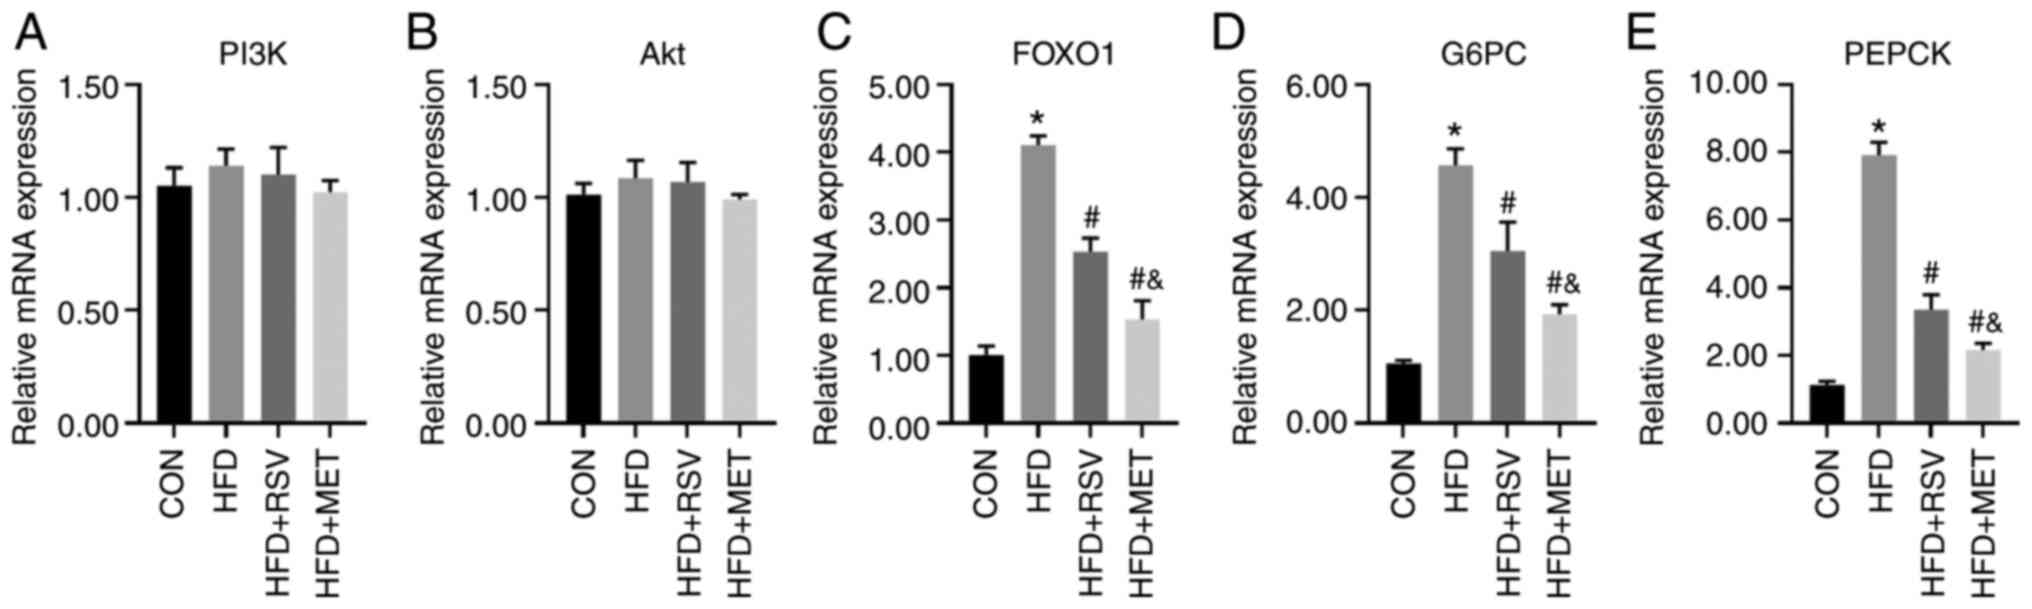
Comparison of the mRNA levels of PI3K/Akt
signaling pathway-related genes
The mRNA levels of several key molecules in the
PI3K/Akt signaling pathway, namely PI3K, Akt, FOXO1, G6PC and
PEPCK, were compared in the livers of mice in the CON, HFD, HFD +
RSV, and HFD + MET groups using RT-qPCR. No significant differences
in the mRNA expression levels of PI3K and Akt were observed among
these four groups (Fig. 7A and
B). Compared with the CON group, the mRNA levels of FOXO1, G6PC
and PEPCK were significantly increased in the HFD group, and those
in the HFD + RSV and HFD + MET groups were significantly decreased
compared with those in the HFD group. Compared with the HFD + RSV
group, the mRNA levels of FOXO1, G6PC and PEPCK in the HFD + MET
group were significantly decreased (Fig. 7C-E).
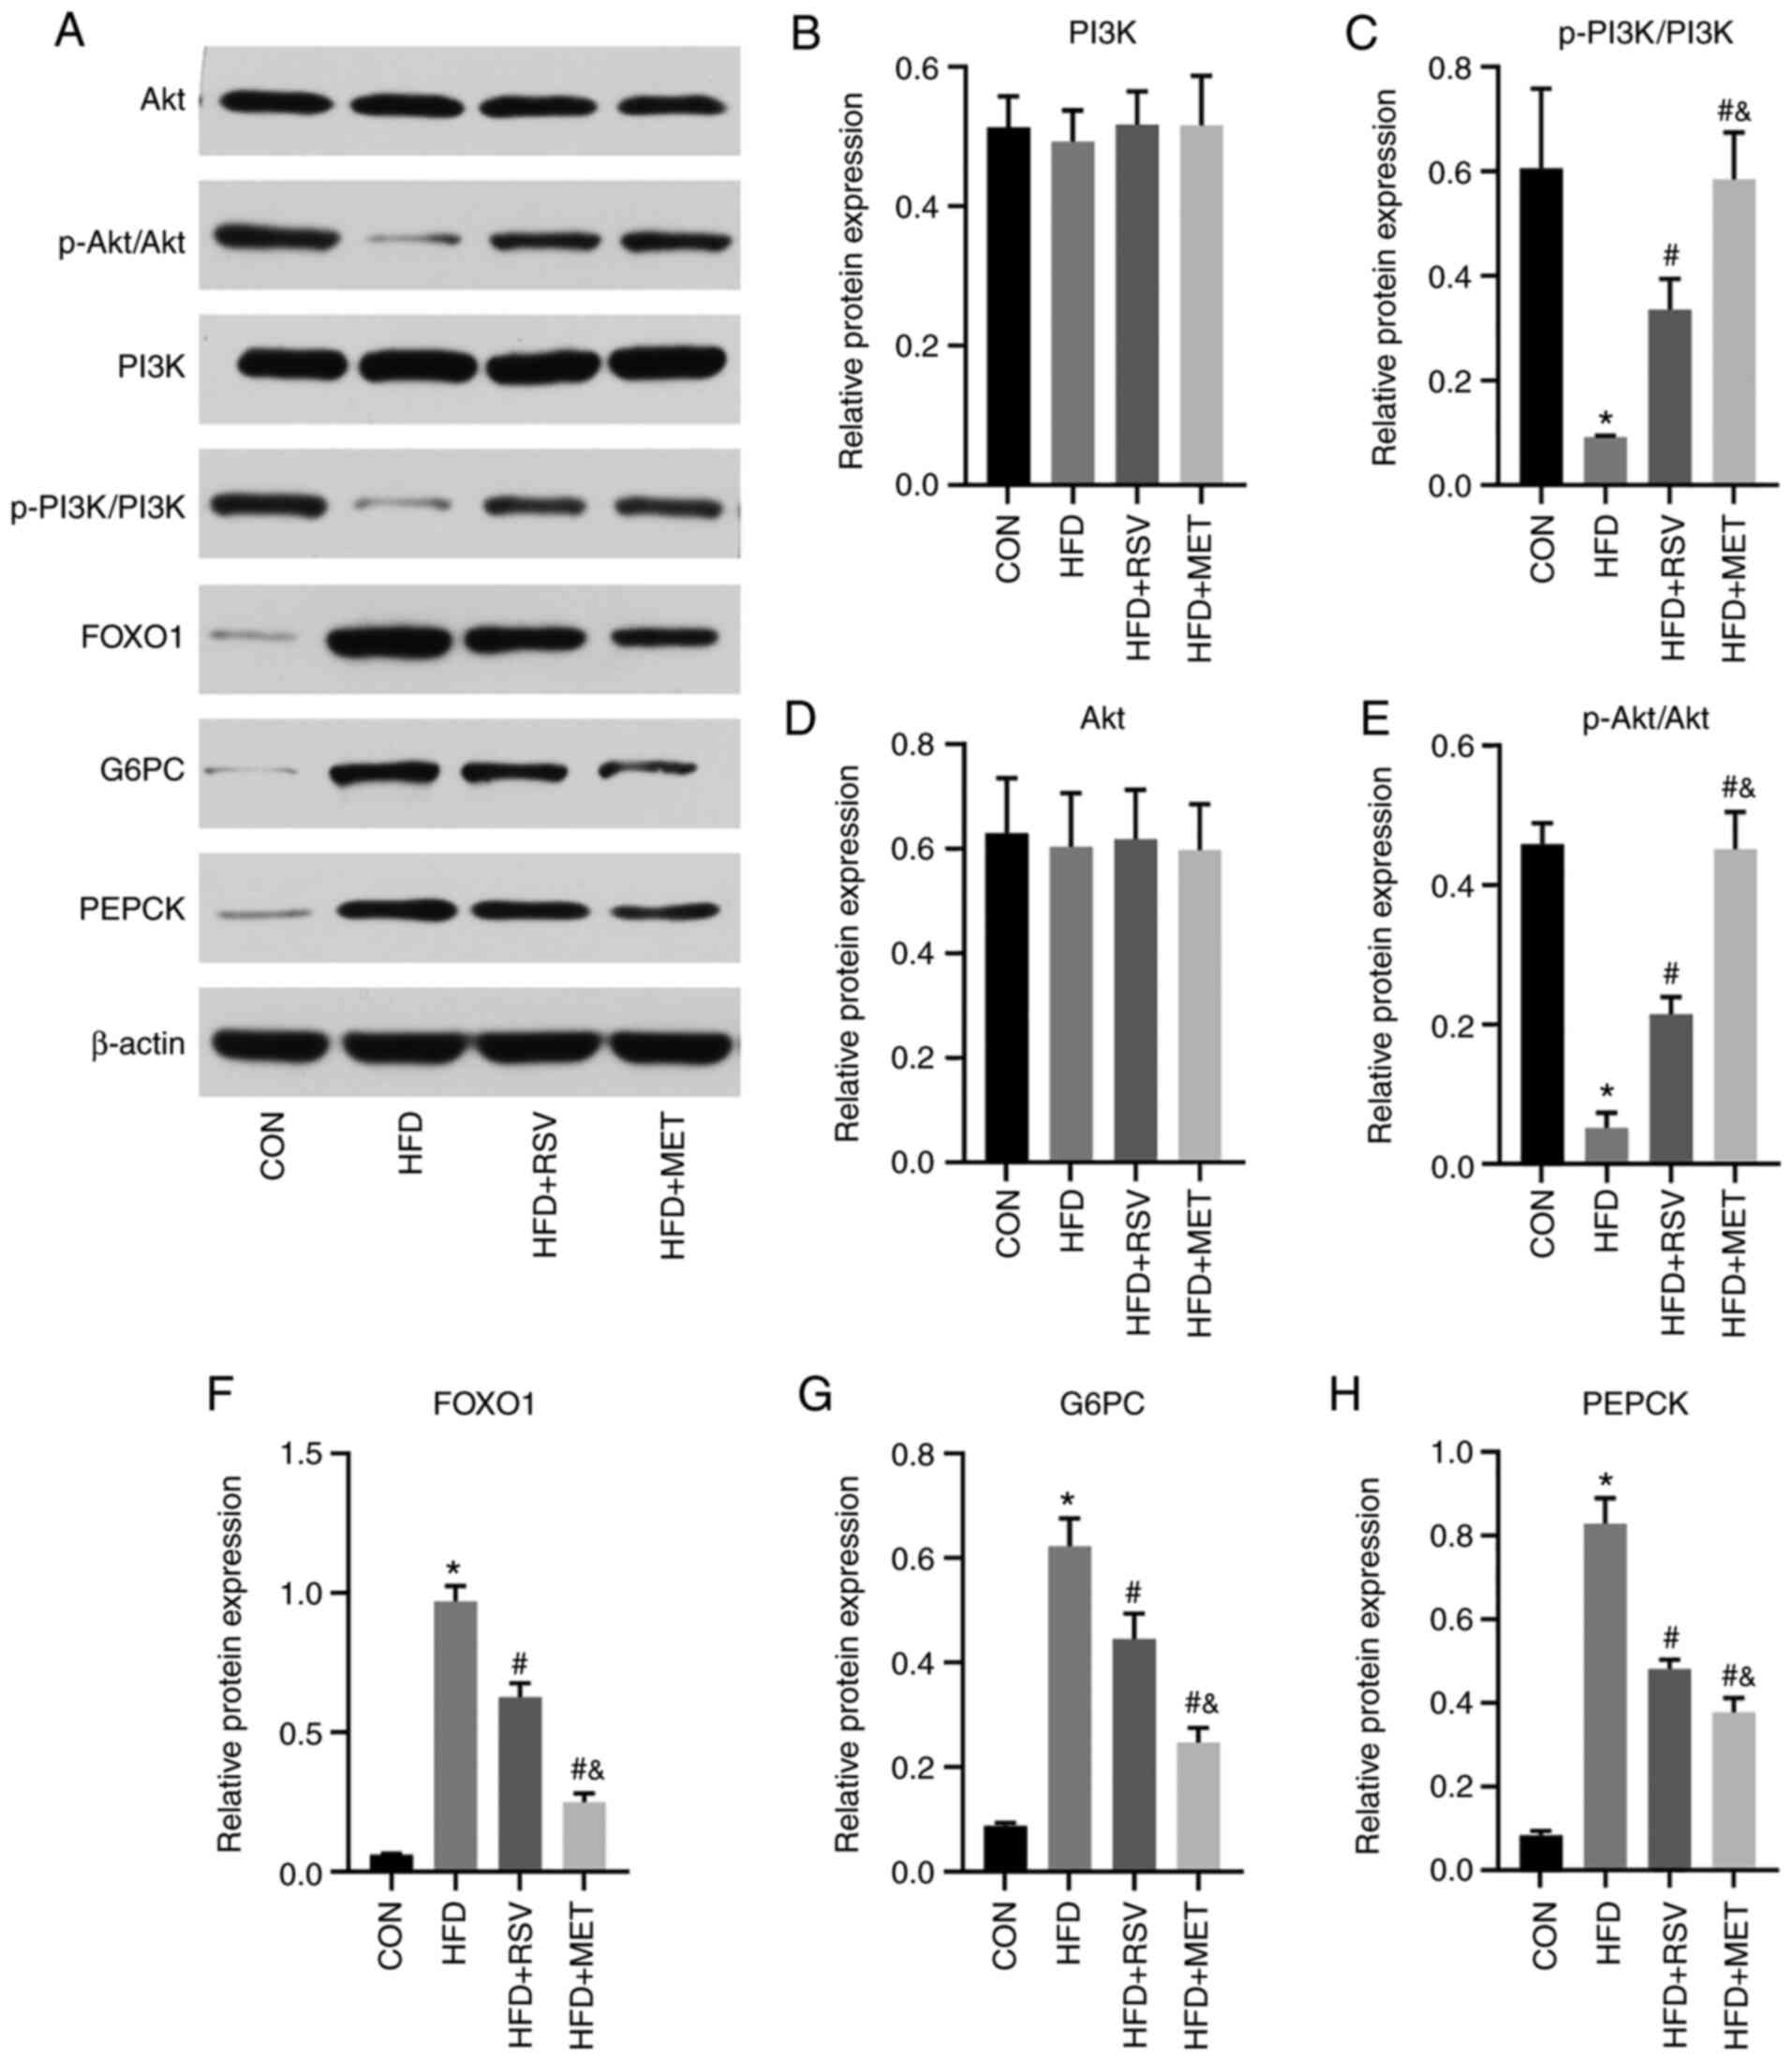
Comparison of protein levels of PI3K/Akt
signaling pathwayrelated genes
The same key molecules were selected to verify and
compare their protein levels using western blot analyhsis in the
four groups of mouse liver tissues (Fig. 8A). Compared with the CON group,
the levels of p-PI3K and p-Akt in the HFD group were significantly
decreased (Fig. 8C and E), while
those of FOXO1, G6PC and PEPCK were significantly increased
(Fig. 8F-H). Compared with the
HFD group, the levels of p-PI3K and p-Akt in the HFD + RSV and HFD
+ MET groups were significantly increased (Fig. 8C and E), while those of FOXO1,
G6PC and PEPCK were significantly decreased (Fig. 8F-H). Compared with the HFD + RSV
group, the HFD + MET group exhibited significantly increased
expression levels of p-PI3K and p-Akt (Fig. 8C and E), and significantly
decreased expression levels of FOXO1, G6PC and PEPCK (Fig. 8F and H). No significant
differences were observed in the total PI3K and Akt expression
levels among the four groups (Fig.
8B and D). The aforementioned results indicate that RSV may
attenuate insulin resistance via the PI3K/Akt signaling pathway
(Fig. 9).
Discussion
The liver is the main organ for glucose metabolism
(20,21). The abnormal activity of
gluconeogenesis can lead to an increased endogenous glucose
production, a major pathophysiological factor that causes T2DM and
insulin resistance (22). The
gluconeogenesis pathway mainly depends on two rate-limiting
enzymes, G6PC and PEPCK (23). A
variety of hormones and signaling pathways affect gluconeogenesis
by influencing the transcription and expression of these enzymes.
PI3K/Akt is the main signal transduction pathway for insulin to
exert physiological effects in the liver. FOXO1 is a downstream
molecule of PI3K/Akt signaling and an essential molecule in the
liver to regulate blood insulin levels. It mainly promotes
gluconeogenesis in the fasting liver by regulating the expression
of G6PC and PEPCK (24). The
overexpression of FOXO1 upregulates G6PC and PEPCK expression,
which promotes increased liver gluconeogenesis, impaired glucose
tolerance and insulin resistance when fasting, and inhibits liver
gluconeogenesis when FOXO1 expression is lost, at which time
glucose utilization is enhanced and insulin sensitivity increases
(25).
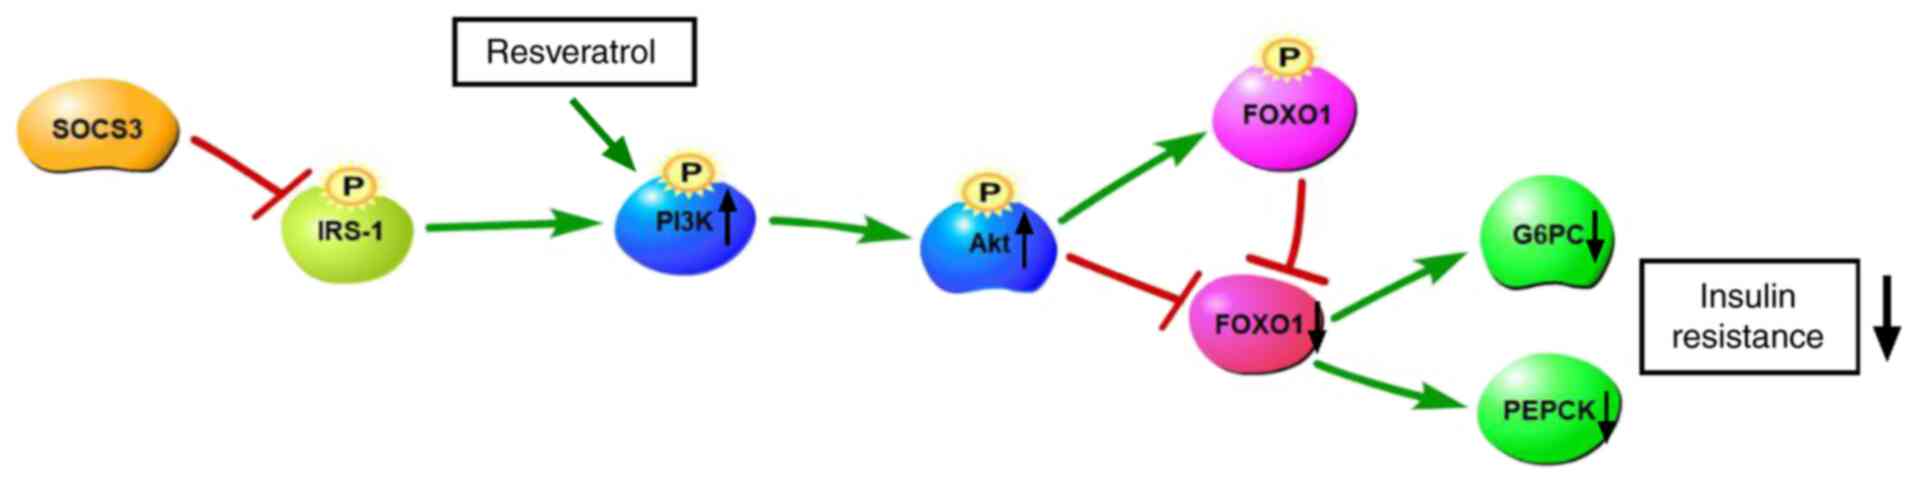
RSV is a natural polyphenolic plant toxin that has
received widespread attention in recent decades for the treatment
of metabolic diseases, such as T2DM, particularly to improve
insulin resistance (26).
Studies have demonstrated that RSV increases glucose uptake through
the PI3K/Akt signaling pathway in the absence of insulin (Fig. 9). The mechanisms through which
RSV improves insulin resistance involve a significant increase in
Akt phosphorylation levels (27). MET is a representative T2DM drug.
Its main target organ is the liver. MET effectively reduces blood
glucose levels by down regulating G6PC and PEPCK to inhibit liver
glucose secretion (28).
In the present study, both RSV and MET reduced blood
glucose levels, the insulin index and the AUC in HFD-fed mice, and
increased the QUICKI. In terms of the area AUC curve and QUICKI,
MET exerted more prominent effects than RSV, and there was no
significant differences in the other indicators. The results of
H&E and Oil Red O staining of the liver tissues revealed that
the morphological structure of the liver cells following treatment
with RSV and MET was clearer and more complete than in the HFD
group, the numbers of lipid droplets and vacuoles were decreased,
and the volume became smaller. These results indicated that both
RSV and MET attenuated insulin resistance and lipid deposition in
the livers of HFD-fed mice.
A recent study demonstrated that lncRNAs play an
important role in the development of T2DM. In such patients, a
variety of lncRNAs are associated with insulin resistance in
peripheral blood (29). Among
these, the expression of lncRNA H19 has been shown to be
significantly decreased in the skeletal muscle of patients with
T2DM and in insulin-resistant animals (30); H19 was the first lncRNA reported
to be related to gestational diabetes and inhibit insulin secretion
(31). Another study
demonstrated that the downregulation of lncRNA MALAT1 improved
glucose metabolism disorders in rats with T2DM, and MALAT1 may be a
potential serum marker for gestational diabetes (32). However, to the best of our
knowledge, there are no reports available to date on
insulin-resistant, HFD-fed animal models treated with RSV and MET
comparing the changes in lncRNA expression.
In the present study, using high-throughput
sequencing, 55 lncRNAs and 19 mRNAs with a differential expression
were found in the HFD + RSV and HFD + MET groups. A total of eight
lncRNAs were selected for verification using RT-qPCR. Apart from
NONMMUT051843.2, the expression levels of the other seven lncRNAs
were consistent with the sequencing results in the HFD + RSV and
HFD + MET groups, indicating that the sequencing results were
reliable. By performing GO and KEGG enrichment analyses of these 19
differentially expressed mRNAs, it was found that the numbers of
research areas and signaling pathways that were enriched were very
small, and only the PI3K/Akt signaling pathway was related to the
insulin resistance in the present study. The functional difference
between RSV and MET was not evident. Pathway analysis was used to
predict the target gene in G6PC, which is closely related to this
pathway. The expression of PI3K/Akt signaling pathway-related
molecules was measured using RT-qPCR. The expression levels of
FOXO1, G6PC and PEPCK were compared between the HFD + RSV and HFD +
MET groups. Compared with the HFD group, the levels of FOXO1, G6PC
and PEPCK were significantly decreased. The levels in the HFD + RSV
and HFD + MET groups were significantly decreased. It is noteworthy
that the NONMMUT034936.2 and G6PC target genes exhibited similar
expression patterns, indicating that RSV and MET may affect the
PI3K/Akt signaling pathway through NONMMUT034936.2 to increase
insulin sensitivity. Similarly, the present study verified PI3K/Akt
signaling pathway-related molecules of PI3K, Akt, FOXO1, G6PC and
PEPCK using western blot analysis and similar results were obtained
as those from RT-qPCR. These results demonstrated that, although
there were differences in the levels of PI3K/Akt signaling
pathway-related molecules between the HFD + RSV and HFD + MET
groups, the trend in these differences was that the mice fed the
HFD exhibited decreased levels of PI3K/Akt signaling
pathway-related molecules, and MET treatment eased insulin
resistance. Therefore, this difference indicated that MET may be
more effective than RSV in attenuating insulin resistance. This may
be linked to the animal model, drug dose, timing of the treatments,
and differences in the selected tissue.
Through high-throughput sequencing, the present
study found 55 lncRNAs with a differential expression in the HFD +
RSV group compared with the HFD + MET group. Verification analysis
revealed that the lncRNAs may be involved in the PI3K/Akt signaling
pathway. RSV or MET may improve liver insulin resistance by
regulating lncRNAs, and the effect of MET is more prominent. In
addition, there is insufficient research on combination therapy
with MET and RSV. Thus, the addition of a MET and RSV combined
treatment group may be a valuable research direction to observe the
effects of combined treatment. This may provide new insight for
further research. The present study provides new concepts and
treatment targets for RSV and MET intervention of T2DM. However,
the present study only used animal models. The molecular biological
functions and regulatory mechanisms of lncRNAs that improve insulin
resistance still need to be studied further and verified in cell
models.
In conclusion, the present study demonstrates that
both RSV and MET attenuate liver insulin resistance by regulating
lncRNAs, and MET exerts a more prominent effect. The RSV- and
MET-regulated lncRNAs may prove to be potential therapeutic targets
for T2DM.
Availability of data and materials
The datasets used and/or analyzed during the current
study are available from the corresponding author on reasonable
request.
Authors' contributions
LS performed the experiments, analyzed the data and
wrote the manuscript. XH performed the experiments and prepared the
figures. CW established the mouse model. GS and HM designed the
study and edited drafts of the manuscript. LS and XH confirm the
authenticity of all the raw data. All authors contributed to data
analysis, and the drafting or revising of the article, gave final
approval of the version to be published, and agree to be
accountable for all aspects of the work.
Ethics approval and consent to
participate
The present study was supervised and approved by the
Ethics Committee of the People's Hospital of Hebei Province (no.
201920) and performed in accordance with the Regulations on the
Administration of Laboratory Animals.
Patient consent for publication
Not applicable.
Competing interests
The authors declare that they have no competing
interests.
Acknowledgements
Not applicable.
Funding
The present study was funded by the Natural Science Foundation
of Hebei Province (grant no. H2018307071).
References
|
1
|
Kim J, Bilder D and Neufeld TP: Mechanical
stress regulates insulin sensitivity through integrin-dependent
control of insulin receptor localization. Genes Dev. 32:156–164.
2018. View Article : Google Scholar
|
|
2
|
Biasutto L, Mattarei A, Azzolini M, La
Spina M, Sassi N, Romio M, Paradisi C and Zoratti M: Resveratrol
derivatives as a pharmacological tool. Ann N Y Acad Sci.
1403:27–37. 2017. View Article : Google Scholar
|
|
3
|
Weiskirchen S and Weiskirchen R:
Resveratrol: How much wine do you have to drink to stay healthy?
Adv Nutr. 7:706–718. 2016. View Article : Google Scholar
|
|
4
|
Kai Y, Kawano Y, Yamamoto H and Narahara
H: A possible role for AMP-activated protein kinase activated by
metformin and AICAR in human granulosa cells. Reprod Biol
Endocrinol. 13:272015. View Article : Google Scholar
|
|
5
|
Abbasi Oshaghi E, Goodarzi MT, Higgins V
and Adeli K: Role of resveratrol in the management of insulin
resistance and related conditions: Mechanism of action. Crit Rev
Clin Lab Sci. 54:267–293. 2017. View Article : Google Scholar
|
|
6
|
Zhao W, Li A, Feng X, Hou T, Liu K, Liu B
and Zhang N: Metformin and resveratrol ameliorate muscle insulin
resistance through preventing lipolysis and inflammation in hypoxic
adipose tissue. Cell Signal. 28:1401–1411. 2016. View Article : Google Scholar
|
|
7
|
Liu XF, Hao JL, Xie T, Pant OP, Lu CB, Lu
CW and Zhou DD: The BRAF activated non-coding RNA: A pivotal long
non-coding RNA in human malignancies. Cell Prolif. 51:e124492018.
View Article : Google Scholar
|
|
8
|
Wang X, Chang X, Zhang P, Fan L, Zhou T
and Sun K: Aberrant expression of long non-coding RNAs in newly
diagnosed type 2 diabetes indicates potential roles in chronic
inflammation and insulin resistance. Cell Physiol Biochem.
43:2367–2378. 2017. View Article : Google Scholar
|
|
9
|
Shu L, Hou G, Zhao H, Huang W, Song G and
Ma H: Long non-coding RNA expression profiling following treatment
with resveratrol to improve insulin resistance. Mol Med Rep.
22:1303–1316. 2020. View Article : Google Scholar
|
|
10
|
Zhao H, Zhang Y, Shu L, Song G and Ma H:
Resveratrol reduces liver endoplasmic reticulum stress and improves
insulin sensitivity in vivo and in vitro. Drug Des Devel Ther.
13:1473–1485. 2019. View Article : Google Scholar
|
|
11
|
Zhang YJ, Zhao H, Dong L, Zhen YF, Xing
HY, Ma HJ and Song GY: Resveratrol ameliorates high-fat
diet-induced insulin resistance and fatty acid oxidation via
ATM-AMPK axis in skeletal muscle. Eur Rev Med Pharmacol Sci.
23:9117–9125. 2019.
|
|
12
|
Beaudoin MS, Snook LA, Arkell AM, Simpson
JA, Holloway GP and Wright DC: Resveratrol supplementation improves
white adipose tissue function in a depot-specific manner in Zucker
diabetic fatty rats. Am J Physiol Regul Integr Comp Physiol.
305:R542–R551. 2013. View Article : Google Scholar
|
|
13
|
Kristensen JM, Larsen S, Helge JW, Dela F
and Wojtaszewski JF: Two weeks of metformin treatment enhances
mitochondrial respiration in skeletal muscle of AMPK kinase dead
but not wild type mice. PLoS One. 13:e535332013. View Article : Google Scholar
|
|
14
|
Cheng K, Song Z, Zhang H, Li S, Wang C,
Zhang L and Wang T: The therapeutic effects of resveratrol on
hepatic steatosis in high-fat diet-induced obese mice by improving
oxidative stress, inflammation and lipid-related gene
transcriptional expression. Med Mol Morphol. 52:187–197. 2019.
View Article : Google Scholar
|
|
15
|
Chen K, Zhao H, Shu L, Xing H, Wang C, Lu
C and Song G: Effect of resveratrol on intestinal tight junction
proteins and the gut microbiome in high-fat diet-fed insulin
resistant mice. Int J Food Sci Nutr. 71:965–978. 2020. View Article : Google Scholar
|
|
16
|
Hrebícek J, Janout V, Malincíková J,
Horáková D and Cízek L: Detection of insulin resistance by simple
quantitative insulin sensitivity check index QUICKI for
epidemiological assessment and prevention. J Clin Endocrinol Metab.
87:144–147. 2002. View Article : Google Scholar
|
|
17
|
Livak KJ and Schmittgen TD: Analysis of
relative gene expression data using real-time quantitative PCR and
the 2(-Delta Delta C(T)) method. Methods. 25:402–408. 2001.
View Article : Google Scholar
|
|
18
|
Buchfink B, Xie C and Huson DH: Fast and
sensitive protein alignment using DIAMOND. Nat Methods. 12:59–60.
2015. View Article : Google Scholar
|
|
19
|
Zou Q, Mao Y, Hu L, Wu Y and Ji Z:
miRClassify: An advanced web server for miRNA family classification
and annotation. Comput Biol Med. 45:157–160. 2014. View Article : Google Scholar
|
|
20
|
Staehr P, Hother-Nielsen O and
Beck-Nielsen H: The role of the liver in type 2 diabetes. Rev
Endocr Metab Disord. 5:105–110. 2004. View Article : Google Scholar
|
|
21
|
Petersen MC, Vatner DF and Shulman GI:
Regulation of hepatic glucose metabolism in health and disease. Nat
Rev Endocrinol. 13:572–587. 2017. View Article : Google Scholar
|
|
22
|
Klover PJ and Mooney RA: Hepatocytes:
Critical for glucose homeostasis. Int J Biochem Cell Biol.
36:753–758. 2004. View Article : Google Scholar
|
|
23
|
Hatting M, Tavares CDJ, Sharabi K, Rines
AK and Puigserver P: Insulin regulation of gluconeogenesis. Ann NY
Acad Sci. 1411:21–35. 2018. View Article : Google Scholar
|
|
24
|
McCurdy CE, Schenk S, Holliday MJ, Philp
A, Houck JA, Patsouris D, MacLean PS, Majka SM, Klemm DJ and
Friedman JE: Attenuated Pik3r1 expression prevents insulin
resistance and adipose tissue macrophage accumulation in
diet-induced obese mice. Diabetes. 61:2495–2505. 2012. View Article : Google Scholar
|
|
25
|
Langlet F, Haeusler RA, Lindén D, Ericson
E, Norris T, Johansson A, Cook JR, Aizawa K, Wang L, Buettner C and
Accili D: Selective inhibition of FOXO1 activator/repressor balance
modulates hepatic glucose handling. Cell. 171:824–835.e18. 2017.
View Article : Google Scholar
|
|
26
|
Thiel G and Rössler OG: Resveratrol
regulates gene transcription via activation of stimulus-responsive
transcription factors. Pharmacol Res. 117:166–176. 2017. View Article : Google Scholar
|
|
27
|
Li JY, Huang WQ, Tu RH, Zhong GQ, Luo BB
and He Y: Resveratrol rescues hyperglycemia-induced endothelial
dysfunction via activation of Akt. Acta Pharmacol Sin. 38:182–191.
2017. View Article : Google Scholar
|
|
28
|
Zhou G, Myers R, Li Y, Chen Y, Shen X,
Fenyk-Melody J, Wu M, Ventre J, Doebber T, Fujii N, et al: Role of
AMP-activated protein kinase in mechanism of metformin action. J
Clin Invest. 108:1167–1174. 2001. View
Article : Google Scholar
|
|
29
|
Sathishkumar C, Prabu P, Mohan V and
Balasubramanyam M: Linking a role of lncRNAs (long non-coding RNAs)
with insulin resistance, accelerated senescence, and inflammation
in patients with type 2 diabetes. Hum Genomics. 12:412018.
View Article : Google Scholar
|
|
30
|
Gao Y, Wu F, Zhou J, Yan L, Jurczak MJ,
Lee HY, Yang L, Mueller M, Zhou XB, Dandolo L, et al: The H19/let-7
double-negative feedback loop contributes to glucose metabolism in
muscle cells. Nucleic Acids Res. 42:13799–13811. 2014. View Article : Google Scholar
|
|
31
|
Ding GL, Wang FF, Shu J, Tian S, Jiang Y,
Zhang D, Wang N, Luo Q, Zhang Y, Jin F, et al: Transgenerational
glucose intolerance with Igf2/H19 epigenetic alterations in mouse
islet induced by intrauterine hyperglycemia. Diabetes.
61:1133–1142. 2012. View Article : Google Scholar
|
|
32
|
Zhang Y, Wu H, Wang F, Ye M, Zhu H and Bu
S: Long non-coding RNA MALAT1 expression in patients with
gestational diabetes mellitus. Int J Gynaecol Obstet. 140:164–169.
2018. View Article : Google Scholar
|