Introduction
The GLOBOCAN database reported 431,288 new kidney
cancer cases worldwide in 2020 (1). Clear cell renal cell carcinoma
(ccRCC) accounts for ~75% of renal cell carcinomas (RCCs) and is
responsible for most RCC-related mortality (2,3).
Although novel drugs have been implemented for ccRCC treatment
since 2005, this cancer remains a therapeutic challenge, especially
if diagnosed at the metastatic stage (3). Therefore, novel prognostic factors
or therapeutic approaches for ccRCC based on molecular mechanisms
involved in the pathogenesis of this cancer are required (4).
The Sonic hedgehog (SHH) pathway is a molecular
signaling cascade, the activity of which is mainly limited to
embryonic life (5). Through
SHH/patched 1 (PTCH1)/smoothened (SMO)/glioma-associated zinc
finger protein (GLI)2, 3 proteins, this signaling pathway
stimulates the expression of the downstream activator GLI1
and PTCH1 repressor, followed by activation (via GLI1
protein) of several target genes, including MYC proto-oncogene
(MYC), BCL2 apoptosis regulator (BCL2), vascular
endothelial growth factor A (VEGFA) and cyclin D1
(CCND1) (Fig. 1)
(6). Their molecular products
are pro-carcinogenic proteins (7-10), since they stimulate cell
proliferation, possess anti-apoptotic and pro-angiogenic
properties, and activate the cell cycle. MYC and BCL2
gene amplifications, as well as higher mRNA levels of VEGFA
and CCND1, are associated with shorter survival of patients
with esophageal squamous cell carcinoma (11), diffuse large B-cell lymphoma
(12), lung cancer (13) and gastric cancer (14), respectively. However, reports
regarding the expression of the SHH pathway components and their
effects on downstream genes in ccRCC remain limited and ambiguous
(15-19).
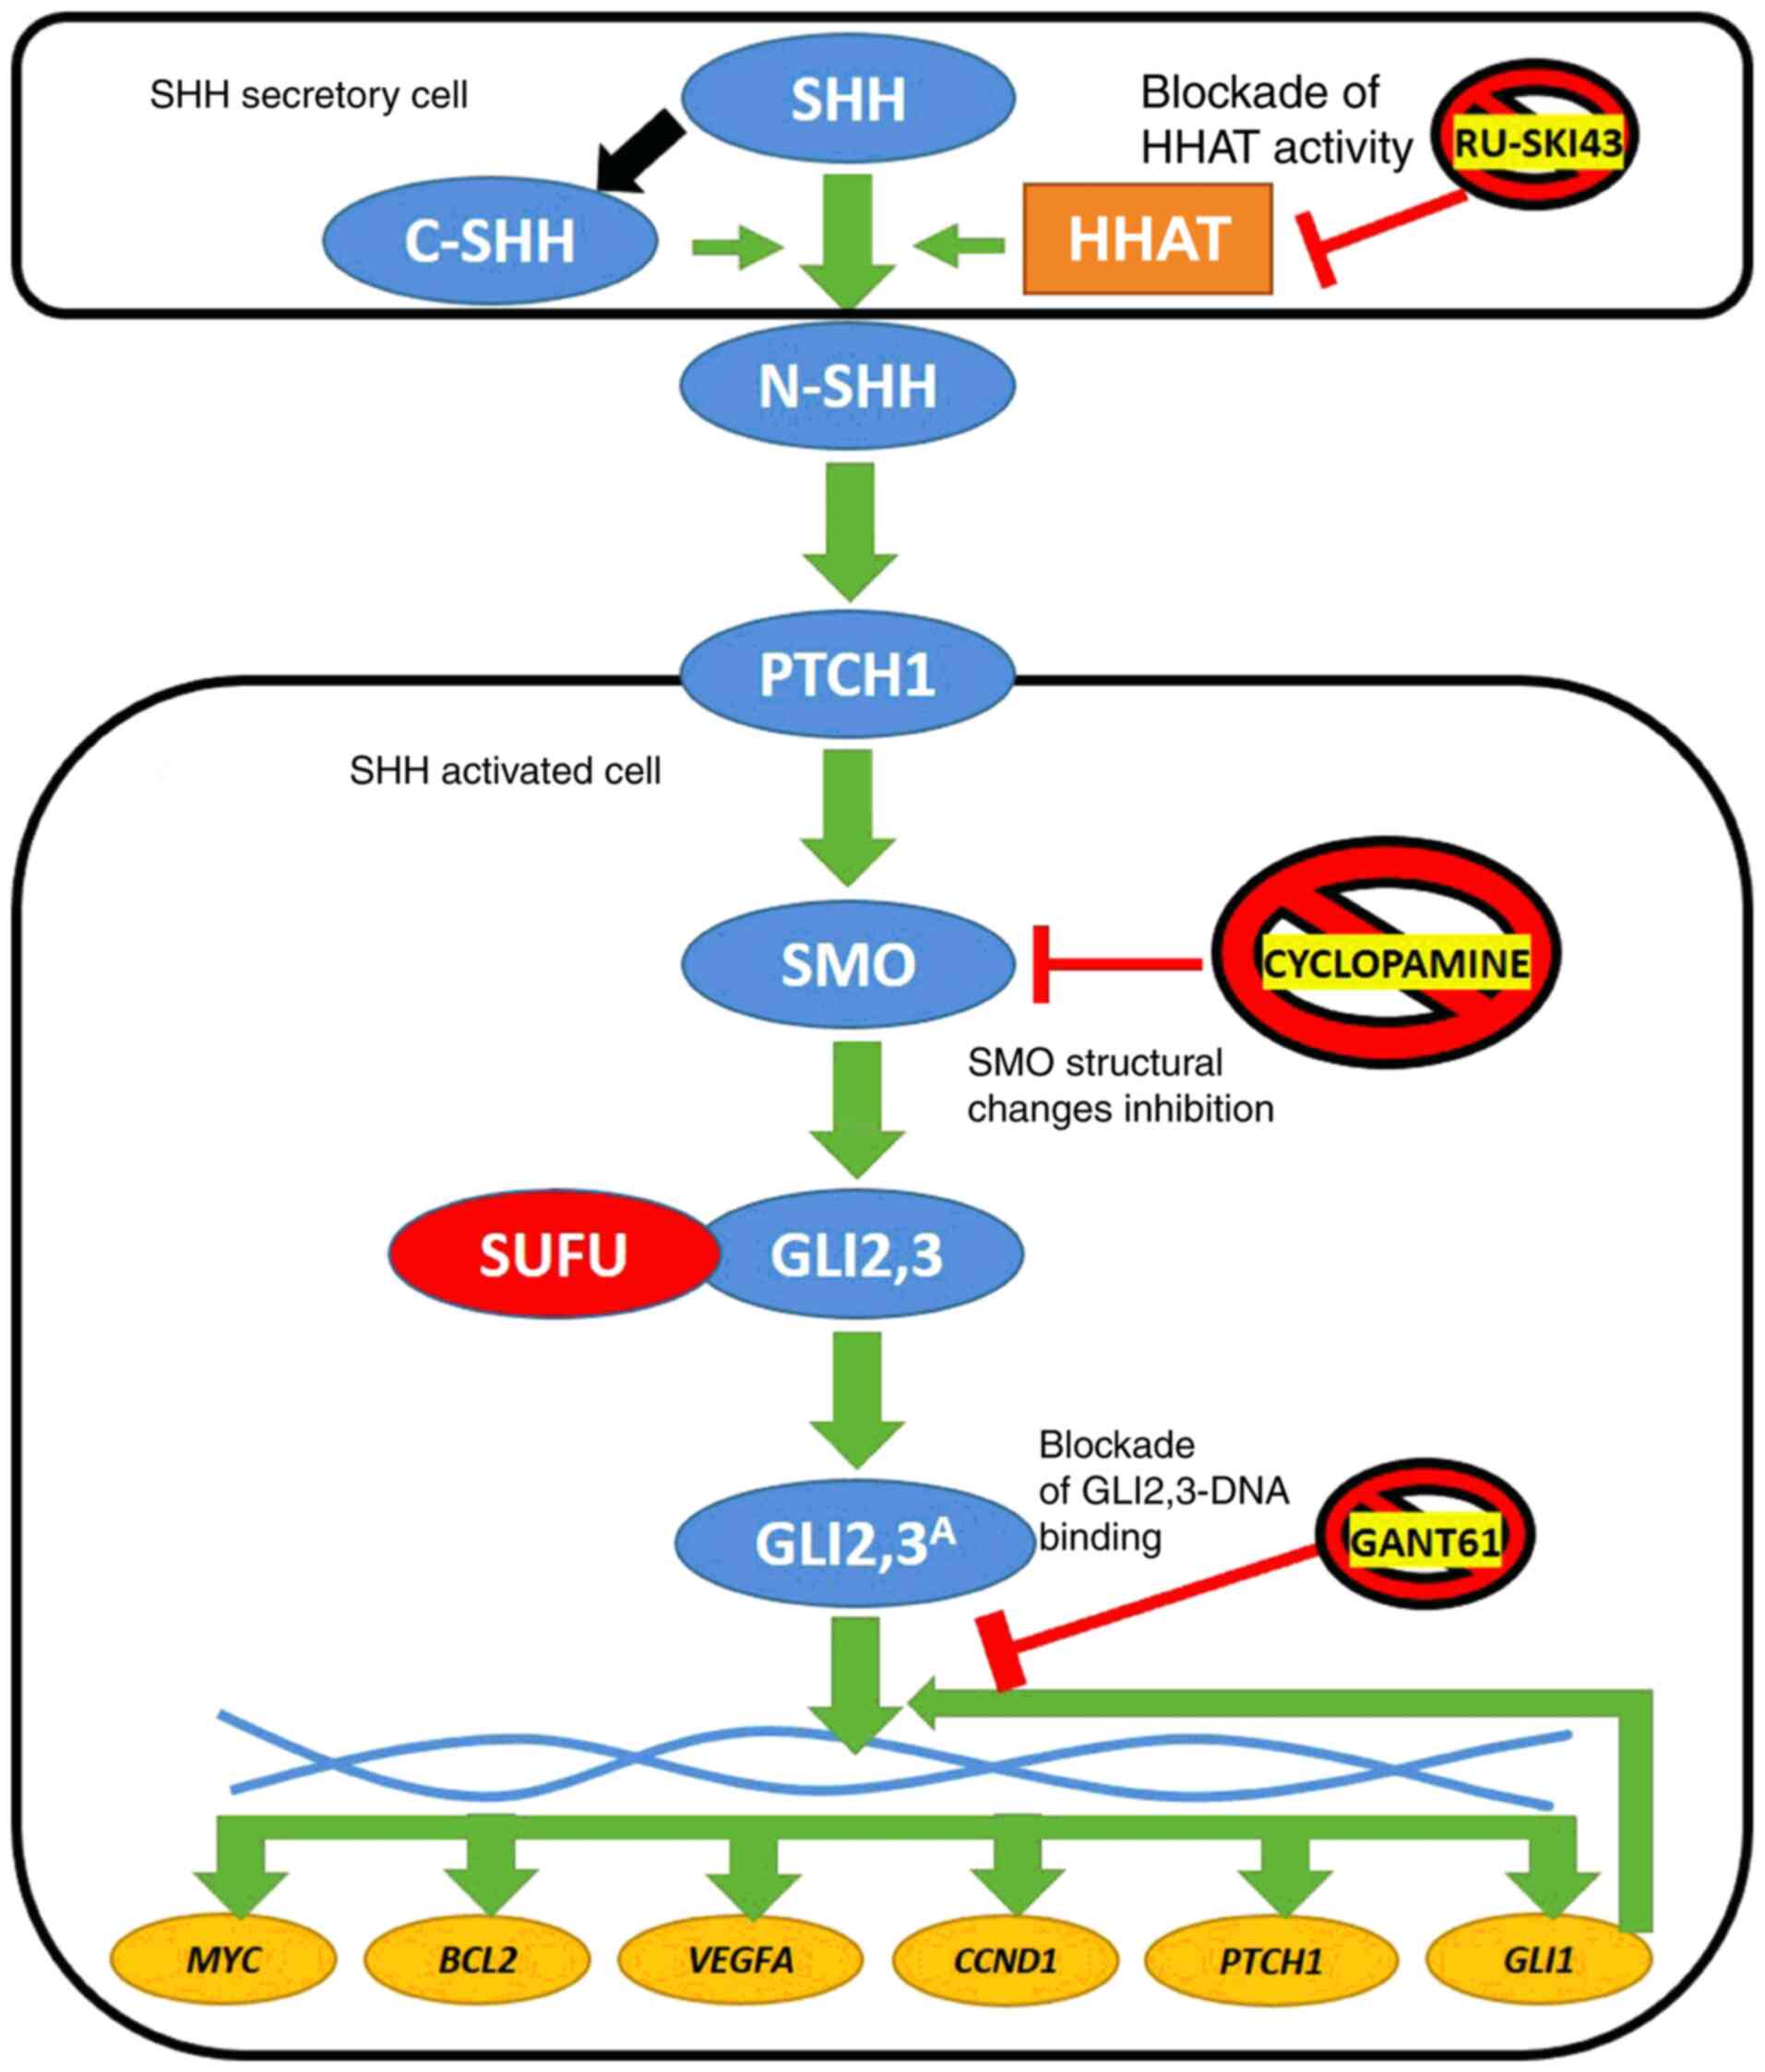 | Figure 1Simplified diagram of SHH pathway
activation in vertebrates. SHH ligand undergoes posttranslational
cleavage into N- and C-terminal SHH. Structural modifications of
N-SHH caused by C-SHH and HHAT lead to its binding with the PTCH1
receptor. This stimulates SMO protein to process GLI2 and GLI3,
which dissociate from the SUFU protein and finally stimulate the
expression of target genes (MYC, BCL2, VEGFA,
CCND1, PTCH1 and GLI1). The latter encodes
another transcriptional activator of SHH signaling (6). Three SHH pathway inhibitors are
presented in the figure: RU-SKI43 blocks the activity of the HHAT
enzyme (21), cyclopamine
inhibits conformational changes of the SMO protein (23) and GANT61 modifies the structure
of GLI1 and GLI2, preventing their interaction with double-stranded
DNA (24). Blue circles,
proteins of the SHH signaling pathway; red circle, negative SHH
pathway regulator; yellow circles, SHH cascade target genes; and
orange rectangle, enzyme. SHH, sonic hedgehog ligand; C-SHH,
C-terminal part of the SHH ligand; N-SHH, N-terminal part of the
SHH ligand; HHAT, hedgehog acyltransferase; PTCH1, patched 1; SMO,
smoothened; SUFU, suppressor of fused homolog; GLI1,2,3,
glioma-associated zinc finger protein 1, 2, 3; GLI2,3A,
activated glioma-associated zinc finger protein 2, 3; VEGFA,
vascular endothelial growth factor A; CCND1, cyclin D1; GANT61,
GLI-antagonist 61. |
Based on numerous reports on SHH pathway alterations
in various cancer types, several inhibitory drugs have been
developed (20). They may block
signaling at different pathway stages. RU-SKI43 is a selective
inhibitor of hedgehog acyltransferase (HHAT; Fig. 1) (21). HHAT provides chemical
modifications the N-terminal part of the SHH ligand (N-SHH), thus
providing upstream activation of the SHH pathway (22). Another SHH pathway inhibitor,
cyclopamine, blocks conformational changes of the SMO protein, and
thus prevents its activation by inhibiting GLI2-3 release (Fig. 1) (23). GLI-antagonist 61 (GANT61) is one
of the most promising anticancer agents, since it can modify the
structure of both GLI1 and GLI2, preventing them from DNA binding
and action as transcription factors (TFs) (Fig. 1) (24,25). To the best of our knowledge, no
comparative studies on the effect of the aforementioned inhibitors
of the SHH pathway on RCC cells have been published.
Our previous research examining 37 ccRCC tissue
samples revealed deregulation of the expression levels of SHH
pathway genes (16). Therefore,
in the present study, a more comprehensive analysis of the mRNA
levels of SHH, PTCH1, SMO and suppressor of
fused homolog (SUFU), TFs GLI1-3 and their target
genes in ccRCC tissues and cell lines was performed. Furthermore,
the study focused on comparative analysis concerning the effects of
RU-SKI43, cyclopamine and GANT61 inhibitors on proliferation, cell
cycle distribution, migration and gene expression in ccRCC cell
lines and a normal kidney cell line.
Materials and methods
Patients and samples
ccRCC tumor tissues and morphologically unchanged
kidney samples were obtained during radical nephrectomy from 62
patients who underwent surgery at the Department of Urology,
Medical University of Gdańsk (Gdansk, Poland). The samples were
collected over a 4-year period from 2017 to 2020. The study
included 62 patients with ccRCC, including 21 women and 41 men
(mean age ± SD, 63,84±11.25 years, age range: 33-86 years). The
exclusion criteria included: other than ccRCC histological subtypes
of RCC, multifocal and/or bilateral kidney tumors and Von
Hippel-Lindau disease. The study was approved by the Independent
Bioethics Committee for Scientific Research at Medical University
of Gdańsk (decision nos. NKEBN/4/20 11 and NKBBN/370/2016). Written
informed consent was acquired from each patient before surgery.
Material acquisition
Small (ca. 5×5×5 mm) pieces of ccRCC tumor tissues
and control, morphologically unchanged kidney samples from the same
patient, were placed into test tubes in the operating theater, no
later than 20 min after kidney resection. Tissue samples for
quantitative PCR (qPCR) analysis were placed in test tubes filled
with 5 volumes of RNAlater (Ambion; Thermo Fisher Scientific,
Inc.), and were placed at -80°C after 24 h incubation at 4°C. The
other two samples of tumor tissues were fixed in 4% buffered
formalin, embedded in paraffin, sectioned and stained with
hematoxylin and eosin (H&E) for histopathological assessment.
The samples were included in the qPCR analysis if >60% cells in
the respective histological sections in tumor samples presented
characteristic features of ccRCC, while all cells of unchanged
(control) samples presented normal morphology (26,27). If both conditions were not
fulfilled, the material was excluded from the study.
Total RNA isolation
Total RNA from the collected samples was isolated
using the ExtractMe Total RNA kit (Blirt, Inc.) according to the
manufacturer's protocol. The collected samples were homogenized in
2-ml tubes with 300 µl lysis buffer and ceramic beads using
the MagnaLyser apparatus (Roche Diagnostics) for 40 sec at 6,000
rpm at room temperature. The obtained RNA was dissolved in 70
µl nuclease-free water. The quantity and quality of RNA were
measured using a spectrophotometer (NanoDrop ND 1000; Thermo Fisher
Scientific, Inc.). RNA samples were stored at -80°C until further
analysis. For first-strand cDNA synthesis, 1 µg RNA was
reverse transcribed using 1 µl RevertAid reverse
transcriptase (Fermentas; Thermo Fisher Scientific, Inc.) and 0.5
µg dT18 primers (Sigma-Aldrich; Merck KGaA) in a total
volume of 20 µl. The reaction was performed according to the
manufacturer's protocol (Thermo Fisher Scientific, Inc.). cDNA
samples were stored at -20°C until further analysis.
Assessment of gene mRNA levels
mRNA assessment was performed using the qPCR
technique. Primer sequences were designed using the Primer-BLAST
software (https://www.ncbi.nlm.nih.gov/tools/primer-blast/).
Their concentrations, as well as experimentally established
reaction conditions, are presented in Table I. The measurements were performed
in duplicate using 1 µl 4X-diluted cDNA and AmplifyMe NoRox
SybrGreen (Blirt, Inc.) chemistry in a total volume of 10
µl. The reaction was conducted on a separate PCR plate
(4titude, Ltd.) for each gene with a negative control (water
instead of cDNA) and 10X diluted pooled cDNA as a precision
control. A StepOne Plus apparatus with StepOne Plus software ver.
2.3 (Applied Biosystems; Thermo Fisher Scientific, Inc.) was used
for the amplification process and data analysis. Geometric mean of
Ct (threshold cycle) values for each gene were normalized to the
reference gene [glucuronidase β (GUSB)], according to our previous
normalization study on ccRCC (28), using Livak's equation (29): x=2ΔCt, where x stands
for expression of gene y and ΔCt=(Ct GUSB-Ct gene Y). Obtained raw
expression data for each tumor sample were calibrated to average
expression data of control samples (fold change; control
sample=1).
 | Table IDetails of the qPCR assays used in
the study. |
Table I
Details of the qPCR assays used in
the study.
| Gene name | GeneBank transcript
Acc. no. | Primer
sequences | qPCR reaction
conditions | qPCR reaction
content |
|---|
| BCL2 | NM_000633.2 |
5′-GGATAACGGAGGCTGGGATG | 95°C, 2 min; 40 ×
(95°C, 5 sec; 59°C, 10 sec; 72°C, 12 sec; | 5 µl
AmplifyMe |
|
5′-AGCCAGGAGAAATCAAACAGAG 300 nM each | 77°C, 10 sec-sample
reading) Melting curve: 95°C, 15 sec; 60°C, 1 min; 60°C → 95°C
reading every 0.3°C | NoRox SybrGreen
(Blirt, Poland), Σ 10 µl |
| CCND1 | NM_053056.3 |
5′-TGTCCTACTTCAAATGTGTGCA | 95°C, 2 min; 40 ×
(95°C, 5 sec; 57°C, 10 sec; 72°C, 12 sec; |
|
5′-ATTGGAAATGAACTTCACATCTGT 300 nM
each | 77 °C, 10
sec-sample reading) Melting curve: 95°C, 15 sec; 60°C, 1 min; 60°C
→ 95°C reading every 0.3°C | |
| GLI1 | NM_005269.2 |
5′-CTACATCAACTCCGGCCAATAG | 95°C, 2 min; 40 ×
(95°C, 5 sec; 58°C, 10 sec; 72°C, 12 sec; | |
|
5′-TGACAGTATAGGCAGAGCTGAT 300 nM each | 77 °C, 10
sec-sample reading) Melting curve: 95°C, 15 sec; 60°C, 1 min; 60°C
→ 95°C reading every 0.3°C | |
| GLI2 | NM_005270.4 |
5′-CTCCAACGAGAAACCCTACATC | 95°C, 2 min; 40 ×
(95°C, 5 sec; 59°C, 10 sec; 72°C, 12 sec; | |
|
5′-CACTGTCCCCATTCTCTTTGAG 200 nM each | 77 °C, 10
sec-sample reading) Melting curve: 95°C, 15 sec; 60°C, 1 min; 60°C
→ 95°C reading every 0.3°C | |
| GLI3 | NM_000168.5 |
5′-CTCTGACCGATGGAGGTAGTAT | 95°C, 2 min; 40 ×
(95°C, 5 sec; 58°C, 12 sec; 72°C, 12 sec; | |
|
5′-TGTGTGCCATTTCCTATGAGAG 135 nM each | 77 °C, 10
sec-sample reading) Melting curve: 95°C, 15 sec; 60°C, 1 min; 60°C
→ 95°C reading every 0.3°C | |
| GUSB | NM_000181.4 |
5′-ATGCAGGTGATGGAAGAAGTGGTG | 95°C, 3 min; 40 ×
(95°C, 5 sec; 57°C, 10 sec; 72°C, 10 sec; | |
|
5′-AGAGTTGCTCACAAAGGTCACAGG 200 nM
each | 75 °C, 10
sec-sample reading) Melting curve: 95°C, 15 sec; 60°C, 1 min; 60°C
→ 95°C reading every 0.3°C | |
| MYC | NM_001354870.1 |
5′-AAACATCATCATCCAGGACTGT | 95°C, 2 min; 40 ×
(95°C, 5 sec; 58°C, 10 sec; 72°C, 30 sec; | |
|
5′-TCTTCTTGTTCCTCCTCAGAGT 300 nM each | 77 °C, 10
sec-sample reading) Melting curve: 95°C, 15 sec; 60°C, 1 min; 60°C
→ 95°C reading every 0.3°C | |
| PTCH1 | NM_000264.3 |
5′-GAATCCCTTTTGAGGACAGGAC | 95°C, 2 min; 40 ×
(95°C, 5 sec; 59°C, 10 sec; 72°C, 12 sec; | |
|
5′-GCATGGTAATCTGCGTTTCATG 200 nM each | 77 °C, 10
sec-sample reading) Melting curve: 95°C, 15 sec; 60°C, 1 min; 60°C
→ 95°C reading every 0.3°C | |
| SHH | NM_000193.3 |
5′-GCAAAGCAAAAAGACACTCGG | 95°C, 2 min; 40 ×
(95°C, 5 sec; 59°C, 10 sec; 72°C, 12 sec; | |
|
5′-ATTTAAGGCTCTTGAAGGTCCG 200 nM each | 77 °C, 10
sec-sample reading) Melting curve: 95°C, 15 sec; 60°C, 1 min; 60°C
→ 95°C reading every 0.3°C | |
| SMO | NM_005631.4 |
5′-ACTTCTTCAACCAGGCTGAGT | 95°C, 2 min; 40 ×
(95°C, 5 sec; 59°C, 10 sec; 72°C, 12 sec; | |
|
5′-TCATCTTGCTCTTCTTGATCCG 300 nM each | 77 °C, 10
sec-sample reading) Melting curve: 95°C, 15 sec; 60°C, 1 min; 60°C
→ 95°C reading every 0.3°C | |
| SUFU | NM_016169.3 |
5′-TTCTGTTGACCGAAGAGTTTGT | 95°C, 2 min; 40 ×
(95°C, 5 sec; 59°C, 10 sec; 72°C, 12 sec; | |
|
5′-TGGGAAGTTTGAATTCCTCTGG 200 nM each | 77 °C, 10
sec-sample reading) Melting curve: 95°C, 15 sec; 60°C, 1 min; 60°C
→ 95°C reading every 0.3°C | |
| VEGFA | NM_001025366.2 |
5′-GTCTAATGCCCTGGAGCCT | 95°C, 2 min; 40 ×
(95°C, 5 sec; 59°C, 10 sec; 72°C, 30 sec; | |
|
5′-TTCGTTTAACTCAAGCTGCCTC 200 nM each | 77 °C, 10
sec-sample reading) Melting curve: 95°C, 15 sec; 60°C, 1 min; 60°C
→ 95°C reading every 0.3°C | |
Cell cultures and reagents
The 786-O (CRL1932™) and ACHN (CRL1611™) human RCC
cell lines and the HK2 (CRL2190™) human proximal kidney
tubule-derived cell line were obtained from the American Type
Culture Collection (ATCC). The 786-O and ACHN cells were cultured
in RPMI-1640 medium (Sigma-Aldrich; Merck KGaA) and Eagle's Minimum
Essential Medium (MEM; Sigma-Aldrich; Merck KGaA), respectively.
Both media were supplemented with 10% FBS (Sigma-Aldrich; Merck
KGaA) and 1% penicillin-streptomycin (Sigma-Aldrich; Merck KGaA).
MEM was additionally supplemented with 2% L-glutamine
(Sigma-Aldrich; Merck KGaA). HK-2 cells were cultured in
keratinocyte serum-free medium (Gibco; Thermo Fisher Scientific,
Inc.). The cells were cultured in a sterile incubator that was
maintained at 37°C in an atmosphere of 5% CO2. RU-SKI43,
cyclopamine, GANT61 and sunitinib were purchased from
Sigma-Aldrich; Merck KGaA and dissolved in DMSO (Sigma-Aldrich;
Merck KGaA) as stock solutions according to the manufacturer's
recommendation. The final concentration of DMSO in the cell culture
medium never exceeded 1%.
Cell viability assay
The cytotoxicity of RU-SKI43, cyclopamine, GANT61
and sunitinib was measured using a Sulforhodamine B (SRB) assay
(30). Briefly, the cells were
seeded into 96-well plates at the following density: 786-O,
5×10³ cells/well; ACHN, 5×10³ cells/well; and
HK-2, 8×10³ cells/well. Cells were incubated for 24 h in
the appropriate medium. Different concentrations of each inhibitor
(sunitinib, 0-20 µM; RU-SKI43, 0-60 µM; GANT61, 0-80
µM; and cyclopamine, 0-60 µM) were added to the
wells. After incubation for 24, 48 or 72 h, the cells were fixed by
adding trichloroacetic acid (TCA) to a final concentration of 10%
TCA and incubated for 1 h at 4°C. Subsequently, the plates were
washed with deionized water and thoroughly drained for ~30 min. SRB
(100 µl), dissolved in 1% acetic acid, was added to each
well and the cells were stained for 15 min at room temperature.
Thereafter, the plates were washed with 1% acetic acid to remove
the dye and then dried overnight. Next, 200 µl TRIS buffer
(10 mM; pH 10.5) was added to each well and the plates were shaken
gently to dissolve the stain. The absorbance was measured
spectrophotometrically at 540 nm using a reference wavelength of
630 nm on an Epoch UV universal microplate reader (BioTek
Instruments, Inc.).
Cell cycle analysis
786-O, ACHN and HK2 cells were seeded at a density
of 2×10⁵ cells/well and, after 24 h, the cells were
treated with GANT61, RU-SKI43, cyclopamine and sunitinib at the
half maximal effective concentration (EC50) and the 25%
effective concentration (EC25; Table II). After 48 h, the cells were
collected, washed with PBS (Sigma-Aldrich; Merck KGaA) and fixed in
70% ethyl alcohol for 48 h at 4°C. Directly before cytometric
analysis, the cells were stained with a dye mixture containing
RNase and propidium iodide (PI) (Sigma-Aldrich; Merck KGaA) for 30
min in the dark at 37°C. Fluorescence of the PI-stained cells was
measured via flow cytometry (excitation, 536 nm; emission, 617 nm;
FACSCalibur; Becton-Dickinson and Company). The results were
analyzed using CellQuest Pro software (Becton, Dickinson and
Company) and presented as a percentage of cells with DNA content
corresponding to apoptotic/necrotic cells (subG1
fraction) or cells in the G0/G1, S and
G2/M phases of the cell cycle.
| Table IIEC50 and EC25
concentrations of RU-SKI43, cyclopamine, GANT61, and sunitinib for
the 786-O, ACHN, and HK2 cell lines. |
Table II
EC50 and EC25
concentrations of RU-SKI43, cyclopamine, GANT61, and sunitinib for
the 786-O, ACHN, and HK2 cell lines.
| Conc. (µM)
of each agent | Cell line
|
|---|
786-O
| ACHN
| HK2
|
|---|
|
EC50 |
EC25 |
EC50 |
EC25 |
EC50 |
EC25 |
|---|
| RU-SKI43 | 15.22 | 21.65 | 20.65 | 27.98 | 12.34 | 20.55 |
| Cyclopamine | 31.38 | 40.7 | 29.75 | 31.39 | 24.85 | 40.13 |
| GANT61 | 15.43 | 26.87 | 14.75 | 35.15 | 18.75 | 35.62 |
| Sunitinib | 4.36 | 8.72 | 6.43 | 10.41 | 3.71 | 8.60 |
qPCR analysis of mRNA levels in cultured
cells
A total of 2×10⁵ cells/well were seeded
in 6-well plates and incubated for 24 h in the appropriate medium.
Subsequently, the cells were treated for 48 h with inhibitors at
the EC50 and EC25. Total RNA from the
collected samples was isolated using the ExtractMe Total RNA kit
(Blirt, Inc.). The obtained RNA was dissolved in 40 µl
nuclease-free water. The quantity and quality of RNA were measured
using a spectrophotometer (NanoDrop ND 1000; Thermo Fisher
Scientific, Inc.). RNA samples were stored at -20°C until further
analysis. Further analysis was performed as aforementioned for
clinical samples.
Wound healing assay
The cells were seeded in 6-well plates at the
following density: 786-O, 3×10⁵ cells/well; and ACHN,
6×10⁵ cells/well. Cells were incubated for 48 h in the
appropriate medium: 786-O cells, RPMI1640; ACHN cells, Eagle's
Minimum Essential Medium. Both media were supplemented with 10% FBS
(31-34) and 1% penicillin-streptomycin. MEM
was additionally supplemented with 2% L-glutamine. Confluent cell
cultures were then scratched using a sterile tip and incubated with
GANT61, RU-SKI43, cyclopamine and sunitinib at the EC25.
The wound healing process was monitored (12 h for 786-O cells and
32 h for ACHN cells) and images of the scratches were captured at
different points of time using an inverted microscope.
Quantification was performed by measuring the number of pixels in
each wound closure area using ImageJ software 1.53 (National
Institutes of Health).
Statistical analysis
Statistical analysis was performed using GraphPad
Prism ver. 6.07 (GraphPad Software, Inc.) and Statistic aver. 13.3
(StatSoft Ltd.) software. First, data normality was checked using
the Shapiro-Wilk test. However, since most data for clinical
samples did not pass it, the following non-parametric tests were
applied: Mann-Whitney U for two groups, Wilcoxon signed-rank if
samples were paired and Spearman's correlation. Outliers were
identified using the ROUT test. The median values of mRNA levels
for a particular gene in the control group were used as a threshold
for the determination of upregulation and downregulation of a given
gene in cancer tissues. In this way, 2×2 Fisher's exact test was
performed. For outcome analysis of patients, Kaplan-Meier survival
tests with log-rank (Mantel-Cox) tests were applied, with data
acquired for overall survival (OS). Cox proportional hazard
regression model with univariable (first step) and multivariable
(second step) tests were applied. Survival associations were
presented as hazard ratios (HRs) with their 95% confidence interval
(CI) and P-values using Cox and Kaplan-Meier estimations (35,36). The results from cellular assays
were analyzed using a unpaired Student's t-test, and for more than
2 groups-one or two-way ANOVA with post hoc Tukey's multiple
comparison test. A two-sided P<0.05 was considered to indicate a
statistically significant difference, with a 95% CI in all
analyses.
Results
Clinicopathological characteristics of
the patients
The clinicopathological features of the patients are
presented in Table III. The
study included 62 patients with ccRCC, including 21 women and 41
men (mean age ± SD, 63,84±11.25 years). According to the Union for
International Cancer Control TNM 8th staging edition of RCC
guidelines (4), 29 patients were
classified as stage I (T1N0M0), 4 as stage II (T2N0M0), 27 as stage
III (T1-2N1M0 or T3N0-2M0), and 2 as stage IV (T4N0-2M0 or
T1-4N0-2M1). Local or distant metastases were diagnosed in 29 (47%)
patients, at the time of nephrectomy. Histological Fuhrman/World
Health Organization (WHO)/International Society of Urological
Pathology (ISUP) grading assessment (37) revealed 4 ccRCC samples in grade
1, 22 samples in grade 2, 21 samples in grade 3, and 15 samples in
grade 4. The mean follow-up period was 32 months (range, 3-72
months). The median OS rate was 24 months. All deaths were
associated with ccRCC progression.
| Table IIIClinicopathological characteristics
of the ccRCC patients and their association with SHH,
PTCH1, SMO, SUFU, GLI1-3, BCL2,
MYC, VEGFA, CCND1 mRNA levels. |
Table III
Clinicopathological characteristics
of the ccRCC patients and their association with SHH,
PTCH1, SMO, SUFU, GLI1-3, BCL2,
MYC, VEGFA, CCND1 mRNA levels.
Patients/genes
| Subgroups | SHH
| SMO
| SUFU
| GLI2
| GLI3
| GLI1
| PTCH1
| BCL2
| CCND1
| MYC
| VEGFA
|
|---|
qPCR results (%)
| qPCR results (%)
| qPCR results (%)
| qPCR results (%)
| qPCR results (%)
| qPCR results (%)
| qPCR results (%)
| qPCR results (%)
| qPCR results (%)
| qPCR results (%)
| qPCR results (%)
|
|---|
| n=62 | ↓ | ↑ | P-valuea | ↓ | ↑ | P-valuea | ↓ | ↑ | P-valuea | ↓ | ↑ | P 1 | ↓ | ↑ | P-valuea | ↓ | ↑ | P-valuea | ↓ | ↑ | P-valuea | ↓ | ↑ | P-valuea | ↓ | ↑ | P 1 | ↓ | ↑ | P-valuea | ↓ | ↑ | P-valuea |
|---|
| Age (years) | ≤64 | 14 | 18 | 0.799 | 13 | 19 | 0.610 | 11 | 21 | 0.125 | 8 | 24 | 0.579 | 11 | 21 | 0.303 | 8 | 24 | 0.579 | 11 | 21 | 0.021 | 12 | 20 | 1.000 | 11 | 21 | 1.000 | 2 | 30 | 0.418 | 9 | 23 | 0.189 |
| Mean ± SD: | n=32 | (22.6) | (29.0) | | (21.0) | (30.6) | | (17.7) | (33.9) | | (12.9) | (38.7) | | (17.7) | (33.9) | | (12.9) | (38.7) | | (17.7) | (33.9) | | (19.4) | (32.3) | | (17.7) | (33.9) | | (3.2) | (48.4) | | (14.5) | (37.1) | |
| 63,84±11.25 | >64 | 15 | 15 | | 15 | 15 | | 17 | 13 | | 10 | 20 | | 15 | 15 | | 10 | 20 | | 20 | 10 | | 12 | 18 | | 11 | 19 | | 4 | 26 | | 14 | 16 | |
| Range: 33-86 | n=30 | (24.2) | (24.2) | | (24.2) | (24.2) | | (27.4) | (21.0) | | (16.1) | (32.3) | | (24.2) | (24.2) | | (16.1) | (32.3) | | (32.3) | (16.1) | | (19.4) | (29.0) | | (17.7) | (30.6) | | (6.5) | (41.9) | | (22.6) | (25.8) | |
| Sex | Female | 12 | 9 | 0.289 | 10 | 11 | 0.794 | 11 | 10 | 0.434 | 9 | 12 | 0.138 | 11 | 10 | 0.283 | 5 | 16 | 0.570 | 9 | 12 | 0.592 | 8 | 13 | 1.000 | 6 | 15 | 0.576 | 3 | 18 | 0.398 | 9 | 12 | 0.583 |
| n=21 | (19.4) | (14.5) | | (16.1) | (17.7) | | (17.7) | (16.1) | | (14.5) | (19.4) | | (17.7) | (16.1) | | (8.1) | (25.8) | | (14.5) | (19.4) | | (12.9) | (21.0) | | (9.7) | (24.2) | | (4.8) | (29.0) | | (14.5) | (19.4) | |
| Male | 17 | 24 | | 18 | 23 | | 17 | 24 | | 9 | 32 | | 15 | 26 | | 13 | 28 | | 22 | 19 | | 16 | 25 | | 16 | 25 | | 3 | 38 | | 14 | 27 | |
| n=41 | (27.4) | (38.7) | | (29.0) | (37.1) | | (27.4) | (38.7) | | (14.5) | (51.6) | | (24.2) | (41.9) | | (21.0) | (45.2) | | (35.5) | (30.6) | | (25.8) | (40.3) | | (25.8) | (40.3) | | (4.8) | (61.3) | | (22.6) | (43.5) | |
| Tumor size
(cm) | ≤7 cm | 19 | 20 | 0.794 | 17 | 22 | 0.796 | 17 | 22 | 0.796 | 11 | 28 | 1.000 | 14 | 25 | 0.288 | 8 | 31 | 0.082 | 18 | 21 | 0.600 | 12 | 27 | 0.112 | 10 | 29 | 0.054 | 3 | 36 | 0.662 | 13 | 26 | 0.587 |
| n=39 | (30.6) | (32.3) | | (27.4) | (35.5) | | (27.4) | (35.5) | | (17.7) | (45.2) | | (22.6) | (40.3) | | (12.9) | (50.0) | | (29.0) | (33.9) | | (19.4) | (43.5) | | (16.1) | (46.8) | | (4.8) | (58.1) | | (21.0) | (41.9) | |
| >7 cm | 10 | 13 | | 11 | 12 | | 11 | 12 | | 7 | 16 | | 12 | 11 | | 10 | 13 | | 13 | 10 | | 12 | 11 | | 12 | 11 | | 3 | 20 | | 10 | 13 | |
| n=23 | (16.1) | (21.0) | | (17.7) | (19.4) | | (17.7) | (19.4) | | (11.3) | (16.1) | | (19.4) | (17.7) | | (16.1) | (21.0) | | (21.0) | (16.1) | | (19.4) | (17.7) | | (19.4) | (17.7) | | (4.8) | (32.3) | | (16.1) | (21.0) | |
| ISUP | 1 + 2 | 12 | 14 | 1.000 | 12 | 14 | 1.000 | 11 | 15 | 0.798 | 8 | 18 | 1.000 | 9 | 17 | 0.435 | 6 | 20 | 0.412 | 10 | 16 | 0.198 | 6 | 20 | 0.038 | 5 | 21 | 0.032 | 4 | 22 | 0.227 | 8 | 18 | 0.434 |
|
Histologicalgrade | n=26 | (19.4) | (22.6) | | (19.4) | (22.6) | | (17.7) | (24.2) | | (12.9) | (29.0) | | (14.5) | (27.4) | | (9.7) | (32.3) | | (16.1) | (25.8) | | (9.7) | (32.3) | | (8.1) | (33.9) | | (6.5) | (35.5) | | (12.9) | (29.0) | |
| 3 + 4 | 17 | 19 | | 16 | 20 | | 17 | 19 | | 10 | 26 | | 17 | 19 | | 12 | 24 | | 21 | 15 | | 18 | 18 | | 17 | 19 | | 2 | 34 | | 15 | 21 | |
| n=36 | (27.4) | (30.6) | | (25.8) | (32.3) | | (27.4) | (30.6) | | (16.1) | (41.9) | | (27.4) | (30.6) | | (19.4) | (38.7) | | (33.9) | (24.2) | | (29.0) | (29.0) | | (27.4) | (30.6) | | (3.2) | (54.8) | | (24.2) | (33.9) | |
| TNM stage | Non-metastatic | 13 | 20 | 0.308 | 13 | 20 | 0.444 | 12 | 21 | 0.201 | 10 | 23 | 1.000 | 12 | 21 | 0.441 | 8 | 25 | 0.413 | 11 | 22 | 0.010 | 10 | 23 | 0.194 | 7 | 26 | 0.017 | 2 | 31 | 0.405 | 9 | 24 | 0.116 |
| n=33 | (21.0) | (32.3) | | (21.0) | (32.3) | | (19.4) | (33.9) | | (16.1) | (37.1) | | (19.4) | (33.9) | | (12.9) | (40.3) | | (17.7) | (35.5) | | (16.1) | (37.1) | | (11.3) | (41.9) | | (3.2) | (50.0) | | (14.5) | (38.7) | |
| Metastatic | 16 | 13 | | 15 | 14 | | 16 | 13 | | 8 | 21 | | 14 | 15 | | 10 | 19 | | 20 | 9 | | 14 | 15 | | 15 | 14 | | 4 | 25 | | 14 | 15 | |
| n=29 | (25.8) | (21.0) | | (24.2) | (22.6) | | (25.8) | (21.0) | | (12.9) | (33.9) | | (22.6) | (24.2) | | (16.1) | (30.6) | | (32.3) | (14.5) | | (22.6) | (24.2) | | (24.2) | (22.6) | | (6.5) | (40.3) | | (22.6) | (24.2) | |
The SHH pathway genes and their targets
are overexpressed in ccRCC tissues
A total of two assessment methods were applied
(16,35,36): Direct quantitative comparisons
between tumor and normal kidney tissues, are shown in Fig. 2, and comparisons of mRNA levels
of genes in tumor samples divided into high (↑) and low (↓)
expression groups based on the median values in normal biopsies,
are shown in Table III.
Similar to our previous study (16), increased expression of all
analyzed SHH pathway genes was observed in tumor samples (light
grey bars in Fig. 2), with the
highest levels of signaling TFs, GLI2 and GLI3, with
~14-fold higher mRNA levels in tumors (Fig. 2). Furthermore, higher mRNA level
of GLI2 and GLI3 was observed in 44 and 36 patients
with ccRCC, respectively (Table
III). High (~48-fold upregulation) GLI1 gene expression
was observed in tumor tissues of 44 patients with ccRCC (Table III), and this also acts as
positive feedback in the SHH signaling pathway (6). Although the mRNA levels of
PTCH1, the second gene involved in negative feedback
regulation of the SHH signaling pathway (6), were not quantitatively changed in
direct comparison with normal kidney samples, increased levels were
observed in tumor ccRCC tissues of younger patients (<64 years
of age; Table III), which is
in line with our previous research (16). The expression levels of putative
SHH pathway-upregulated genes were also increased (dark-grey bars
in Fig. 2), with high expression
levels of VEGFA (~12-fold upregulation) identified in 39
patients with ccRCC (Table
III). Subsequently, the present study examined whether
GLI1-3 expression was associated with mRNA levels of their
upstream regulator SHH and their target genes. There was a strong
association between SHH expression and all studied GLI TFs
(Table IV; GLI1,
r=0.680, P<0.0001; GLI2, r=0.600, P<0.0001;
GLI3, r=0.644, P<0.0001). The association between the
expression of SHH and GLI1 was also observed in our
previous study (16).
Furthermore, in the cancer tissues, GLI1 was strongly
upregulated by GLI2 and GLI3 (r=0.767 and r=0.894,
respectively; P<0.0001; Table
IV). The expression levels of other genes activated by GLIs
presented weaker correlations, with the lowest r values observed
for PTCH1. However, a weak positive association was observed
between CCND1 gene expression and GLI2 gene
expression. Interestingly, the expression levels of VEGFA
exhibited a strong (r>0.75) correlation with the expression
levels of GLI1-3 (Table
IV).
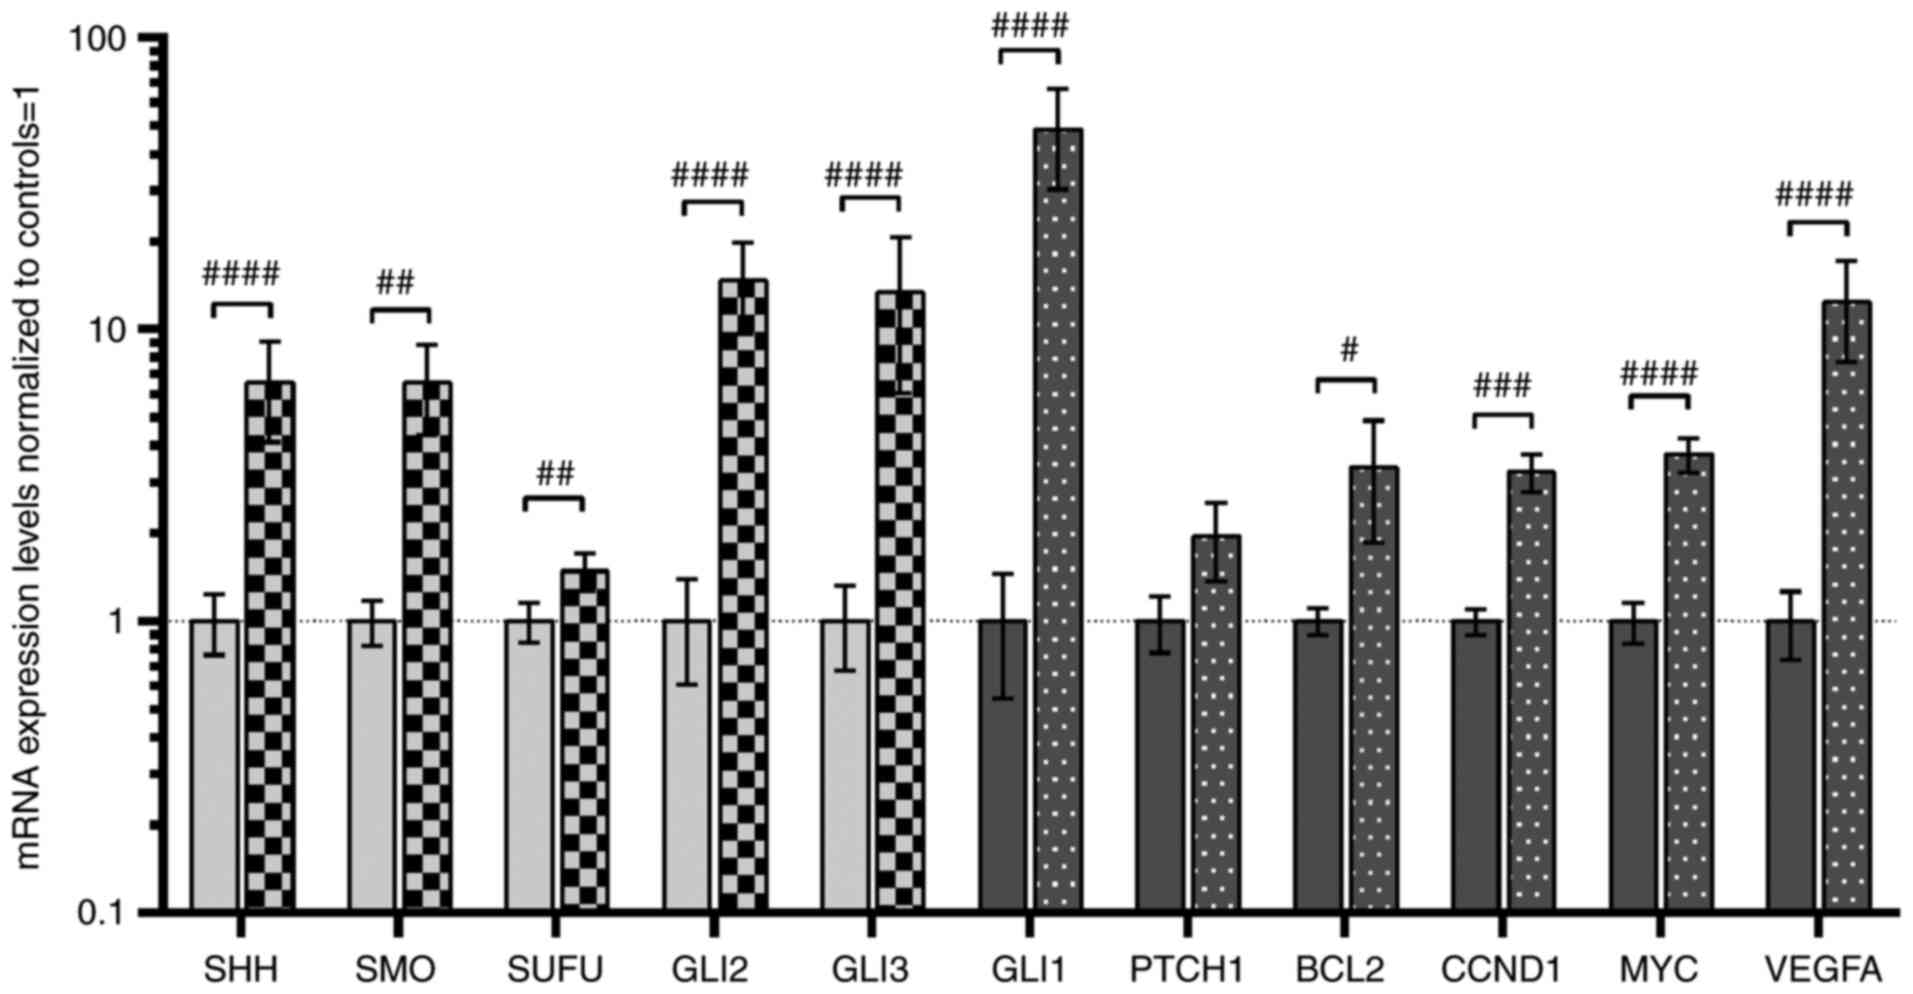 | Figure 2Analysis of the expression of SHH
pathway genes (SHH, SMO, SUFU, GLI2 and
GLI3; light grey bars) and SHH pathway target genes
(GLI1, PTCH1, BCL2, CCND1, MYC
and VEGFA; dark grey bars). Comparison between ccRCC and
normal kidney samples. Gene expression was assessed as described in
the Materials and methods section. Bars and whiskers represent the
mean ± SD normalized to control kidney samples.
#P<0.05, ##P<0.01,
###P<0.001, ####P<0.0001 (Wilcoxon signed-rank).
SHH, sonic hedgehog ligand; SMO, smoothened;
SUFU, suppressor of fused homolog; GLI1,2,3,
glioma-associated zinc finger protein 1, 2, 3; PTCH1,
patched 1; CCND1, cyclin D1; VEGFA, vascular
endothelial growth factor A; ccRCC, clear cell renal cell
carcinoma; qPCR, quantitative PCR. |
| Table IVCorrelation between the SHH,
GLI TFS, and their targeted genes at the mRNA levelsa. |
Table IV
Correlation between the SHH,
GLI TFS, and their targeted genes at the mRNA levelsa.
Genes
| GLI2
| GLI3
| GLI1
|
|---|
| Correlation
results | rb | P-valueb | rb | P-valueb | rb | P-valueb |
|---|
| SHH | 0.600 | <0.0001 | 0.644 | <0.0001 | 0.680 | <0.0001 |
| GLI1 | 0.767 | <0.0001 | 0.894 | <0.0001 | - | - |
| PTCH1 | 0.560 | 0.0002 | 0.548 | 0.0003 | 0.577 | 0.0002 |
| BCL2 | 0.649 | <0.0001 | 0.517 | 0.0003 | 0.628 | <0.0001 |
| MYC | 0.696 | <0.0001 | 0.600 | <0.0001 | 0.526 | 0.0002 |
| VEGFA | 0.752 | <0.0001 | 0.771 | <0.0001 | 0.755 | <0.0001 |
| CCND1 | 0.333 | 0.038 | 0.188 | 0.239 | 0.164 | 0.306 |
Expression levels of SHH pathway genes
and their targets are upregulated in early ccRCC
With the exception of PTCH1, the expression
levels of the analyzed genes were not associated with age, sex or
tumor size (Table III; plots
not shown); however, differences were observed when cancer tissues
were classified by TNM stage and ISUP grade (Fig. 3). Generally, the analyzed SHH
signaling pathway genes were upregulated in early TNM (1+2) stages
and ISUP (1+2) grades (Fig. 3A, B,
D, E) with the exception of SUFU (Fig. 3C). GLI2 was strongly
upregulated in all TNM stages/ISUP grades with ~25-fold higher
levels in early stage/grade tissues compared with in paired normal
kidney tissues (Fig. 3D). On the
other hand, GLI3 was upregulated ~15- and ~5-fold in early
and advanced ISUP stages, respectively, with no relation to TNM
stage (Fig. 3E). The mRNA
expression levels of GLI1 exhibited a different pattern:
GLI1 mRNA expression was ~107- and ~71-fold higher in early
TNM stages and ISUP grades, respectively; however, in advanced
stage/grade tissues, GLI1 expression was still at least ~20
times higher than in control tissues (Fig. 3F). PTCH1 exhibited an
opposite pattern of expression according to TNM stages (Table III); however, no significant
difference, as assessed using the Mann-Whitney U test, was noted
(Fig. 3G). The BCL2 and
CCND1 genes showed a similar expression pattern to the SHH
pathway genes: BCL2 was upregulated in ISUP grades 1+2
(Fig. 3H; Table III), while tumors in both early
TNM and ISUP stages/grades were characterized by higher mRNA
expression levels of CCND1 (Fig. 3I; Table III). MYC expression in
ccRCC was ~6- and 3-fold higher in early and advanced
stages/grades, respectively, than in control tissues (Fig. 3J). Furthermore, there was a
marked difference in MYC mRNA expression between the cancer
tissues assessed as stage/grade 1+2 and 3+4 according to both TNM
and ISUP classifications (Fig.
3J). Interestingly, all tumor samples exhibited increased
VEGFA mRNA expression compared with control tissues
independent of ccRCC stage/grade (Fig. 3K).
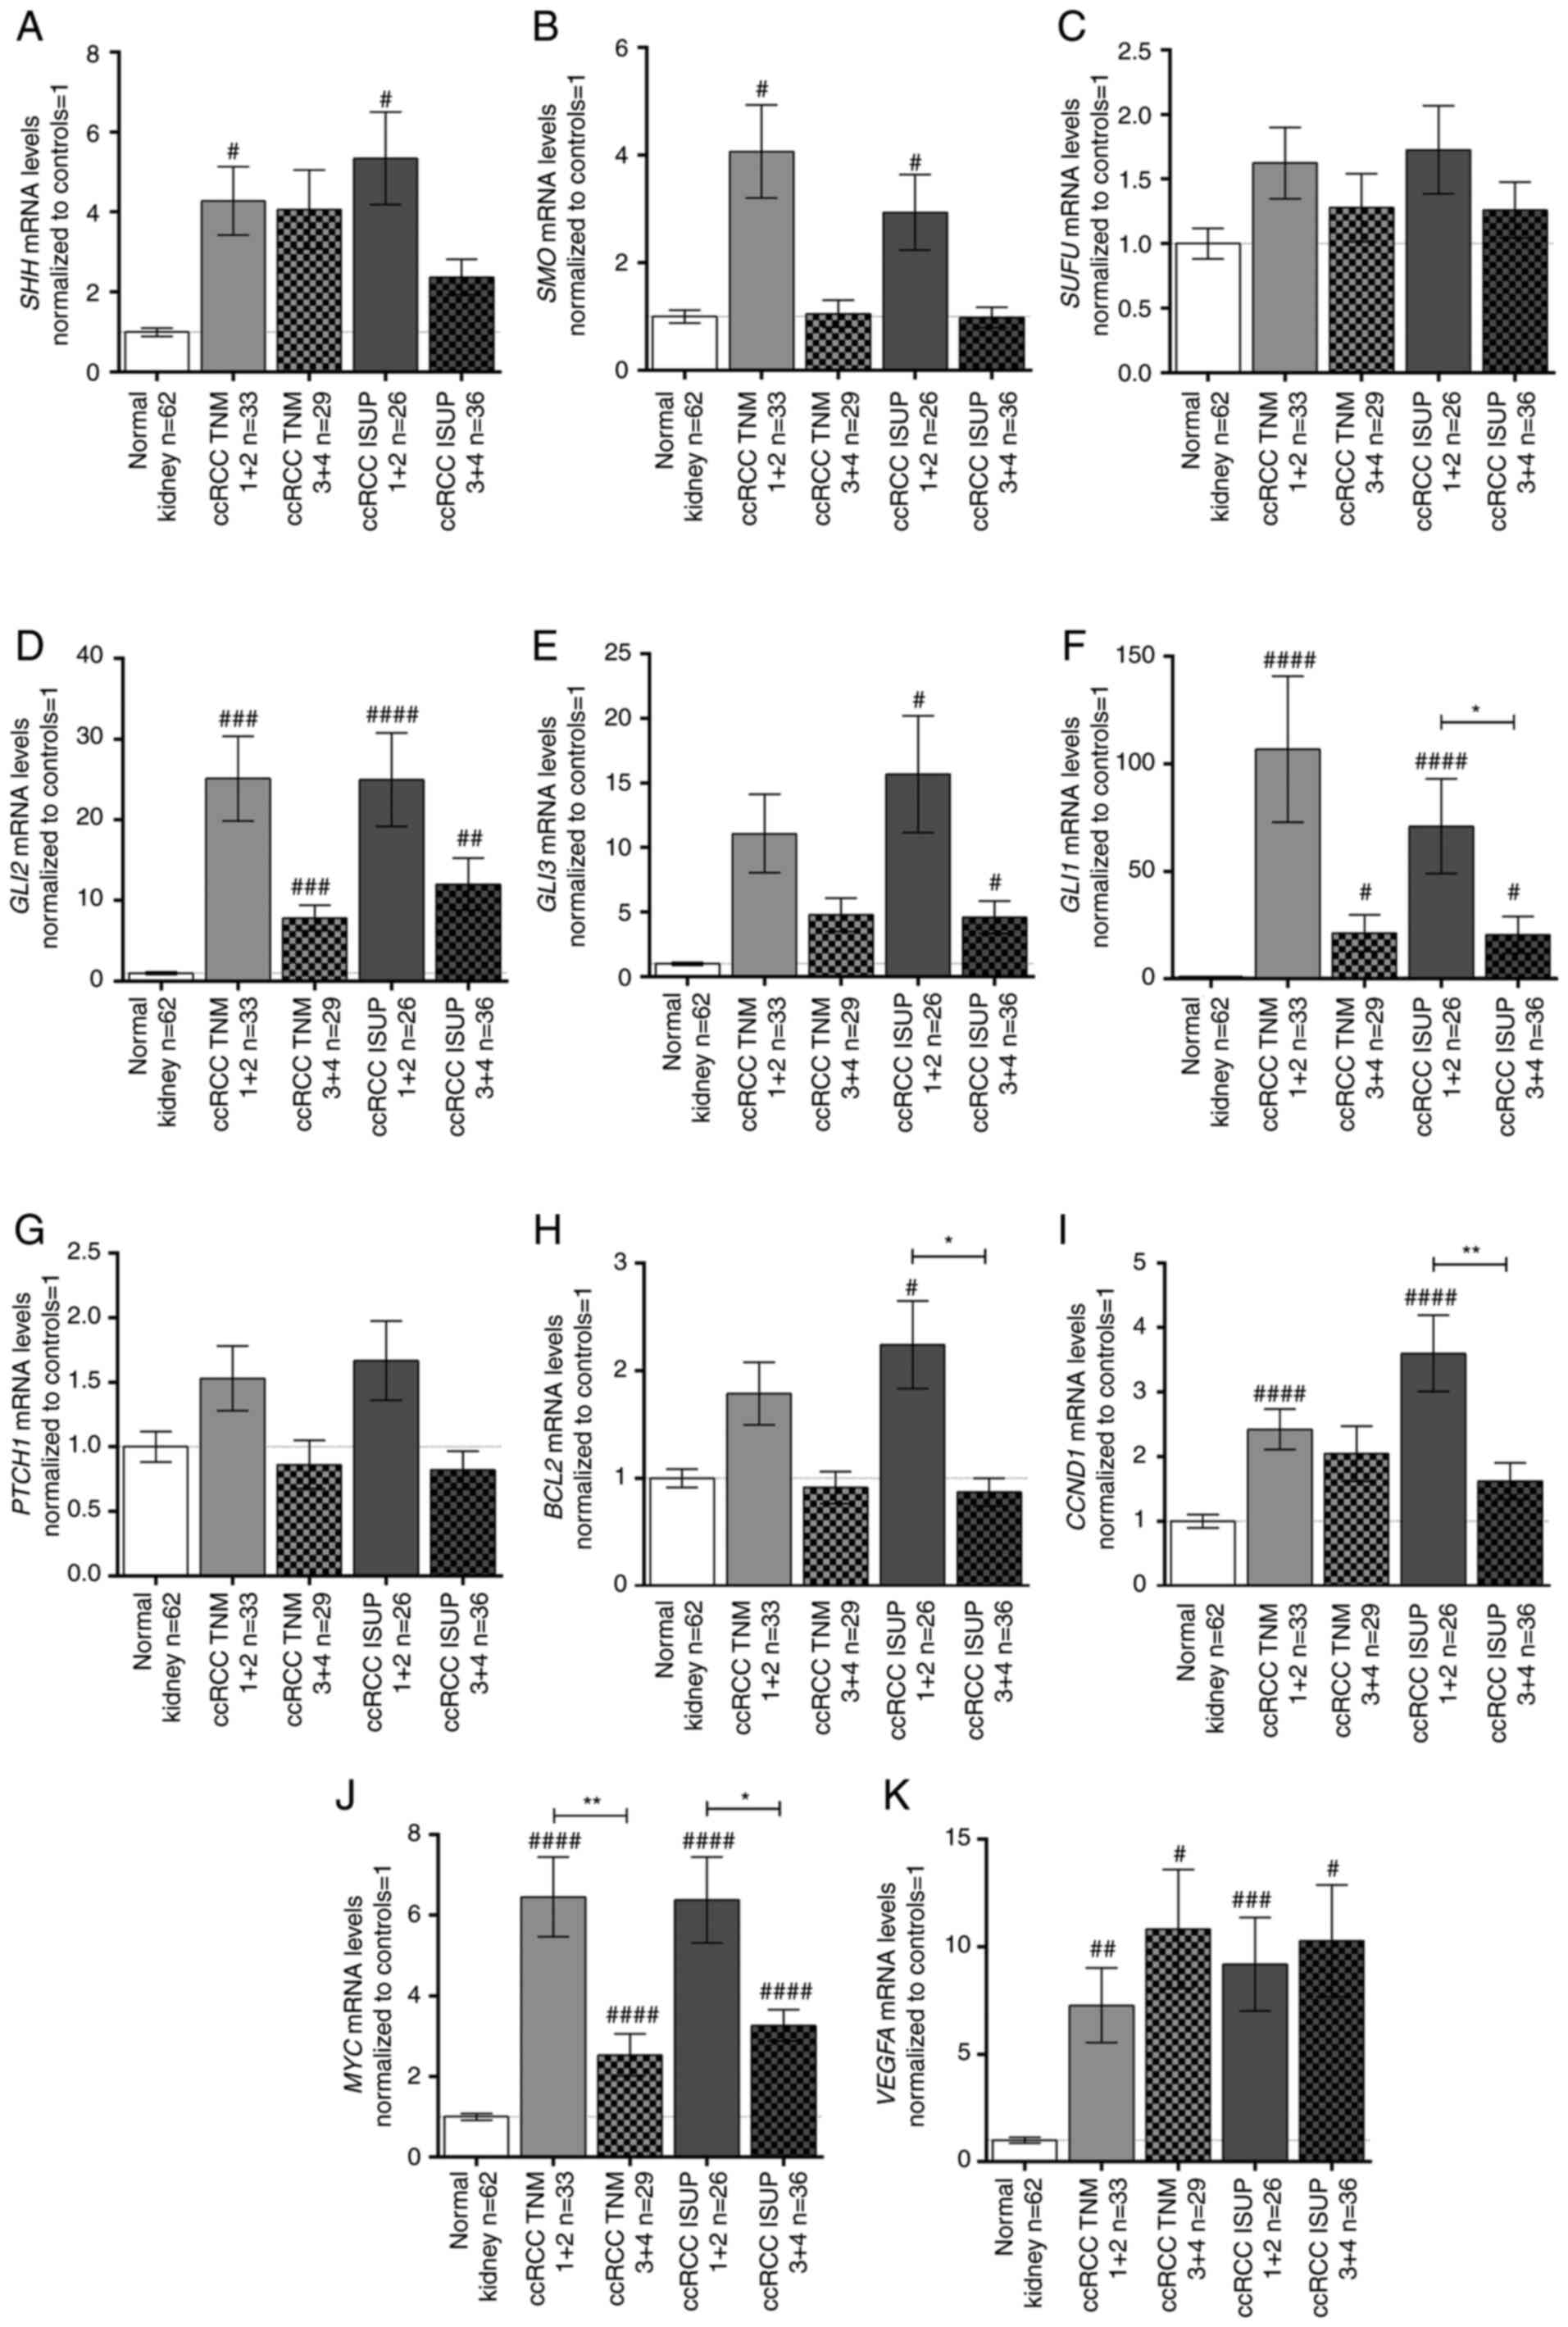 | Figure 3mRNA expression levels of the (A)
SHH, (B) SMO, (C) SUFU, (D) GLI2, (E)
GLI3, (F) GLI1, (G) PTCH1, (H) BCL2,
(I) CCND1, (J) MYC, and (K) VEGFA genes in
tissue samples of patients with ccRCC, related to TNM stage and
ISUP grade. Gene expression was measured by qPCR. Bars and whiskers
represent the mean ± SEM normalized to control kidney samples.
P-values between groups (Mann-Whitney U test) are noted:
#P<0.05, ##P<0.01,
###P<0.001, ####P<0.0001 to compare
significance between control and ccRCC samples;
*P<0.05, **P<0.01, to compare
significance between ccRCC TNM 1+2 and TNM 3+4 samples as well as
ccRCC ISUP 1+2 and ISUP 3+4 samples. SHH, sonic hedgehog ligand;
SMO, smoothened; SUFU, suppressor of fused homolog; GLI1,2,3,
glioma-associated zinc finger protein 1, 2, 3; PTCH1, patched 1;
CCND1, cyclin D1; VEGFA, vascular endothelial growth factor A;
ccRCC, clear cell renal cell carcinoma; qPCR, quantitative PCR;
ISUP, International Society of Urological Pathology. |
Low CCND1 and high VEGFA expression
levels in ccRCC tissues are associated with shorter OS
It was observed that tumors characterized by
advanced TNM stages and ISUP grades were associated with shorter OS
(Fig. 4A and B) with a 50%
survival rate of 30 months. The mRNA levels of SHH,
SMO, SUFU, GLI2, GLI3, GLI1,
PTCH1, BCL2 and MYC (Fig. 4D-K) were not associated with OS.
Shorter OS was associated with lower CCND1 expression
(Fig. 4L) as well as high
VEGFA expression (Fig.
4M).
 | Figure 4Kaplan-Meier overall survival
analysis for patients with ccRCC related to clinicopathological and
molecular data. (A) TNM classification. (B) ISUP grade. (C)
SHH mRNA expression. (D) SMO mRNA expression. (E)
SUFU mRNA expression. (F) GLI2 mRNA expression. (G)
GLI3 mRNA expression. (H) GLI1 mRNA expression. (I)
PTCH1 mRNA expression. (J) BCL2 mRNA expression. (K)
MYC mRNA expression. (L) CCND1 mRNA expression. (M)
VEGFA mRNA expression. Cut-off values for increased and
decreased expression were determined using the median expression
value of each gene in the control samples. The log-rank
(Mantel-Cox) test was applied. SHH, sonic hedgehog ligand;
SMO, smoothened; SUFU, suppressor of fused homolog;
GLI1,2,3, glioma-associated zinc finger protein 1, 2, 3;
PTCH1, patched 1; CCND1, cyclin D1; VEGFA,
vascular endothelial growth factor A; ccRCC, clear cell renal cell
carcinoma; qPCR, quantitative PCR; ISUP, International Society of
Urological Pathology. |
Cox proportional hazards test with univariable
regression analysis revealed that patients with high ISUP grade,
high VEGFA expression and low CCND1 expression were
at risk of death due to ccRCC. Multivariable regression analysis
indicated that increased VEGFA mRNA expression was an
independent prognostic factor of a worse outcome in patients with
advanced ISUP histological grade. Patients with ccRCC with advanced
(3+4) histological grade had a high risk of death (HR=12.55) if
they also exhibited increased VEGFA mRNA expression in tumor
tissues (HR=3.72; Table V).
| Table VUnivariable and multivariable Cox
regression analysis of the overall survival rate of the ccRCC
patients. |
Table V
Univariable and multivariable Cox
regression analysis of the overall survival rate of the ccRCC
patients.
| Parameters | Univariable
analysis
| Multivariable
analysis
|
|---|
| χ2 | P-value | HR (95 CI) | χ2 | P-value | HR (95 CI) |
|---|
| Sex | | | | | | |
| Female vs.
Male | 0.48 | 0.486 | 0.52
(0.08-3.21) | | | |
| Age (years) | | | | | | |
| >62 vs.
≤62 | 1.99 | 0.157 | 0.32
(0.06-1.54) | | | |
| Tumor size
(cm) | | | | | | |
| >7 vs. ≤7 | 1.08 | 0.297 | 2.62
(0.42-16.06) | | | |
| Tumor stage | | | | | | |
| T3+4 vs. T1+2 | 0.04 | 0.824 | 1.30
(2.64-585.07) | | | |
| Histological ISUP
grade | | | | | | |
| 3+4 vs. 1+2 | 7.11 | 0.007 | 39.37
(0.12-13.51) | 10.94 | <0.001 | 12.55
(2.80-56.18) |
| SHH mRNA
levels | | | | | | |
| ↑ vs. ↓ | 2.84 | 0.091 | 23.76
(0.59-945.48) | | | |
| SMO mRNA
levels | | | | | | |
| ↑ vs. ↓ | 2.58 | 0.107 | 0.07
(0.01-1.76) | | | |
| SUFU mRNA
levels | | | | | | |
| ↑ vs. ↓ | 0.10 | 0.747 | 2.04
(0.026-159.89) | | | |
| GLI2 mRNA
levels | | | | | | |
| ↑ vs. ↓ | 0.15 | 0.698 | 0.47
(0.01-20.22) | | | |
| GLI3 mRNA
levels | | | | | | |
| ↑ vs. ↓ | 0.17 | 0.675 | 0.49
(0.02-13.27) | | | |
| GLI1 mRNA
levels | | | | | | |
| ↑ vs. ↓ | 1.24 | 0.265 | 8.10
(0.20-321.45) | | | |
| PTCH1 mRNA
levels | | | | | | |
| ↑ vs. ↓ | 3.72 | 0.053 | 0.18
(0.03-1.02) | | | |
| BCL2 mRNA
levels | | | | | | |
| ↑ vs. ↓ | 0.64 | 0.420 | 0.44
(0.06-3.16) | | | |
| CCND1 mRNA
levels | | | | | | |
| ↓ vs. ↑ | 3.93 | 0.047 | 12.63
(1.03-154.95) | 0.07 | 0.781 | 1.14
(0.43-3.01) |
| MYC mRNA
levels | | | | | | |
| ↑ vs. ↓ | 0.01 | 0.901 | 1.29
(0.02-78.98) | | | |
| VEGFA mRNA
levels | | | | | | |
| ↑ vs. ↓ | 4.12 | 0.042 | 10.09
(1.08-93.97) | 4.17 | 0.041 | 3.72
(1.05-13.17) |
Effects of SHH pathway inhibitors on
proliferation and the cell cycle of 786-O, ACHN and HK2 cells SHH
pathway inhibitors decrease proliferation of the 786-O, ACHN and
HK2 cells
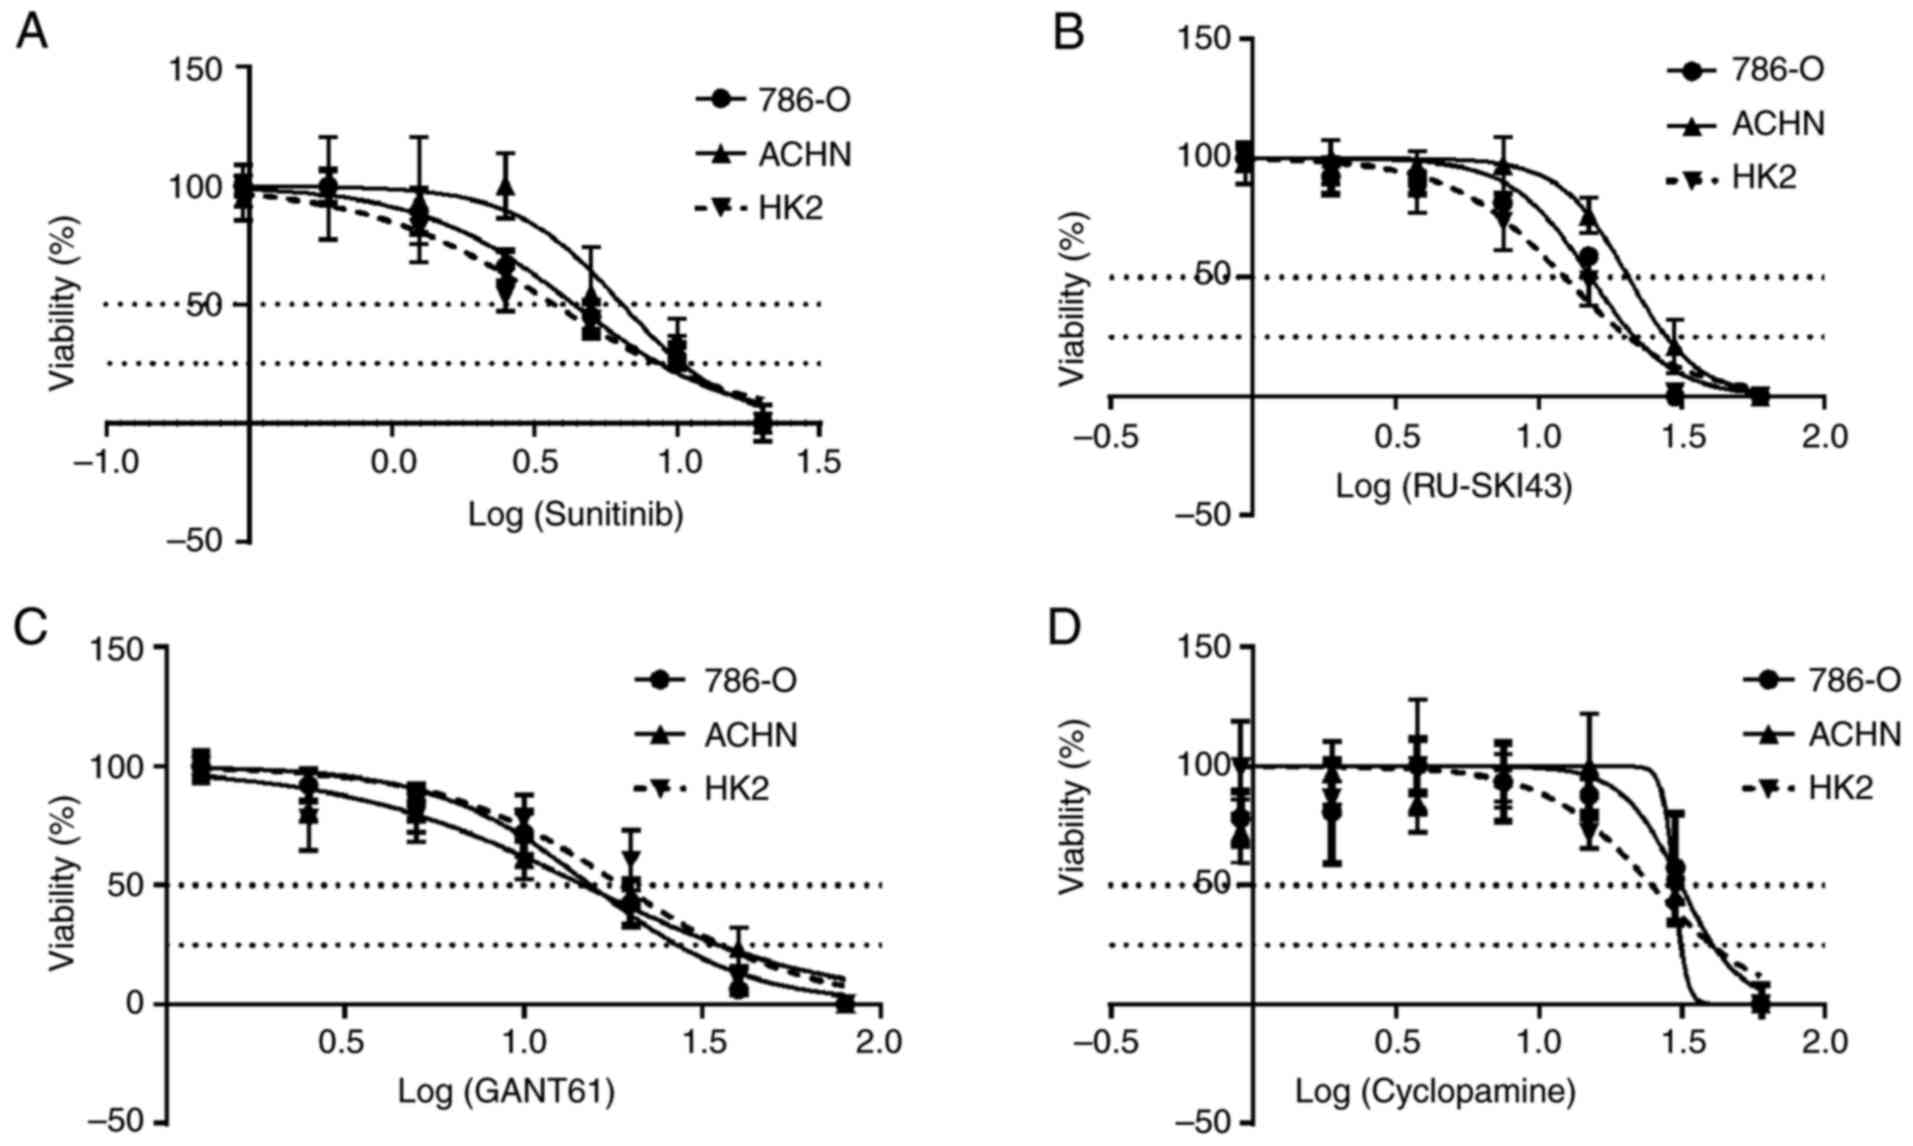
The SRB cell viability assay revealed that
sunitinib, RU-SKI43, GANT61 and cyclopamine markedly inhibited the
proliferation of 786-O and ACHN kidney cancer cells and HK2 normal
kidney cells after 48 h (Fig.
5A-D). Data for incubation times of 24 and 72 h are not shown,
since cell proliferation did not change after 24 h and/or all cells
died after 72 h of drug treatment. The calculated EC50
and EC25 values for individual compounds for a
particular cell line are presented in Table II (also shown as dotted lines in
Fig. 5A-D) and were used in
further analyses.
SHH pathway inhibitors decrease the
number of 786-O and ACHN cells in the G0/G1 phase
Flow cytometry analysis revealed that the treatment
of 786-O cells with GANT61 at the EC25 led to a
significant dose-dependent decrease in the number of cells in the
G0/G1 phase and a significant increase in the
number of cells in sub-G1 (indicative of apoptosis
induction), S and G2/M phases (Fig. 6A). Similar to GANT61, cyclopamine
at the EC25 significantly reduced the number of 786-O
cells in the G0/G1 phase and significantly
increased the number of these cells in the G2/M phase
(Fig. 6B). The treatment of
786-O cells with RU-SKI43 at the EC25 significantly
decreased the number of cells in the G0/G1
phase without any significant effect on the other cell cycle phases
(Fig. 6C). Different effects of
sunitinib (at the EC25) on 786-O cells were observed,
including a dose-dependent increase in the number of cells in the
G0/G1 phase and a decreased number of cells
in the S phase of the cell cycle (Fig. 6D). Treatment with GANT61
significantly reduced the number of ACHN cells in the
G0/G1 phase at both the EC50 and
EC25, and in S phase at the EC25.
Furthermore, GANT61 at the EC25 significantly increased
the number of ACHN cells in the G2/M phase (Fig. 6E). Cyclopamine at the
EC50 significantly decreased the number of ACHN cells in
the G0/G1 phase and significantly increased
the number of cells in the S phase (Fig. 6F). After incubation of ACHN cells
with RU-SKI43 at both the EC50 and EC25, and
with sunitinib at the EC50, a reduced number of cells in
the G0/G1 phase was observed, without any
significant changes in the other cell cycle phases (Fig. 6G and H, respectively).
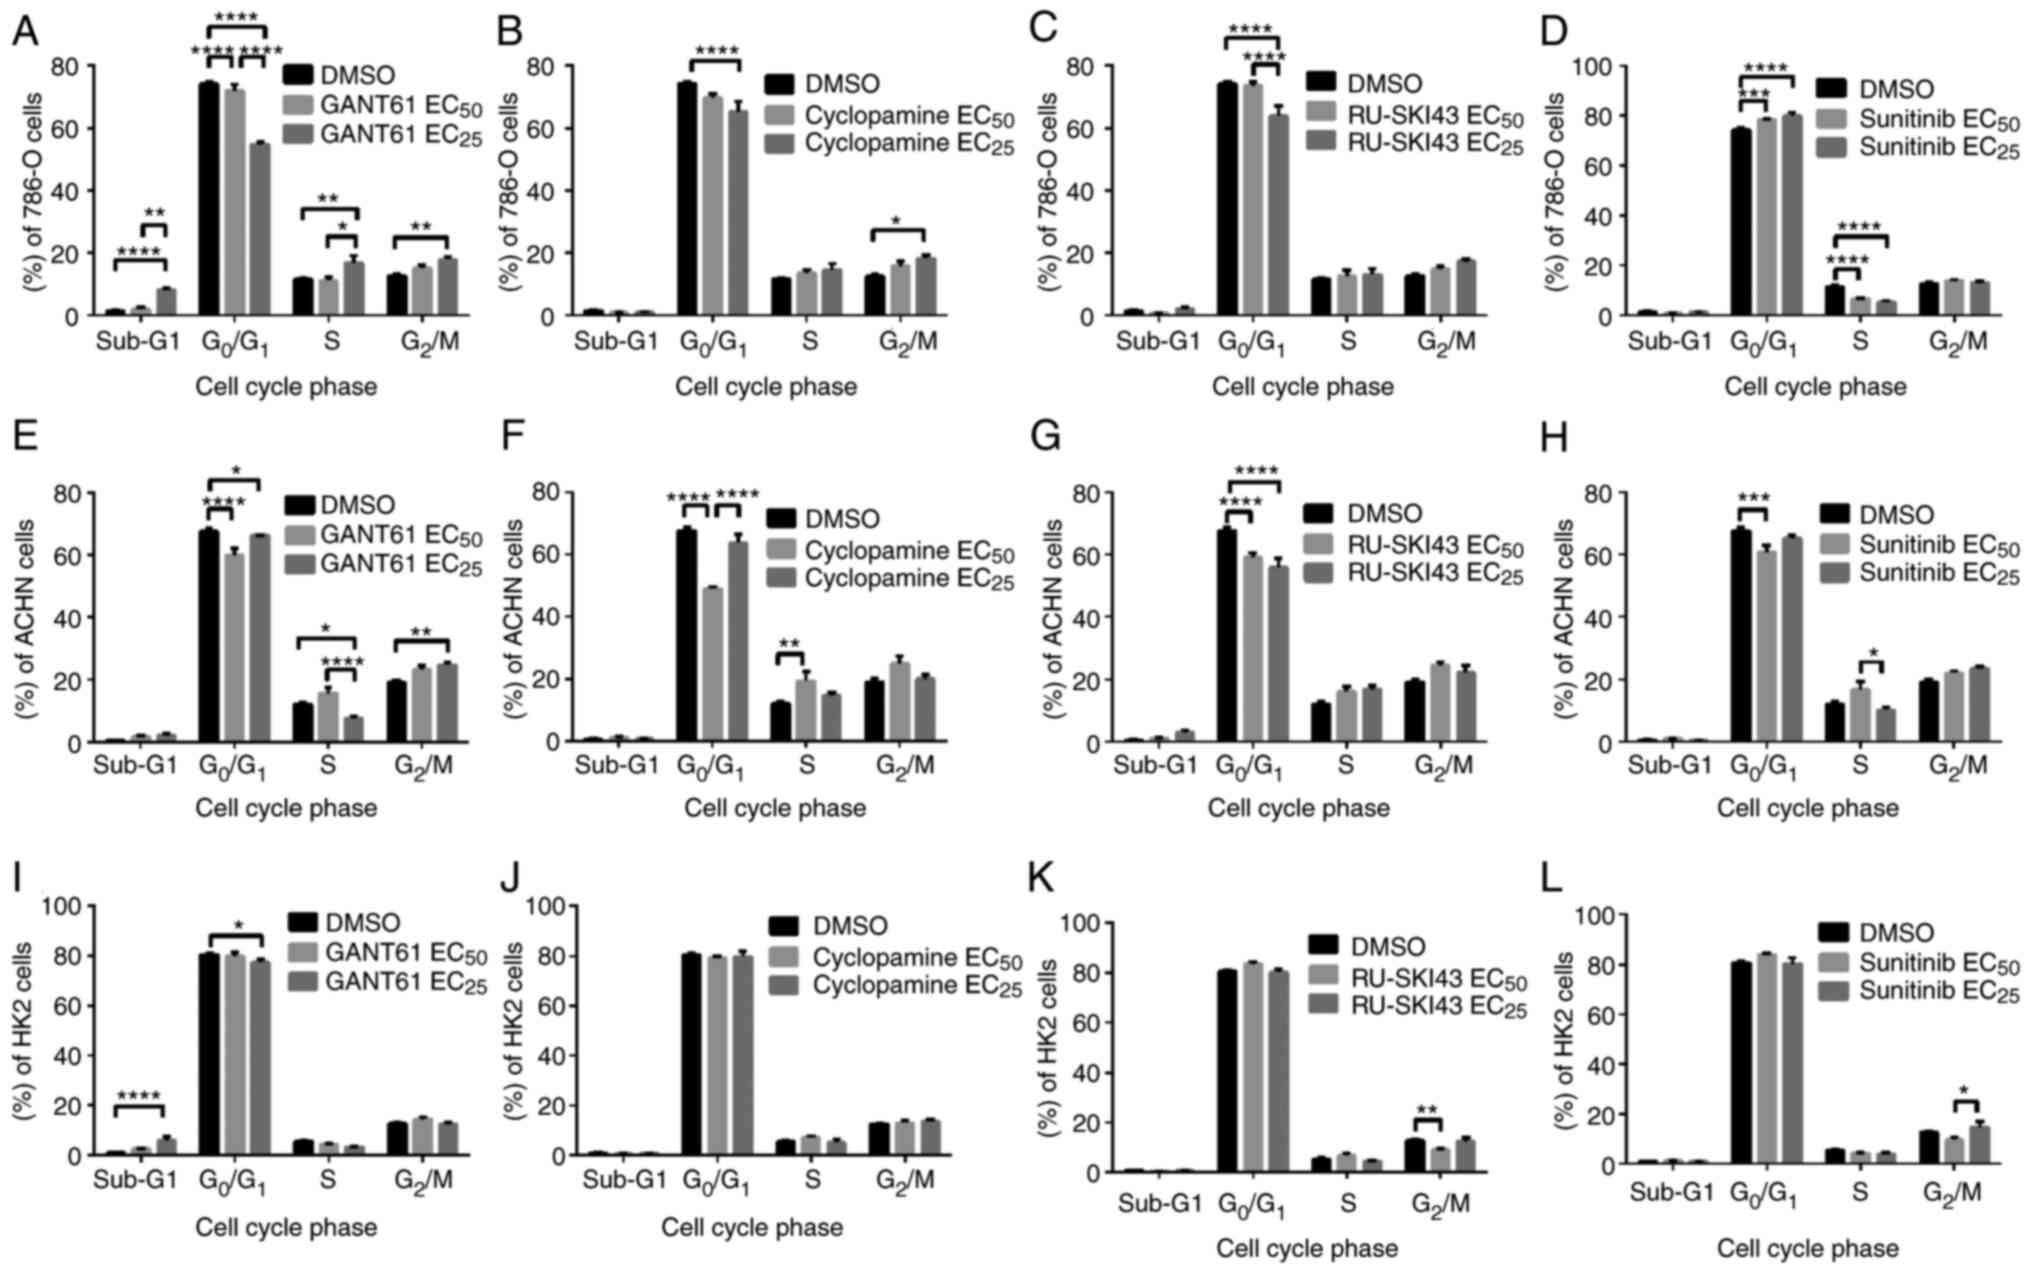 | Figure 6Effects of (A, E and I) GANT61, (B, F
and J) cyclopamine, (C, G and K) RU-SKI43 and (D, H and L)
sunitinib on the cell cycle distribution of 786-O, ACHN and HK2
cells after 48 h of incubation with each compound at the
EC50 or EC25. Cells were harvested, stained
with PI and analyzed by flow cytometry. Statistical significance
was estimated using two-way ANOVA. Data are presented as the mean ±
SEM of three independent experiments carried out in triplicate.
*P<0.05, **P<0.01,
***P<0.001, ****P<0.0001 vs. control.
EC25, 25% effective concentration; EC50, half
maximal effective concentration. |
GANT61 increases the number of HK2 cells
in the sub-G1 phase
Incubation of HK2 cells with GANT61 at the
EC25 increased the number of cells in the
sub-G1 phase. Furthermore, treatment with GANT61 at the
EC25 reduced the number of cells in the
G0/G1 phase (Fig. 6I). Cyclopamine at both
concentrations had no significant effect on the cell cycle of HK2
cells (Fig. 6J). RU-SKI43 at the
EC50 decreased the number of HK2 cells in the
G2/M phase, without any effect on the other cell cycle
phases (Fig. 6K). Sunitinib at
the EC25 increased the number of cells in the
G2/M phase compared with HK2 cells incubated with a
lower (EC50) sunitinib concentration (Fig. 6L). In parallel control
experiments, the solvent, DMSO, had no effect on the cell cycle of
786-O, ACHN and HK2 cells.
Effects of SHH pathway inhibitors on the
expression levels of SHH pathway target genes in 786-O, ACHN and
HK2 cells
The results concerning the expression levels of SHH
target genes in 786-O, ACHN, and HK2 cells are presented in
Fig. 7: GLI1 (A-C),
PTCH1 (D-F), BCL2 (G-I), MYC (J-L),
VEGFA (M-O) and CCND1 (P-R).
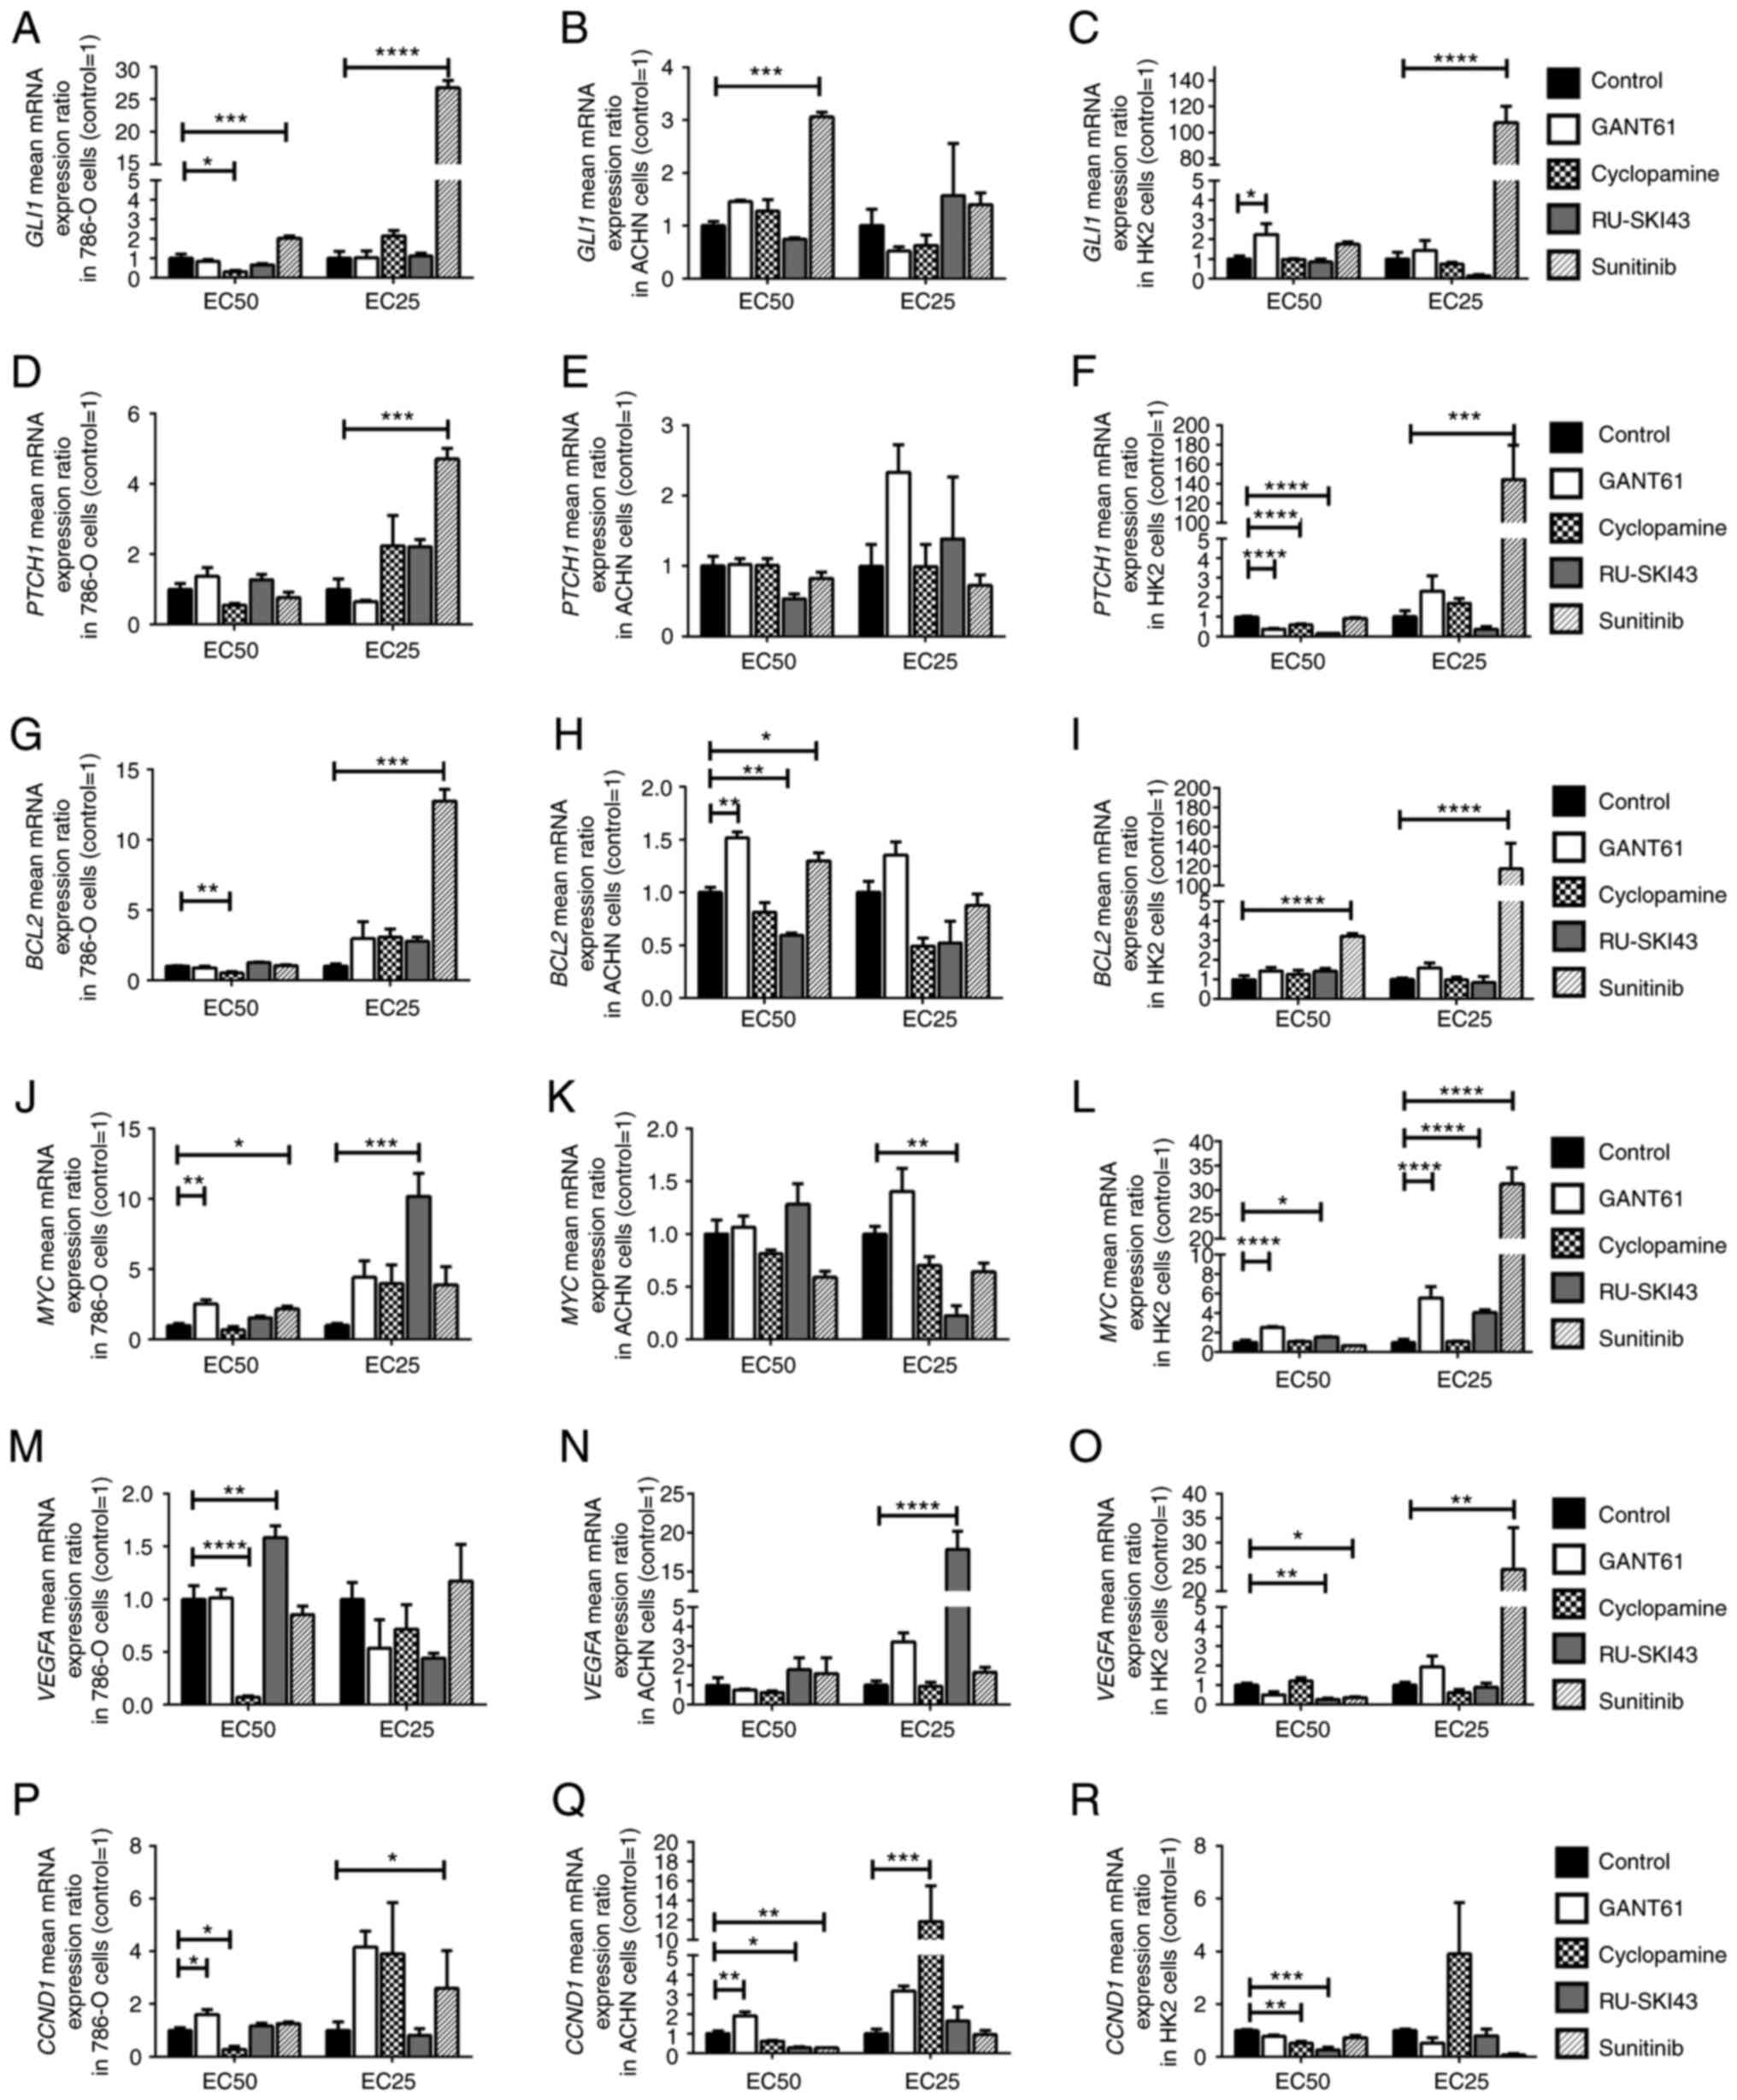 | Figure 7Effects of GANT61, cyclopamine,
RU-SKI43 and sunitinib on (A-C) GLI1, (D-F) PTCH1,
(G-I) BCL2, (J-L) MYC, (M-O) VEGFA and (P-R)
CCND1 mRNA expression in 786-O, ACHN and HK2 cells. The
cells were treated with each compound at the EC50 and
EC25 for 48 h. cDNA was obtained from cells by RNA
isolation and further reverse transcription. Gene expression was
measured by qPCR. Statistical significance was estimated using
one-way ANOVA. Data are presented as the mean ± SEM of three
independent experiments carried out in duplicate.
*P<0.05, **P<0.01,
***P<0.001, ****P<0.0001 vs. control.
GLI1, glioma-associated zinc finger protein 1; PTCH1,
patched 1; CCND1, cyclin D1; VEGFA, vascular
endothelial growth factor A; qPCR, quantitative PCR;
EC25, 25% effective concentration; EC50, half
maximal effective concentration. |
GANT61 increases the expression level of
SHH pathway target genes in 786-O, ACHN and HK2 cells
The incubation of the studied cell lines with
GANT61 at the EC50 led to the significant upregulation
of MYC and CCND1 mRNA expression in 786-O cells
(Fig. 7J and P), and also
significantly increased the mRNA expression levels of BCL2
and CCND1 in ACHN cells (Fig.
7H and Q). In HK2 cells, GANT61 at the EC50
significantly increased GLI1 gene expression (Fig. 7C). Furthermore, GANT61 at the
EC50 and EC25 increased the expression levels
of MYC (Fig. 7L), while
it decreased PTCH1 mRNA expression at the EC50
(Fig. 7F).
Cyclopamine decreases the expression
level of SHH pathway target genes in 786-O cells
The incubation of 786-O cells with cyclopamine at
the EC50 decreased the expression levels of GLI1,
BCL2, VEGFA and CCND1 (Fig. 7A, G, M and P). Cyclopamine at the
EC25 stimulated the expression of the CCND1 gene
in ACHN cells (Fig. 7Q). In HK2
cells, cyclopamine at the EC50 significantly decreased
the mRNA expression levels of PTCH1 and CCND1
(Fig. 7F and R).
RU-SKI43 decreases the expression level
of SHH pathway target genes in ACHN cells
Significantly increased expression levels of
MYC and VEGFA were observed after incubation of 786-O
cells with RU-SKI43, at the EC25 and EC50,
respectively (Fig. 7J and M).
RU-SKI43 at the EC50 significantly decreased the mRNA
expression levels of BCL2 and CCND1 in ACHN cells
(Fig. 7H and Q), and RU-SKI43 at
the EC25 significantly decreased the mRNA expression
levels of MYC (Fig. 7K).
In ACHN cells incubated with RU-SKI43 at the EC25 the
expression levels of VEGFA were upregulated (Fig. 7N). In HK2 cells, RU-SKI43 at both
the EC50 and EC25 significantly increased the
expression levels of MYC (Fig. 7L); however, at the
EC50, RU-SKI43 significantly reduced the expression
levels of the PTCH1, VEGFA and CCND1 genes
(Fig. 7F, O and R).
Sunitinib increases the expression level
of SHH pathway target genes in 786-O, ACHN and HK2 cells
The incubation of 786-O cells with sunitinib at the
EC50 and EC25 was associated with the
upregulation of GLI1 mRNA expression (Fig. 7A). Furthermore, upregulation of
the expression levels of PTCH1, BCL2 and CCND1
genes in 786-O cells cultured with sunitinib at the EC25
(Fig. 7D, G and P), and higher
MYC mRNA expression in 786-O cells incubated with sunitinib
at the EC50 were revealed (Fig. 7J). Following the incubation of
ACHN cells with sunitinib at the EC50, increased
expression levels of GLI1 and BCL2 (Fig. 7B and H), and reduced CCND1
mRNA expression were revealed (Fig.
7Q). The treatment of HK2 cells with sunitinib at the
EC25 led to the significant upregulation of the
expression levels of GLI1 (Fig. 7C), PTCH1 (Fig. 7F), MYC (Fig. 7L) and VEGFA (Fig. 7O). Sunitinb at both the
EC50 and EC25 significantly increased the
expression levels of BCL2 in HK2 cells (Fig. 7I). In HK2 normal kidney cells,
sunitinib at the EC50 significantly decreased the mRNA
expression levels of VEGFA (Fig. 7O).
Effects of SHH pathway inhibitors on
786-O, ACHN and HK2 cell migration GANT61 and RU-SKI43 inhibit the
migration of renal cancer cell lines
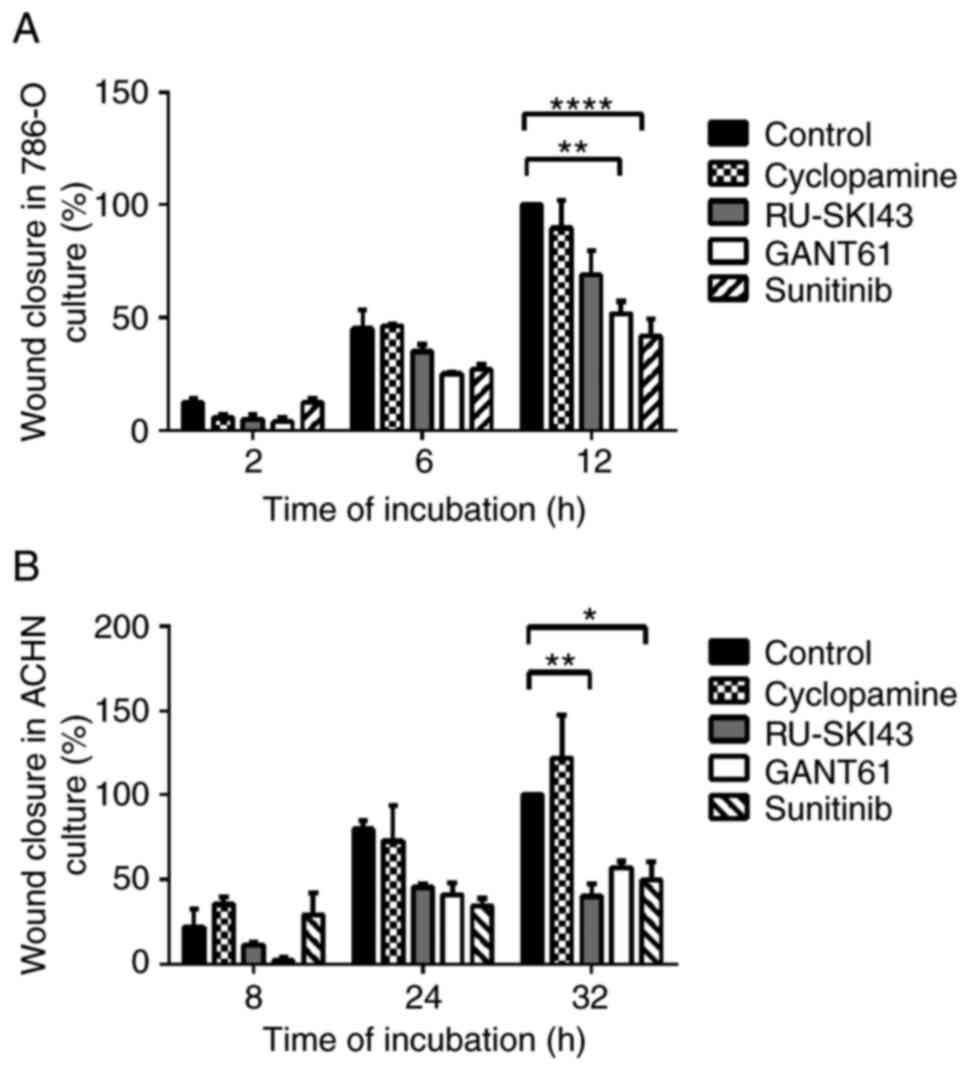
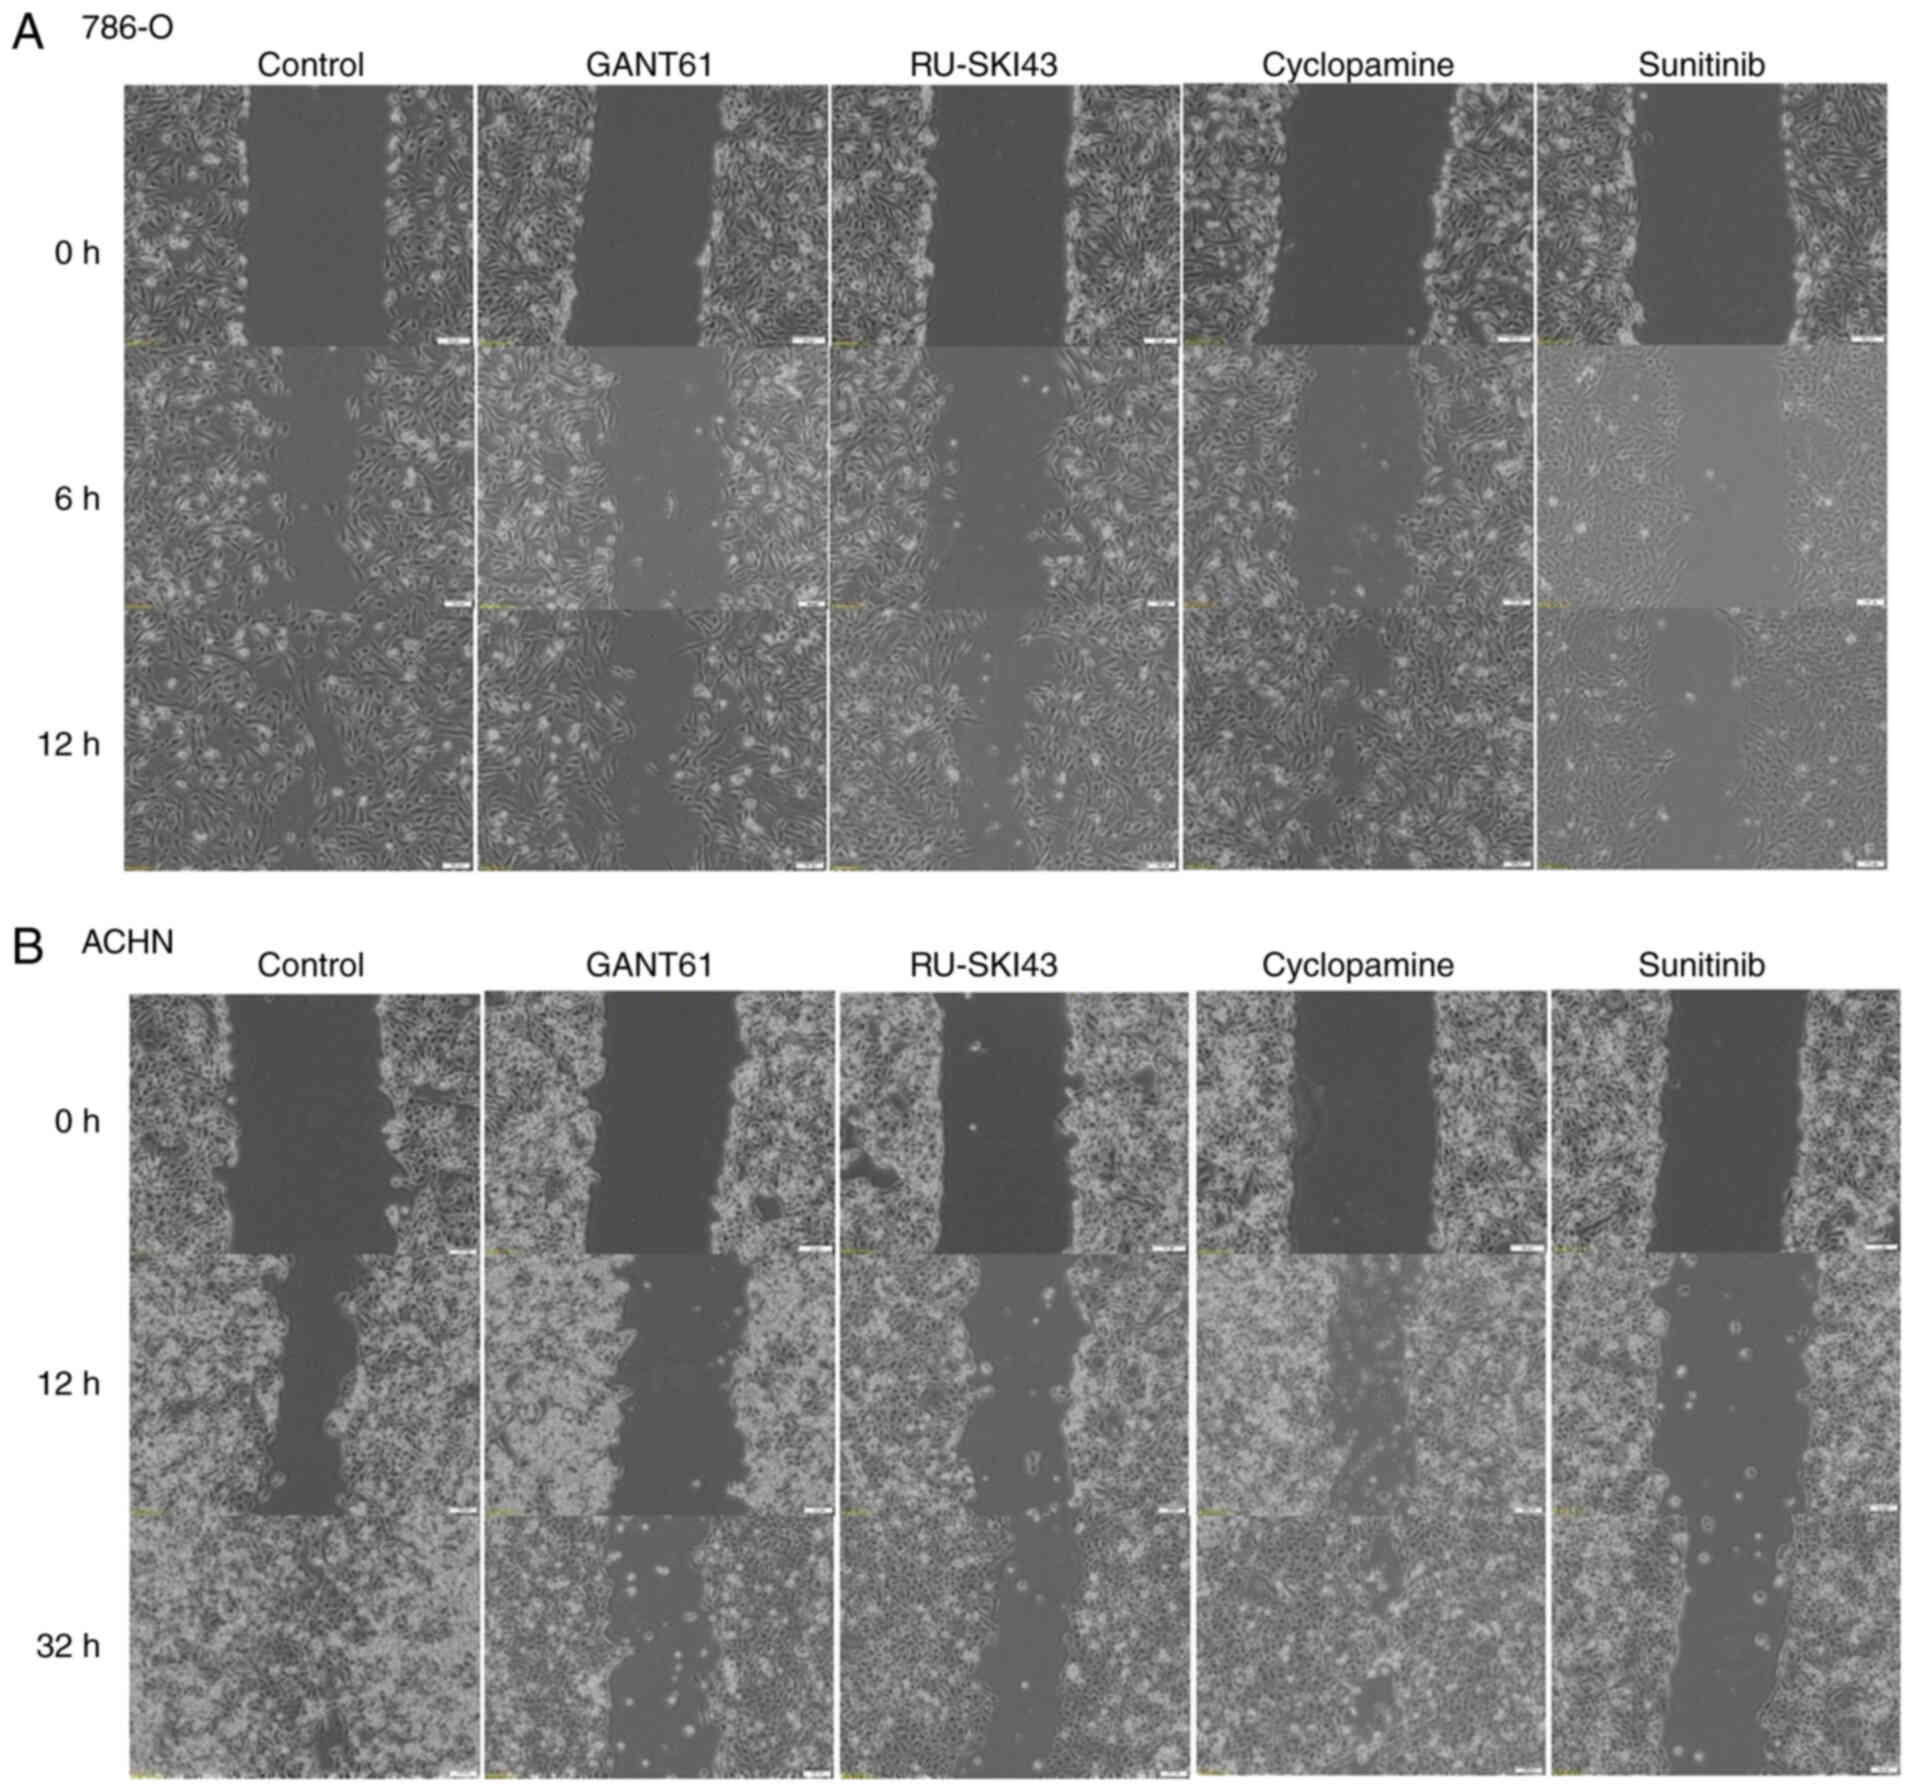
The observation times for 786-O and ACHN cells were
first adjusted, as these cell lines exhibited different migration
rates. The final time for the complete gap closure for 786-O cells
was 12 h (Figs. 8A and 9A), while ACHN cells required at least
32 h to completely close the gap (Figs. 8B and 9B). Therefore, at 12 h after
scratching, it was observed that inhibition of 786-O cell migration
was caused by sunitinib (41.83±13% wound closure) and GANT61
(51.83±7.46% wound closure). Additionally, RU-SKI43 and sunitinib
inhibited the migration of ACHN cells at 32 h after scratching
(40.02±10.55% and 49.76±15.31% wound closure, respectively), while
GANT61 and cyclopamine did not alter the rate of ACHN cell
migration. The bar graph illustrating percentage wound closure, as
well as representative images documenting the cell migration
process at the indicated time points during the scratch wound
assay, are presented in Figs. 8
and 9, respectively.
Discussion
Sonic hedgehog (SHH) signaling is involved in the
human embryogenesis of epithelial tissue (38) and the respiratory system
(39), and it is critical in the
development of the nervous system (40-42) and limbs (43,44). Although some authors have
suggested that this molecular cascade also remains active in
postnatal life in organs such as the brain (45) or lungs (46), the signaling becomes silenced in
almost all other tissues (47).
Physiological reactivation of the SHH signaling pathway has been
observed during the process of wound healing (48,49). However, upregulation of the
expression levels of SHH pathway genes, either at the mRNA or
protein level, has been observed in various malignancies, including
gastric cancer (50),
retinoblastoma (51), glioma
(52) and chronic myeloid
leukemia (53). Therefore, SHH
signaling appears to be involved in the molecular mechanism of
carcinogenesis and may provide a promising anticancer target.
The present study included 62 clear cell renal cell
carcinoma (ccRCC) patients. The clinicopathological features of the
patients, including age, female/male ratio, and stage, grade and
tumor size distribution, were similar to those of patients in our
previous research (16,35,36). The age and sex distribution
complied with the ccRCC group presented by Hsieh et al
(3). Similar to our previous
study (16), the present study
revealed markedly higher mRNA expression levels of PTCH1 in
the group of younger patients, which, to the best of our knowledge,
is a novel observation.
One of the aims of the present study was to examine
the molecular pattern of SHH pathway components at the mRNA level
in ccRCC tumor tissues compared with paired morphologically
unchanged kidney tissue samples. The data obtained via qPCR
demonstrated that the expression levels of almost all analyzed
genes were upregulated in cancer tissues. The largest increase in
expression in tumor samples (~100-fold upregulation) was reported
for GLI1. Similar to the current results, the upregulation
of the expression levels of GLI1 and GLI2 in ccRCC
was noted by Zhou et al (17) at the mRNA (qPCR) and protein
levels [immunohistochemical staining (IHC)] in 58 (qPCR) or 17
(IHC) ccRCC cases. However, contrary to the present findings, they
reported lower mRNA levels of SHH and PTCH1 in tumor
tissues and did not observe a difference in the expression levels
of GLI3 between ccRCC and control samples (17). Therefore, while the upregulation
of the expression levels of the GLI1 and GLI2 transcription factors
(TFs) in ccRCC appears to be confirmed, further studies are
required to investigate the expression of the upstream components
of the SHH signaling pathway in kidney tumor tissues. The
association between the expression of SHH pathway genes and tumor
grade has also been analyzed in colorectal carcinoma (54). The study revealed higher SHH
immunoexpression in well-differentiated tumors than in poorly
differentiated tumors, which is a similar result to the current
findings for SHH mRNA expression and ccRCC grade (54). However, in breast cancer tissues,
the immunoreactivity of SHH, GLI1 and GLI2 was found to be
positively associated with histological grade (55), which may suggest different
tendencies in the expression of SHH signaling genes depending on
cancer type and histological grade.
The crosstalk of SHH signaling and other cellular
pathways in malignancies has recently been featured in our previous
review (6). The associations
between mRNA levels of GLI1-3 and their molecular target genes in
ccRCC were determined since there are no related data in the
available literature. First, it was revealed that mRNA levels of
GLI1 were associated with GLI2-3, which confirmed
their canonical relationship in the analyzed pathway. The mRNA
expression levels of the SHH gene were positively associated
with those of the GLI1-3 TFs. Furthermore, the mRNA
expression levels of PTCH1, BCL2, MYC and
VEGFA were related to the mRNA expression levels of
GLI1-3. Therefore, the present data suggested that the SHH
cascade was involved in the stimulation of GLI1,
PTCH1, BCL2, MYC and VEGFA gene
activity in ccRCC, providing novel information. A similar
association between SHH pathway components was also observed by
Saze et al (50) in
gastric cancer. They found positive associations between the mRNA
expression levels of SHH and PTCH1, as well as among
the expression levels of PTCH1, SMO and GLI1
in gastric cancer tissues (50).
Zhou et al (17)
suggested that GLI1/2 expression in ccRCC is regulated by
PI3K/AKT signaling, due to the association between GLI1/2
mRNA expression and the content of total as well as the
phosphorylated form of AKT protein. Although the CCND1 gene
encoding cyclin D1, an important cell cycle regulator which forms a
complex with Cdk4 and Cdk6 during the G1 phase (56), is listed as one of the target
genes of the SHH pathway (57),
the present results revealed weak effects of this molecular cascade
on CCND1 expression in ccRCC.
The present study analyzed the association of the
expression levels of the genes involved in the SHH pathway and its
target genes with tumor stage (TNM 8th staging edition of RCC)
(4) and histological grade
(WHO/ISUP grading system) (58).
The mRNA levels of almost all studied genes were increased in terms
of both TNM staging and histological grading, predominantly in the
group of less advanced cancers (TNM 1+2; ISUP 1+2). A clear
tendency to downregulation of gene expression in ccRCC tumors
assessed as TNM 3+4 and ISUP 3+4 was revealed, which is a novel
observation in this type of cancer. These data suggest that the
expression levels of genes of the SHH pathway and associated target
genes may be a promising molecular marker of early kidney cancer
development; however, additional research investigating this
hypothesis must be performed. The observed decrease in GLI1,
BCL2, MYC and CCND1 mRNA levels in higher grades of
ccRCC (ISUP 3+4) compared with the levels in lower grades (ISUP
1+2) indicated the prognostic potential of these parameters. The
aforementioned results were confirmed by using a 2×2 Fisher's test
for BCL2 and CCND1 expression. Jäger et al
(59) determined the prognostic
significance of the expression of SHH pathway proteins in 140
samples with ccRCC via IHC. They revealed higher immunoreactivity
of GLI3, PTCH1 and SHH in ISUP 3+4 (G3/G4) tumors than in ISUP 1+2
(G1/G2) ccRCC tumors (59). The
disparities between their results and the present results may be
caused by the differences in the applied research techniques, IHC
vs. qPCR, respectively, with the first being considered to be
qualitative or at most semi-quantitative. Furthermore,
post-translational modifications of SHH and GLI proteins, such as
structural cleavage (22),
phosphorylation or ubiquitination (60) have been reported, and such
changes can influence the immunoreactivity.
BCL2 belongs to the BCL2 family of proteins, with
anti-apoptotic properties (8).
It is involved in the intrinsic apoptotic pathway, where it blocks
activation of BCL2-antagonist/killer and BAX proteins in/during the
absence of pro-apoptotic signals (61). The negative association between
BCL2 expression and ccRCC grade reported in the present
study is consistent with the results of a study by Itoi et
al (62). They assessed 101
RCC (including 76 ccRCC cases) specimens via IHC and western
blotting and observed higher expression levels of BCL2 in the early
TNM stages (pT1-2) and ISUP grades 1+2 than in advanced RCCs
(62). Furthermore, patients
with BCL-2-positive RCC also exhibit a longer survival period than
patients with BCL-2-negative RCC, and thus, the expression/presence
of BCL-2 could be a favorable prognostic factor in RCC (62). The same conclusion may apply to
the expression levels of the CCND1 gene, since the present
results were consistent with the results of studies by Yang et
al (63) and Wang et
al (64) which analyzed the
mRNA levels of CCND1 in a large number of ccRCC samples from
Gene Expression Omnibus datasets and revealed a negative
association between CCND1 gene expression and tumor
grade.
The MYC proto-oncogene acts as a TF for a
broad range of target genes encoding proteins involved in the
progression of the cell cycle and cell proliferation,
differentiation, metabolism and apoptosis (7,65). The present study confirmed the
oncogenic role of MYC due to its upregulation in ccRCC,
which was consistent with the results of a study by Tang et
al (66). They also
demonstrated increased MYC expression at the mRNA and
protein levels in 44 ccRCC tumors, as well as in 786-O, 769-P,
A498, ACHN and Caki-1 RCC cells (66). MYC mRNA expression was
associated with the expression levels of BCL2, VEGFA
and CCND1, indicating that those genes may be targets for
MYC oncoprotein in ccRCC (66).
These data suggest that MYC protein may serve an important role in
ccRCC development.
The analysis of the survival period revealed a
worse prognosis for patients with TNM stages 3+4 and ISUP grades
3+4, which was consistent with our previous studies on ccRCC
(16,35,36). Although higher overall
CCND1 expression was observed in ccRCC tissues, its
decreased expression was associated with worse patient outcomes.
Generally, involvement in the progression of the cell cycle makes
CCND1 a potential proto-oncogene (67). An association between
CCND1 upregulation and poor prognosis has been observed in
head and neck cancer (68) and
gastric cancer (69). However,
studies investigating ccRCC (63,64) and breast cancer (70-72) have revealed contrary data. Yang
et al (63) performed a
comprehensive analysis of the online databases containing data on
gene expression profiles in ccRCC. Similar to the present results,
they revealed an association between a longer survival period and
higher mRNA levels of CCND1 in cancer tissues. Furthermore,
both univariate and multivariate Cox regression analyses
demonstrated an association between CCND1 expression and
poor OS (63), which was
consistent with the present results of univariable analysis of
CCND1 mRNA expression in ccRCC. A study by Wang et al
(64) revealed higher
immunoreactivity of cyclin D1 in ccRCC samples compared with normal
kidney tissues, which was in line with the mRNA expression results
of the present study. Furthermore, statistical analysis of the
database of patients with ccRCC indicated that decreased mRNA
levels of CCND1 were related to tumor recurrence (64), which is in agreement with the
present observations. Therefore, the CCND1 expression
profile may have a prognostic significance in ccRCC; however, more
studies that also focus on cyclin D1 protein expression in ccRCC
tissues are required.
The results concerning the association between
increased VEGFA expression and worse outcomes were
consistent with other studies (73,74) and our previous research (36). ccRCC development is closely
related to mutations in the VHL tumor suppressor gene and
accumulation of hypoxia-inducible factors (HIFs), which stimulate
the activation of vascular endothelial growth factors (75). A high concentration of VEGFs
induces neoangiogenesis, which promotes tumor growth and
facilitates hematogenous metastases (76). Therefore, the compliance of the
obtained results with the widely-accepted pattern of kidney cancer
molecular development (77)
suggests that VEGFA gene expression may be a promising
prognostic factor in ccRCC (73,74,77). This observation was strengthened
by the results of Cox multivariable analysis, where patients with
advanced histological ISUP grade were at high risk of death, but
only with coexisting increased VEGFA mRNA expression levels
in the tumors. This observation is in accord with our previous
report that patients with ccRCC with advanced ISUP grades and high
levels of VEGFA (at the mRNA or protein level) are at higher risk
of death or ccRCC recurrence (36).
The current observation concerning upregulation of
the expression levels of the SHH pathway components and their
target genes in ccRCC prompted the examination of the influence of
the SHH pathway inhibitors on renal cancer cells in vitro.
The 786-O cell line is derived from human renal cell adenocarcinoma
and possesses features of ccRCC such as mutated VHL with
altered HIF and VEGF signaling pathways (78). ACHN is a metastatic cell line
with uncertain RCC histotype; however, with the molecular
characterization of papillary RCC (78). The present study also used
epithelial HK2 cells derived from kidney proximal tubules to
determine the effects of inhibitors on normal kidney cells
(78).
The present study examined inhibitors of the SHH
pathway acting on three different targets. RU-SKI43 blocks HHAT, an
enzyme which catalyzes posttranslational modifications of SHH, thus
inhibiting secretion of N-SHH (21). Treatment of AsPC-1 and Panc-1
pancreatic cancer cells with RU-SKI43 was found to decrease their
proliferation rate but also reduced the expression levels of
GLI1 in AsPC-1 cells (79). These results are associated with
the inhibition of HHAT activity, since C-2, a compound structurally
related to RU-SKI43 with no HHAT blocking ability, has no effect on
pancreatic cell lines (79).
Furthermore, RU-SKI43 was found to decrease the proliferation of
T47D breast cancer cells, which exhibit high expression levels of
HHAT (80). These promising
results regarding RU-SKI43 acting on pancreatic and breast cancer
cell lines prompted the selection of this SHH ligand inhibitor for
assessment in the present study, which, for the first time,
assessed its effects on renal cancer cells. Cell cycle analysis
revealed a dose-dependent decrease in the fraction of 786-O and
ACHN cells in the G0/G1 phase after RU-SKI43
treatment. The mRNA levels of some SHH target genes were
downregulated in ACHN cells; however, in 786-O cells, RU-SKI43
increased the expression levels of the MYC and VEGFA
oncogenes. The latter finding may be explained by low activity of
the HHAT enzyme in these cells, as this compound does not inhibit
the proliferation of HHAT-negative pancreatic cell lines (79); however, further experiments
should be performed to confirm this thesis.
Among numerous SHH inhibitors, cyclopamine, a
compound blocking SMO protein activity, has been widely tested in
different types of cancer cells and tissues (81-83). At present, three functional
analogs of cyclopamine, vismodegib, sonidegib (used for the
treatment of metastatic basal cell carcinoma) and glasdegib
(treatment of acute myeloid leukemia), have been approved by the
Food and Drug Administration (FDA) (84). The inhibition of cell division
indicates the possible usefulness of cyclopamine as a promising
anticancer agent in ccRCC. Furthermore, the present results
revealed that cyclopamine blocked the expression of SHH target
genes to a higher degree than the other analyzed SHH pathway
inhibitors. However, wound healing analysis did not reveal any
significant effect of cyclopamine on the migration of renal cancer
cells. The analysis performed by Dormoy et al (85) demonstrated anti-proliferative and
pro-apoptotic properties of cyclopamine in relation to 786-O cells.
Furthermore, cyclopamine treatment decreased the mRNA levels of
almost all SHH pathway genes, including GLI1, which is
consistent with previous results (85). In vivo cyclopamine studies
have demonstrated tumor regression in nude mice bearing human ccRCC
tumors (85). The present
results were also consistent with those obtained by D'Amato et
al (86) who analyzed the
effects of sonidegib on 786-O cells. This SHH inhibitor, when used
alone, does not have a significant effect on cell viability and
migration; however, it decreases the levels of GLI1 protein
measured by western blotting (86). A decrease in 786-O cell survival
and migration rates is only observed when sonidegib is used in
combination with everolimus (inhibitor of mTOR signaling) or
sunitinib (multi-targeted RTK inhibitor) and similar results have
been obtained for sunitinib-resistant 786-O SuR cells (86). Therefore, it was hypothesized
that blockade of the SHH pathway at the SMO protein level by
binding with cyclopamine or its derivatives appears to have the
best anticancer properties in ccRCC among other analyzed
inhibitors, especially in combination with other drugs targeting
other cellular processes and signaling pathways, such as everolimus
or sunitinib.
GANT61 is a downstream SHH pathway inhibitor, with
the ability to change the conformation of GLI1 and GLI2, thus
preventing the expression of their target genes (24,25). The reports of the resistance to
FDA-approved cancer therapies targeting SHH signaling (87), and the involvement of other
pathways, such as PI3K/AKT, in the stimulation of GLI-mediated
transcription (17) suggest that
direct inhibition of GLIs may be more effective than targeting the
upstream SHH pathway components. Although the promising effects of
using GANT61 have been observed in experiments on ovarian (88) or glioblastoma cells (89), this compound has not yet been
examined in clinical trials. The present analysis revealed that
GANT61 arrested ACHN and 786-O kidney cancer cells in the
G2/M phase and inhibited the migration of 786-O cells.
However, GANT61 at a high dose (EC25) increased the
number of HK2 cells in the sub-G1 phase of the cell
cycle, which may suggest that this SHH pathway inhibitor stimulates
apoptosis of normal kidney cells. This observation suggests that
GANT61 does not act specifically on cancer cells, thus its clinical
usefulness seems to be weak. Moreover, an unexpected increased
expression of SHH target genes after GANT61 treatment, was
observed. The latter finding suggests that the transcriptional
activity of GLIs in kidney cancer cells can be stimulated by
pathways other than SHH, as suggested by Zhou et al
(17). They demonstrated that
dual blockade of GLI TFs by GANT61 and perifosine (an AKT
inhibitor) provided improved anti-proliferative and pro-apoptotic
effects on 786-O and 769-P RCC cells compared with the separate
treatment with these two drugs (17). Furthermore, in vivo
treatment of cancer-bearing mice with both GANT61 and perifosine
was found to be associated with higher renal cancer suppression
than treatment with either of these agents alone, and this is
reflected by the reduction in tumor volume and increased
immunoreactivity of an apoptotic marker (cleaved-caspase 3) in
cancer tissues (17). It has
been demonstrated that activation of the MAPK/ERK signaling pathway
stimulates the transcriptional activity of GLIs in gastric cancer
(6). Therefore, due to the
possible involvement of other signaling pathways in the regulation
of transcriptional activity of GLIs in kidney cancer, the antitumor
properties of GANT61 appear to be weak.
To compare the effects of SHH inhibitors with the
drug widely used for RCC therapy we included in the study
sunitinib-the first-line chemotherapeutic applied for RCC
treatment. The present analysis revealed a stronger effect of
sunitinib on SHH-activated genes in kidney cancer cell lines than
that of GANT61. This novel finding of the increased expression
levels of GLI1 and VEGFA in RCC cell lines after
sunitinib treatment may correspond to the widely observed
acquisition of sunitinib-resistance in advanced ccRCC cases
(90). It was hypothesized that
upregulation of GLI1 and VEGFA expression may lead to
enhanced viability and aggressiveness of tumor cells even if cell
motility after treatment of cells with sunitinib was widely
reduced. It was also suggested that, in RCC tumors, some cancer
cells secrete high doses of VEGFA in response to sunitinib,
enhancing the survival of cancer by increasing neoangiogenesis and
enriching the tumor microenvironment. This could explain the
results of our previous study, which documented a strong
relationship between patient survival and occurrence of metastasis
(high HRs), treatment with sunitinib and high expression of VEGFA
(at the mRNA and protein level) in ccRCC tissues (36). However, this hypothesis requires
further analysis in in vitro and in vivo models.
In conclusion, the present study indicated that,
similarly to some other cancer types, the SHH pathway is active in
ccRCC; however, the expression levels of its components are mainly
upregulated in tumors at the early stages and grades of the
disease. The SHH effectors GLI1-3 were strongly associated with the
upregulation of MYC, BCL2 and VEGFA oncogenes in
ccRCC tissues; however, the expression of those genes in RCC cell
lines was not inhibited by SHH pathway-targeting drugs, with the
exception of cyclopamine. The ambiguous results of the effects of
GANT61 on SHH target expression may exclude this drug from further
studies in ccRCC. Therefore, it was suggested that RU-SKI43 and
cyclopamine and its derivatives should be further investigated,
especially in early and intermediate stages of ccRCC in in
vitro and in vivo models. Despite the apparent
inhibition of RCC cell migration by sunitinib, the observed
upregulation of GLI1, BCL2, MYC and VEGFA oncogenes
is yet another challenge to overcome in the first-line therapy of
advanced ccRCC with sunitinib (36). Another novelty of the present
study was the observation of worse outcome in patients with ccRCC
with low expression levels of CCND1. Although cyclin D has
been acknowledged as an oncoprotein, the role of its decreased
expression in ccRCC compared with other malignancies should be
further investigated. Furthermore, the relationship between high
VEGFA expression and low CCND1 expression and patient
outcomes should be taken into consideration in the identification
of potential prognostic factors in ccRCC.
Availability of data and materials
The datasets used and/or analyzed during the
current study are available from the corresponding author on
reasonable request.
Authors' contributions
AKC and AR performed the molecular analyses and
statistical tests and prepared the manuscript. JK collected the
tissue samples and acquired the data. MM collected the tissue
samples, acquired the data, and provided funding. ZK revised the
manuscript in light of the analyzed data, give the final approval
of the version to be published, and provided funding. PMW designed
and supervised the study and revised the manuscript. All authors
have read and approved the final manuscript for publication. AKC
and PMW confirm the authenticity of all the raw data.
Ethics approval and consent to
participate
The present study received the approval of the
Independent Bioethics Commission at the Medical University of
Gdańsk (decision nos. NKEBN/4/2011 and NKBBN/370/2016; Gdansk,
Poland), and written informed consent was obtained before surgery
from each patient. All experimental procedures were performed
according to the regulations and internal biosafety and bioethics
guidelines.
Patient consent for publication
Not applicable.
Competing interests
The authors declare that they have no competing
interests.
Acknowledgments
Not applicable.
Funding
This study was supported by the ST-12 and ST-02-0117/07
statutory funds of the Medical University of Gdańsk, as well as a
grant from the Polish Ministry of Science and Higher Education
(contract grant no. MB 664/280/63/73-3309).
References
|
1
|
Sung H, Ferlay J, Siegel RL, Laversanne M,
Soerjomataram I, Jemal A and Bray F: Global Cancer Statistics 2020:
GLOBOCAN estimates of incidence and mortality Worldwide for 36
Cancers in 185 Countries. CA A Cancer J Clin. 71:209–249. 2021.
View Article : Google Scholar
|
|
2
|
Padala SA and Barsouk A, Thandra KC,
Saginala K, Mohammed A, Vakiti A, Rawla P and Barsouk A:
Epidemiology of renal cell carcinoma. World J Oncol. 11:79–87.
2020. View Article : Google Scholar : PubMed/NCBI
|
|
3
|
Hsieh JJ, Purdue MP, Signoretti S, Swanton
C, Albiges L, Schmidinger M, Heng DY, Larkin J and Ficarra V: Renal
cell carcinoma. Nat Rev Dis Primers. 3:170092017. View Article : Google Scholar : PubMed/NCBI
|
|
4
|
Escudier B, Porta C, Schmidinger M,
Rioux-Leclercq N, Bex A, Khoo V, Grünwald V and Gillessen S;
clinicalguidelines@esmo.org: Renal cell carcinoma: ESMO Clinical
Practice Guidelines for diagnosis, treatment and follow-up. Ann
Oncol. 30:706–720. 2019. View Article : Google Scholar : PubMed/NCBI
|
|
5
|
Carballo GB, Honorato JR, de Lopes GPF and
Spohr TCLSE: A highlight on Sonic hedgehog pathway. Cell Commun
Signal. 16:112018. View Article : Google Scholar : PubMed/NCBI
|
|
6
|
Kotulak-Chrząszcz A, Kmieć Z and
Wierzbicki P: Sonic Hedgehog signaling pathway in gynecological and
genitourinary cancer (Review). Int J Mol Med. 47:1062021.
View Article : Google Scholar
|
|
7
|
Chen H, Liu H and Qing G: Targeting
oncogenic Myc as a strategy for cancer treatment. Sig Transduct
Target Ther. 3:52018. View Article : Google Scholar
|
|
8
|
Warren CFA, Wong-Brown MW and Bowden NA:
BCL-2 family isoforms in apoptosis and cancer. Cell Death Dis.
10:1772019. View Article : Google Scholar : PubMed/NCBI
|
|
9
|
Claesson-Welsh L and Welsh M: VEGFA and
tumour angiogenesis. J Intern Med. 273:114–127. 2013. View Article : Google Scholar
|
|
10
|
Qie S and Diehl JA: Cyclin D1, cancer
progression, and opportunities in cancer treatment. J Mol Med
(Berl). 94:1313–1326. 2016. View Article : Google Scholar
|
|
11
|
Huang J, Jiang D, Zhu T, Wang Y, Wang H,
Wang Q, Tan L, Zhu H and Yao J: Prognostic significance of c-MYC
amplification in esophageal squamous cell carcinoma. Ann Thorac
Surg. 107:436–443. 2019. View Article : Google Scholar
|
|
12
|
Huang S, Nong L, Wang W, Liang L, Zheng Y,
Liu J, Li D, Li X, Zhang B and Li T: Prognostic impact of diffuse
large B-cell lymphoma with extra copies of MYC, BCL2 and/or BCL6:
Comparison with double/triple hit lymphoma and double expressor
lymphoma. Diagn Pathol. 14:812019. View Article : Google Scholar : PubMed/NCBI
|
|
13
|
Zhang SD, Mccrudden CM and Kwok HF:
Prognostic significance of combining VEGFA, FLT1 and KDR mRNA
expression in lung cancer. Oncol Lett. 10:1893–1901. 2015.
View Article : Google Scholar : PubMed/NCBI
|
|
14
|
Shan YS, Hsu HP, Lai MD, Hung YH, Wang CY,
Yen MC and Chen YL: Cyclin D1 overexpression correlates with poor
tumor differentiation and prognosis in gastric cancer. Oncol Lett.
14:4517–4526. 2017. View Article : Google Scholar : PubMed/NCBI
|
|
15
|
Behnsawy HM, Shigemura K, Meligy FY,
Yamamichi F, Yamashita M, Haung WC, Li X, Miyake H, Tanaka K,
Kawabata M, et al: Possible role of sonic hedgehog and
epithelial-mesenchymal transition in renal cell cancer progression.
Korean J Urol. 54:5472013. View Article : Google Scholar : PubMed/NCBI
|
|
16
|
Kotulak-Chrzaszcz A, Klacz J, Matuszewski
M, Kmiec Z and Wierzbicki P: Expression of the Sonic Hedgehog
pathway components in clear cell renal cell carcinoma. Oncol Lett.
18:5801–5810. 2019.PubMed/NCBI
|
|
17
|
Zhou J, Zhu G, Huang J, Li L, Du Y, Gao Y,
Wu D, Wang X, Hsieh JT, He D and Wu K: Non-canonical GLI1/2
activation by PI3K/AKT signaling in renal cell carcinoma: A novel
potential therapeutic target. Cancer Lett. 370:313–323. 2016.
View Article : Google Scholar
|
|
18
|
Furukawa J, Miyake H and Fujisawa M: GLI2
expression levels in radical nephrectomy specimens as a predictor
of disease progression in patients with metastatic clear cell renal
cell carcinoma following treatment with sunitinib. Mol Clin Oncol.
5:186–192. 2016. View Article : Google Scholar : PubMed/NCBI
|
|
19
|
Zhou J, Wu K, Gao D, Zhu G, Wu D, Wang X,
Chen Y, Du Y, Song W, Ma Z, et al: Reciprocal regulation of
hypoxia-inducible factor 2α and GLI1 expression associated with the
radioresistance of renal cell carcinoma. Int J Radiat Oncol Biol
Phys. 90:942–951. 2014. View Article : Google Scholar
|
|
20
|
Xin M, Ji X, De La Cruz LK, Thareja S and
Wang B: Strategies to target the Hedgehog signaling pathway for
cancer therapy. Med Res Rev. 38:870–913. 2018. View Article : Google Scholar : PubMed/NCBI
|
|
21
|
Lanyon-Hogg T, Masumoto N, Bodakh G,
Konitsiotis AD, Thinon E, Rodgers UR, Owens RJ, Magee AI and Tate
EW: Synthesis and characterisation of
5-acyl-6,7-dihydrothieno[3,2-c]pyridine inhibitors of Hedgehog
acyltransferase. Data Brief. 7:257–281. 2016. View Article : Google Scholar : PubMed/NCBI
|
|
22
|
Gong X, Qian H, Cao P, Zhao X, Zhou Q, Lei
J and Yan N: Structural basis for the recognition of Sonic Hedgehog
by human Patched1. Science. 361:eaas89352018. View Article : Google Scholar : PubMed/NCBI
|
|
23
|
Rimkus TK, Carpenter RL, Qasem S, Chan M
and Lo HW: Targeting the Sonic Hedgehog signaling pathway: Review
of smoothened and GLI inhibitors. Cancers (Basel). 8:222016.
View Article : Google Scholar
|
|
24
|
Lauth M, Bergstrom A, Shimokawa T and
Toftgard R: Inhibition of GLI-mediated transcription and tumor cell
growth by small-molecule antagonists. Proc Natl Acad Sci USA.
104:8455–8460. 2007. View Article : Google Scholar : PubMed/NCBI
|
|
25
|
Gonnissen A, Isebaert S and Haustermans K:
Targeting the Hedgehog signaling pathway in cancer: Beyond
smoothened. Oncotarget. 6:13899–13913. 2015. View Article : Google Scholar : PubMed/NCBI
|
|
26
|
Eble JN, Sauter G, Epstein JI and
Sesterhenn IA: Pathology and genetics of tumours of the urinary
system and male genital organs. World Health Organization
Classification of Tumours. IARC Press; Lyon: 2004, https://www.patologi.com/WHO%20kidney%20testis.pdf.
|
|
27
|
The Cancer Genome and Atlas Research
Network: Comprehensive molecular characterization of clear cell
renal cell carcinoma. Nature. 499:43–49. 2013. View Article : Google Scholar
|
|
28
|
Wierzbicki PM, Klacz J, Rybarczyk A,
Slebioda T, Stanislawowski M, Wronska A, Kowalczyk A, Matuszewski M
and Kmiec Z: Identification of a suitable qPCR reference gene in
metastatic clear cell renal cell carcinoma. Tumor Biol.
35:12473–12487. 2014. View Article : Google Scholar
|
|
29
|
Livak KJ and Schmittgen TD: Analysis of
relative gene expression data using real-time quantitative PCR and
the 2(-Delta Delta C(T)) method. Methods. 25:402–408. 2001.
View Article : Google Scholar
|
|
30
|
Vichai V and Kirtikara K: Sulforhodamine B
colorimetric assay for cytotoxicity screening. Nat Protoc.
1:1112–1116. 2006. View Article : Google Scholar
|
|
31
|
Kang CW, Han YE, Kim J, Oh JH, Cho YH and
Lee EJ: 4-Hydroxybenzaldehyde accelerates acute wound healing
through activation of focal adhesion signalling in keratinocytes.
Sci Rep. 7:141922017. View Article : Google Scholar : PubMed/NCBI
|
|
32
|
Pan YJ, Wei LL, Wu XJ, Huo FC, Mou J and
Pei DS: MiR-106a-5p inhibits the cell migration and invasion of
renal cell carcinoma through targeting PAK5. Cell Death Dis.
8:e31552017. View Article : Google Scholar : PubMed/NCBI
|
|
33
|
Pinto BI, Cruz ND, Lujan OR, Propper CR
and Kellar RS: In vitro scratch assay to demonstrate effects of
arsenic on skin cell migration. J Vis Exp. 3791:588382019.
|
|
34
|
Zhao JJ, Chen PJ, Duan RQ, Li KJ, Wang YZ
and Li Y: MiR-630 functions as a tumor oncogene in renal cell
carcinoma. Arch Med Sci. 12:473–478. 2016. View Article : Google Scholar : PubMed/NCBI
|
|
35
|
Rybarczyk A, Klacz J, Wronska A,
Matuszewski M, Kmiec Z and Wierzbicki PM: Overexpression of the
YAP1 oncogene in clear cell renal cell carcinoma is associated with
poor outcome. Oncol Rep. 38:427–439. 2017. View Article : Google Scholar : PubMed/NCBI
|
|
36
|
Wierzbicki PM, Klacz J, Kotulak-Chrzaszcz
A, Wronska A, Stanislawowski M, Rybarczyk A, Ludziejewska A, Kmiec
Z and Matuszewski M: Prognostic significance of VHL, HIF1A, HIF2A,
VEGFA and p53 expression in patients with clear-cell renal cell
carcinoma treated with sunitinib as first-line treatment. Int J
Oncol. 55:371–390. 2019.PubMed/NCBI
|
|
37
|
Moch H, Cubilla AL, Humphrey PA, Reuter VE
and Ulbright TM: The 2016 WHO classification of tumours of the
urinary system and male genital organs-part A: Renal, penile, and
testicular tumours. Eur Urol. 70:93–105. 2016. View Article : Google Scholar : PubMed/NCBI
|
|
38
|
Zheng L, Rui C, Zhang H, Chen J, Jia X and
Xiao Y: Sonic hedgehog signaling in epithelial tissue development.
Regen Med Res. 7:32019. View Article : Google Scholar
|
|
39
|
Fernandes-Silva H, Correia-Pinto J and
Moura R: Canonical Sonic Hedgehog signaling in early lung
development. J Dev Biol. 5:32017. View Article : Google Scholar
|
|
40
|
Memi F, Zecevic N and Radonjić N: Multiple
roles of Sonic Hedgehog in the developing human cortex are
suggested by its widespread distribution. Brain Struct Funct.
223:2361–2375. 2018. View Article : Google Scholar : PubMed/NCBI
|
|
41
|
Park SM, Jang HJ and Lee JH: Roles of
primary cilia in the developing brain. Front Cell Neurosci.
13:2182019. View Article : Google Scholar : PubMed/NCBI
|
|
42
|
Martinez-Chavez E, Scheerer C, Wizenmann A
and Blaess S: The zinc finger transcription factor GLI3 is a
regulator of precerebellar neuronal migration. Development.
145:dev1660332018. View Article : Google Scholar
|
|
43
|
Lopez-Rios J: The many lives of SHH in
limb development and evolution. Semin Cell Dev Biol. 49:116–124.
2016. View Article : Google Scholar : PubMed/NCBI
|
|
44
|
Tickle C and Towers M: Sonic Hedgehog
signaling in limb development. Front Cell Dev Biol. 5:142017.
View Article : Google Scholar : PubMed/NCBI
|
|
45
|
Rivell A, Petralia RS, Wang YX, Clawson E,
Moehl K, Mattson MP and Yao PJ: Sonic hedgehog expression in the
postnatal brain. Biol Open. 8:bio.0405922019. View Article : Google Scholar
|
|
46
|
Wang C, Cassandras M and Peng T: The role
of Hedgehog signaling in adult lung regeneration and maintenance. J
Dev Biol. 7:142019. View Article : Google Scholar :
|
|
47
|
Fattahi S, Pilehchian Langroudi M and
Akhavan-Niaki H: Hedgehog signaling pathway: Epigenetic regulation
and role in disease and cancer development. J Cell Physiol.
233:5726–5735. 2018. View Article : Google Scholar : PubMed/NCBI
|
|
48
|
Le H, Kleinerman R, Lerman OZ, Brown D,
Galiano R, Gurtner GC, Warren SM, Levine JP and Saadeh PB: Hedgehog
signaling is essential for normal wound healing: Hedgehog signaling
is essential for normal wound healing. Wound Repair Regen.
16:768–773. 2008. View Article : Google Scholar
|
|
49
|
Takebe H, Shalehin N, Hosoya A, Shimo T
and Irie K: Sonic Hedgehog regulates bone fracture healing. Int J
Mol Sci. 21:6772020. View Article : Google Scholar :
|
|
50
|
Saze Z, Terashima M, Kogure M, Ohsuka F,
Suzuki H and Gotoh M: Activation of the Sonic Hedgehog pathway and
its prognostic impact in patients with gastric cancer. Dig Surg.
29:115–123. 2012. View Article : Google Scholar : PubMed/NCBI
|
|
51
|
Choe JY, Yun JY, Jeon YK, Kim SH, Choung
HK, Oh S, Park M and Kim JE: Sonic hedgehog signalling proteins are
frequently expressed in retinoblastoma and are associated with
aggressive clinicopathological features. J Clin Pathol. 68:6–11.
2015. View Article : Google Scholar
|
|
52
|
Li Q, Zhang Y, Zhan H, Yuan Z, Lu P, Zhan
L and Xu W: The Hedgehog signalling pathway and its prognostic
impact in human gliomas: Role of Hedgehog pathway in gliomas. ANZ J
Surg. 81:440–445. 2011. View Article : Google Scholar
|
|
53
|
Dierks C, Beigi R, Guo GR, Zirlik K,
Stegert MR, Manley P, Trussell C, Schmitt-Graeff A, Landwerlin K,
Veelken H and Warmuth M: Expansion of Bcr-Abl-positive leukemic
stem cells is dependent on Hedgehog pathway activation. Cancer
Cell. 14:238–249. 2008. View Article : Google Scholar : PubMed/NCBI
|
|
54
|
Al Ghamdi D, Gomaa W, Abulaban A, Al-Ahwal
M, Buhmeida A, Al-Qahtani M and Al-Maghrabi J: The significance of
sonic hedgehog immunohistochemical expression in colorectal
carcinoma. J Microsc Ultrastruct. 3:169–174. 2015. View Article : Google Scholar : PubMed/NCBI
|
|
55
|
Kurebayashi J, Kanomata N, Koike Y, Ohta
Y, Saitoh W and Kishino E: Comprehensive immunohistochemical
analyses on expression levels of Hedgehog signaling molecules in
breast cancers. Breast Cancer. 25:759–767. 2018. View Article : Google Scholar : PubMed/NCBI
|
|
56
|
Pestell RG: New roles of Cyclin D1. Am J
Pathol. 183:3–9. 2013. View Article : Google Scholar : PubMed/NCBI
|
|
57
|
Skoda AM, Simovic D, Karin V, Kardum V,
Vranic S and Serman L: The role of the Hedgehog signaling pathway
in cancer: A comprehensive review. Bosn J Basic Med Sci. 18:8–20.
2018. View Article : Google Scholar :
|
|
58
|
Delahunt B, Cheville JC, Martignoni G,
Humphrey PA, Magi-Galluzzi C, McKenney J, Egevad L, Algaba F, Moch
H, Grignon DJ, et al: The International society of urological
pathology (ISUP) grading system for renal cell carcinoma and other
prognostic parameters. Am J Surg Pathol. 37:1490–1504. 2013.
View Article : Google Scholar : PubMed/NCBI
|
|
59
|
Jäger W, Thomas C, Fazli L, Hurtado-Coll
A, Li E, Janssen C, Gust KM, So AI, Hainz M, Schmidtmann I, et al:
DHH is an independent prognosticator of oncologic outcome of clear
cell renal cell carcinoma. J Urol. 192:1842–1848. 2014. View Article : Google Scholar : PubMed/NCBI
|
|
60
|
Niewiadomski P, Niedziółka SM, Markiewicz
Ł, Uśpieński T, Baran B and Chojnowska K: Gli Proteins: Regulation
in development and cancer. Cells. 8:1472019. View Article : Google Scholar :
|
|
61
|
Radha G and Raghavan SC: BCL2: A promising
cancer therapeutic target. Biochim Biophys Acta Rev Cancer.
1868:309–314. 2017. View Article : Google Scholar : PubMed/NCBI
|
|
62
|
Itoi T, Yamana K, Bilim V, Takahashi K and
Tomita F: Impact of frequent Bcl-2 expression on better prognosis
in renal cell carcinoma patients. Br J Cancer. 90:200–205. 2004.
View Article : Google Scholar : PubMed/NCBI
|
|
63
|
Yang JF, Shi SN, Xu WH, Qiu YH, Zheng JZ,
Yu K, Song XY, Li F, Wang Y, Wang R, et al: Screening,
identification and validation of CCND1 and PECAM1/CD31 for
predicting prognosis in renal cell carcinoma patients. Aging
(Albany NY). 11:12057–12079. 2019. View Article : Google Scholar
|
|
64
|
Wang QS, Li F, Liao ZQ, Li K, Yang XL, Lin
YY, Zhao YL, Weng SY, Xia Y, Ye Y, et al: Low level of Cyclin-D1
correlates with worse prognosis of clear cell renal cell carcinoma
patients. Cancer Med. 8:4100–4109. 2019. View Article : Google Scholar : PubMed/NCBI
|
|
65
|
Wang XN, Su XX, Cheng SQ, Sun ZY, Huang ZS
and Ou TM: MYC modulators in cancer: A patent review. Expert Opin
Ther Pat. 29:353–367. 2019. View Article : Google Scholar : PubMed/NCBI
|
|
66
|
Tang SW, Chang WH, Su YC, Chen YC, Lai YH,
Wu PT, Hsu CI, Lin WC, Lai MK and Lin JY: MYC pathway is activated
in clear cell renal cell carcinoma and essential for proliferation
of clear cell renal cell carcinoma cells. Cancer Lett. 273:35–43.
2009. View Article : Google Scholar
|
|
67
|
Tchakarska G and Sola B: The double
dealing of cyclin D1. Cell Cycle. 19:163–178. 2020. View Article : Google Scholar :
|
|
68
|
Moradi Binabaj M, Bahrami A, Khazaei M,
Ryzhikov M, Ferns GA, Avan A and Mahdi Hassanian S: The prognostic
value of cyclin D1 expression in the survival of cancer patients: A
meta-analysis. Gene. 728:1442832020. View Article : Google Scholar
|
|
69
|
Kumari S, Puneet, Prasad SB, Yadav SS,
Kumar M, Khanna A, Dixit VK, Nath G, Singh S and Narayan G: Cyclin
D1 and cyclin E2 are differentially expressed in gastric cancer.
Med Oncol. 33:402016. View Article : Google Scholar : PubMed/NCBI
|
|
70
|
Lehn S, Tobin NP, Berglund P, Nilsson K,
Sims AH, Jirström K, Härkönen P, Lamb R and Landberg G:
Down-regulation of the oncogene cyclin D1 increases migratory
capacity in breast cancer and is linked to unfavorable prognostic
features. Am J Pathol. 177:2886–2897. 2010. View Article : Google Scholar : PubMed/NCBI
|
|
71
|
Mylona E, Tzelepis K, Theohari I,
Giannopoulou I, Papadimitriou C and Nakopoulou L: Cyclin D1 in
invasive breast carcinoma: Favourable prognostic significance in
unselected patients and within subgroups with an aggressive
phenotype. Histopathology. 62:472–480. 2013. View Article : Google Scholar
|
|
72
|
Ortiz AB, Garcia D, Vicente Y, Palka M,
Bellas C and Martin P: Prognostic significance of cyclin D1 protein
expression and gene amplification in invasive breast carcinoma.
PLoS One. 12:e01880682017. View Article : Google Scholar : PubMed/NCBI
|
|
73
|
Ebru T, Fulya OP, Hakan A, Vuslat YC,
Necdet S, Nuray C and Filiz O: Analysis of various potential
prognostic markers and survival data in clear cell renal cell
carcinoma. Int Braz J Urol. 43:440–454. 2017. View Article : Google Scholar :
|
|
74
|
Wang X, Zhang J, Wang Y, Tu M, Wang Y and
Shi G: Upregulated VEGFA and DLL4 act as potential prognostic genes
for clear cell renal cell carcinoma. Onco Targets Ther.
11:1697–1706. 2018. View Article : Google Scholar :
|
|
75
|
Zhang J and Zhang Q: VHL and hypoxia
signaling: Beyond HIF in cancer. Biomedicines. 6:352018. View Article : Google Scholar :
|
|
76
|
Aziz SA, Sznol J, Adeniran A, Colberg JW,
Camp RL and Kluger HM: Vascularity of primary and metastatic renal
cell carcinoma specimens. J Transl Med. 11:152013. View Article : Google Scholar : PubMed/NCBI
|
|
77
|
Turner KJ, Moore JW, Jones A, Taylor CF,
Cuthbert-Heavens D, Han C, Leek RD, Gatter KC, Maxwell PH,
Ratcliffe PJ, et al: Expression of hypoxia-inducible factors in
human renal cancer: Relationship to angiogenesis and to the von
Hippel-Lindau gene mutation. Cancer Res. 62:2957–2961.
2002.PubMed/NCBI
|
|
78
|
Brodaczewska KK, Szczylik C, Fiedorowicz
M, Porta C and Czarnecka AM: Choosing the right cell line for renal
cell cancer research. Mol Cancer. 15:832016. View Article : Google Scholar : PubMed/NCBI
|
|
79
|
Petrova E, Matevossian A and Resh MD:
Hedgehog acyltransferase as a target in pancreatic ductal
adenocarcinoma. Oncogene. 34:263–268. 2015. View Article : Google Scholar :
|
|
80
|
Matevossian A and Resh MD: Hedgehog
Acyltransferase as a target in estrogen receptor positive, HER2
amplified, and tamoxifen resistant breast cancer cells. Mol Cancer.
14:722015. View Article : Google Scholar : PubMed/NCBI
|
|
81
|
Liu HY and Dong Z: Gli3 silencing enhances
cyclopamine suppressive effects on ovarian cancer. Onco Targets
Ther. 7:2007–2011. 2014. View Article : Google Scholar : PubMed/NCBI
|
|
82
|
Mukherjee S, Frolova N, Sadlonova A, Novak
Z, Steg A, Page GP, Welch DR, Lobo-Ruppert SM, Ruppert JM, Johnson
MR and Frost AR: Hedgehog signaling and response to cyclopamine
differ in epithelial and stromal cells in benign breast and breast
cancer. Cancer Biol Ther. 5:674–683. 2006. View Article : Google Scholar : PubMed/NCBI
|
|
83
|
Steg A, Amm HM, Novak Z, Frost AR and
Johnson MR: Gli3 mediates cell survival and sensitivity to
cyclopamine in pancreatic cancer. Cancer Biol Ther. 10:893–902.
2010. View Article : Google Scholar : PubMed/NCBI
|
|
84
|
Peer E, Tesanovic S and Aberger F:
Next-generation Hedgehog/GLI pathway inhibitors for cancer therapy.
Cancers (Basel). 11:5382019. View Article : Google Scholar
|
|
85
|
Dormoy V, Danilin S, Lindner V, Thomas L,
Rothhut S, Coquard C, Helwig JJ, Jacqmin D, Lang H and Massfelder
T: The sonic hedgehog signaling pathway is reactivated in human
renal cell carcinoma and plays orchestral role in tumor growth. Mol
Cancer. 8:1232009. View Article : Google Scholar : PubMed/NCBI
|
|
86
|
D'Amato C, Rosa R, Marciano R, D'Amato V,
Formisano L, Nappi L, Raimondo L, Di Mauro C, Servetto A, Fulciniti
F, et al: Inhibition of Hedgehog signalling by NVP-LDE225
(Erismodegib) interferes with growth and invasion of human renal
cell carcinoma cells. Br J Cancer. 111:1168–1179. 2014. View Article : Google Scholar : PubMed/NCBI
|
|
87
|
Carpenter RL and Ray H: Safety and
tolerability of Sonic Hedgehog pathway inhibitors in Cancer. Drug
Saf. 42:263–279. 2019. View Article : Google Scholar : PubMed/NCBI
|
|
88
|
Chang Y, Chen H, Duan J, Wu W, Le F and
Mou F: The inhibitory effect and safety of GANT61 on HeLa cells in
nude mice. Exp Mol Pathol. 113:1043522020. View Article : Google Scholar
|
|
89
|
Carballo GB, Ribeiro JH, Lopes GPF, Ferrer
VP, Dezonne RS, Pereira CM and Spohr TCLS: GANT-61 induces
autophagy and apoptosis in glioblastoma cells despite their
heterogeneity. Cell Mol Neurobiol. 41:1227–1244. 2021. View Article : Google Scholar
|
|
90
|
Brown LC, Desai K, Zhang T and Ornstein
MC: The immunotherapy landscape in renal cell carcinoma. BioDrugs.
34:733–748. 2020. View Article : Google Scholar : PubMed/NCBI
|