Introduction
Urokinase-type plasminogen activator (uPA) and its
main inhibitor, plasminogen activator inhibitor type 1 (PAI-1), are
proteolytic factors, which have been reported to be involved in
extracellular matrix degradation and cell migration (1). These factors have been characterized
by the American Society of Clinical Oncology (ASCO) and the French
National Cancer Institute (INCa) as biomarkers for therapeutic
de-escalation (chemotherapy withdrawal) in localized estrogen
receptor (ER)-positive/human epidermal growth factor receptor
(HER2)-negative (ER+/HER2−) breast cancer
(highest level of evidence: A1) (2–4).
This may indicate that they can be considered as more direct and
affordable alternatives to multigenic signatures such as the
Oncotype DX Recurrence Score (5),
EndoPredict (EP/EPclin) (6) and
Prosigna® Risk Of Recurrence score (7). uPA and PAI-1 expression levels
improve the management of ER+/HER2−
early-stage breast cancer when used in conjunction with other
clinicopathological data. Despite a high level of evidence, their
use remains limited as they can be reliably quantified only using
ELISA, by using a cytosolic preparation obtained from a freshly
collected, rapidly frozen and pathologically controlled tumor
sample of at least 125 mm3 in size (~100 mg). In
clinical routine practice, tumors are formalin-fixed and
paraffin-embedded (FFPE) for diagnostic purposes and for
investigating classical prognostic and predictive biomarkers
(hormone receptors, HER2, cell proliferation) (8). Tumor sample freezing is limited to
expert centers with specific facilities. Moreover, small tumors
(<1 cm in diameter) are generally excluded from this analysis,
since the whole sample is then required for FFPE fixation, in order
to be adequate for anatomopathological analysis. As a result, the
use of uPA/PAI-1 testing by ELISA remains exclusively in few expert
centers, in which only tumors that are of adequate size are used,
in order to permit FFPE fixation and fresh-frozen tissue storage.
Two prospective studies have underlined the limited feasibility of
uPA/PAI-1 testing in routine practice (2,9) by
reporting that only 48–57% of breast tumor samples could be
assessed with validated ELISA. A method compatible with FFPE
specimens could facilitate uPA/PAI-1 testing in all breast cancers
(even small tumors), thus contributing to the selection of the most
appropriate treatment for each patient. Several studies have tried
to use immunohistochemistry as an alternative method to ELISA for
the quantification of uPA and PAI-1 (10–13).
However, although immunohistochemistry may be inexpensive and
universally implemented in pathology laboratories, it has not been
validated for uPA and PAI-1, as discrepant results have been
reported. These conflicting results are probably related to the
absence of consensus regarding the cellular compartment designated
for analysis (stromal vs. epithelial cells) and the lack of
validated antibodies, signal quantification methods and
discriminating thresholds (14).
Compelling evidence has suggested that mRNA
expression may be considered as an alternative for protein
expression. Actually, the majority of studies in which uPA/PAI-1
mRNA and protein expression levels were compared have revealed
satisfying concordance (15–18).
However, until recently, mRNA quantification was mainly performed
in frozen samples and therefore, presented with the same drawbacks
as ELISA. Transcriptomic investigations based on FFPE samples have
been limited due to the fact that sample handling for FFPE has been
reported to damage RNA (19).
In the present study, RNAscope®, an in
situ hybridization (ISH) technology was used, allowing the
assessment of gene expression in FFPE tissue sections using a
series of double-Z target probes and branched DNA (20) for the quantification of PLAU
and SERPINE1 gene mRNA expression levels (corresponding to
uPA and PAI-1 proteins, respectively) in FFPE breast cancer
samples. The objective was to determine the concordance between
uPA/PAI-1 protein quantification in fresh tumor samples by using
the ELISA reference test, and PLAU/SERPINE1 mRNA
levels in paired FFPE breast tumor samples by applying
RNAscope® technology. It was hypothesized that in case
the protein and mRNA levels were concordant, mRNA testing in FFPE
breast tumor samples could be easily integrated in the clinical
routine, in order to improve breast cancer management, particularly
for patients with early ER+/HER2− breast
cancer.
Patients and methods
Patients and tumor samples
For the present study, breast tumor samples in which
uPA and PAI-1 levels had been quantified using the
FEMTELLE® uPA/PAI-1 ELISA kit (cat. no. 11-899; Cryopep)
for routine diagnosis (15,21),
were retrieved from a retrospective monocentric tumor biobank,
which included samples and data on 520 patients with
hormone-sensitive HER2-negative breast cancer, admitted to the
Montpellier Cancer Institute between 2006 and 2011. According to
the determined optimal sample size (as described below in the
Statistical analysis paragraph), 83 patients were randomly
selected to represent the dynamic ranges of uPA and PAI-1
concentrations (from 0.3 to 15 ng/mg and from 3.7 to 104.3 ng/mg
proteins for uPA and PAI-1, respectively) and to obtain four
equilibrated groups of patients (low/high uPA and low/high PAI-1),
by using the established cut-off values of 3 and 14 ng/mg total
protein for uPA and PAI-1, respectively (22,23)
(Table SI).
The corresponding FFPE tissue blocks were
identified, de-archived by the Clinical Resources Center of the
Montpellier Cancer Institute (CRB-ICM, declaration number
BB-033-00059) and used for the present study. The main clinical and
pathological characteristics of the patients are presented in
Table I.
 | Table I.Clinicopathological characteristics
of the study population (n=83). |
Table I.
Clinicopathological characteristics
of the study population (n=83).
|
Characteristics | No. of
patients | % |
|---|
| Age (years); range,
36–69 |
|
|
|
≤54 | 41 | 49.4 |
|
>54 | 42 | 50.6 |
| Tumor size |
|
|
|
pT1 | 66 | 79.5 |
|
pT2 | 17 | 20.5 |
| Lymph node
status |
|
|
|
pN0 | 83 | 100 |
|
pN1 | 0 | 0 |
| Histological
gradea |
|
|
| SBR
I | 15 | 18.1 |
| SBR
II | 58 | 69.9 |
| SBR
III | 10 | 12.0 |
| Radiotherapy |
|
|
| No | 5 | 6.0 |
|
Yes | 78 | 94.0 |
| Adjuvant
chemotherapy |
|
|
| No | 52 | 62.7 |
|
Yes | 31 | 37.3 |
The Institutional Review Board of the Montpellier
Cancer Institute provided the ethical approval for the use of
patient samples for the present study (Reference no.
ICM-CORT2019-20). According to the French national ethics and legal
provisions, all patients were informed prior to surgery and
provided consent for the use their surgical specimens and the
associated clinicopathological data for the present study.
ISH
ISH analyses were performed using 5-µm-thick
sections from FFPE breast tumor tissue blocks and the
RNAscope® 2.5 HD detection kit (cat. no. 322350;
Advanced Cell Diagnostics, Inc.; Bio-Techne) according to the
manufacturer's instructions. Briefly, following an initial drying
step at 60°C for 1 h, slides were deparaffinized in xylene (2×10
min at room temperature) and absolute ethanol (2×2 min at room
temperature). To grant target RNA site accessibility, the slides
were dipped in boiling Target Retrieval Solution (cat. no. 322000;
Advanced Cell Diagnostics, Inc.; Bio-Techne) for 15 min, dried,
dehydrated in absolute ethanol, and then incubated with protease
solution (cat. no. 322331, RNAscope® Protease Plus;
Advanced Cell Diagnostics, Inc.; Bio-Techne) at 40°C for 30 min.
Hybridization with the specific mRNA probes was performed in a
humid chamber, inserted in a hybridization oven at 40°C for 2 h.
Signal amplification, based on branched DNA, was performed
according to the manufacturer's protocol (30, 15, 30 and 15 min at
40°C for Amp1, Amp2, Amp3 and Amp4 steps, respectively, followed by
2 steps of 30 and 15 min at room temperature for Amp5 and Amp6,
respectively), and signals were detected using the Fast Red
solution (cat. no. 322360; Advanced Cell Diagnostics, Inc.;
Bio-Techne). The slides were then counterstained for 2 min at room
temperature with hematoxylin (cat. no. K8008; Dako; Agilent
Technologies, Inc.), dehydrated and mounted with permanent mounting
medium (EcoMount; Biocare Medical LLC).
The double-Z probes that target human PLAU
(uPA) and SERPINE1 (PAI-1) were custom-designed by the
supplier (cat. nos. 575931 and 569281, respectively; Advanced Cell
Diagnostics, Inc.; Bio-Techne). A probe targeting the human
PolR2A housekeeping gene was used as positive control (cat.
no. 310451; Advanced Cell Diagnostics, Inc.; Bio-Techne).
Experiments were done in batches and the three probes were used in
parallel on three consecutive sections from the same block. A probe
targeting the bacterial gene dapB was used as a negative
control.
Following ISH, the sections were digitalized with a
NanoZoomer slide scanner system (Hamamatsu Photonics K.K.) with a
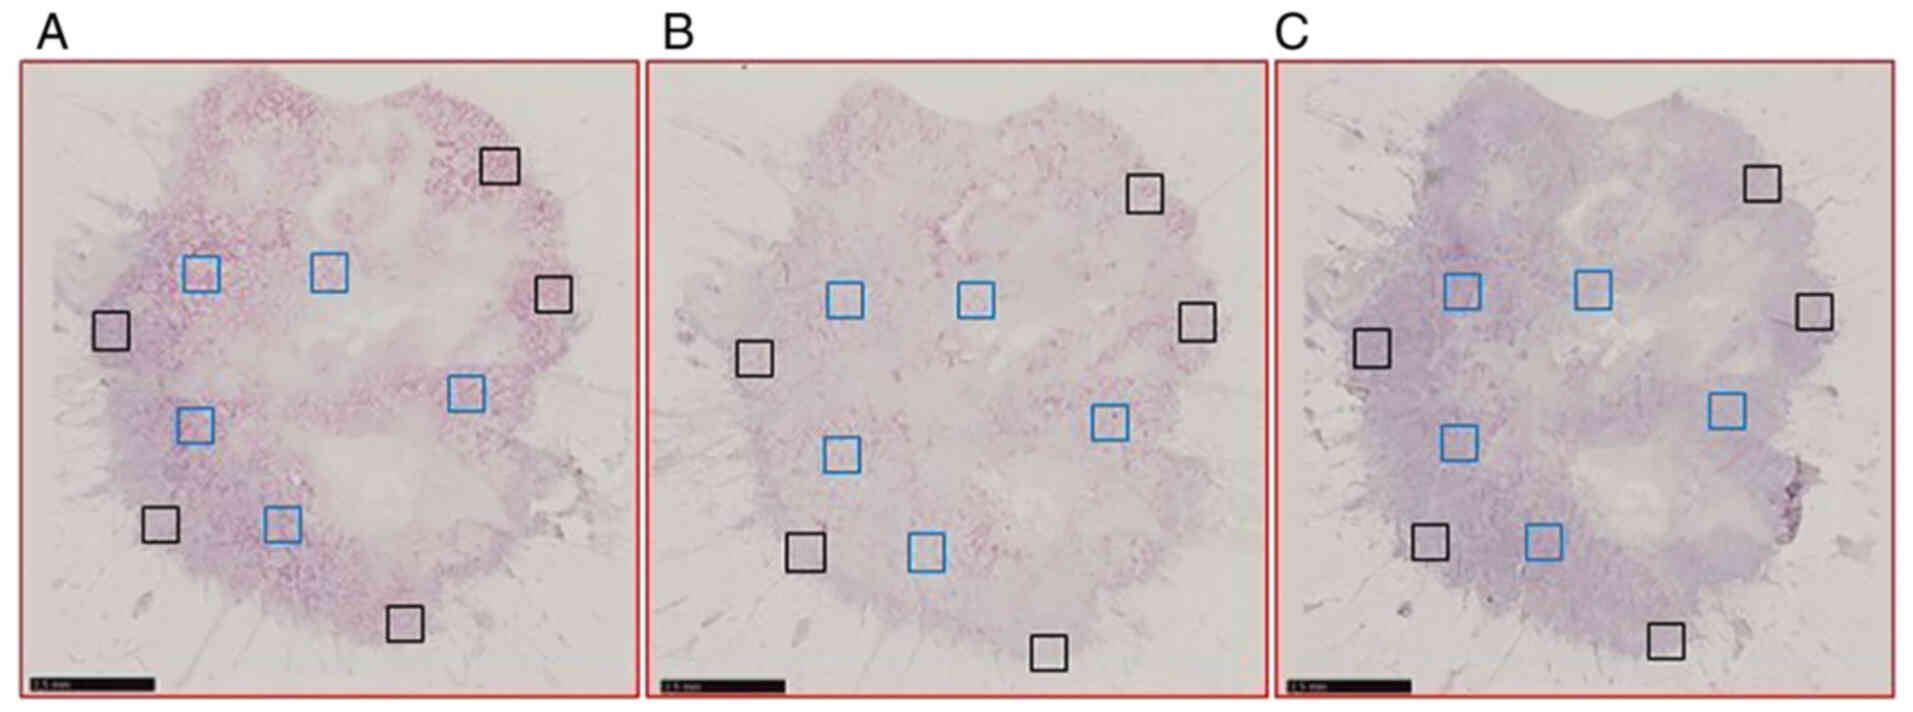
×40 objective. For each patient, five non-overlapping regions of
interest (ROI) of 0.5 mm2 in size were selected within
the tumor (IT) and at its periphery (PT), using NDP.view2 software
(Hamamatsu Photonics K.K.). The same ROIs were selected in the
three consecutive sections hybridized with the probes targeting
PLAU, SERPINE1 and PolR2A, respectively (Fig. 1).
Image analysis
ROIs were exported at the highest available
resolution using ImageJ 1.53c software (24) (National Institutes of Health)
macro-toolset NDPI Export Regions Tool (https://github.com/MontpellierRessourcesImagerie/imagej_macros_and_scripts/wiki/ndpi_export_regions_tool).
In the exported images, the ISH signal density was measured using
the MRI Fibrosis Tool (https://github.com/MontpellierRessourcesImagerie/imagej_macros_and_scripts/wiki/mri_fibrosis_tool),
which applies color-deconvolution to segment the signal. The
vectors for the color-deconvolution were calculated from manually
drawn ROIs using the ImageJ-plugin ‘Colour Deconvolution’ (25). The quantification was performed
twice, using different vectors each time. For one vector and a
specific probe, the values obtained for the five IT areas, the five
PT areas, and the 10 areas (5 IT + 5 PT) were added and expressed
as a percentage of the stained area/analyzed area. Data are
expressed as absolute levels (% of PLAU- or
SERPINE1-stained area/studied area) or as relative levels to
PolR2A mRNA expression (% of PLAU- or
SERPINE1-stained area/% of PolR2A-stained area).
Statistical analysis
The optimal sample size was calculated to be
adequate for the detection of statistical significance. According
to the primary objective, 83 samples were required (sample size
estimated with the ‘Large sample normal approximation’ section of
the nQuery software; Statsols), in order to detect any expected
concordance of 95% between methods with a two-sided 95% confidence
interval (CI) range from 0.903 to 0.997.
Categorical variables were described as the number
of observations (N) and frequency (%) of each modality. Continuous
variables are presented as the median, minimum and maximum values,
and compared using the Wilcoxon rank sum test. Correlations between
measurements were evaluated using Spearman's correlation
coefficient. The RNAscope® test performance was assessed
using Receiver Operating Characteristic (ROC) curve analysis. The
ROC curves, defined as the plot of the true positive rate
(=sensitivity) vs. false positive rate (=1-specificity) for all
possible thresholds, are represented. The area under the ROC curve
(AUC) and its 95% CI were calculated (non-parametric estimator).
The AUC is the most commonly used index to provide an estimate of
the predictive accuracy. Its value can vary from 0.5 (if the marker
is not informative), to 1 (if the marker is perfectly
discriminating). An optimal threshold was determined by maximizing
the Youden index, defined by J=sensitivity + specificity-1.
Sensitivity, specificity, positive predictive value and negative
predictive value were also calculated. Statistical analyses were
performed using STATA 16.0 software (StatCorp LP).
Results
RNAscope® technology
implementation in routine clinical practice
The RNAscope® technology was used on 83
breast tumor samples that had been surgically removed and were
FFPE-fixed 8 to 12 years prior to the ISH analysis. First, the
pre-treatment steps were optimized (15 min of target retrieval and
30 min of permeabilization with protease) using a single sample and
control probes, to obtain a high positive control signal with the
PolR2A probe, no background with the dapB probe, and
a tissue morphology compatible with morphological analysis. The
same conditions were then applied along with the PLAU (uPA),
SERPINE1 (PAI-1), and PolR2A probes, in order to
assess all selected breast tumor samples (n=83; n=249 slides).
Overall, at the end of the ISH protocol, tissue detachment was
observed in 11 slides. This issue was resolved by analyzing the
breast tumor samples for a second time by increasing the slide
drying time. The PolR2A probe yielded a punctuate signal, of
variable intensity, in all 83 samples analyzed, permitting the
validation of the mRNA quality in all samples. No signal was
detected using the PLAU probe, in one sample only. As the
SERPINE1 probe yielded a good signal in the same sample, the
absence of the PLAU signal suggested a technical issue, or
an expression level below the test sensitivity threshold. Since the
re-analysis of the same sample confirmed the absence of the
PLAU signal, this sample was excluded from the statistical
analyses. Taken together, the data suggested that the
RNAscope® technology may be a robust and reliable method
for ISH of FFPE specimens in clinical settings.
Since in situ techniques allow spatial and
morphological cell characterization, it was revealed that
PLAU and SERPINE1 were mainly expressed in the stroma
(Fig. 2A and B), whereas
PolR2A was present both in tumor and stromal cells, as was
expected (Fig. 2C).
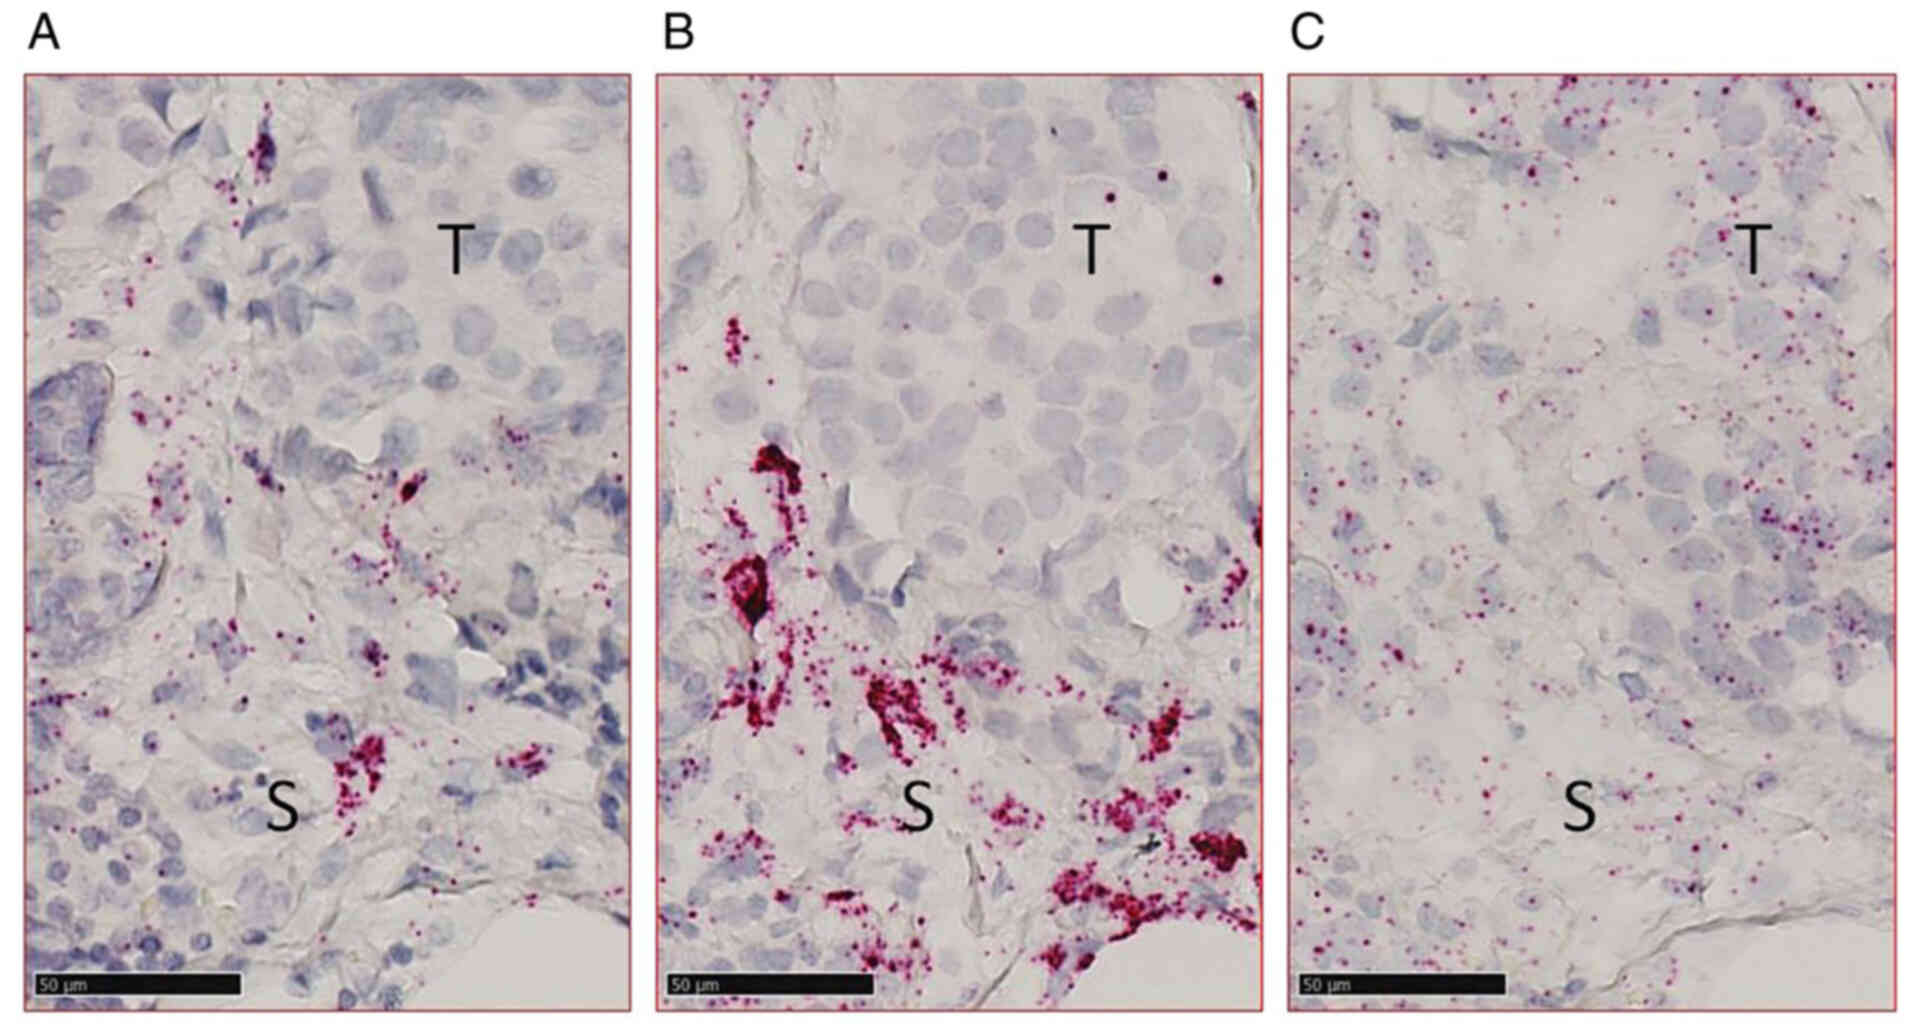 | Figure 2.Detection of (A) PLAU (uPA), (B)
SERPINE1 (PAI-1), and (C) PolR2A in a formalin-fixed
paraffin-embedded breast carcinoma sample using in situ
hybridization. Scale bar, 50 µm. T, tumor area; S, stromal area;
uPA, urokinase plasminogen activator; PAI-1, plasminogen activator
inhibitor type 1; PLAU, uPA gene; SERPINE1, PAI-1 gene; PolR2A, RNA
polymerase II subunit A gene. |
An ImageJ tool was then developed by one of the
authors (VB) to quantify the ISH signals in the five ROIs
delineated within the tumor (IT) and at its periphery (PT), and
also in both regions (IT + PT). To validate the quantification, the
analysis was performed twice, using independent vectors (vectors A
and B) and revealing a strong correlation (ρ=0.893 to 0.901, in
function of the mRNA and area; Table
II). In view of high correlation levels, the results of all
analyses were subsequently presented only for vector B.
| Table II.Correlations (Spearman's
coefficients) between independent analyses to quantify target gene
intensity (using ImageJ software). |
Table II.
Correlations (Spearman's
coefficients) between independent analyses to quantify target gene
intensity (using ImageJ software).
| Biomarker | IT (Vector B) | PT (Vector B) | IT + PT (Vector
B) |
|---|
| uPA |
|
|
|
| IT
(Vector A) | 0.893 | - | - |
| PT
(Vector A) | - | 0.897 | - |
| IT + PT
(Vector A) | - | - | 0.908 |
| PAI-1 |
|
|
|
| IT
(Vector A) | 0.895 | - | - |
| PT
(Vector A) | - | 0.893 | - |
| IT + PT
(Vector A) | - | - | 0.901 |
Strong correlations were also revealed between the
IT and PT signals (ρ=0.834 and 0.875 for PLAU and
SERPINE1, respectively; data not shown). Therefore, the
expression values obtained in the IT and PT zones were combined, in
order to obtain a single expression value for each target (IT +
PT).
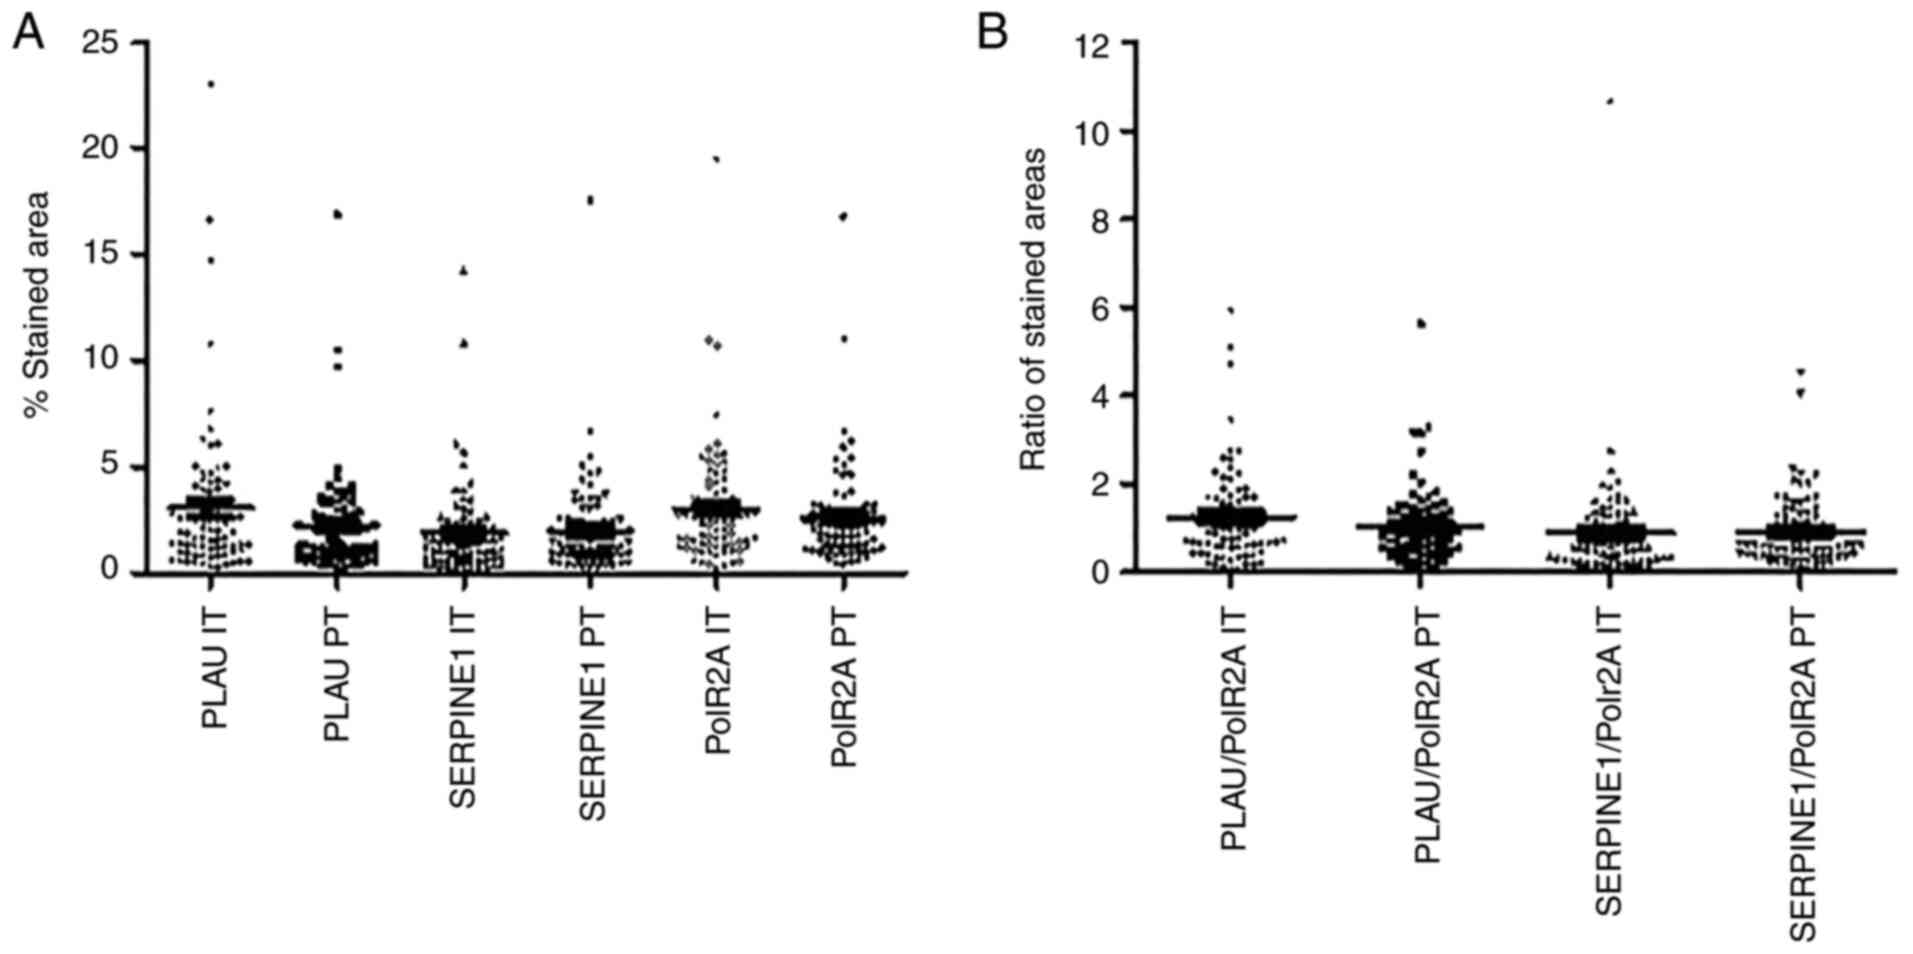
Evaluation of PLAU and SERPINE1 mRNA
expression levels in FFPE breast tumor samples
It was hypothesized that in FFPE samples analyzed
using the RNAscope® technology, each dot represented a
single RNA molecule, provided that the RNA target is intact and
properly unmasked to allow probe access. Unlike PolR2A,
which demonstrated a punctuate expression pattern (Fig. 2C), the signals corresponding to the
PLAU and SERPINE1 probes were clustered (Fig. 2A and B), precluding their
individual quantification. Therefore, by using an in-house ImageJ
tool, the percentage of the stained area relative to the surface
analyzed was quantified, for each target and each sample. In both
the IT and PT areas, PLAU and SERPINE1 mRNA
expression levels were determined between 1 and 7% of the analyzed
area, with only few specimens outside this range (Fig. 3A). Similar expression levels were
also observed for the housekeeping gene, PolR2A. As no
significant correlations were observed between the
PLAU/SERPINE1 and PolR2A expression levels, it was
assumed that the variations observed for PLAU and
SERPINE mRNA were not related to mRNA degradation (data not
shown).
PolR2A is commonly used as a reference gene
for accurate gene expression normalization, since its mRNA
expression is considered to be stable among samples (26,27).
Therefore, it was hypothesized that the expression variations
observed amongst the samples were mostly related to variations in
RNA integrity. Considering RNA degradation in FFPE samples,
PLAU and SERPINE1 expression was normalized by using
the PolR2A expression level for the same sample. Following
this normalization, the PLAU expression level ranged between
0.06 and 5.95 in the IT areas, and between 0.05 and 5.61 in the PT
areas (Fig. 3B). The normalized
SERPINE1 expression levels ranged between 0.01 and 10.67 in
the IT areas, and 0.06 and 4.53 in the PT zones (Fig. 3B).
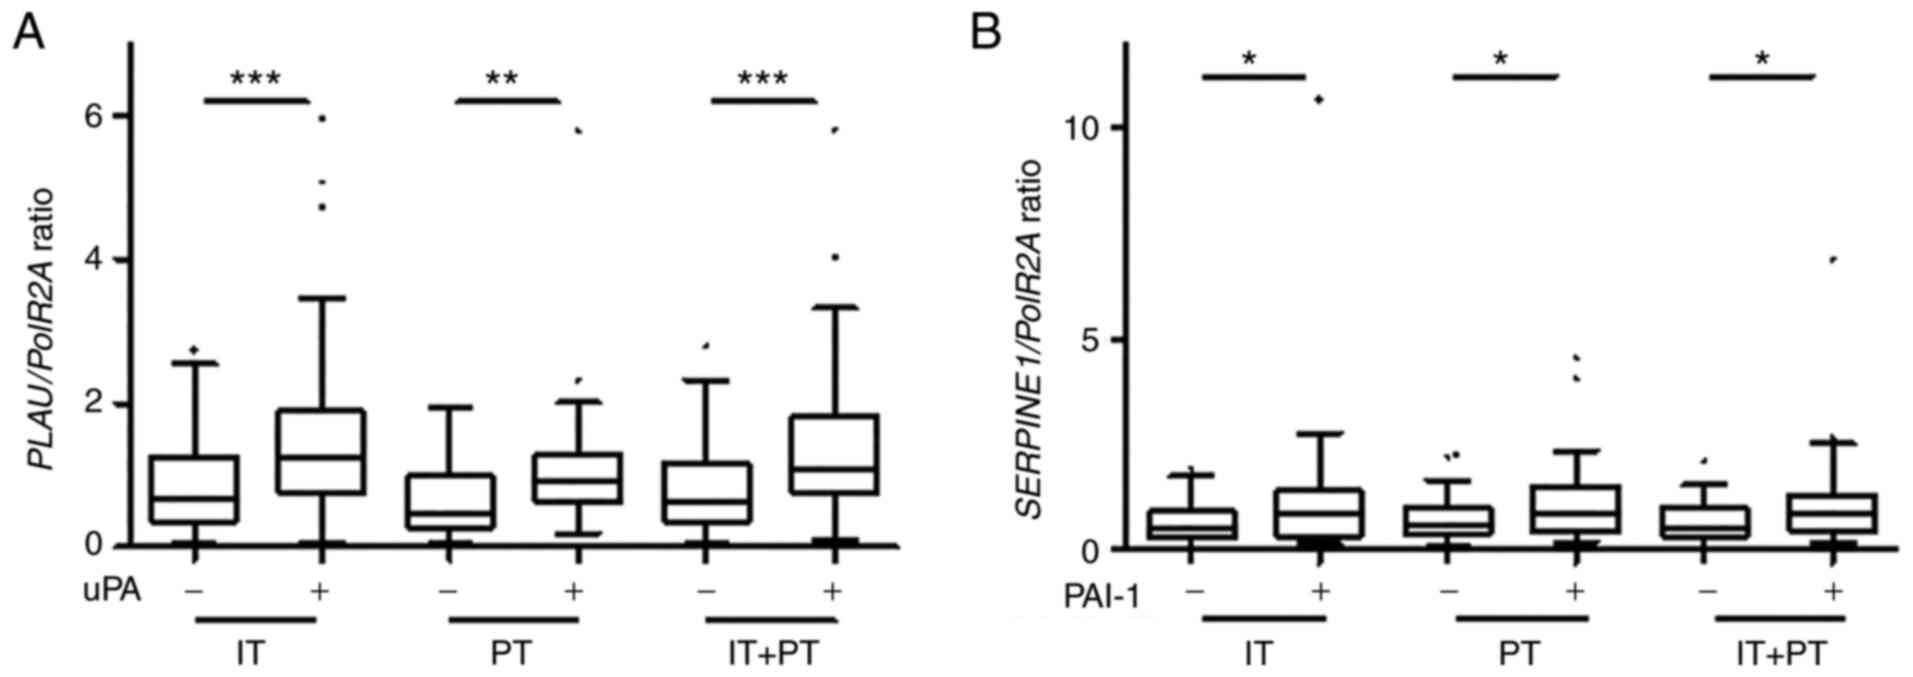
Comparison of the results obtained
from RNAscope® and the ELISA reference test
Breast cancer samples of 83 patients were selected
based on their u-PA and PAI-1 expression levels (obtained using the
ELISA reference test) for the present study, and were classified
into four balanced populations according to the established
clinical thresholds (3 and 14 ng/mg for uPA and PAI-1,
respectively; Table SI).
The normalized PLAU expression level
(RNAscope®) was significantly higher in all analyzed
areas in uPA-positive samples as compared to the uPA-negative
samples (using ELISA), (according to ELISA) (P<0.001, P=0.002
and P<0.001 for the IT, PT and IT + PT areas, respectively;
Fig. 4A). Similar results were
also observed, concerning the normalized SERPINE1 expression
levels, although the differences were less significant between the
PAI-1-negative and -positive specimens (P=0.032, P=0.039 and
P=0.035 for the IT, PT and IT + PT areas, respectively; Fig. 4B). Moderate, yet significant
correlations were also found between the normalized PLAU and
SERPINE1 expression levels (ISH) and the uPA and PAI-1
concentrations (ELISA) using continuous variables (Fig. S1).
To better evaluate the correlations between the ISH
and ELISA results, ROC curves and the Youden index were applied, in
order to define the optimal thresholds for the discrimination of
uPA- positive (or PAI-1- positive) from uPA- negative (or PAI-1-
negative) samples. As regards uPA, the AUC values were 0.716 (95%
CI, 0.604-0.827), 0.744 (95% CI, 0.635-0.852) and 0.717 (95% CI,
0.606-0.829) for the IT, PT and IT + PT areas, respectively,
demonstrating significant concordance between the techniques
(Fig. S2A, C and E). According to
the optimal Youden indexes, the ISH test was considered positive
when the normalized PLAU expression was higher than 0.6537,
0.9142 and 0.6088 in the IT, PT and IT + PT areas, respectively. By
using the aforementioned cut-off values, a significant association
between the ISH and ELISA methods (P<0.001, P=0.042 and
P<0.001 for the IT, PT and IT + PT areas, respectively) was
observed; however, 33% of the discordant results in IT and IT + PT,
and 39% in the PT areas were also found. The discordant cases were
distributed throughout the dynamic range of uPA expression
determined using ELISA and not only around the clinical established
cut-off value. The sensitivity, specificity, positive and negative
predictive values obtained from the optimal Youden index are
presented in Table III.
| Table III.Sensitivity, specificity, agreement
rate, positive and negative predictive values of uPA expression
analysis using in situ hybridization. |
Table III.
Sensitivity, specificity, agreement
rate, positive and negative predictive values of uPA expression
analysis using in situ hybridization.
| Area/zone
analyzed | Optimal threshold
using the Youden index | Agreement rate | Sensitivity | Specificity | Positive predictive
value | Positive predictive
value |
|---|
| IT | 0.6537 | 0.68 | 0.88 | 0.49 | 0.63 | 0.80 |
| PT | 0.9142 | 0.73 | 0.68 | 0.78 | 0.76 | 0.71 |
| IT + PT | 0.6088 | 0.68 | 0.90 | 0.46 | 0.63 | 0.83 |
As regards PAI-1, the AUC values were <0.7,
regardless of the analyzed areas (Fig. S2B, D and F). Therefore, the
optimal thresholds were not determined and the concordance between
analytical methods was not assessed.
The same statistical analysis using the values
obtained with vector A were also performed, and similar results
concerning the concordance between the results obtained with
RNAscope® and the reference method were obtained (data
not shown).
Discussion
Despite the development of molecular signatures, the
pathological examination remains the cornerstone of breast cancer
clinical management. Currently, the analysis of three biomarkers is
mandatory (estrogen receptor, progesterone receptor and HER2), and
the determination of the proliferative marker, Ki-67, is also
recommended (8). In early
ER+/HER2− pN0 early-stage breast tumors, high
uPA and PAI-1 levels have been found to be associated with a poor
patient outcome (level of evidence: 1A) (2–4).
However, their use in clinical management remains limited, mainly
due to the lack of reliable alternative testing methods to the
validated ELISA. A method that would permit the analysis of these
established prognostic markers in the FFPE tissue samples routinely
used by pathologists may expand the clinical use of these two
biomarkers.
Over the past years, a number of studies have
focused on the analysis of possible correlations between the uPA
and PAI-1 mRNA and protein levels (15–18,28,29).
Several studies have reported significant correlations for both
biomarkers (17,18) or only for PAI-1 (16), whereas other failed to identify any
correlation for either (28).
Witzel et al (29) revealed
discrepant prognostic values of uPA and PAI-1 mRNA levels (using
Affymetrix microarray) and protein levels, in a cohort of 200
patients with breast cancer without systemic treatment. These
conflicting results, combined with the fact that they were obtained
using frozen material, have limited the dissemination of these
alternative methods in clinical practice.
In the present study, PLAU and
SERPINE1 mRNA expression in FFPE sections was analyzed using
ISH, which could be easily implemented in routine diagnostic
histopathology settings. This assay may detect RNA molecules down
to single-copy sensitivity, due to the use of a branched DNA
technology for signal amplification. For each biomarker, 20 probe
pairs were designed, each spanning less than 50 nucleotides along
the target mRNA. This design increases the sensitivity and
specificity of mRNA detection and allows their use in samples with
partially degraded RNA, which is one of the characteristics of FFPE
samples (20). This technology has
been previously evaluated in routine settings for PD-L1
quantification in non-small cell lung cancer, head and neck
squamous cell carcinoma, and urothelial carcinoma tissue specimens
(30), and for human
papillomavirus testing in oropharyngeal squamous cell carcinoma
(31). In the 83 FFPE breast
cancer-sample cohort, 96.2% of the samples were successfully tested
in a single run apart from a limited number of failures related to
tissue detachment during the retrieval phase. This issue was solved
by increasing the drying time before the retrieval step. Finally,
among 249 sections (83 samples × 3 probes), only one sample was
excluded due to lack of PLAU signal. Altogether, these
results suggested that if concordant with protein levels,
PLAU and SERPINE1 mRNA detection in FFPE tumor
samples is feasible and could be translated to clinical
settings.
Similar to conventional immunohistochemistry assay,
the quantification of the ISH signal is a crucial step for
biomarker analysis. In routine clinical practice, even though
tremendous efforts have been made to implement unbiased
quantitative methods using image analysis, biomarkers are often
assessed by pathologists by visual evaluation (percentage of
immunoreactive cells and/or intensity of staining). By using the
RNAscope® technology, each individual dot should
represent a single RNA molecule, provided that the RNA target is
intact and properly unmasked. Thus, counting the dots in a given
area is the most reliable way to assess the number of mRNA copies.
However, in the majority of the samples in the present study,
clustered dots were observed, located within the same area,
preventing the individual counting of the dots. As an alternative,
a macro-toolset was used, in order to analyze the surface occupied
by the dots. Since large ranges of PolR2A expression without
significant correlation with PLAU and SERPINE1
expression levels were observed, the results were normalized to
PolR2A expression level, to eliminate the bias due to mRNA
degradation variations, by analogy with what is done for RT-PCR
data and by assuming that PolR2A expression is constant in a
sample (26,27). Moreover, with the aim of using this
test routinely, a reference gene for normalization allows the
exploitation of clinical samples with variable mRNA quality,
inherent to the pre-analytical conditions. Following normalization,
significantly higher PLAU and SERPINE1 levels in uPA-
and PAI-1-positive (i.e., above the established clinical cut-off
values) clinical samples were detected. Although significantly
correlated, the PLAU expression status by ISH analysis
(i.e., positive vs negative according to the optimal thresholds
determined using the Youden index) was concordant with uPA ELISA
status in only 68–73% of cases, according to the studied area (IT,
PT and IT + PT). This was below the threshold of 95% which was set
for clinical significance. Moreover, no discriminant cutoff for
PAI-1 quantification was detected. It was hypothesized that the
lack of correlation is mainly related to the fact that mRNA level
incompletely predicts protein expression in breast tumors (32), particularly for uPA/PAI-1 (16,18,28).
In conclusion, while technically feasible in
clinical practice and despite the possibility to spatially analyze
RNA transcripts in FFPE samples in a routine setting, the
RNAscope® technology to quantify PLAU and
SERPINE1 mRNA levels cannot be used as a substitute to uPA
and PAI-1 protein quantification using ELISA.
Supplementary Material
Supporting Data
Supporting Data
Acknowledgements
The majority of the RNAscope® reagents
used in the present study were kindly provided by Advanced Cell
Diagnostics, Inc.
Funding
The present study was supported in part by La Ligue contre le
Cancer-Comité de l'Hérault (February 4, 2019). The imaging facility
MRI, member of the national infrastructure France-BioImaging
infrastructure was supported by the French National Research Agency
(ANR-10-INBS-04, ‘Investments for the future’).
Availability of data and materials
The datasets used and/or analyzed during the current
study are available from the corresponding author on reasonable
request.
Authors' contributions
FBM planned the present study, designed and
conducted the experiments, analyzed the data, and drafted and
edited the manuscript. CM participated in the study conception and
design, performed the statistical analysis and edited the
manuscript. VB developed the new ImageJ macro toolset and provided
advice on how to complete the image analysis, and also edited the
manuscript. EC participated in the study conception and design and
edited the manuscript. WJ participated in the study conception and
design, provided study patients and material, and helped to draft
the manuscript. FBM and CM confirm the authenticity of all the raw
data. All authors have read and approved the final version of the
manuscript.
Ethics approval and consent to
participate
The present study was conducted according to the
guidelines of the Declaration of Helsinki, and approved by the
Institutional Review Board of Institut du Cancer de Montpellier,
France (approval no. ICM-CORT2019-20). All patients were informed
before surgery and provided consent for the use their surgical
specimens and the associated clinicopathological data for the
present research.
Patient consent for publication
Not applicable.
Competing interests
The authors declare that they have no competing
interests.
References
|
1
|
Mahmood N, Mihalcioiu C and Rabbani SA:
Multifaceted role of the urokinase-type plasminogen activator (uPA)
and its receptor (uPAR): Diagnostic, prognostic, and therapeutic
applications. Front Oncol. 8:242018. View Article : Google Scholar : PubMed/NCBI
|
|
2
|
Ettl J, Klein E, Hapfelmeier A, Grosse
Lackmann K, Paepke S, Petry C, Specht K, Wolff L, Höfler H and
Kiechle M: Decision impact and feasibility of different
ASCO-recommended biomarkers in early breast cancer: Prospective
comparison of molecular marker EndoPredict and protein marker
uPA/PAI-1. PLoS One. 12:e01839172017. View Article : Google Scholar : PubMed/NCBI
|
|
3
|
Duffy MJ, McGowan PM, Harbeck N, Thomssen
C and Schmitt M: uPA and PAI-1 as biomarkers in breast cancer:
Validated for clinical use in level-of-evidence-1 studies. Breast
Cancer Res BCR. 16:4282014. View Article : Google Scholar : PubMed/NCBI
|
|
4
|
Luporsi É, André F, Bellocq J-P, Caron Y,
Fumoleau P, Gompel A, Martin P-M, Roché H, Salmon R, Sigal-Zafrani
B, et al: Rapport 2009 sur l'état des connaissances relatives aux
biomarqueurs tissulaires uPA/PAI-1, Oncotype DXTM et
MammaPrint® dans la prise en charge du cancer du sein.
Oncologie. 12:158–163. 2010. View Article : Google Scholar
|
|
5
|
Paik S, Shak S, Tang G, Kim C, Baker J,
Cronin M, Baehner FL, Walker MG, Watson D, Park T, et al: A
multigene assay to predict recurrence of tamoxifen-treated,
node-negative breast cancer. N Engl J Med. 351:2817–2826. 2004.
View Article : Google Scholar : PubMed/NCBI
|
|
6
|
Filipits M, Rudas M, Jakesz R, Dubsky P,
Fitzal F, Singer CF, Dietze O, Greil R, Jelen A, Sevelda P, et al:
A new molecular predictor of distant recurrence in ER-positive,
HER2-negative breast cancer adds independent information to
conventional clinical risk factors. Clin Cancer Res. 17:6012–6020.
2011. View Article : Google Scholar : PubMed/NCBI
|
|
7
|
Parker JS, Mullins M, Cheang MC, Leung S,
Voduc D, Vickery T, Davies S, Fauron C, He X, Hu Z, et al:
Supervised risk predictor of breast cancer based on intrinsic
subtypes. J Clin Oncol. 27:1160–1167. 2009. View Article : Google Scholar : PubMed/NCBI
|
|
8
|
Ahn SK and Jung SY: Current biomarkers for
precision medicine in breast cancer. Adv Exp Med Biol.
1187:363–379. 2021. View Article : Google Scholar : PubMed/NCBI
|
|
9
|
Vénat-Bouvet L, Fermeaux V, Leobon S,
Saidi N, Monteil J, Mollard J, Aubard Y, Jammet I and
Tubiana-Mathieu N: Adjuvant chemotherapy in node-negative breast
cancer: UPA/PAI-1 determinations for 163 cases. Anticancer Res.
34:1213–1217. 2014.PubMed/NCBI
|
|
10
|
Costantini V, Sidoni A, Deveglia R,
Cazzato OA, Bellezza G, Ferri I, Bucciarelli E and Nenci GG:
Combined overexpression of urokinase, urokinase receptor, and
plasminogen activator inhibitor-1 is associated with breast cancer
progression: An immunohistochemical comparison of normal, benign,
and malignant breast tissues. Cancer. 77:1079–1088. 1996.
View Article : Google Scholar : PubMed/NCBI
|
|
11
|
Göhring UJ, Scharl A, Thelen U, Ahr A and
Crombach G: Comparative prognostic value of Cathepsin D and
urokinase plasminogen activator, detected by immunohistochemistry,
in primary breast carcinoma. Anticancer Res. 16:1011–1018.
1996.PubMed/NCBI
|
|
12
|
Lang DS, Heilenkötter U, Schumm W, Behrens
O, Simon R, Vollmer E and Goldmann T: Optimized
immunohistochemistry in combination with image analysis: A reliable
alternative to quantitative ELISA determination of uPA and PAI-1
for routine risk group discrimination in breast cancer. Breast.
22:736–743. 2013. View Article : Google Scholar : PubMed/NCBI
|
|
13
|
Singer CF, Filipits M, Jahn SW, Abete L,
Jakesz R, Greil R, Bauernhofer T, Kwasny W, Seifert M, Fitzal F, et
al: Stromal coexpression of uPA/PAI-1 protein predicts poor disease
outcome in endocrine-treated postmenopausal patients with
receptor-positive early breast cancer. Breast. 46:101–107. 2019.
View Article : Google Scholar : PubMed/NCBI
|
|
14
|
Han B, Nakamura M, Mori I, Nakamura Y and
Kakudo K: Urokinase-type plasminogen activator system and breast
cancer (Review). Oncol Rep. 14:105–112. 2005.PubMed/NCBI
|
|
15
|
Lamy PJ, Verjat T, Servanton AC, Paye M,
Leissner P and Mougin B: Urokinase-type plasminogen activator and
plasminogen activator inhibitor type-1 mRNA assessment in breast
cancer by means of NASBA: correlation with protein expression. Am J
Clin Pathol. 128:404–413. 2007. View Article : Google Scholar : PubMed/NCBI
|
|
16
|
Spyratos F, Bouchet C, Tozlu S, Labroquere
M, Vignaud S, Becette V, Lidereau R and Bieche I: Prognostic value
of uPA, PAI-1 and PAI-2 mRNA expression in primary breast cancer.
Anticancer Res. 22:2997–3003. 2002.PubMed/NCBI
|
|
17
|
Castelló R, Estellés A, Vázquez C, Falcó
C, España F, Almenar SM, Fuster C and Aznar J: Quantitative
real-time reverse transcription-PCR assay for urokinase plasminogen
activator, plasminogen activator inhibitor type 1, and tissue
metalloproteinase inhibitor type 1 gene expressions in primary
breast cancer. Clin Chem. 48:1288–1295. 2002. View Article : Google Scholar : PubMed/NCBI
|
|
18
|
Castelló R, Landete JM, España F, Vázquez
C, Fuster C, Almenar SM, Ramón LA, Radtke KP and Estellés A:
Expression of plasminogen activator inhibitors type 1 and type 3
and urokinase plasminogen activator protein and mRNA in breast
cancer. Thromb Res. 120:753–762. 2007. View Article : Google Scholar : PubMed/NCBI
|
|
19
|
Evers DL, Fowler CB, Cunningham BR, Mason
JT and O'Leary TJ: The effect of formaldehyde fixation on RNA. J
Mol Diagn. 13:282–288. 2011. View Article : Google Scholar : PubMed/NCBI
|
|
20
|
Wang F, Flanagan J, Su N, Wang LC, Bui S,
Nielson A, Wu X, Vo HT, Ma XJ and Luo Y: RNAscope: A novel in
situ RNA analysis platform for formalin-fixed,
paraffin-embedded tissues. J Mol Diagn. 14:22–29. 2012. View Article : Google Scholar : PubMed/NCBI
|
|
21
|
Viala M, Alexandre M, Thezenas S, Lamy PJ,
Maran-Gonzalez A, Gutowski M, Colombo PE, Romieu G, Jacot W and
Guiu S: Prognostic impact of the inclusion of uPA/PAI-1 for
adjuvant treatment decision-making in ER+/Her2- pN0 early breast
cancers. Breast Cancer Res Treat. 165:611–621. 2017. View Article : Google Scholar : PubMed/NCBI
|
|
22
|
Harbeck N, Thomssen C, Berger U, Ulm K,
Kates RE, Höfler H, Jänicke F, Graeff H and Schmitt M: Invasion
marker PAI-1 remains a strong prognostic factor after long-term
follow-up both for primary breast cancer and following first
relapse. Breast Cancer Res Treat. 54:147–157. 1999. View Article : Google Scholar : PubMed/NCBI
|
|
23
|
Jänicke F, Prechtl A, Thomssen C, Harbeck
N, Meisner C, Untch M, Sweep CG, Selbmann HK, Graeff H and Schmitt
M; German N0 Study Group, : Randomized adjuvant chemotherapy trial
in high-risk, lymph node-negative breast cancer patients identified
by urokinase-type plasminogen activator and plasminogen activator
inhibitor type 1. J Natl Cancer Inst. 93:913–920. 2001. View Article : Google Scholar : PubMed/NCBI
|
|
24
|
Schneider CA, Rasband WS and Eliceiri KW:
NIH image to ImageJ: 25 years of image analysis. Nat Methods.
9:671–675. 2012. View Article : Google Scholar : PubMed/NCBI
|
|
25
|
Landini G, Martinelli G and Piccinini F:
Colour deconvolution: Stain unmixing in histological imaging.
Bioinformatics. 37:1485–1487. 2021. View Article : Google Scholar : PubMed/NCBI
|
|
26
|
Radonić A, Thulke S, Mackay IM, Landt O,
Siegert W and Nitsche A: Guideline to reference gene selection for
quantitative real-time PCR. Biochem Biophys Res Commun.
313:856–862. 2004. View Article : Google Scholar : PubMed/NCBI
|
|
27
|
Saviozzi S, Cordero F, Lo Iacono M,
Novello S, Scagliotti GV and Calogero RA: Selection of suitable
reference genes for accurate normalization of gene expression
profile studies in non-small cell lung cancer. BMC Cancer.
6:2002006. View Article : Google Scholar : PubMed/NCBI
|
|
28
|
Biermann JC, Holzscheiter L, Kotzsch M,
Luther T, Kiechle-Bahat M, Sweep FC, Span PN, Schmitt M and
Magdolen V: Quantitative RT-PCR assays for the determination of
urokinase-type plasminogen activator and plasminogen activator
inhibitor type 1 mRNA in primary tumor tissue of breast cancer
patients: Comparison to antigen quantification by ELISA. Int J Mol
Med. 21:251–259. 2008.PubMed/NCBI
|
|
29
|
Witzel I, Milde-Langosch K, Schmidt M,
Karn T, Becker S, Wirtz R, Rody A, Laakmann E, Schütze D, Jänicke F
and Müller V: Role of urokinase plasminogen activator and
plasminogen activator inhibitor mRNA expression as prognostic
factors in molecular subtypes of breast cancer. OncoTargets Ther.
7:2205–2213. 2014. View Article : Google Scholar : PubMed/NCBI
|
|
30
|
Duncan DJ, Scott M, Scorer P and Barker C:
Assessment of PD-L1 mRNA and protein expression in non-small cell
lung cancer, head and neck squamous cell carcinoma and urothelial
carcinoma tissue specimens using RNAScope and immunohistochemistry.
PLoS One. 14:e02153932019. View Article : Google Scholar : PubMed/NCBI
|
|
31
|
Henley-Smith R, Santambrogio A, Andoniadou
CL, Odell E and Thavaraj S: RNA in situ hybridization for
human papillomavirus testing in oropharyngeal squamous cell
carcinoma on a routine clinical diagnostic platform. J Oral Pathol
Med. 50:68–75. 2021. View Article : Google Scholar : PubMed/NCBI
|
|
32
|
Tang W, Zhou M, Dorsey TH, Prieto DA, Wang
XW, Ruppin E, Veenstra TD and Ambs S: Integrated
proteotranscriptomics of breast cancer reveals globally increased
protein-mRNA concordance associated with subtypes and survival.
Genome Med. 10:942018. View Article : Google Scholar : PubMed/NCBI
|
|
33
|
Elston CW and Ellis IO: Pathological
prognostic factors in breast cancer. I. The value of histological
grade in breast cancer: Experience from a large study with
long-term follow-up. Histopathology. 19:403–410. 1991. View Article : Google Scholar : PubMed/NCBI
|