Introduction
Saliva is crucial for maintaining normal oral
function, from lubricating food to removing food residues and
maintaining the oral microbiome homeostasis (1). Three pairs of major glands, the
submandibular gland (SMG), sublingual gland (SLG) and parotid
gland, as well as >1,000 minor glands, comprise the majority of
the mammalian salivary system. In humans and mice, these major
glands are in similar positions and secrete >90% of the total
salivary content in the oral cavity (2).
The developmental stages of the SMG have attracted
the attention of numerous researchers. This is due to the fact that
SMG morphogenesis in mice exhibits a distinct 'bunch of grapes'
appearance, which has been recognized as a classical model for
studying the branching of organs (3,4).
In the developmental stages of the SMG, the processes of gland
initiation and branching morphogenesis are similar in both mice and
humans. Unlike humans, the SMG in mice has an additional ductal
network that joins intercalated and striated ducts, which serves as
the primary source of growth-stimulating molecules, such as the
epidermal growth factor and nerve growth factor (5,6).
The similarities in salivary gland development between mice and
humans suggest that the salivary gland research in mice can lay the
foundation for its counterpart in humans, but the differences pose
certain limitations. The development of the SMG is initiated in the
thickened areas within the oral epithelial at embryonic day (E)11.5
in mice (the pre-bud stage). The SMG then gives rise to the initial
bud on E12, which subsequently gives rise to a new bud, leading to
extensive branching into the surrounding mandibular mesenchyme
during cytodifferentiation, eventually forming the duct lumen on
E15 and mature acini on E18 (3,7).
In recent decades, key genes and their related signals regulating
branch morphogenesis have been identified, including the
sex-determining region Y (Sox2) and Wnt/β-catenin (8,9).
However, accurate and complete gene regulatory network details
regarding salivary gland development need to be elucidated using
superior reference genes as controls for normalization using
reverse transcription-quantitative PCR (RT-qPCR) analysis with
SYBR-Green.
The salivary glands are affected by salivary gland
tumors, Sjögren's syndrome, duct blockage, or salivary stones,
which can lead to long-lasting oral dysfunction in the form of
xerostomia, dysphagia, or oral infections, which can markedly
reduce the quality of life of patients (10,11). Artificial saliva, oral
moisturizers and salivation stimulators are some of the current
treatments for salivary dysfunction; however, these measures only
alleviate the clinical symptoms and fail to fundamentally repair
the damaged tissues of the gland and restore its function (11). Therefore, studies examining novel
therapeutic approaches that aim to regenerate the salivary glands
and maintain normal salivary secretion are essential for affected
patients. Currently, there are three main strategies for restoring
salivary gland function: i) The insertion of a therapeutic gene
into ductal cells or residual salivary gland acinar cells by
retrograde injection of lentivirus as a vector (12); ii) the activation of stem cell
proliferation or differentiation in the gland (13); and iii) the elucidation of
signaling pathways associated with salivary gland regeneration
(12). Among these three
approaches, gene therapy allows for the identification of key genes
responsible for regulating the regeneration and repair of duct
calculus-induced salivary gland fibrosis (14). The silencing of transforming
growth factor 1 (Tgfb1) or the activation of sonic hedgehog
(Shh) might restore salivary function (15,16). The ligation/de-ligation of
excretory ducts in SMG has previously been verified as an ideal
mouse model to study salivary gland injury and functional
regeneration (11). In this
process, acinar epithelial cells undergo atrophy, apoptosis and
subsequently, regeneration from the differentiation of proliferated
duct cells and stem/progenitor cells.
The selection of reference genes is dependent on
particular physiopathological processes and various experimental
conditions (17). The common
reference genes in the development and regeneration of the salivary
gland include β-actin (Actb) and glyceraldehyde-3-phosphate
dehydrogenase (Gapdh) (18-20). β-actin is a core components of the
cytoskeleton, and its expression has been validated in
differentiation and cell migration (21-24). Gapdh is used as one of the
reference genes due to its role in basic metabolic processes in
several organisms. However, several studies have found that the
expression of Gapdh was not always constant and affected by
stress response and growth (25-28). Therefore, it is worth seeking
reliable reference genes to explore gene regulatory networks during
the SMG development and regeneration process.
The present study screened and evaluated the
expression stability of 12 candidate reference genes (Actb,
Actg1, Ubc, Uba1, Uba52, Ube2c, Tuba1a, Tuba1b, Tubb5, H2afy,
H2afx and Gapdh) in the SMG during the developmental and
regenerative states using transcriptome sequencing (RNA-seq),
RT-qPCR (SYBR-Green) and western blot analysis. The reliability of
identified reference genes was further validated by analyzing the
expression pattern of recombinant aquaporin 5 (AQP5) and
keratin 19 (KRT19) genes during the SMG developmental stage,
using stable and unstable genes for normalization. The findings
presented herein may promote further molecular biological research
into the development and functional regeneration of the SMG.
Materials and methods
Experimental animals
All animal experiments were approved by the Ethics
Committee of Chongqing Medical University College and Use Committee
(approval no. 2021062). The Guidelines for the Ethical Review of
Laboratory Animal Welfare (GB/T35892-2018, China) were applied in
the experiments. The study was conducted according to the
guidelines of ARRIVE and AVMA euthanasia 2020, and followed the
'3R' principles for the treatment of experimental animals:
Replacement, reduction and refinement. In the present study,
C57BL/6N mice were obtained from the Laboratory Animal Center of
Chongqing Medical University. The plug day discovery is designated
as gestation initiation (E0.5). All the mice were housed under
environmentally controlled conditions with a room temperature
(22±1°C) and humidity (50-55%), and a 12-h light-dark cycle, with
free access to water and standard food.
To comprehensively monitor the expression stability
of reference genes throughout the SMG developmental period,
C57BL/6N mice from the embryo (E14.5, E15.5, E16.5, E17.5 and
E18.5) to the post-natal stage [post-natal day (P)0, P7, P14, P28,
P56, P84 and P112] were used in the experiments. There were 16
C57BL/6N fetal mice at E14.5 and E15.5, 8 C57BL/6N fetal mice at
E16.5 to E18.5, 3 C57BL/6N mice at P0 to P14, and 6 C57BL/6N mice
at P28 to P112, half male and female; it should be noted that at
the embryo stage and post-natal stage (P0, P7 and P14), the mice
are too small to distinguish the sex.
In order to screen expression stability of reference
genes in the SMG functional regenerative states, 45 C57BL/6N female
mice (8 weeks old, weighing 20 g) were and divided into the 5-day
ligation group, 7-day ligation group, 7-day de-ligation group,
14-day de-ligation group and 28-day de-ligation group, for the
unilateral ligation of the SMG main duct surgery (n=9/group). The
contralateral glands were not duct-ligated and were defined as the
sham operation group.
Duct ligation/de-ligation
The unilateral ligation of the SMG main duct was
performed as previously described (11). Age-matched 8-week-old C57BL/6N
female mice were anesthetized using isoflurane (2-3% for induction
and 1.5-2% for maintenance), followed by an incision of ~20 mm in
length in the skin of the neck. The left SMG was exposed by a blunt
dissection of the skin at the midline of the neck, and the main
duct of the SMG was isolated from the surrounding blood vessels and
nerves. Surgical sutures were applied for duct ligation and
incision closure, and the mice were allowed to recover. After 7, 14
and 28 days of obstruction, the mice were subjected to SMG
de-ligation.
Sample collection
Pregnant C57BL/6N female mice were anesthetized
using isoflurane and sacrificed using CO2 with a 30-70%
container volume/min at E14.5, E15.5, E16.5, E17.5 and E18.5.
Embryos were washed with cold PBS to remove blood. SMG tissue was
isolated with sterile fine forceps under a stereo dissecting
microscope (Nikon SMZ645; Nikon Corporation). Similarly, post-natal
glands of C57BL/6N mice, female and male, were harvested at P0, P7,
P14, P28, P56, P84 and P112 (the mice at P0, P7 and P14 mice were
too small to distinguish the sex). The SMG tissue samples from the
physiological state were then collected and processed for RT-qPCR
with SYBR-Green and western blot analysis. Furthermore, the glands
at 5-day ligation, 7-day ligation, 7-day de-ligation, 14-day
de-ligation, 28-day de-ligation and the contralateral control
samples were excised under terminal anesthesia using isoflurane and
sacrificed using CO2 with a 30-70% container volume/min
and processed for RT-qPCR, western blot analysis and histochemical
staining analyses.
Histochemical staining
SMG tissues (5-day ligation, 7-day ligation, 7-day
de-ligation, 14-day de-ligation, 28-day deligation and
contralateral controls) were extracted and fixed in 4% (v/v)
paraformaldehyde solution at 4°C for 24 h, dehydrated in a series
of alcohols and embedded in paraffin; 5-µm-thick tissue
sections were cut using a paraffin microtome (Leica Microsystems
GmbH). The tissue morphology was observed using hematoxylin and
eosin (H&E) staining and Alcian blue (AB) and periodic
acid-Schiff staining (PAS).
H&E staining was performed at room temperature
(23-25°C) as follows: Briefly, the sections were deparaffinized,
rehydrated, stained with hematoxylin solution (Chongqing Mengbio
Biotechnology Co., Ltd.) for 5 min at room temperature,
differentiated in 1% acid alcohol (1% HCl in 70% ethanol), and
blued in tap water for 45 min, then stained with eosin solution for
3 min at room temperature. The sections were then dehydrated with
graded alcohol, cleared in xylene and mounted on a cover glass.
The SMG tissues were stained using AB-PAS staining
kit (G1285, Beijing Solarbio Science & Technology Co., Ltd.) at
room temperature (23-25°C) based on the manufacturer's
instructions. The sections were dewaxed, washed and stained with AB
for 10-20 min at room temperature, treated with freshly prepared
0.5% periodate solution for 5 min, stained for 10-20 min with
Schiff reagent and counterstained with hematoxylin for 1-2 min at
room temperature. Finally, Scott blue solution (Beijing Solarbio
Science & Technology Co., Ltd.) was used for re-bluing,
followed by dehydrate using a series of ethanol, transparent by
xylene and sealing with resin.
RNA-seq data analysis, selection of
candidate reference gene and primer design
To conduct the systematic analysis of reference
genes during the development and functional regeneration of SMG,
SMG samples at E13.5, E16.5, P0, P56 and at 5-day ligation were
collected. Transcriptome sequencing was performed by Biomarker
Technologies (Beijing) Co., Ltd. and Majorbio (Shanghai) Technology
Co., Ltd. Total tissue RNA of SMG was extracted using
TRIzol® reagent (Invitrogen; Thermo Fisher Scientific,
Inc.) based on the manufacturer's instructions. A total of 1
µg RNA per sample was used as input material for the RNA
sample preparations. Using the NEBNext UltraTM RNA Library Prep kit
for Illumina (NEB) in accordance with the manufacturer's
instructions, sequencing libraries were created and index codes
were added to assign sequences to specific samples. Briefly, mRNA
was purified from total RNA using poly-T oligo-attached magnetic
beads (Illumina, Inc.). Divalent cations were used to carry out
fragmentation at an elevated temperature in NEBNext First Strand
Synthesis Reaction Buffer (5X). M-MuLV reverse transcriptase and
random hexamer primer were used to create first-strand cDNA.
Subsequently, DNA Polymerase I and RNase H were used to create
second-strand cDNA. Exonuclease/polymerase operations turned the
remaining overhangs into blunt ends. NEBNext Adaptors with a
hairpin loop structure were ligated to prepare for hybridization
after the 3' ends of DNA fragments were adenylated. The library
fragments were purified using the AMPure XP technology (Beckman
Coulter, Inc.) to select cDNA fragments that were preferably 240 bp
in length. The cDNA that had been size-selected and adaptor-ligated
was then utilized in 3 µl USER Enzyme (NEB) and heated at
37°C for 15 min followed by 5 min at 95°C prior to PCR. PCR was
then carried out using Index (X) Primer, universal PCR primers, and
Phusion High-Fidelity DNA polymerase. Finally, PCR products were
purified using an AMPure XP system (Illumina, Inc.). Following
quality inspection and cluster generation, the library preparations
were sequenced using the Illumina HiSeq2000 high-throughput
sequencing platform (Illumina, Inc.). The final library loading
concentration was 2 nmol/l and the loading volume was 10
µl.
The selection of reference genes was based on
transcriptome sequencing information of the aforementioned mouse
SMG sample. Fragments per kilobase of exon model per million mapped
fragments (FPKM) were used as the normalized value to estimate gene
expression in the tissue. The annotated genes obtained from
transcript information were classified and candidate reference
genes were screened out for verification. Specific PCR primers
(Table I) were designed using
Primer 3.0 (Applied Biosystems; Thermo Fisher Scientific, Inc.) and
synthesized by Sangon Biotech Co., Ltd.
 | Table IPrimer sequences and amplification
characteristics of the 12 reference genes and two target genes. |
Table I
Primer sequences and amplification
characteristics of the 12 reference genes and two target genes.
| Gene/gene accession
no. | Gene name (Mus
musculus) | Gene function | 5′-Forward
primer-3′ (length/Tm/%GC/Self-Comp/Self-3′-Comp.) | 5′-Reverse
primer-3′ (length/Tm/%GC/Self-Comp/Self-3′-Comp.) | Amplicon (length,
efficiency, R2) |
|---|
|
Actb/NM_007393.5 | Actin, beta | Cytoskeleton |
TCTTTGCAGCTCCTTCGTTG (20
bp/58.77°C/50%/4/0) |
CGATGGAGGGGAATACAGCC (20
bp/59.96°C/60%/2/1) | 150 bp, 103%,
0.996 |
|
Actg1/NM_001313923.1 | Actin, gamma,
cytoplasmic 1 | Cytoskeleton |
GGCTTACACTGCGCTTCTTG (20
bp/59.83°C/55%/4/0) |
GCGATTTCTTCTTCCATTGC (20
bp/55.72°C/45%/3/2) | 75 bp, 104%,
0.996 |
|
Uba1/XM_030251302.1 | Ubiquitin-like
modifier activating enzyme 1 | Coenzyme transport
and metabolism |
CCTACACTGGGCCTCTTGTC (20
bp/59.75°C/60%/4/2) |
ATGACAGAACTCCCCCACTC (20
bp/58.72°C/55%/3/0) | 104 bp, 109.4%,
0.998 |
|
Ubc/NM_019639.4 | Ubiquitin C | Post-translational
modification, protein turnover, chaperones |
AGCCCAGTGTTACCACCAAG (20
bp/59.89°C/55%/6/2) |
CTAAGACACCTCCCCCATCA (20
bp/58.12°C/55%/3/1) | 118 bp, 103.2%,
0.992 |
|
Uba52/NM_001348228.1 | Ubiquitin A-52
residue ribosomal rotein fusion product 1 | Post-translational
modification, protein turnover, chaperones |
GGTTCCGCTGTCCTCTTTCT (20
bp/59.68°C/55%/2/0) |
GCCTTGACATTCTCGATGGT (20
bp/57.97°C/50%/4/2) | 133 bp, 96.4%,
0.995 |
|
Ube2c/NM_026785.2 |
Ubiquitin-conjugating enzyme E2C | Post-translational
modification, protein turnover, chaperones |
CGGCTACAGCAGGAACTGAT (20
bp/59.82°C/55%/4/3) |
CACCCACTTGAACAGGTTGT (20
bp/58.24°C/50%/5/3) | 90 bp, 95.9%,
0.997 |
|
H2afy/XM_006517258.3 | MacroH2A.1
histone | Chromatin structure
and dynamics |
CACCTGTGTACATGGCTGCT (20
bp/60.32°C/55%/6/1) |
TCATTGGCCACAGCTAACAG (20
bp/58.17°C/50%/6/2) | 130 bp, 106.2%,
0.999 |
|
H2afx/XM_006509995.3 | H2A.X variant
histone | Chromatin structure
and dynamics |
ACCACCTCCCTCACAGAAAG (20
bp/58.94°C/55%/2/1) |
GGGAGAGGAGGGAAAGAGAA (20
bp/57.74°C/55%/0/0) | 85 bp, 95.6%,
0.992 |
|
Tuba1a/NM_011653.2 | Tubulin-alpha
1A | Cytoskeleton |
CAGGTCTCCAGGGCTTCTTG (20
bp/60.4°C/60%/3/0) |
AATCAGAGTGCTCCAGGGTG (20
bp/59.38°C/55%/4/2) | 210 bp, 113.9%,
0.992 |
|
Tuba1b/NM_011654.2 | Tubulin-alpha
1B | Cytoskeleton |
CCCGGTGTCTGCTTCTATCT (20
bp/58.88°C/55%/4/0) |
CATGTTCCAGGCAGTAGAGC (20
bp/58.34°C/55%/4/2) | 135 bp, 92.3%,
0.995 |
|
Tubb5/NM_011655.5 | Tubulin-beta 5
class I | Cytoskeleton |
GGAAATCGTGCACATCCAGG (20
bp/59.27°C/55%/6/3) |
GGGGTCGATGCCATGTTCAT (20
bp/60.47°C/55%/5/4) | 91 bp, 98.5%,
0.992 |
|
Gapdh/NM_001289726.1 |
Glyceraldehyde-3-phosphate
dehydrogenase | Carbohydrate
transport and metabolism | GGCTGCCCAGAACATCAT
(18 bp/57.33°C/55.56%/5/3) | CGGACACATTGGGGGTAG
(18 bp/57.05°C/61.11%/3/0) | 122 bp, 109.7%,
0.997 |
|
AQP5/NM_009701.4a | Aquaporin 5 | Carbohydrate
transport and metabolism |
CTCCGAGCCATCTTCTACGT (20
bp/58.97°C/55%/5/4) |
CCAATGGATAAGGCTGGGGA (20
bp/59.15°C/55%/5/0) | 245 bp, 108.1%,
0.998 |
|
Krt19/NM_008471.3a | Keratin 19 | Cytoskeleton |
GGTTCAGTACGCATTGGGTC (20
bp/58.92°C/55%/5/3) |
CAAGTAGGAGGCGAGACGAT (20
bp/58.97°C/55%/2/2) | 234 bp, 98%,
0.990 |
RNA isolation and cDNA synthesis
Frozen samples (~20 mg) were ground using a grinding
bead homogenizer (Shanghai Jingxin Industrial Development Co.,
Ltd.). Total tissue RNA of SMG was extracted using
TRIzol® reagent (cat. no. 15596018, Invitrogen; Thermo
Fisher Scientific, Inc.) based on the manufacturer's instructions.
The purity and concentration of the extracted total RNA was
examined using a Nanodrop UV 2000 spectrophotometer (cat. no.
ND-2000, Thermo Fisher Scientific, Inc.). The genetic integrity of
the isolated RNA was further detected using 2% agarose gel
electrophoresis. Only the RNA samples with A260/A280 absorbance
ratios of 1.8 and 2.2 were used for follow-up cDNA synthesis
analyses. A total of 2 µg total RNA was reverse transcribed
into cDNA using a reverse transcription reaction kit (18090050,
Invitrogen; Thermo Fisher Scientific, Inc.) with a 20 µl
system. The reverse transcription reaction involved incubation at
23°C for 10 min, followed by 10 min at 55°C. The transcriptor
reverse transcriptase enzyme was inactivated by heating to 80°C for
10 min. The generated cDNA products were diluted three-fold with
nuclease-free water and stored in a -80°C freezer for subsequent
qPCR analyses.
qPCR
All qPCR reactions were performed in triplicate on
an ABI Prism 7500 Real-Time PCR System (Applied Biosystems; Thermo
Fisher Scientific, Inc.) using 2X SYBR-Green qPCR Master Mix
(Bimake, Houston, TX, USA, http://www.bimake.cn/). A final 20 µl reaction
mixture contained 2 µl diluted cDNA template, 0.75 µl
of each of the forward and reverse primers, 10 µl of 2X
SYBR-Green qPCR Master Mix, and 6.5 µl RNase-free water. The
PCR amplification program was as follows: 95°C for 3 min for
initial cDNA hot-start activation, followed by 39 amplification
cycles of 95°C for 10 sec for denaturation, 59°C for 30 sec for
annealing and extension. At the end of amplification, a melting
curve analysis was performed at 65 to 95°C for 5 sec at a heating
rate of 0. 5°C/sec to confirm the specificity of each primer pair.
The 2−ΔΔCq method was used as previously reported
(29).
Western blot analysis
Frozen gland tissues (~30 mg) were homogenized in
ice-cold RIPA lysis buffer (Beyotime Institute of Biotechnology)
using a motor-driven tissue grinder. The homogenate was centrifuged
at 14,000 × g at 4°C for 5 min, and the total protein concentration
in the supernatant was then quantified using a BCA kit (Beyotime
Institute of Biotechnology). All gland protein samples were mixed
with 5X loading buffer (Hangzhou Fude Biological Technology Co.,
Ltd., http://www.fdbio.net/) and immediately
denatured by boiling at 100°C for 10 min. After cooling, the
samples were separated on 12% SDS-PAGE, and the protein gel was
transferred onto PVDF membranes (MilliporeSigma). The membranes
were then blocked (1 h at room temperature) in 5% BSA solution
(Beyotime Institute of Biotechnology), and the membranes were
incubated overnight at 4°C with the respective primary antibodies
against rabbit anti-ubiquitin (1:400 dilution; cat. no. 20200728,
Yurogen Biosystems LLC), rabbit anti-TUBA1B (1:100,000 dilution;
cat. no. ab108629, Abcam), rabbit anti-GAPDH (1:1,000 dilution;
cat. no. 5174s, Cell Signaling Technology, Inc.) and rabbit
anti-ACTB (1:1,000 dilution; cat. no. 8457s, Cell Signaling
Technology, Inc.). Subsequently, the membranes were rinsed with
TBST (20 mM Tris-HCl, 140 mM NaCl, pH 7.6, 0.1% v/v Tween-20) three
times and incubated with HRP-conjugated anti-rabbit IgG secondary
antibodies (1:1,500 dilution; cat. no. 7074S, Cell Signaling
Technology, Inc.) at room temperature for 1 h. Finally, the blots
were incubated with chemiluminescence substrate ECL Western
blotting detection reagents (Beyotime Institute of Biotechnology)
for 1 min, and the antibody-specific labeling bands were detected
using the ChemiDoc™ MP Imaging System (Bio-Rad Laboratories, Inc.)
and ImageJ software (v1.8.0; National Institutes of Health) was
employed for densitometric results.
Reference gene expression stability
The expression levels of 12 reference genes were
determined by the quantification cycle (Cq) value, which was
obtained from RT-qPCR. Cq values were converted to relative values
using 2−ΔCq, of which ΔCq=the corresponding Cq
value-minimum Cq (30).
2−ΔCq were used for geNorm and the NormFinder software,
while BestKeeper analysis was based on raw Cq values. The
expression stability of the reference genes was ranked using the
ΔCq value and four different types of statistical algorithms
software as follows: i) geNorm: The stable value (M) of geNorm
software calculated is based on the average pairwise variation
between all reference genes tested. M values below the theoretical
threshold of 1.5, indicating a stable expression and vice versa
(31). ii) NormFinder: The stable
value of NormFinder software is based on variation analysis in
expression levels, and a lower stable value indicates a high
stability (32). iii) BestKeeper:
The stable value of BestKeeper is based on the standard deviation
(SD) and coefficients of variation (CV), and the most stable
reference genes have the lowest CV and SD and vice versa (33). iv) RefFinder: The RefFinder
software calculates the geometric mean weight of each gene and the
stability rankings based on the analysis of the ΔCq value and the
aformentioned three specialized programs and obtains an overall
comprehensive ranking (34).
Statistical analysis
All data are expressed as the mean ± standard
deviation. Statistical analyses were performed using SPSS 22.0
software (IBM Corp.). The figures were generated using Graphpad
Prism 8.0 (GraphPad Software Inc.) and ImageJ software (v1.8.0;
National Institutes of Health). The statistical significance of the
protein levels was evaluated using one-way ANOVA for repeated
measures. A value of P<0.05 was considered to indicate a
statistically significant difference.
Results
RNA-Seq reveals candidate reference
genes
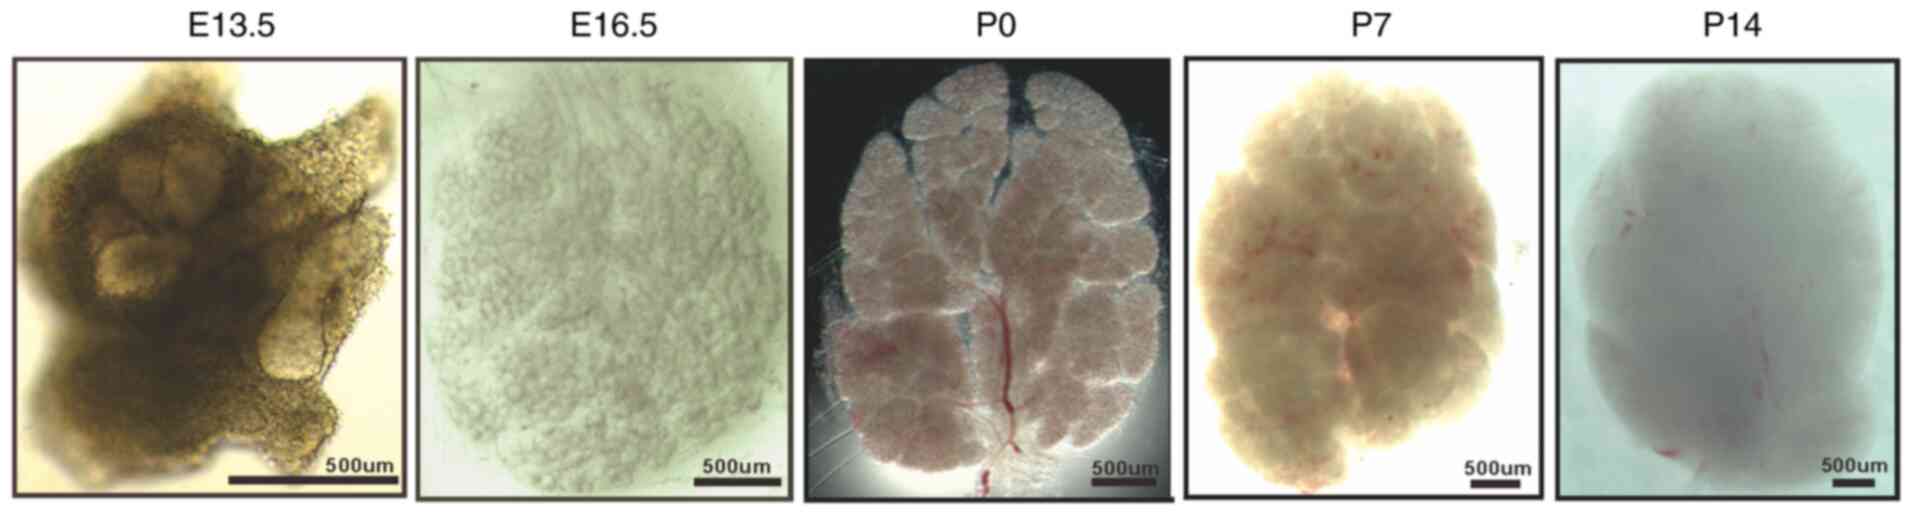
To observe the morphological changes in the SMG
during the developmental stage, SMG samples at E13.5, E16.5, P0, P7
and P14 were collected, and these representative images are
illustrated in Fig. 1. At E13.5
(the pre-bud stage), the epithelial bud cleft formation and divides
the bud into typically two or three parts. At E16.5 (the
microtubule stage), the ductus had abundant branches, numerous
acini, and a rudimentary glandular shape, with clearly
well-developed lumen seen in terminal buds and putative ductus.
After birth, the glands continue to differentiate and grow, with an
increase in glandular branching and glandular lobules, and an
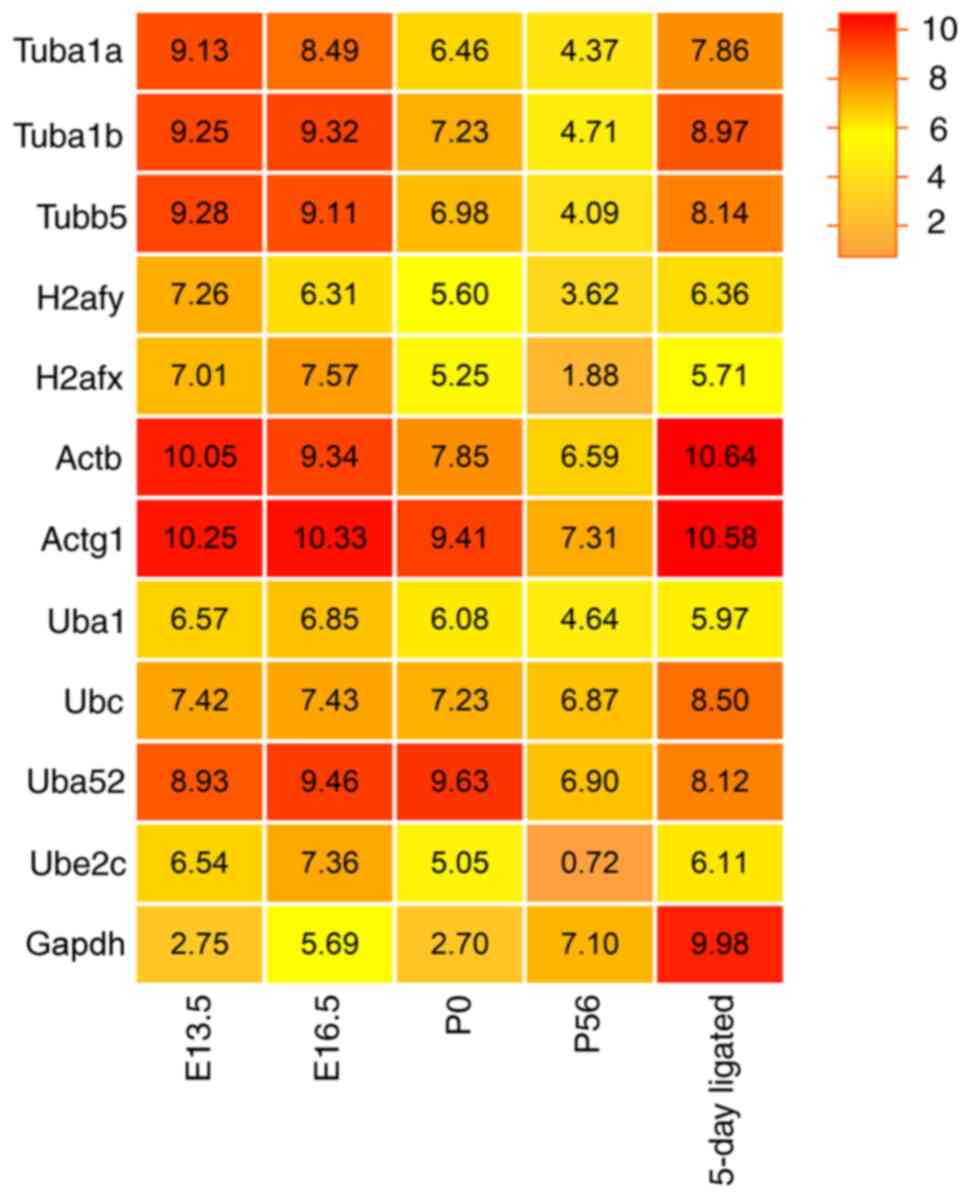
increase in the number and volume of acinar cells. Furthermore, to
conduct a systematic analysis of reference genes during the
development of SMG, RNA-Seq of the SMG at E13.5, E16.5, P0 and P56
were performed separately. Excretory duct ligation represented SMG
injury and repair (5 days). The raw data for the present study were
deposited in the SRA database (accession no. PRJNA856858' to be
release on June 30, 2023). RNA-Seq analysis detected >20,000
annotated genes. Utilizing the Pfam, SwissProt, EggNOG and NR
databases, 430 genes belonging to the tubulin, histone, actin,
ubiquitin and GAPDH family of protein were sorted and classified.
These family members were assigned 15 genes (tubulin family), 85
genes (histone family), 22 genes (actin family), 307 genes
(ubiquitin family) and 1 gene (GAPDH family). The high FPKM value
(>90) of genes with Top4 rank were then selected as potentially
the most stably expressed genes for validation. Finally, 12
candidate reference genes were obtained, namely Tuba1a, Tuba1b,
Tubb5, H2afy, H2afx, Actb, Actg1, Ubc, Uba1, Uba52, Ube2c and
Gapdh. The heatmap revealed the total RNA expression
[Log2(FPKM)] of the 12 candidate reference genes (Fig. 2).
Specificity and amplification efficiency
of RT-qPCR primers
Subsequently, total RNA was extracted from the SMG
to verify the primer specificity and amplification efficiency of
the 12 candidate reference genes and two target genes. First, gland
samples were collected from embryonic mice (E14.5, E15.5, E16.5,
E17.5 and E18.5), post-natal mice (P0, P7, P14, P28, P56, P84 and
P112) and the duct calculus-induced SMG functional regeneration
model at 5 and 7 days after ligation and then after 7, 14 and 28
days after de-ligation. RNA purity and concentration were assessed.
As shown in Table SI, the
A260/A280 ratio ranged from 1.99 to 2.15. The melting curve,
amplification efficiency and correlation coefficient
(R2) were confirmed. The melting curves revealed that
all candidate reference genes had a single peak without primer,
dimers and non-specific PCR products, indicating that each primer
pair was highly specific to the targeted region (Fig. S1A). The amplification efficiency
varied from 92.3% (Tuba1b) to 113.9% (Tuba1a) and met
the standard for RT-qPCR (Fig.
S1B). All linear R2 values varied from 0.992 to
0.999, indicating a linear association between cDNA levels and Cq
values, verifying the reliability of the results. Table I presents the gene accession
number, gene name, gene function, primer sequence, amplicon length,
product TM (°C), GC (%), self-comp, self-3'-comp, R2 and
efficiency (%) of the 12 candidate reference genes and two target
genes. These data indicated that RNA extraction, primer sequences
and the amplification procedure were all in accordance with the
RT-qPCR assessment.
Candidate reference gene expression
profiles
The present study then investigated the expression
variability of the 12 candidate reference genes using RT-qPCR.
First, gland samples were harvested from embryonic mice (E14.5,
E15.5, E16.5, E17.5 and E18.5) and post-natal mice (P0, P7, P14,
P28, P56, P84 and P112) and duct calculus-induced SMG functional
regeneration model at 5 and 7 days after ligation, and then 7, 14
and 28 days after de-ligation. The Cq values were applied to
demonstrate variations among all samples. The contralateral glands
without ligation in the same individuals were defined as the sham
operation group. The mean Cq values of the 12 candidate reference
genes in the SMG development stage, ranging from 17.18 to 23.70 are
shown in Fig. 3A; the results
suggested that there were relatively large differences in the
transcript levels among these reference genes. A low Cq value
indicates a high gene expression level and vice versa. Actb
was the most abundant, with Cq values ranging from 13.9 to 19.97,
while Ube2c was the least abundant transcript, with Cq
values ranging from 19.31 to 28.95. To better evaluate these
variations, the CV values were calculated. The CV values of the 12
candidate reference genes in all samples from low to high were as
follows: 3.98% (Ubc), 4.30% (Uba52), 6.55%
(Uba1), 6.73% (H2afy), 8.48% (Gapdh), 10.73%
(Actg1), 11.71% (H2afx), 12.35% (Tuba1a),
12.39% (Actb), 13.09% (Tubb5), 13.17% (Tuba1b)
and 14.58% (Ube2c) (Fig.
3A).
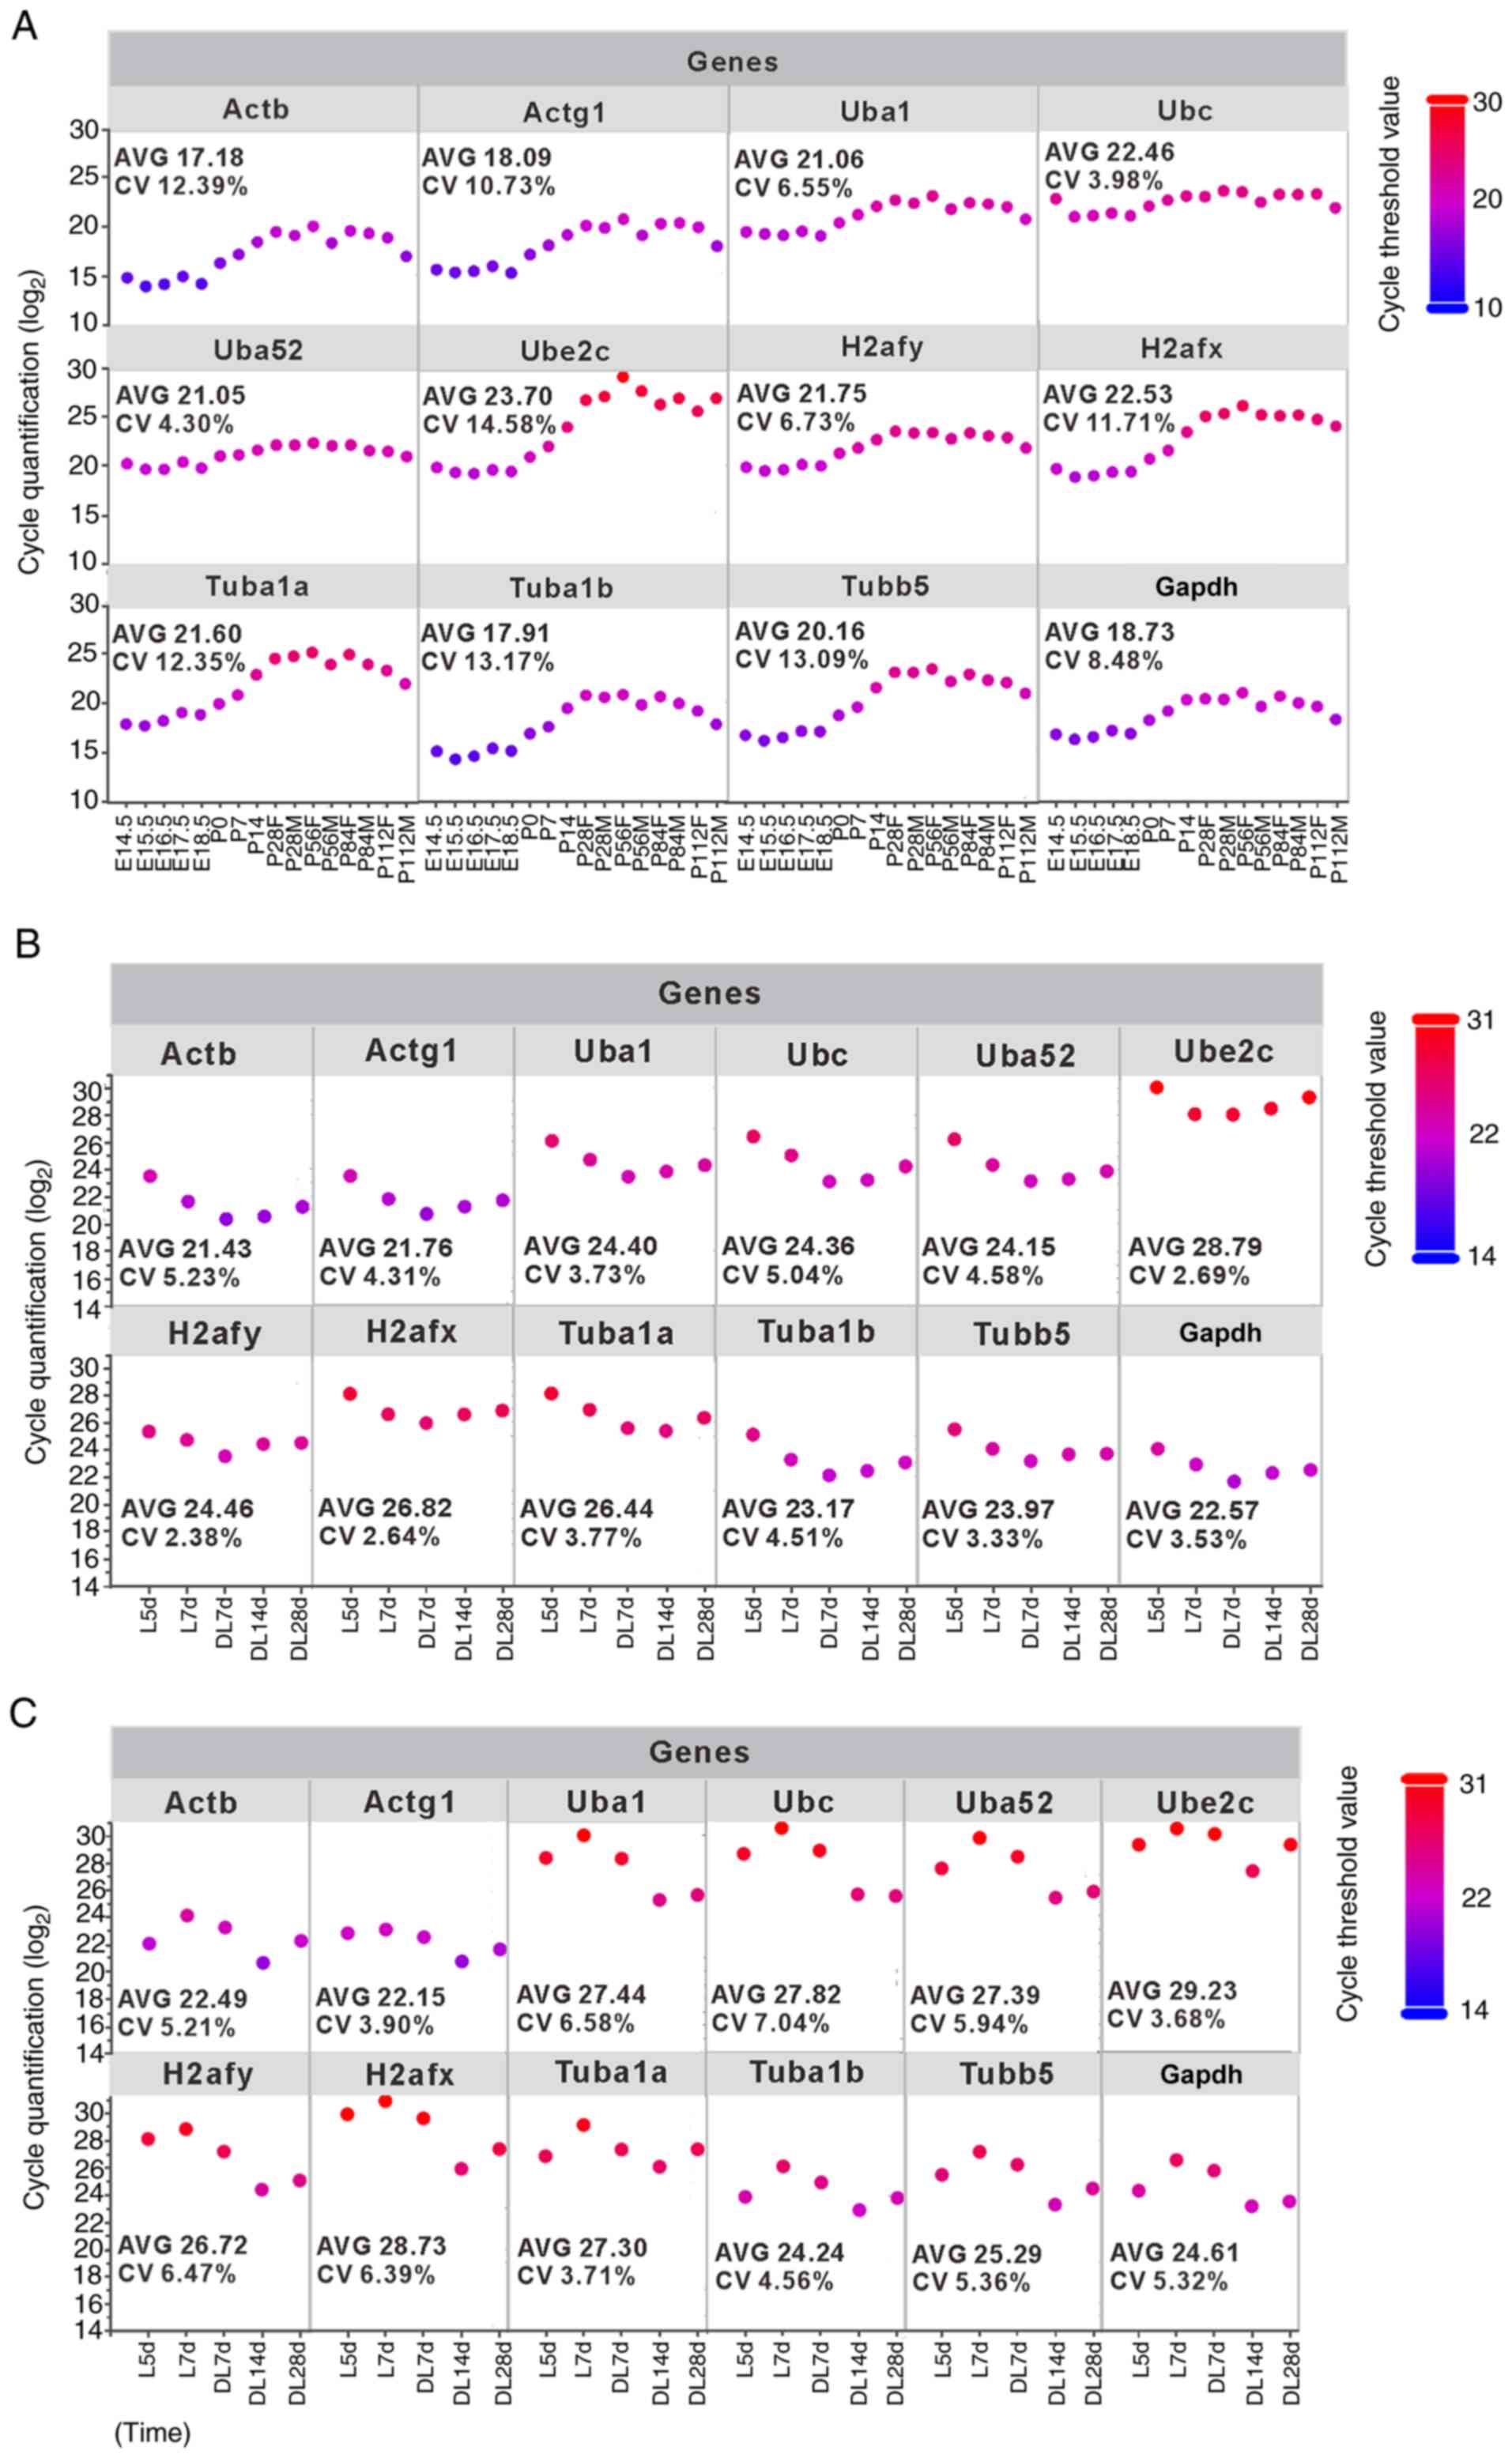 | Figure 3Expression variability of the 12
candidate reference genes among all tested samples during SMG
development and regeneration. Raw expression was displayed as the
quantification cycle (Cq) values detected using RT-qPCR and is
presented as scatter plots. (A) SMG development group. Duct
calculus-induced SMG regeneration model, including, (B) sham
operation group, and (C) duct ligation/de-ligation group.
Measurements were taken in triplicate for each time point sample.
For visualization purposes, we have added a color bar representing
the log2 values of cycle threshold. SMG, submandibular gland; AVG,
average; M, male; F, female; E, embryonic day; P, post-natal; L,
ligation; DL, de-ligation. |
Similarly, the Cq and CV values in SMG functional
regeneration were evaluated. In the sham operation group, the Cq
values of the 12 candidate reference genes ranged from 21.43 to
28.79 (Fig. 3B). It was also
found that the Actb gene expression level was the highest
(mean Cq, 21.43), whereas Ube2c was the least expressed
(mean Cq, 28.79). These results were similar to the results from
the development process. Furthermore, the CV values of the 12
candidate reference genes in all samples were as follows: 2.38%
(H2afy), 2.64% (H2afx), 2.69% (Ube2c), 3.33%
(Tubb5), 3.53% (Gapdh), 3.73% (Uba1), 3.77%
(Tuba1a), 4.31% (Actg1), 4.51% (Tuba1b), 4.58%
(Uba52), 5.04% (Ubc) and 5.23% (Actb)
(Fig. 3B).
In the duct ligation/de-ligation group, the mean Cq
values of the 12 candidate reference genes ranged from 22.15
(Actg1) to 29.23 (Ube2c) (Fig. 3C). The CV values of the 12
candidate reference genes in all samples were as follows: 3.68%
(Ube2c), 3.71% (Tuba1a), 3.90% (Actg1), 4.56%
(Tuba1b), 5.21% (Actb), 5.32% (Gapdh), 5.36%
(Tubb5), 5.94% (Uba52), 6.39% (H2afx), 6.47%
(H2afy), 6.58% (Uba1) and 7.04% (Ubc)
(Fig. 3C).
Expression stability analysis of the 12
candidate reference genes in SMG development
To further evaluate the expression stability of the
reference genes comprehensively in the SMG development state, gland
samples were obtained from embryonic mice (E14.5, E15.5, E16.5,
E17.5 and E18.5) and post-natal mice (P0, P7, P14, P28, P56, P84
and P112) for use in RT-qPCR. The geNorm, NormFinder, BestKeeper,
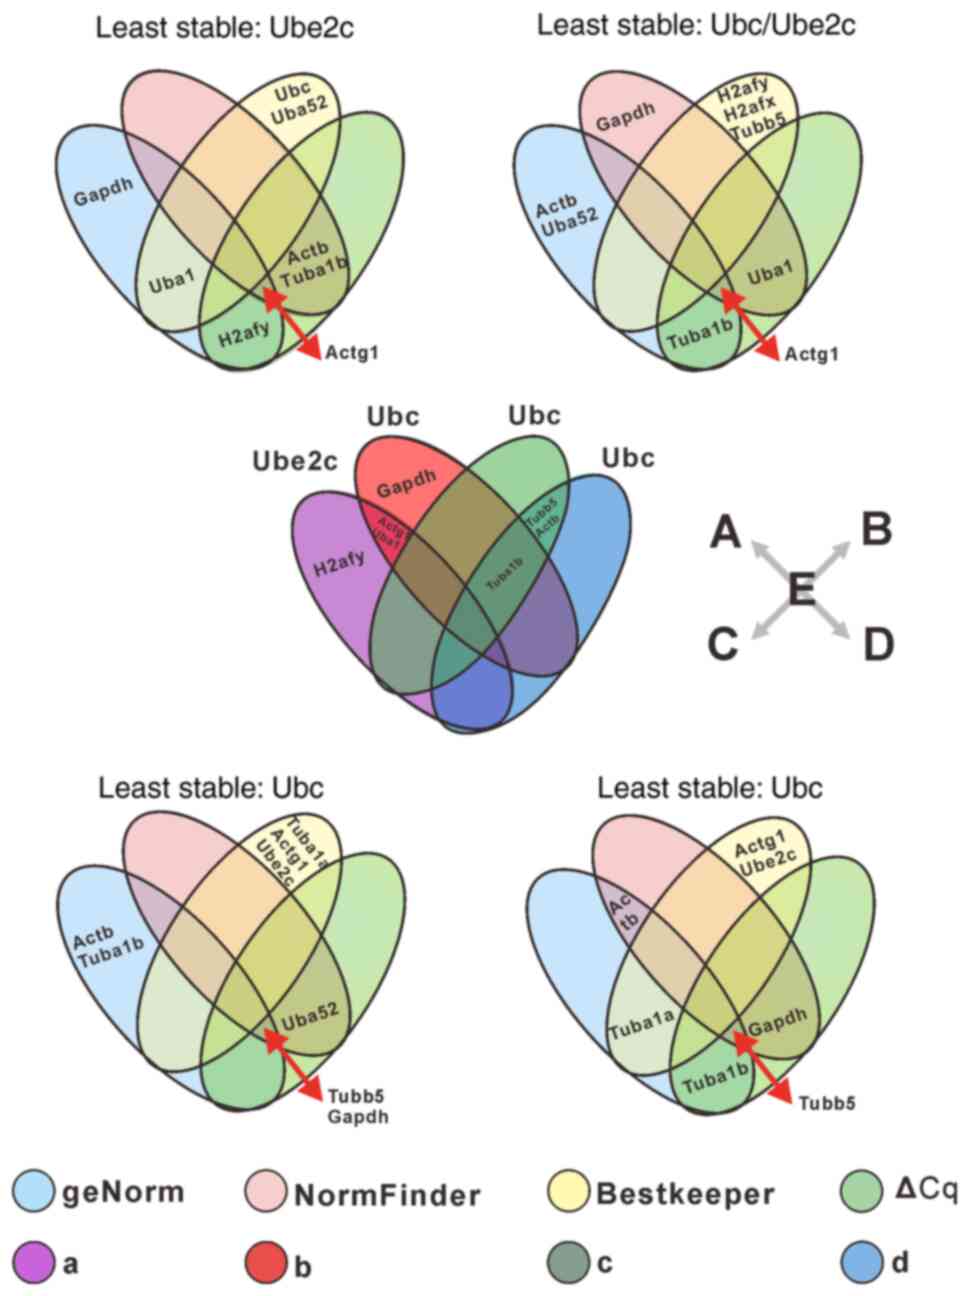
∆Cq and RefFinder tools were then used. As demonstrated in Fig. 4, a Venn diagram was drawn to
reveal the optimal reference genes. The top three recommended
reference genes were different according to aforementioned
software: Uba1/H2afy > Gapdh >
Actg1 with geNorm analysis, Actg1 > Actb
> Tuba1b with NormFinder analysis, Uba52 >
Ubc > Uba1 with Bestkeeper analysis, and
Actg1/Actb > Tuba1b > H2afy with ∆Cq
analysis. The least stable reference gene was Ube2c, as per
all four statistical software (Fig.
4A and Table II). The most
stable reference genes recommended by the four software were
different; thus, the RefFinder software was employed to integrate
the optimal reference gene. RefFinder analysis results indicated
that Actg1, H2afy and Uba1 are in the top
three rankings and may be more stably expressed, whereas
Ube2c was the least stable reference gene (Fig. 4E and Table II).
| Table IIRanking of the 12 reference genes
under multiple conditions according to five different types of
software. |
Table II
Ranking of the 12 reference genes
under multiple conditions according to five different types of
software.
| Group | Rank | geNorm
| NormFinder
| BestKeeper
| ΔCq
| RefFinder
|
|---|
| Gene | Stability | Gene | Stability | Gene | SD | CV | Gene | SD | Gene | Stability |
|---|
| Development
group | 1 | Uba1 | 0.26 | Actg1 | 0.086 | Uba52 | 0.78 | 3.70 | Actg1 | 0.87 | Actg1 | 2.21 |
| 2 | H2afy | 0.26 | Actb | 0.117 | Ubc | 0.79 | 3.51 | Actb | 0.87 | H2afy | 2.99 |
| 3 | Gapdh | 0.29 | Tuba1b | 0.293 | Uba1 | 1.25 | 5.95 | Tuba1b | 0.93 | Uba1 | 3.22 |
| 4 | Actg1 | 0.44 | Gapdh | 0.374 | H2afy | 1.30 | 5.98 | H2afy | 0.94 | Actb | 3.44 |
| 5 | Actb | 0.50 | H2afy | 0.376 | Gapdh | 1.44 | 7.72 | Gapdh | 0.95 | Gapdh | 4.16 |
| 6 | Tuba1b | 0.59 | Uba1 | 0.466 | Actg1 | 1.74 | 9.65 | Uba1 | 0.99 | Tuba1b | 4.56 |
| 7 | Tubb5 | 0.70 | Tubb5 | 0.505 | Actb | 1.90 | 11.09 | Tubb5 | 1.05 | Uba52 | 5.62 |
| 8 | Tuba1a | 0.75 | H2afx | 0.557 | Tuba1b | 2.14 | 11.93 | Tuba1a | 1.10 | Ubc | 7.18 |
| 9 | H2afx | 0.79 | Tuba1a | 0.559 | Tubb5 | 2.44 | 12.10 | H2afx | 1.12 | Tubb5 | 7.45 |
| 10 | Uba52 | 0.89 | Uba52 | 0.845 | Tuba1a | 2.45 | 11.35 | Uba52 | 1.34 | Tuba1a | 8.71 |
| 11 | Ubc | 0.97 | Ubc | 0.977 | H2afx | 2.49 | 11.06 | Ubc | 1.49 | H2afx | 9.19 |
| 12 | Ube2c | 1.13 | Ube2c | 1.293 | Ube2c | 3.23 | 13.62 | Ube2c | 1.93 | Ube2c | 12.00 |
| Sham operation
group | 1 | Actb | 0.10 | Actg1 | 0.030 | H2afy | 0.45 | 1.82 | Uba1 | 0.30 | Actg1 | 2.51 |
| 2 | Uba52 | 0.10 | Uba1 | 0.053 | H2afx | 0.54 | 2.00 | Actg1 | 0.31 | Uba1 | 2.89 |
| 3 | Tuba1b | 0.14 | Gapdh | 0.114 | Tubb5 | 0.62 | 2.60 | Tuba1b | 0.33 | Gapdh | 4.12 |
| 4 | Actg1 | 0.18 | Tuba1b | 0.117 | Gapdh | 0.64 | 2.83 | Gapdh | 0.35 | Tuba1b | 4.12 |
| 5 | Uba1 | 0.20 | Tubb5 | 0.134 | Actg1 | 0.70 | 3.20 | Tubb5 | 0.36 | Actb | 4.46 |
| 6 | Gapdh | 0.23 | Actb | 0.185 | Ube2c | 0.71 | 2.46 | Actb | 0.37 | Uba52 | 4.70 |
| 7 | Tubb5 | 0.25 | Uba52 | 0.196 | Uba1 | 0.73 | 3.01 | Uba52 | 0.38 | Tubb5 | 4.79 |
| 8 | Tuba1a | 0.27 | Tuba1a | 0.212 | Tuba1b | 0.79 | 3.42 | Tuba1a | 0.41 | H2afy | 6.04 |
| 9 | Ubc | 0.30 | H2afx | 0.224 | Tuba1a | 0.85 | 3.21 | H2afx | 0.43 | H2afx | 6.34 |
| 10 | H2afx | 0.33 | Ubc | 0.321 | Uba52 | 0.88 | 3.65 | Ubc | 0.51 | Tuba1a | 8.24 |
| 11 | H2afy | 0.37 | H2afy | 0.333 | Actb | 0.89 | 4.15 | H2afy | 0.55 | Ube2c | 10.09 |
| 12 | Ube2c | 0.41 | Ube2c | 0.405 | Ubc | 1.06 | 4.35 | Ube2c | 0.63 | Ubc | 10.19 |
| Duct
ligation/de-ligation group | 1 | Actb | 0.29 | Tubb5 | 0.148 | Tuba1a | 0.74 | 2.71 | Tubb5 | 0.60 | Tubb5 | 2.06 |
| 2 | Tuba1b | 0.29 | Uba52 | 0.263 | Actg1 | 0.78 | 3.53 | Uba52 | 0.69 | Tuba1b | 2.83 |
| 3 | Tubb5 | 0.40 | Gapdh | 0.278 | Ube2c | 0.81 | 2.76 | Gapdh | 0.71 | Actb | 3.34 |
| 4 | Gapdh | 0.41 | Actb | 0.300 | Tuba1b | 0.96 | 3.96 | Tuba1b | 0.72 | Gapdh | 3.98 |
| 5 | Ube2c | 0.45 | Ube2c | 0.327 | Actb | 0.97 | 4.33 | Actb | 0.73 | Uba52 | 4.00 |
| 6 | Tuba1a | 0.50 | Tuba1b | 0.329 | Tubb5 | 1.16 | 4.60 | Uba1 | 0.78 | Tuba1a | 5.19 |
| 7 | Actg1 | 0.55 | Uba1 | 0.372 | Gapdh | 1.21 | 4.90 | Ube2c | 0.80 | Ube2c | 5.21 |
| 8 | Uba52 | 0.61 | Actg1 | 0.414 | Uba52 | 1.43 | 5.21 | Actg1 | 0.85 | Actg1 | 5.47 |
| 9 | Uba1 | 0.68 | H2afx | 0.420 | H2afy | 1.60 | 5.99 | H2afx | 0.85 | Uba1 | 7.54 |
| 10 | H2afx | 0.73 | H2afy | 0.449 | Uba1 | 1.66 | 6.04 | H2afy | 0.86 | H2afx | 9.72 |
| 11 | H2afy | 0.76 | Tuba1a | 0.508 | H2afx | 1.69 | 5.88 | Tuba1a | 0.92 | H2afy | 9.97 |
| 12 | Ubc | 0.79 | Ubc | 0.508 | Ubc | 1.81 | 6.49 | Ubc | 0.94 | Ubc | 12.00 |
| Combining sham
operation and duct ligation/de-ligation group | 1 | Actb | 0.23 | Tubb5 | 0.182 | Actg1 | 0.81 | 3.69 | Tubb5 | 0.73 | Tubb5 | 2.21 |
| 2 | Tuba1b | 0.23 | Gapdh | 0.268 | Ube2c | 0.83 | 2.86 | Gapdh | 0.79 | Tuba1b | 2.63 |
| 3 | Tuba1a | 0.33 | Actb | 0.332 | Tuba1a | 0.87 | 3.25 | Tuba1b | 0.80 | Actb | 3.16 |
| 4 | Tubb5 | 0.41 | Tuba1b | 0.360 | Tuba1b | 1.00 | 4.20 | Actb | 0.82 | Gapdh | 3.74 |
| 5 | Actg1 | 0.50 | H2afx | 0.381 | Actb | 1.09 | 4.96 | H2afx | 0.86 | Actg1 | 4.49 |
| 6 | Ube2c | 0.55 | Uba52 | 0.408 | Tubb5 | 1.14 | 4.64 | H2afy | 0.92 | Tuba1a | 4.58 |
| 7 | Gapdh | 0.61 | H2afy | 0.432 | Gapdh | 1.21 | 5.14 | Tuba1a | 0.96 | H2afx | 5.73 |
| 8 | H2afx | 0.69 | Actg1 | 0.453 | H2afy | 1.48 | 5.77 | Uba1 | 0.99 | Ube2c | 6.17 |
| 9 | H2afy | 0.75 | Uba1 | 0.462 | H2afx | 1.48 | 5.34 | Actg1 | 1.02 | H2afy | 7.14 |
| 10 | Uba1 | 0.83 | Ube2c | 0.482 | Uba1 | 1.76 | 6.79 | Uba52 | 1.04 | Uba1 | 8.94 |
| 11 | Uba52 | 0.88 | Tuba1a | 0.540 | Uba52 | 1.78 | 6.91 | Ube2c | 1.07 | Uba52 | 10.49 |
| 12 | Ubc | 0.94 | Ubc | 0.636 | Ubc | 2.00 | 7.65 | Ubc | 1.23 | Ubc | 12.00 |
Expression stability analysis of the 12
candidate reference genes in SMG functional regeneration
To assess the expression stability of the 12
candidate reference genes in the SMG functional regeneration state,
gland samples of 5-day ligation, 7-day ligation, 7-day de-ligation,
14-day delegation and 28-day de-ligation were selected for use in
RT-qPCR. The ∆Cq, M, SV and CV/SD values of the 12 candidate
reference genes were then calculated using the four aforementioned
statistical software. Finally, RefFinder software was used to
integrate the aforementioned four statistical methods and calculate
the recommended comprehensive ranking order for the expression
stability of each candidate reference gene. As illustrated in
Fig. 4B, the geNorm stability
values of the top three genes calculated in the sham operation
group: Actb/Uba52 > Tuba1b >
Actg1. The NormFinder results revealed the expression
stability of the top three reference genes listed from high to low:
Actg1 > Uba1 > Gapdh. BestKeeper values
showed the top three reference genes were H2afy >
H2afx > Tubb5. The ∆Cq values revealed that the
top three reference genes were Uba1, Actg1 and
Tuba1b. The four types of evaluation methods designated
Ubc/Ube2c as the least stable gene (Table II). The integrated analysis
through RefFinder also indicated that the stability for the best
three genes was Actg1> Uba1 >
Gapdh/Tuba1b. On the other hand, the least stable
gene was Ubc (Fig. 4E and
Table II).
In the duct ligation/de-ligation group, the geNorm
values indicated the order of the top three genes calculated for
expression stability to be Actb/Tuba1b >
Tubb5 > Gapdh. The NormFinder results revealed the
expression stability of the top three reference genes was
Tubb5 > Uba52 > Gapdh. The BestKeeper
values revealed the top three reference genes to be Tuba1a
> Actg1 > Ube2c. The ∆Cq values revealed that
the top three reference genes were Tubb5, Uba52 and
Gapdh. At the same time, the four-evaluation method analyses
revealed that Ubc was also the least stable gene in the duct
ligation/de-ligation group (Fig.
4C and Table II). Similarly,
the ranks of the 12 most stable candidate reference genes were
obtained from the above four software analyses and showed a slight
difference. RefFinder analysis results indicated the stability of
the top three genes to be ranked as Tubb5 > Tuba1b
> Actb, and the Ubc gene was the least stable one
(Fig. 4E and Table II).
The stability reference genes were also analyzed in
the ligation/de-ligation model combining sham operation and duct
ligation/de-ligation group. The geNorm values revealed that the top
three genes calculated for expression stability were
Actb/Tuba1b > Tuba1a > Tubb5. The
NormFinder results revealed the top three reference genes, listed
from high to low, as follows: Tubb5 > Gapdh >
Actb. The BestKeeper values revealed the top three reference
genes were Actg1 > Ube2c > Tuba1a. The
∆Cq values revealed that the top three reference genes were
Tubb5, Gapdh and Tuba1b. Ubc was
designated as the least stable gene by the four algorithms
mentioned above, while the most stable gene was disunified
(Fig. 4D and Table II). The RefFinder results
indicated the three most stable genes to be Tubb5 >
Tuba1b > Actb, while the least stable gene was
indicated to be Ubc (Fig.
4E and Table II).
Validation of loading control for western
blot analysis
To further verify the stable reference gene in SMG
development and functional regeneration stage, western blot
analysis was performed to assess the expression of the represented
protein. As shown in Fig. 5A and
B, an evident variation in ubiquitin protein expression during
the SMG development stage with a CV of 64.7%. Similarly, TUBA1B
protein expression exhibited an obvious variation with a CV of
52.3%. The GAPDH protein level variation (CV) value was 33.2%.
Compared with ubiquitin, TUBA1B and GAPDH, the protein expression
of ACTB was the least variable, with a CV of 23.1%. Furthermore, it
was found that the expression of ACTB protein was relatively
stable, particularly from P28 to P112, while that of the other
three proteins varied greatly (Table
SII). In brief, these results revealed that the expression
level of ACTB was the most reliable loading control in western blot
analysis, which was consistent with the results of RT-qPCR.
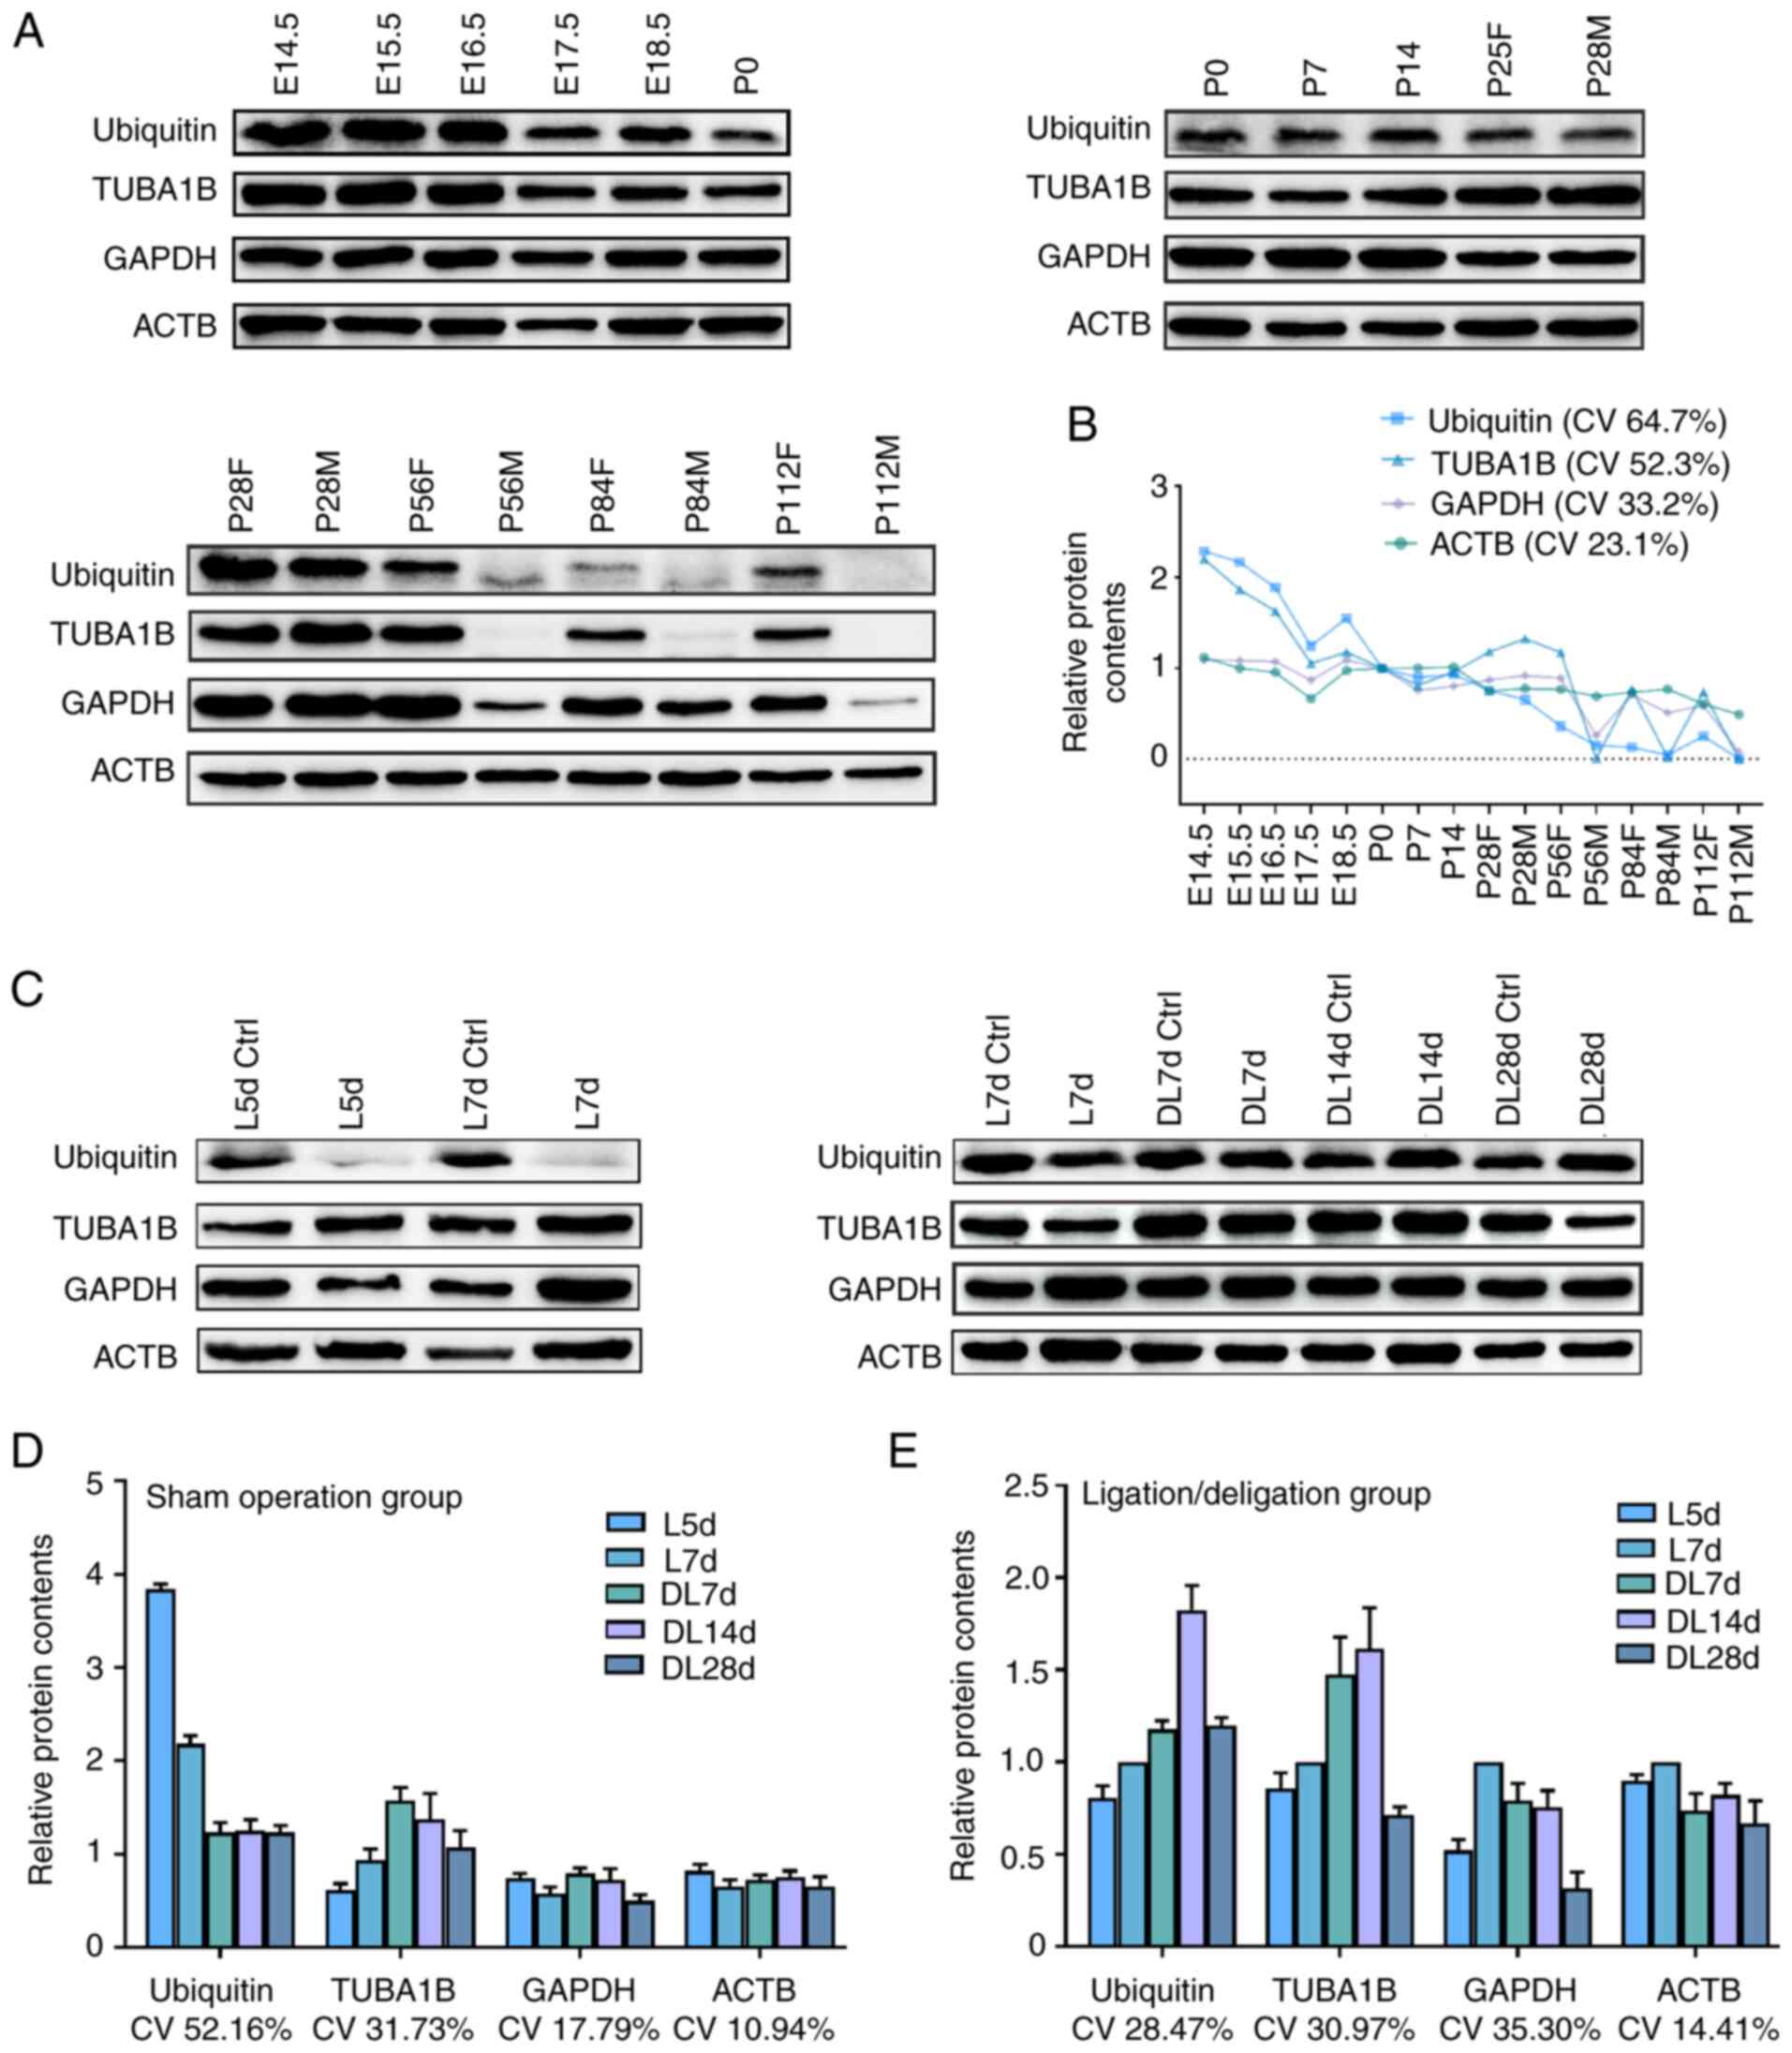 | Figure 5Validation of loading controls for
western blot analysis throughout SMG development and regeneration.
Representative western blots of ubiquitin, TUBA1B, GAPDH and ACTB
were shown in (A) for distinct SMG developmental stages and (C) for
duct calculus-induced SMG regeneration stages. Densitometric
analysis and CV of ubiquitin, TUBA1B, GAPDH and ACTB are shown in
(B) for SMG developmental stages, (D) sham operation group and (E)
duct ligation/de-ligation group. In order to exclude the influence
of exposure intensity, exposure time and other factors. The
intensity of the protein bands for the lane loaded with duplicate
samples was normalized to 1, such as P0, P28M, P28F, L7d ctrl, L7d.
'E', 'P', 'F', 'M', 'L' and 'DL' refer to embryo, post-natal,
female, male, ligation and de-ligation, respectively. The
experiment was repeated three times. CV, coefficient of variation;
d, day; SMG, submandibular gland. |
Subsequently, the present study analyzed the
protein expression of ACTB, GAPDH, ubiquitin and TUBA1B in the SMG
functional regeneration stage. As shown in Fig. 5C-E, the protein expression of
ACTB, GAPDH and TUBA1B was slightly variable, with a CV of 10.94,
17.79 and 31.73%, respectively, in the sham operation group. The
protein expression of ubiquitin exhibited an evident variation with
a CV of 52.16%. In the ligation/de-ligation group, the protein
expression of ACTB, ubiquitin, TUBA1B and GAPDH was slightly
variable, with a CV of 14.41, 28.47, 30.97 and 35.30%,
respectively. The results of the statistical analysis of the
reference genes at different time periods are presented in Table SIII. Taken together, these
results demonstrated that the protein expression level of ACTB in
the SMG functional regeneration stage was the most appropriate
loading control for western blot analysis.
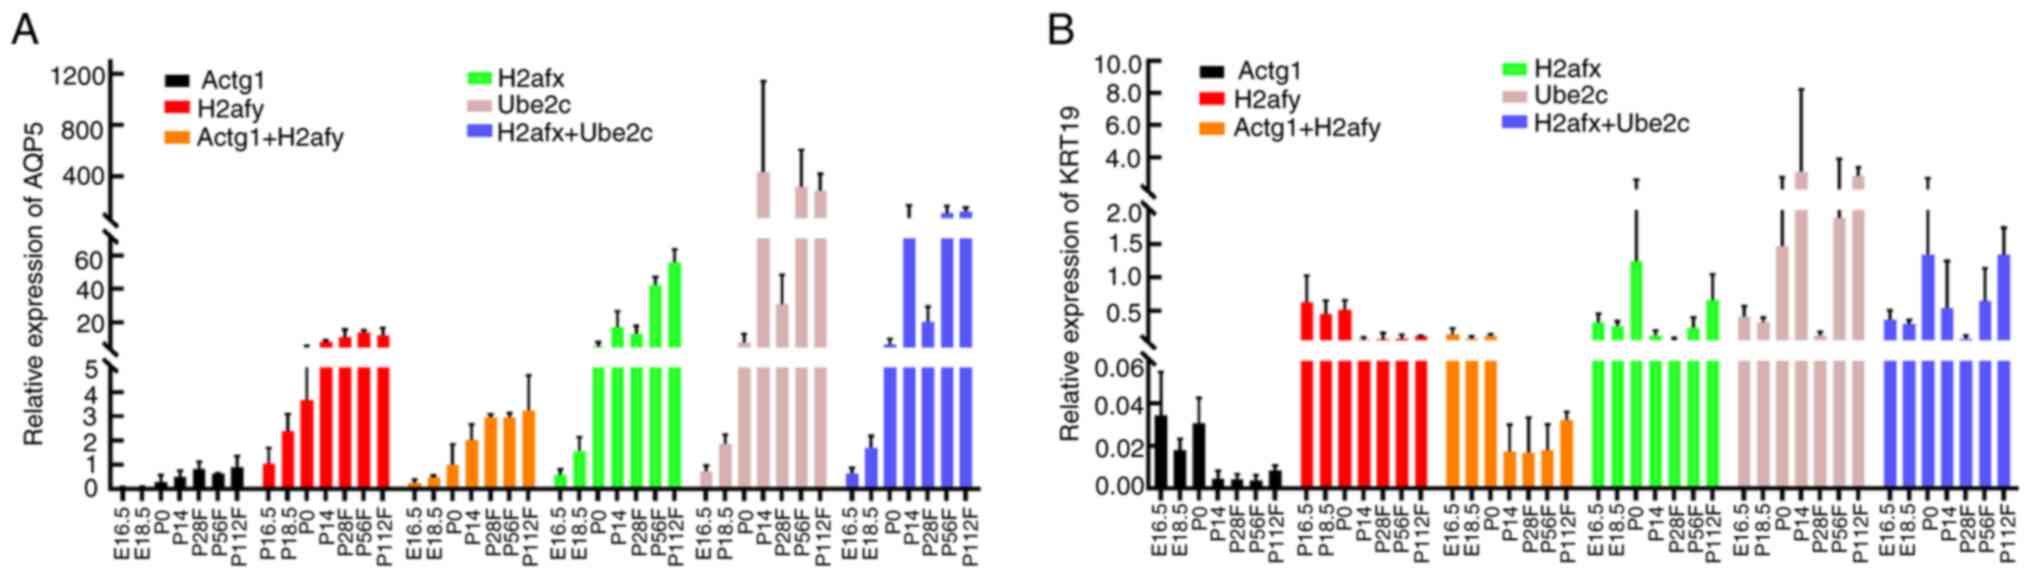
Validation of selected reference
genes
To assess the reliability of the selected reference
gene, the relative expression levels of the target genes,
AQP5 and KRT19, were quantified in SMG developmental
stages using RT-qPCR. The primer specificity of AQP5 and
KRT19 was verified as described for the reference genes
(Table I). The two most stable
reference genes (Actg1 and H2afy) and the two least
stable reference genes (H2afx and Ube2c) identified
using RefFinder software were used either alone or in combination
to normalize the expression levels of AQP5 and KRT19
(Fig. 6).
Regardless of normalization by Actg1 or
H2afy, alone or in combination, similar expression patterns
of AQP5 were obtained. The expression level for AQP5
mRNA was markedly increased from the embryonic stage (E16.5) to the
post-natal stage (P112F), with the highest expression level
observed at the P112F stage. However, the expression patterns of
AQP5 differed when using H2afx or Ube2c
independently or in combination as reference genes for
normalization. The highest expression level of AQP5 appeared
at the P112F stage using either H2afx or in combination with
H2afx as the reference gene for normalization, as well as at
the P14 stage using Ube2c for normalization, while its expression
level significantly decreased at the P28F stage using the two least
stable reference genes for normalization data (Fig. 6A).
Similarly, the KRT19 expression patterns
were relatively the same when using Actg1 or H2afy,
alone or in combination, for normalization. The KRT19 mRNA
expression level peaked at around E16.5 and decreased after birth.
However, when using H2afx or Ube2c independently or
in combination as reference genes for normalization, it was found
that the highest expression level of KRT19 appeared at the
P0 stage (Fig. 6B). Taken
together, these results demonstrate that the selection of a
suitable reference gene is crucial for the accurate normalization
of qPCR data.
Discussion
As the main salivary gland in mammals, the SMG has
been verified as a classical model for studying development and
regeneration (35). However, the
lack of reliable reference genes for normalized target gene
expression may impede understanding of the underlying biology and
molecular mechanisms. The present study investigated the expression
stability of putative candidate reference genes during mouse SMG
development and regeneration of superior reference genes.
The development model of the embryonic period in
the SMG is a consecutive process that includes branching
morphogenesis, lumen formation and mature acinar differentiation.
Studies have indicated that the functional maturity of SMG is
achieved after birth; for example, the differentiation of granular
convoluted tubes begins at P7, the number of tubes increases around
two weeks after birth, and the tubes finally mature at 4-6 weeks
after birth (36,37). To comprehensively monitor the
expression of reference genes throughout the developmental period,
the present study collected samples at 12 time points from the
embryo (E14.5, E15.5, E16.5, E17.5 and E18.5) to the post-natal
stage (P0, P7, P14, P28, P56, P84 and P112), which involves gland
branching, lumen formation, acinar differentiation, gland
maturation, sexual maturity and adulthood in mice. At the same
time, the expression of reference genes was detected in different
regenerative stages of the SMG following the duct
ligation/de-ligation of the SMG model. The main secretory duct
ligation/de-ligation of the SMG is a common model in the research
of regeneration, accompanied by periodic changes associated with
atrophy and the apoptosis of acinar epithelial cells, the
proliferation of duct cells and differentiation of acini to restore
secretion function (4,10). Furthermore, studies have confirmed
that the regeneration of acinar epithelial cells reoccurred during
5-day and 7-day duct ligation (10). Pro-acinar cells were observed
after 7-day de-ligation, and the number of mature acinar cells then
increased after 14-day de-ligation. Finally, the structure and
function of the gland were restored in the 28-day de-ligation
samples. Thus, in the present study, five stages of SMG
regeneration (5-day ligation, 7-day ligation, 7-day de-ligation,
14-day de-ligation and 28-day de-ligation) were used, following
which the expression of the reference genes was representatively
assessed. Moreover, H&E staining and AB/PAS staining were
performed to confirm the successful establishment of the
ligation/de-ligation model (Figs. S2
and S3). In brief, the present study comprehensively examined
the stability of reference genes at different time points during
the development and regeneration of SMG, covering a wide range of
time points, which can provide a good reference for subsequent
glandular studies.
As is known, SYBR-Green RT-qPCR is the preferred
technique to quantify gene expression levels with high specificity,
speed, accuracy, reproducibility, simplicity and sensitivity
(38-40). However, experimental errors can be
introduced due to RNA quality, DNA contamination, gene copy
numbers, PCR amplification efficiency and the reverse transcription
efficiency of test samples (41,42). Thus, to reduce these experimental
errors, a stable reference gene is required to standardize target
gene expression.
Reference genes are less affected by environmental
factors, are widely detected in almost all tissues and are stably
expressed in various stages within organisms. Common reference
genes or nucleotide sequences include Actb, Gapdh,
small ribosomal subunit (18S), ribosomal RNA (rRNA)
and Ubc. However, it has been found that the transcriptional
levels of these reference genes change as per different stages of
the cell cycle, differences in tissues and differences in
experimental conditions (17).
Deindl et al (43)
reported the mRNA level of Actb to be significantly
upregulated during the first 24 h of collateral artery growth in a
rabbit femoral artery ligation model. Furthermore, Suzuki et
al (44) indicated the
pitfalls of using 'classical' reference genes, such as Actb
and Gapdh. Consequently, over the past two decades, a large
number of researchers have paid attention to the stability studies
of reference genes. However, due to technical advancements,
particularly the rapid development of bioinformatics, the selection
of reference genes is becoming increasingly global and systematic.
Therefore, the present study selected a total of 12 candidate
reference genes, namely, Tuba1a, Tuba1b,
Tubb5, H2afy, H2afx, Actb,
Actg1, Ubc, Uba1, Uba52, Ube2c
and Gapdh, based on RNA-Seq data. Compared with SMG rat
studies reported as early as 2008 (45), the present study used a more
statistical method along with basic global data from RNA-Seq to
conduct a systematic analysis of reference genes during SMG
development and regeneration, which provided new guidelines for the
selection of reference genes, while studying the mouse SMG.
The Cq values obtained using RT-qPCR provide a
simple and convenient assessment to pre-emptively provide a rough
estimation for the stability of gene expression. In the present
study, according to the Cq value, it was found that Actb was
abundantly expressed in the SMG development group and sham
operation group, and Actg1 was the most expressed in the
duct ligation/de-ligation group, while Ube2c was the least
expressed in all groups. The aberrant expression of reference genes
leads to intricate evaluation based on Cq values. Thus,
sophisticated mathematical software (geNorm, NormFinder,
BestKeeper, ∆Cq and RefFinder) was used to assess reference gene
stability. However, our results showed that the suitable reference
genes analyzed by geNorm, NormFinder, BestKeeper, and ∆Cq software
were not consistent. In previous studies (46,47), the results have indicated this
variation to partly be due to the different assumptions and
algorithm models of each software (48,49). It was found that the rankings by
NormFinder and ∆Cq were similar, yet different from those assigned
by geNorm and BestKeeper. This was also reported in a previous
study by Herath et al (50). Therefore, RefFinder, a web-based
tool, was used to comprehensively evaluate the stability of the
reference genes. The RefFinder results suggested the most stable
reference gene to be Actg1 in SMG developmental stage and in
the sham operation group. Combining sham operation and duct
ligation/de-ligation group, the most stable reference gene was
Tubb5, the expression of which is involved in the synthesis
of microtubule components and its family members. The Ube2c
and Ubc genes, the products of which participate in protein
kinase activation, DNA repair, and chromatin dynamics, have been
exploited as reference genes for a long time. Both Ube2c and
Ubc were calculated to be the least stable reference gene,
as ranked using geNorm, NormFinder, BestKeeper, ∆Cq and RefFinder
software.
To further confirm the reliability of loading
controls, the present study investigated reference protein
expression levels in SMG development and regeneration using western
blot analysis. Based on the RT-qPCR results, the protein levels of
the products of the most stable reference genes, ACTB and TUBA1B,
in addition to those of the two classical candidates, ubiquitin and
GAPDH, were quantified. Western blot analysis revealed the protein
expression level of β-actin/g-actin to be more stable across all
groups, compared to the expression pattern exhibited by classical
reference proteins such as ubiquitin, TUBA1B and GAPDH. Although
the primers designed to target Actb and Actg1 were
specific, it should be noted that the specific antibody was used to
detect the protein expression level of ACTB and ACTG1 separately
due to slight differences in the amino acid sequence. Additionally,
the antibody against TUBA1B has the same target amino acid sequence
as TUBB5; thus, more specific antibodies are required to
discriminate ideal reference proteins in future research.
To validate the reliability of the selected
reference genes, the expression patterns of AQP5 and
KRT19 under the SMG developmental stage were evaluated. It
is well known that AQP5 is a key water channel and KRT19 is a
cytoskeletal protein; both play important roles in salivary gland
function (51,52). Accordingly, the two most stable
genes (Actg1 and H2afy) and the two least stable
genes (H2afx and Ube2c), as recommended using
RefFinder software under the SMG developmental stage, were used to
verify target gene expression patterns. The results revealed that
when the most stable genes (Actg1, H2afy, and
Actg1 + H2afy) were used to normalize the expression
levels of AQP5 and KRT19, similar expression patterns
were obtained. For example, the highest expression level of
AQP5 and KRT19 appeared at the P112 and P56 stage,
respectively. By contrast, when the least stable genes
(H2afx, Ube2c, and H2afx + Ube2c) were
used to calibrate the expression data, the expression patterns and
transcript levels of AQP5 and KRT19 varied notably.
As per the results, AQP5 had the highest expression level at
the P112 stage, using H2afx and H2afx + Ube2c
genes for normalization, and at the P14 stage, using Ube2c for
normalization. AQP5 expression patterns exhibited a rapid
decrease at the P28F stage when using H2afx, Ube2c,
and H2afx + Ube2c genes for normalization.
Furthermore, KRT19 appeared to have the highest expression
level at the P0 stage when using H2afx, Ube2c, and
H2afx + Ube2c genes for normalization. Previous
studies have demonstrated that using an unstable reference gene
generates biases and may lead to reduced accuracy or misinterpreted
results in the RT-qPCR assay (53-55). These results are in accordance
with such findings. Consequently, the use of reliable reference
genes for normalization is a preliminary requirement for obtaining
accurate relative gene expression levels.
In conclusion, the present study evaluated the
stability of 12 candidate reference genes during SMG development
and regeneration using five statistical algorithms (BestKeeper,
NormFinder, geNorm, ∆Cq and RefFinder). Actg1 was identified
as the most reliable reference gene during the SMG developmental
stage, and Tubb5 was recommended as the most stable
reference gene for the SMG regenerative stage, whereas the least
stable reference genes were Ubc and Ubc2e. The
results obtained in the present study provide useful information
for the generation of accurate RT-qPCR data in gene expression
studies of SMG development and regeneration.
Supplementary Data
Availability of data and materials
The datasets used and/or analyzed during the
current study are available from the corresponding author on
reasonable request. The raw data for this study have been deposited
in the SRA database (accession no. PRJNA856858; to be release on
June 30, 2023).
Authors' contributions
WL, TZ and DY designed the experiments. LH
contributed to the writing of the manuscript. LH, HL, QC, WL and TZ
performed the experiments. LH, HL and QC analyzed the data. LH and
HL confirm the authenticity of all the raw data. All authors have
read and approved the final manuscript.
Ethics approval and consent to
participate
All animal experiments were approved by the Ethics
Committee of Chongqing Medical University College and Use Committee
(approval no. 2021062). The Guidelines for the Ethical Review of
Laboratory Animal Welfare (GB/T35892-2018, China) were applied in
the experiments. The study was conducted according to the
guidelines of ARRIVE and AVMA euthanasia 2020, and followed the
'3R' principles for the treatment of experimental animals:
Replacement, reduction and refinement.
Patient consent for publication
Not applicable.
Competing interests
The authors declare that they have no competing
interests.
Acknowledgments
Not applicable.
Funding
The present study was supported in part by research grants from
the Project Supported by the National Natural Science Foundation of
China (nos. 31970783 and 32070539), the Program for Top talent
Distinguished Professor from Chongqing Medical University [no.
(2021)215], the Program for Youth Innovation in Future Medicine
from Chongqing Medical University (no. W0060), and the Scientific
and Technological Research Program of Chongqing Municipal Education
Commission (no. KJZD-K201900402).
Abbreviations:
|
SMG
|
submandibular gland
|
|
SLG
|
sublingual gland
|
|
PG
|
parotid gland
|
|
Sox2
|
sex-determining region Y
|
|
TGF-β1
|
transforming growth factor β1
|
|
Shh
|
activation sonic hedgehog
|
|
Actb
|
β-actin
|
|
Gapdh
|
glyceraldehyde-3-phosphate
dehydrogenase
|
|
AQP5
|
aquaporin 5
|
|
KRT19
|
keratin 19
|
|
H&E
|
hematoxylin and eosin
|
|
AB/PAS
|
Alcian blue and periodic acid-Schiff
staining
|
|
FPKM
|
fragments per kilobase of exon model
per million mapped fragments
|
|
SD
|
standard deviation
|
|
CV
|
coefficient of variation
|
|
18S
|
small ribosomal subunit
|
|
rRNA
|
ribosomal RNA
|
References
|
1
|
Proctor GB: The physiology of salivary
secretion. Periodontol 2000. 70:11–25. 2016. View Article : Google Scholar
|
|
2
|
Emmerson E and Knox SM: Salivary gland
stem cells: A review of development, regeneration and cancer.
Genesis. 56:e232112018. View Article : Google Scholar : PubMed/NCBI
|
|
3
|
Miletich I: Introduction to salivary
glands: Structure, function and embryonic development. Front Oral
Biol. 14:1–20. 2010. View Article : Google Scholar : PubMed/NCBI
|
|
4
|
Hosoi K, Yao C, Hasegawa T, Yoshimura H
and Akamatsu T: Dynamics of salivary gland AQP5 under normal and
pathologic conditions. Int J Mol Sci. 21:11822020. View Article : Google Scholar :
|
|
5
|
Gresik EW, Chung KW, Barka T and Schenkein
I: Immunocytochemical localization of nerve growth factor,
submandibular glands of Tfm/Y mice. Am J Anat. 158:247–250. 1980.
View Article : Google Scholar : PubMed/NCBI
|
|
6
|
Schenck K, Schreurs O, Hayashi K and
Helgeland K: The role of nerve growth factor (NGF) and its
precursor forms in oral wound healing. Int J Mol Sci. 18:3862017.
View Article : Google Scholar :
|
|
7
|
Suzuki A, Ogata K and Iwata J: Cell
signaling regulation in salivary gland development. Cell Mol Life
Sci. 78:3299–3315. 2021. View Article : Google Scholar : PubMed/NCBI
|
|
8
|
Wang Y, Dong J, Li D, Lai L, Siwko S, Li Y
and Liu M: Lgr4 regulates mammary gland development and stem cell
activity through the pluripotency transcription factor Sox2. Stem
Cells. 31:1921–1931. 2013. View Article : Google Scholar : PubMed/NCBI
|
|
9
|
Patel N, Sharpe PT and Miletich I:
Coordination of epithelial branching and salivary gland lumen
formation by Wnt and FGF signals. Dev Biol. 358:156–167. 2011.
View Article : Google Scholar : PubMed/NCBI
|
|
10
|
Hishida S, Ozaki N, Honda T, Shigetomi T,
Ueda M, Hibi H and Sugiura Y: Atrophy of submandibular gland by the
duct ligation and a blockade of SP receptor in rats. Nagoya J Med
Sci. 78:215–227. 2016.PubMed/NCBI
|
|
11
|
Woods LT, Camden JM, El-Sayed FG,
Khalafalla MG, Petris MJ, Erb L and Weisman GA: Increased
expression of TGF-β signaling components in a mouse model of
fibrosis induced by submandibular gland duct ligation. PLoS One.
10:e01236412015. View Article : Google Scholar
|
|
12
|
Tran ON, Wang H, Dean DD, Chen XD and Yeh
CK: Stem cell-based restoration of salivary gland function. A
Roadmap to Nonhematopoietic Stem Cell-Based Therapeutics: From the
Bench to the Clinic. Elsevier; pp. 345–66. 2019, View Article : Google Scholar
|
|
13
|
Shimizu O, Yasumitsu T, Shiratsuchi H, Oka
S, Watanabe T, Saito T and Yonehara Y: Immunolocalization of FGF-2,
-7, -8, -10 and FGFR-1-4 during regeneration of the rat
submandibular gland. J Mol Histol. 46:421–429. 2015. View Article : Google Scholar : PubMed/NCBI
|
|
14
|
Baum BJ, Alevizos I, Chiorini JA, Cotrim
AP and Zheng C: Advances in salivary gland gene therapy - oral and
systemic implications. Expert Opin Biol Ther. 15:1443–1454. 2015.
View Article : Google Scholar : PubMed/NCBI
|
|
15
|
González CR, Amer MA, Vitullo AD,
González-Calvar SI and Vacas MI: Immunolocalization of the TGFB1
system in submandibular gland fibrosis after experimental
periodontitis in rats. Acta Odontol Latinoam. 29:138–143.
2016.PubMed/NCBI
|
|
16
|
Hai B, Zhao Q, Qin L, Rangaraj D, Gutti VR
and Liu F: Rescue effects and underlying mechanisms of intragland
shh gene delivery on irradiation-induced hyposalivation. Hum Gene
Ther. 27:390–399. 2016. View Article : Google Scholar : PubMed/NCBI
|
|
17
|
Wang B, Duan H, Chong P, Su S, Shan L, Yi
D, Wang L and Li Y: Systematic selection and validation of suitable
reference genes for quantitative real-time PCR normalization
studies of gene expression in Nitraria tangutorum. Sci Rep.
10:158912020. View Article : Google Scholar : PubMed/NCBI
|
|
18
|
Yang NY, Mukaibo T, Kurtz I and Melvin JE:
The apical Na+-HCO3− cotransporter
Slc4a7 (NBCn1) does not contribute to bicarbonate transport by
mouse salivary gland ducts. J Cell Physiol. 10:10022019.
|
|
19
|
Tanaka J, Ogawa M, Hojo H, Kawashima Y,
Mabuchi Y, Hata K, Nakamura S, Yasuhara R, Takamatsu K, Irié T, et
al: Generation of orthotopically functional salivary gland from
embryonic stem cells. Nat Commun. 9:42162018. View Article : Google Scholar : PubMed/NCBI
|
|
20
|
Zhang Y, Fan J, Sun J, Francis F and Chen
J: Transcriptome analysis of the salivary glands of the grain
aphid, Sitobion avenae. Sci Rep. 7:159112017. View Article : Google Scholar : PubMed/NCBI
|
|
21
|
Ruan W and Lai M: Actin, a reliable marker
of internal control? Clin Chim Acta. 385:1–5. 2007. View Article : Google Scholar : PubMed/NCBI
|
|
22
|
Bunnell TM, Burbach BJ, Shimizu Y and
Ervasti JM: β-actin specifically controls cell growth, migration,
and the G-actin pool. Mol Biol Cell. 22:4047–4058. 2011. View Article : Google Scholar : PubMed/NCBI
|
|
23
|
Guo C, Liu S, Wang J, Sun MZ and Greenaway
FT: ACTB in cancer. Clin Chim Acta. 417:39–44. 2013. View Article : Google Scholar
|
|
24
|
Binarová P and Tuszynski J: Tubulin:
Structure, functions and roles in disease. Cells. 8:12942019.
View Article : Google Scholar :
|
|
25
|
Nicholls C, Li H and Liu JP: GAPDH: A
common enzyme with uncommon functions. Clin Exp Pharmacol Physiol.
39:674–679. 2012. View Article : Google Scholar
|
|
26
|
Seidler NW: Basic biology of GAPDH. Adv
Exp Med Biol. 985:1–36. 2013. View Article : Google Scholar
|
|
27
|
Zhang JY, Zhang F, Hong CQ, Giuliano AE,
Cui XJ, Zhou GJ, Zhang GJ and Cui YK: Critical protein GAPDH and
its regulatory mechanisms in cancer cells. Cancer Biol Med.
12:10–22. 2015.PubMed/NCBI
|
|
28
|
Chen ZJ and Sun LJ: Nonproteolytic
functions of ubiquitin in cell signaling. Mol Cell. 33:275–286.
2009. View Article : Google Scholar : PubMed/NCBI
|
|
29
|
Livak KJ and Schmittgen TD: Analysis of
relative gene expression data using real-time quantitative PCR and
the 2(-Delta Delta C(T)) method. Methods. 25:402–408. 2001.
View Article : Google Scholar
|
|
30
|
Ramakers C, Ruijter JM, Deprez RH and
Moorman AF: Assumption-free analysis of quantitative real-time
polymerase chain reaction (PCR) data. Neurosci Lett. 339:62–66.
2003. View Article : Google Scholar : PubMed/NCBI
|
|
31
|
Vandesompele J, De Preter K, Pattyn F,
Poppe B, Van Roy N, De Paepe A and Speleman F: Accurate
normalization of real-time quantitative RT-PCR data by geometric
averaging of multiple internal control genes. Genome Biol.
3:RESEARCH00342002. View Article : Google Scholar : PubMed/NCBI
|
|
32
|
Andersen CL, Jensen JL and Ørntoft TF:
Normalization of real-time quantitative reverse transcription-PCR
data: A model-based variance estimation approach to identify genes
suited for normalization, applied to bladder and colon cancer data
sets. Cancer Res. 64:5245–5250. 2004. View Article : Google Scholar : PubMed/NCBI
|
|
33
|
Pfaffl MW, Tichopad A, Prgomet C and
Neuvians TP: Determination of stable housekeeping genes,
differentially regulated target genes and sample integrity:
BestKeeper-excel-based tool using pair-wise correlations.
Biotechnol Lett. 26:509–515. 2004. View Article : Google Scholar : PubMed/NCBI
|
|
34
|
Xie F, Xiao P, Chen D, Xu L and Zhang B:
miRDeepFinder: A miRNA analysis tool for deep sequencing of plant
small RNAs. Plant Mol Biol. 31:10072012.
|
|
35
|
Chatzeli L, Teshima THN, Hajihosseini MK,
Gaete M, Proctor GB and Tucker AS: Comparing development and
regeneration in the submandibular gland highlights distinct
mechanisms. J Anat. 238:1371–1385. 2021. View Article : Google Scholar : PubMed/NCBI
|
|
36
|
Gresik EW: Postnatal developmental changes
in submandibular glands of rats and mice. J Histochem Cytochem.
28:860–870. 1980. View Article : Google Scholar : PubMed/NCBI
|
|
37
|
Srinivasan R and Chang WW: The development
of the granular convoluted duct in the rat submandibular gland.
Anat Rec. 182:29–39. 1975. View Article : Google Scholar : PubMed/NCBI
|
|
38
|
Borkowska P, Zielińska A, Paul-Samojedny
M, Stojko R and Kowalski J: Evaluation of reference genes for
quantitative real-time PCR in Wharton's Jelly-derived mesenchymal
stem cells after lentiviral transduction and differentiation. Mol
Biol Rep. 47:1107–1115. 2020. View Article : Google Scholar
|
|
39
|
Li Z, Lu H, He Z, Wang C, Wang Y and Ji X:
Selection of appropriate reference genes for quantitative real-time
reverse transcription PCR in Betula platyphylla under salt and
osmotic stress conditions. PLoS One. 14:e02259262019. View Article : Google Scholar : PubMed/NCBI
|
|
40
|
Wu Y, Tian Q, Huang W, Liu J, Xia X, Yang
X and Mou H: Identification and evaluation of reference genes for
quantitative real-time PCR analysis in Passiflora edulis under stem
rot condition. Mol Biol Rep. 47:2951–2962. 2020. View Article : Google Scholar : PubMed/NCBI
|
|
41
|
Zhu J, Zhang L, Li W, Han S, Yang W and Qi
L: Reference gene selection for quantitative real-time PCR
normalization in Caragana intermedia under different abiotic stress
conditions. PLoS one. 8:e531962013. View Article : Google Scholar : PubMed/NCBI
|
|
42
|
Li J, Han X, Wang C, Qi W, Zhang W, Tang L
and Zhao X: Validation of suitable reference genes for RT-qPCR data
in achyranthes bidentata blume under different experimental
conditions. Front Plant Sci. 8:7762017. View Article : Google Scholar :
|
|
43
|
Deindl E, Boengler K, van Royen N and
Schaper W: Differential expression of GAPDH and beta3-actin in
growing collateral arteries. Mol Cell Biochem. 236:139–146. 2002.
View Article : Google Scholar : PubMed/NCBI
|
|
44
|
Suzuki T, Higgins PJ and Crawford DR:
Control selection for RNA quantitation. Biotechniques. 29:332–337.
2000. View Article : Google Scholar : PubMed/NCBI
|
|
45
|
Silver N, Cotroneo E, Proctor G, Osailan
S, Paterson KL and Carpenter GH: Selection of housekeeping genes
for gene expression studies in the adult rat submandibular gland
under normal, inflamed, atrophic and regenerative states. BMC Mol
Biol. 9:642008. View Article : Google Scholar : PubMed/NCBI
|
|
46
|
Chen L, Zhong HY, Kuang JF, Li JG, Lu WJ
and Chen JY: Validation of reference genes for RT-qPCR studies of
gene expression in banana fruit under different experimental
conditions. Planta. 234:377–390. 2011. View Article : Google Scholar : PubMed/NCBI
|
|
47
|
Cheng Y, Bian W, Pang X, Yu J, Ahammed GJ,
Zhou G, Wang R, Ruan M, Li Z, Ye Q, et al: Genome-wide
identification and evaluation of reference genes for quantitative
RT-PCR analysis during tomato fruit development. Front Plant Sci.
8:14402017. View Article : Google Scholar : PubMed/NCBI
|
|
48
|
Costa J, Saraiva K, Morais V, Oliveira J,
Sousa D, Melo D, Morais J and Vasconcelos I: Reference gene
identification for real-time PCR analyses in soybean leaves under
fungus (Cercospora kikuchii) infection and treatments with
salicylic and jasmonic acids. Australasian Plant Pathology.
45:191–199. 2016. View Article : Google Scholar
|
|
49
|
Zhang Y, Peng X, Liu Y, Li Y, Luo Y, Wang
X and Tang H: Evaluation of suitable reference genes for qRT-PCR
normalization in strawberry (Fragaria x ananassa) under different
experimental conditions. BMC Mol Biol. 19:82018. View Article : Google Scholar
|
|
50
|
Herath S, Dai H, Erlich J, Au AY, Taylor
K, Succar L and Endre ZH: Selection and validation of reference
genes for normalisation of gene expression in ischaemic and
toxicological studies in kidney disease. PLoS One. 15:e02331092020.
View Article : Google Scholar : PubMed/NCBI
|
|
51
|
Matsuzaki T, Suzuki T, Koyama H, Tanaka S
and Takata K: Aquaporin-5 (AQP5), a water channel protein, in the
rat salivary and lacrimal glands: Immunolocalization and effect of
secretory stimulation. Cell Tissue Res. 295:513–521. 1999.
View Article : Google Scholar : PubMed/NCBI
|
|
52
|
Hauser BR and Hoffman MP: Regulatory
mechanisms driving salivary gland organogenesis. Curr Top Dev Biol.
115:111–130. 2015. View Article : Google Scholar : PubMed/NCBI
|
|
53
|
Li C, Hu L, Wang X, Liu H, Tian H and Wang
J: Selection of reliable reference genes for gene expression
analysis in seeds at different developmental stages and across
various tissues in Paeonia ostii. Mol Biol Rep. 46:6003–6011. 2019.
View Article : Google Scholar : PubMed/NCBI
|
|
54
|
Dos Santos CP, da Cruz Saraiva KD, Batista
MC, Germano TA and Costa JH: Identification and evaluation of
reference genes for reliable normalization of real-time
quantitative PCR data in acerola fruit, leaf, and flower. Mol Biol
Rep. 47:953–965. 2020. View Article : Google Scholar
|
|
55
|
Wang X, Wu Z, Bao W, Hu H, Chen M, Chai T
and Wang H: Identification and evaluation of reference genes for
quantitative real-time PCR analysis in Polygonum cuspidatum based
on transcriptome data. BMC Plant Biol. 19:4982019. View Article : Google Scholar : PubMed/NCBI
|