Introduction
Inflammatory bowel disease (IBD), including Crohn's
disease (CD) and ulcerative colitis, is a chronic idiopathic
inflammatory disease of gastrointestinal tract with unknown
etiology and recurrent episodes (1). IBD might be the result of a complex
interaction between genetic susceptibility, environmental factors
and intestinal microflora (2).
Autophagy is a conserved cellular process that delivers cytoplasmic
material and organelles to lysosomes for breakdown, which plays a
key role for cellular renovation and homeostasis (3). A number of studies have also shown
that autophagy is involved in regulation of IBD. Impaired autophagy
leads to impaired protection against intestinal infection, abnormal
Paneth cells morphology, inhibition of intestinal stem cells
proliferation and accelerated intestinal epithelial cells (IECs)
apoptosis (4). Autophagy related
gene 7 knockdown in mice decreases intestinal tight junction
proteins levels, exacerbating inflammation of intestinal tract
(5). Moreover, knockdown of
ATG16L1, a gene associated with autophagy, enhances inflammation
and accelerates epithelial cells death in mice (6). In addition, promoting IECs
autophagy alleviates colitis in mice (7).
Metabolism provides energy and biomass for
maintaining cellular function and proliferation. IECs use oxidative
phosphorylation to meet metabolism demand generally. The impaired
mitochondrial function in IBD leads to a shift in IECs energy
metabolism from oxidative phosphorylation to glycolysis (8-10). Increased glycolysis levels are
observed in the colonic epithelium in patients with IBD (11,12). Meanwhile, the metabolomics
analysis of mouse colitis model showed that the level of lactic
acid, a metabolite of glycolysis, was increased (13). Inhibition of IECs glycolysis
could alleviate colitis in mice and recover intestinal barrier
function (14,15).
In the present study, impaired autophagy and
abnormal glycolysis levels were observed in the colonic IECs of
DSS-induced colitis mice and TNF-α treated NCM460 cells.
Subsequently, it demonstrated that autophagy negatively regulated
the glycolysis of intestinal epithelial cells by ubiquitin-mediated
selective degradation of the key glycolytic enzyme
6-phosphofructo-2-kinase/fructose-2,6-bisphosphatase 3 (PFKFB3).
Furthermore, inhibition of PFKFB3 enzyme activity relieved DSS
induced intestinal inflammation and intestinal epithelial barrier
damage.
Materials and methods
Antibodies and reagents
All antibodies were used at a dilution of 1:1,000
unless otherwise indicated. The antibodies were: Anti-Flag (cat.
no. 20543-1-AP), anti-β-actin (cat. no. 20536-1-AP),
anti-P62/SQSTM1 (cat. no. 18420-1-AP), anti-occludin (cat. no.
27260-1-AP), anti-claudin-1 (cat. no. 13050-1-AP), anti-fizzy and
cell division cycle 20 related 1 (FZR1/Cdh1) (cat. no. 16368-1-AP),
anti-claudin-2 (cat. no. 26912-1-AP) from Proteintech Group, Inc.;
anti-LC3B (cat. no. 2775S), anti-E-cadherin (cat. no. 14472S) from
Cell Signaling Technology, Inc.; anti-ATG7 (WL02793),
anti-phosphofructokinase, muscle 2 (PKM2; cat. no. WL03290) from
Wanleibio Co., Ltd.; anti-PFKP (cat. no. HA500472) from HUABIO;
anti-hexokinase 2 (HK2; cat. no. CQA9312) from Cohesion
Biosciences; anti-lactate dehydrogenase (LDHA; cat. no. ab52488)
and anti-PFKFB3 (cat. no. ab181861) from Abcam; anti-GAPDH (cat.
no. TA310153) from OriGene Technologies, Inc.; anti-Claudin-5 (cat.
no. AF5216) from Affinity Biosciences; anti-Claudin-8 (cat. no.
GTX77832) from GeneTex, Inc.; anti-K48-linkage specific ubiquitin
(cat. no. bsm-63005R) and anti-K63-linkage specific ubiquitin (cat.
no. bsm-63006R) from BIOSS. Glucose Content Assay Kit (cat. no.
BC2505), Lactic Acid (LA) Content Assay Kit (cat. no. BC2235),
Phosphofructokinase (PFK) Activity Assay Kit (cat. no. BC0535) and
2',7'-bis(carboxyethyl)-5(6)-carboxyfluorescein (BCECF; cat. no.
IB1750) were purchased from Beijing Solarbio Science &
Technology Co., Ltd.. PFKFB3 inhibitor PFK15 (cat. no. S7289),
autophagy agonists Rapamycin (cat. no. S1039), autophagy inhibitor
Bafilomycin A1 (Baf-A1; cat. no. (S1413) was purchased from Selleck
Chemicals. TNF-α (HY-P70426A) was purchased from MedChemExpress.
2-NBDG (cat. no. 72987) was purchased from MilliporeSigma. Fetal
bovine serum and DMEM were purchased from Sangon Biotech Co.,
Ltd.
Animal models
A total of 50 C57BL/6 mice (male, 6-8 weeks old and
23-26 g) were purchased from the Experiment Animal Center (Third
Military Medical University, Chongqing, China) for use in the in
vivo experiments. The C57BL/6 mice were housed under controlled
environmental conditions with a temperature of 26°C, relative
humidity of 60% and a 12-h light/dark cycle. Acute colitis was
induced by administration of 2.5% dextran sulphate sodium (DSS),
which was dissolved in the animals' drinking water, for 7 days.
Chronic colitis was induced by administration of 2% DSS, which was
dissolved in the drinking water for 21 days. Control mice were
provided with distilled water. PFK15 (25 mg/kg) was administered by
intraperitoneal injection daily, beginning on the first day of DSS
administration. Body weight and stool blood were monitored and
recorded every day during DSS feeding. All mice were anesthetized
via continuous inhalation of 5% isoflurane for 2 min prior to
euthanasia by cervical dislocation. All animal experiments were
conducted in accordance with institutional guidelines and approved
by the Laboratory Animal Welfare and Ethics Committee of the Third
Military Medical University (approval no. AMUWEC20224496).
IEC isolation
The whole colon intestine was removed and placed in
tissue culture medium (RPMI 1640, with 10% fetal bovine serum;
Sangon Biotech Co., Ltd.). The section was cut into 5-mm pieces,
washed in an isolation buffer containing 190 mg
ethylenediaminetetraacetic acid and 80 mg Dithiothreitol (DTT)
dissolved in phosphate-buffered saline (PBS) 500 ml and incubated
in the same buffer with continuous brisk stirring at 37°C for 30
min. The supernatant was filtered rapidly through 70 and 30
μm filter screen. Following centrifugation at 600 × g for 5
min at 37°C, the cells recovered in the suspension were collected
for RNA or protein extraction. Intestinal epithelial cell isolation
was used for western blotting and reverse
transcription-quantitative (RT-q) PCR.
Cell culture and transfection
The normal intestinal epithelium cell line NCM460
was purchased from the American Type Culture Collection (ATCCSA).
Cells were cultured in Dulbecco's modified Eagle's medium (DMEM)
supplemented with 10% fetal bovine serum (FBS), 1%
Penicillin-streptomycin solution. The dry powder small interfering
(si)RNA was dissolved in sterile, nuclease-free water (cat. no.
R1600; Beijing Solarbio Science & Technology Co., Ltd.) to a
concentration of 20 μM. Cell transfection with siRNA was
performed following the manufacturer's instructions for the
riboFECT CP (cat. no. C10502-05; Guangzhou RiboBio Co., Ltd.)
Transfection Kit. The procedure is outlined as follows: Seed
5×10⁵ cells into 6-well plates, then prepare a
transfection mixture by combining 100 μl of transfection
buffer, 100 nM siRNA, and 12 μl of transfection reagent.
Incubate the mixture at 25°C for 15 min before adding it to the
cells. After 12 h of co-incubation of the cells with the mixture,
replace the culture medium. Following medium replacement, continue
culturing the cells for an additional 48 h, and then evaluate the
gene silencing effect using qPCR and western blotting. The negative
control siRNA is transfected into the cells using an identical
transfection protocol. The siRNA was constructed by Sangon Biotech
Co., Ltd. The siRNA used were: siPFKFB3 no.1 sense:
(5'-CGUGUCGGUUCCAUUCCAUUU-3'); siPFKFB3 no.2 sense:
(5'-ACCCGCUCAUGAGACGCAAUA-3'); siPFKFB3 no.3 sense:
(5'-GGGACUUGUCGCUGAUCAAGG-3'); siATG7 sense:
(5'-CCCAGCUAUUGGAACACUGUA-3'); negative control siRNA sense:
(5'-UUCUCCGAACGUGUCACGU-3').
Short hairpin (sh)RNA and siRNA
For stable ATG7 siRNA, PFKFB3 siRNA, FZR1 siRNA
expression, the retroviral encoding hairpin RNA sequences were
constructed. shRNA sequence against ATG7, PFKFB3, FZR1 were
generated and cloned into the expression vector. Recombinant
lentiviruses expressing GFP-tagged shATG7, shPFKFB3 were
constructed by Sangon Biotech Co., Ltd. The lentiviral expressing
shFZR1, PFKFB3(NM_004566)-PCDH-PURO-3XFlag, SQSTM1(N
M_003900)-PCDH-PURO-3XFlag and FZR1 (NM_0011361
98)-PCDH-GFP+PURO-3XFlag were constructed by YouBio.
psPAX2 (cat no. VT1444) and pMD2.G (cat no. VT1443) were purchased
from YouBio. Polyethylenimine (PEI) (cat no. 306185) was purchased
from MilliporeSigma. The 293T cell line (cat no. CL-0005) was
obtained from Procell and used in experiments after culture for at
least three generations. The transfection reagents were prepared in
advance as follows: A solution (psPAX2 8.34 μg, pMD2.G 2.52
μg, DMEM 481.1 μl); B solution (lentiviral plasmid
8.04 μg, PEI 59.7 μg, DMEM 440.3 μl). The A
solution was mixed with the B solution at room temperature and
incubated for 15 min. The mixture was added to a 10 cm culture dish
containing 293T cells at 60-70% confluence, and incubated at 37°C
for 12 h. The supernatant was removed and the cells washed twice
with PBS and 10 ml of complete DMEM medium added. Culture was
continued at 37°C for an additional 48 h. The supernatant was
collected and transferred it into a 15 ml centrifuge tube then
centrifuged at 200 × g and 25°C for 5 min. Concurrently, the
supernatant was filtered through a 0.45 μm pore-size filter
membrane (cat no. SLHVM33RS; MilliporeSigma). The viral stock
solution was concentrated with 100 kDa Millipore ultrafiltration
tubes (cat no. UFC9100; MilliporeSigma) and stored at −80°C.
Concentrated viruses (10 MOI) were used to infect 5×10⁵
cells in a 6 cm dish. Infected cells underwent sorting by 2
μg/ml puromycin for 48 h for stably target expression. The
shRNA used were: shATG7 (5'-CCCAGCTATTGGAACACTGTA-3'); shPFKFB3
no.1 (5'-CGTGTCGGTTCCATTCCATTT-3'); shPFKFB3 no.2
(5'-ACCCGCTCATGAGACGCAATA-3'); shPFKFB3 no.3
(5'-GGGACTTGTCGCTGATCAAGG-3'); shFZR1
(5'-GTGAACTTCCACAGGATTAAC-3')
Metabolite measurements
Glucose content in cell was measured using
colorimetric kits (cat. no. BC2505; Beijing Solarbio Science &
Technology Co., Ltd.) and lactic acid content in the culture
supernatants was measured using colorimetric kits (cat. no. BC2235;
Beijing Solarbio Science & Technology Co., Ltd.) according to
the manufacturer's instructions. The absorbance of glucose was
measured at 505 nm and lactic acid was measured at 570 nm using a
SpectraMax M2 microplate reader (Molecular Devices, LLC).
Phosphofructokinase (PFK) activity in cell was measured using
colorimetric kits (cat. no. BC0535; Beijing Solarbio Science &
Technology Co., Ltd.) according to the manufacturer's instructions.
The absorbance of phosphofructokinase-1 (PFK-1) was measured at 340
nm using a SpectraMax M2 microplate reader (Molecular Devices,
LLC). All experiments were performed in triplicate as described
previously.
RT-qPCR
Total cellular RNA was extracted from
5×10⁵ cells in a 6 cm dish with RNAiso Plus (Takara Bio,
Inc.) and used the Advantage RT-for-PCR Kit (Takara Bio, Inc.) for
reverse transcription. The procedure was performed as follows:
First, RNAiso Plus (1 ml) was added to the cell pellet to ensure
complete cell lysis. Next, 200 μl of chloroform was added,
mixed thoroughly and centrifuged at 15,000 × g for 15 min at 4°C.
Then, transfer the aqueous phase and mix with an equal volume of
isopropanol to precipitate RNA, followed by centrifugation at
15,000 × g for 10 min at 4°C. After centrifugation, the supernatant
was carefully discarded and the RNA pellet washed twice with
absolute ethyl alcohol to remove impurities. Finally, the pellet
was briefly air-dried to remove residual ethanol and the resulting
white precipitate dissolved in RNase-free water. The purified
material represented the total RNA extracted from the cells. RNA
was converted into cDNA through reverse transcription reaction on
the Applied Biosystems thermal cycler (Thermo Fisher Scientific,
Inc.). The reverse transcription reaction was performed as follows:
Incubation at 37°C for 15 min, followed by enzyme inactivation at
85°C for 5 sec and storage at 4°C for 10 min. qPCR was performed
using the SYBRPrime qPCR kit (cat. no. BG0014; BioGround Corp.)
under the following conditions: Initial pre-denaturation at 94°C
for 20 sec, followed by 40 cycles of denaturation at 94°C for 10
sec and annealing and extension at 60°C for 30 sec. Relative
quantitation of all transcripts was calculated using the
comparative Ct method with β-actin as an internal control (16). This assay was performed in
triplicate. The primers used for detection are in Table I.
 | Table IPrimers used in quantitative PCR. |
Table I
Primers used in quantitative PCR.
| Gene | Sequence |
|---|
| PFKP | F:
5'-GGAGTGGAGTGGGCTGCTGGAG-3' |
| R:
5'-CATGTCGGTGCCGCAGAAATCA-3' |
| LDHA | F:
5'-ATGGCAACTCTAAAGGATCAGC-3' |
| R:
5'-CCAACCCCAACAACTGTAATCT-3' |
| HK2 | F:
5'-CATCCAGAGGAGAGGGGACT-3' |
| R:
5'-TCATCGCCTTCCACCATGTC-3' |
| PKM2 | F:
5'-CTGTGGACTTGCCTGCTGTG-3' |
| R:
5'-TGCCTTGCGGATGAATGACG-3' |
| PFKFB3 | F:
5'-CAGTTGTGGCCTCCAATATC-3' |
| R:
5'-GGCTTCATAGCAACTGATCC-3' |
| GAPDH | F:
5'-CCTTCCGTGTCCCCACT-3' |
| R:
5'-GCCTGCTTCACCACCTTC-3' |
| ATG7 | F:
5'-GTTGTTTGCTTCCGTGAC-3' |
| R:
5'-TGCCTCCTTTCTGGTTCT-3' |
| IL-1β | F:
5'-AGTTGACGGACCCCAAA-3' |
| R:
5'-TCTTGTTGATGTGCTGCTG-3' |
| IL-6 | F:
5'-ACAGAAGGAGTGGCTAAGGA-3' |
| R:
5'-AGGCATAACGCACTAGGTTT-3' |
| TNF-α | F:
5'-CCACCACGCTCTTCTGTCTACTG-3' |
| R:
5'-GGGCTACGGGCTTGTCACTC-3' |
Immunoblot and immunoprecipitation
For immunoblotting, 5×10⁶ Cells were
lysed by 300 μl RIPA buffer (cat. no. R0020; Beijing
Solarbio Science & Technology Co., Ltd.) supplemented with 3
μl protease inhibitor cocktail (cat. no. P0100-01; Beijing
Solarbio Science & Technology Co., Ltd.) for 30 min at 4°C.
Then, it was centrifuged at 4°C and 12,000 × g for 10 min. The
protein was denatured by adding 5X SDS loading buffer and boiled at
100°C for 10 min, then separated by sodium dodecyl-sulfate
polyacrylamide gel electrophoresis (SDS-PAGE). β-actin antibody and
the target protein antibody were diluted separately in primary
antibody dilution buffer (cat no. C1240; Applygen) at 1:1,000,
followed by overnight incubation at 4°C. On the following day, the
goat anti-rabbit IgG secondary antibody (cat no. BA1056; Wuhan
Boster Biological Technology, Ltd.) was diluted in secondary
antibody diluent buffer (cat no. C1241; Applygen) at 1:5,000 and
incubated at 37°C for 1 h before being washed three times with PBST
buffer, 5 min per wash. The PBST solution was prepared by adding
500 μl of Tween 20 to 500 ml of phosphate-buffered saline
(PBS). Immunodetection was performed by enhanced chemiluminescence
(ECL System; Azure Biosystems, Inc.). For immunoprecipitation
assays, the cells were washed and collected with cold PBS from 10
cm dish. Cells were collected into a 1.5 ml Eppendorf (EP) tube
(cat no. FTUB015; Beyotime Biotechnology) and placed the tube on
ice for pre-cooling. Freshly prepared 0.3% IP lysis buffer (1 ml)
containing protease inhibitor cocktail was added, mixed gently by
inverting or pipetting and incubated at 4°C on a rotating mixer for
60 min at a moderate to slightly increased rotation speed. After
completed lysis, the EP tube was kept on ice and followed by
ultrasonic homogenization using the following settings: 20%
amplitude, 1-sec pulse duration, 1-sec interval, for a total of 30
cycles. Subsequently, the sample was centrifuged at 4°C and 15,000
× g for 10 min. The supernatant was carefully collected without
disturbing the pellet and transferred to a new pre-chilled EP tube.
A total of 300 μl of the supernatant was taken as the Input
sample, 75 μl of 5X Loading Buffer added and mixed
thoroughly and boiled in a water bath at 100°C for 10 min. The
sample was immediately transferred to −80°C for long-term storage.
The remaining supernatant was divided equally into two portions,
which were then incubated overnight at 4°C on a rotator with either
the target primary antibody (2 μg) or the immunoglobin G
(IgG) control antibody (1 μl), respectively. The following
day, 30 μl of Protein A/G magnetic bead suspension was added
to each tube and incubated with rotation at 4°C for 4 h. After
incubation, the tubes were placed on a magnetic stand to immobilize
the beads, then carefully aspirated the supernatant. The beads were
washed by adding 1 ml of 0.1% IP lysis buffer to each tube,
followed by rotating incubation at a slightly increased speed for 5
min. The washing procedure was repeated five times. After the final
wash the was complete removal of residual liquid. Subsequently, 20
μl of 2X loading buffer was added to each tube to thoroughly
resuspend the magnetic beads, the samples boiled at 100°C for 10
min, and immediately transferred to −80°C for storage until further
use for western blot analysis. The IP lysis buffer was prepared by
mixing 10% NP-40, 1 M Tris-HCl, 5 M NaCl, 0.5 M EDTA, and deionized
water (ddH2O) to final concentrations in accordance with
standard immunoprecipitation protocols.
Detection of protein stability by the
cycloheximide (CHX)
NCM460 cells were treated with 100 μg/ml CHX
alone or in combination with 200 nM rapamycin. Cell samples were
collected at indicated time points (0, 3, 6, 9, 12, and 24 h), and
the expression levels of the target protein were analyzed by
western blotting. The resulting data were fitted to a linear
regression model to calculate the half-life of the target protein
in NCM460 cells.
Analysis of autophagic flux
The viral infection of cells was performed according
to the instructions provided in the adenovirus user manual. When
the cells in 50 mm dish reached a density of ~30%, 1 μl of
mRFP-GFP-LC3 adenovirus (cat no. GENE-497, Shanghai GeneChem Co.,
Ltd.) (1×10¹¹ PFU/ml) was added to each well for transfection. The
dish was then incubated at 37°C for 24 h. Then cells were cultured
for 24 h with or without TNF-α. The images were acquired using an
inverted fluorescence microscope (Olympus Corporation). Yellow
(merge of GFP signal and RFP signal) puncta represented early
autophagosomes, while red (RFP signal) puncta indicated late
autolysosomes. Autophagic flux was evaluated by the change of
yellow puncta/red puncta.
Glucose uptake assay
Cells were treated with bafilomycin A1 (Baf A1),
Rapamycin, TNF-α or transfected with siATG7. The DMEM culture
medium was replaced by glucose-free medium for 2 h. 2-NBDG was
added at a concentration of 100 μM for 30 min. Then, cells
were washed by PBS twice. The images were acquired using an
inverted fluorescence microscope (Olympus Corporation). The
fluorescence intensity of 2-NBDG was detected at λex 494 nm, λem
551 nm by using a SpectraMax M2 microplate reader (Molecular
Devices, LLC).
Determination of intracellular pH
The intracellular pH was detected by fluorescence
measurements using the dye BCECF-AM (Beijing Solarbio Science &
Technology Co., Ltd.). Cells grown in 96-well microtiter plate were
washed with PBS for twice and incubated with 3 μM BCECF-AM
for 30 min at 37°C. The medium of cells was removed and cells were
washed twice with PBS. The images were acquired using an inverted
fluorescence microscope (Olympus Corporation). The fluorescence
intensity of BCECF-AM was detected at λex 488 nm, λem 535 nm by
using a SpectraMax M2 microplate reader (Molecular Devices,
LLC).
Immunohistochemistry and
immunofluorescence
Samples were fixed in 4% paraformaldehyde (Beijing
Solarbio Science & Technology Co., Ltd.) at 4°C overnight. The
fixed tissues were sequentially immersed in 50, 70, 85, 95 and 100%
ethanol solutions for 90 min each to achieve gradual dehydration to
ensure complete water removal. The tissue was immersed in a 1:1
mixture of ethanol and xylene for 60 min, followed by immersion in
pure xylene for an additional 60 min. Subsequently, the tissue was
transferred to a 1:1 mixture of xylene and paraffin for 60 min,
then placed in pure paraffin solution for 120 min. Finally, the
tissue was incubated in molten paraffin at 62°C for 2 h to ensure
complete infiltration of the colon tissue. The colon tissue was
placed in a mold and molten paraffin was added. After waiting for
the paraffin to solidify, the tissue wax blocks were cut into thin
slices ~3 μm thick using a microtome. The
immunohistochemical sections were incubated with the PFKFB3 primary
antibody overnight at 4°C, followed by incubation with the
anti-rabbit secondary antibody at 37°C for 1 h. The
immunofluorescence sections were incubated overnight at 4°C with
the primary antibodies against PFKFB3 and E-cadherin, followed by
incubation at 37°C for 1 h with Alexa Fluor 488-conjugated and
Alexa Fluor 555-conjugated secondary antibodies in the dark. The
cell nuclei were stained with DAPI at a temperature of 37°C for 10
min. Images were acquired by using fluorescence microscopy (Olympus
Corporation). A total of 19 blood samples from patients with
Crohn's disease and 21 blood samples from healthy individuals were
collected. Additionally, five colon tissue samples were obtained
from patients with Crohn's disease. The male-to-female ratio across
all patient samples was ~2:1, with an age range of 22-50 years. All
human tissue were collected using protocols approved by Medical
Ethics Committee of Second Affiliated Hospital of Army Medical
University, PLA and informed consent had been obtained from the
patients (approval no. 2022-188-01).
Statistical analysis
Crohn's disease datasets were downloaded from
http://www.ncbi.nlm.nih.gov/geo.
High-throughput transcriptome data from blood samples of healthy
individuals and IBD patients, retrieved from the GEO database
(accession numbers GSE119600, GSE112057 and GSE126124), were
analyzed to mRNA expression of the PFKFB3 between the two groups.
The ubiquitin ligase associated with the PFKFB3 protein was
predicted and analyzed using the http://ubibrowser.ncpsb.org.cn. Statistical analyses
of all data were performed using GraphPad Prism (version 8.0;
Dotmatics). Comparisons between two groups were analyzed by a
two-tailed, unpaired Student's t-test. One-way ANOVA followed by
Tukey's post-hoc test was used for multiple comparisons Data from
at least three independent experiments unless otherwise noted.
Error bars represent SEM and statistical significance is indicated
as *P<0.05, **P<0.01,
***P<0.001, ****P<0.0001. P<0.05 was
considered to indicate a statistically significant difference.
Results
Impaired autophagy and elevated
glycolysis levels in IBD
First, to elucidate the changes of autophagy in IBD,
acute and chronic colitis models were established in C57BL/6 mice.
DSS concentration of 2.5% (w/vol) in the drinking water for 7 days
induce marked colitis in C57BL/6 mice. In addition, chronic colitis
model was induced in C57BL/6 mice by three cycles of 2% DSS (7 days
of DSS induction, 14 days water) (Fig. 1A). The present study extracted
the colonic epithelial cells of colitis mice and detected the
expression of autophagy marker proteins (P62 and LC3b) by western
blotting. As shown in Fig. 1B,
the expression of P62 and LC3b were markedly increased in colonic
epithelial cells of acute and chronic colitis mice. The mRNA levels
of key glycolysis enzymes were detected to explore the glycolysis
levels. PCR data showed that the expression levels of PFKP, LDHA
and PFKFB3 were markedly increased in DSS group (Fig. 1C). However, the mRNA levels of
HK2 and PKM2 were decreased in DSS group (Fig. 1C).
![Impaired autophagy and upregulated
glycolysis levels in IECs were observed under inflammatory
conditions. (A) Establishment of acute colitis mouse model and
chronic colitis mouse model. (B) The protein levels of P62 and LC3b
in colonic epithelial cells of acute DSS-induced mice (n=3) and
chronic DSS-induced mice (n=3) determined by western blot analysis.
(C) mRNA levels of PFKP, LDHA, HK2, PKM2, PFKFB3 in DSS-induced
mice epithelial cells. (D) Autophagic flux was measured by
transfecting cells with mRFP-GFP-LC3 dual-fluorescence adenovirus
(Ad-LC3), allowing differentiation between autophagosomes
(mRFP+/GFP+ fluorescence, appearing as yellow puncta) and
autolysosomes (mRFP+/GFP-fluorescence, appearing as red puncta).
TNF-α (200 ng/ml) induced epithelial cells for 48 h. Representative
immunofluorescence images were shown. (Original magnification,
×20). Quantification of LC3 puncta number of representative cells.
(E) Relative glucose content and lactate (Lac) production in
control vs. TNF-α induced epithelial cells. (F) 2-NBDG and (G)
BCECF fluorescent counter-staining in TNF-α induced epithelial
cells vs. control. Representative immunofluorescence images were
shown. (Original magnification, ×20). Quantitative fluorescence
intensity of 2-NBDG and BCECF (n=3). Data were presented as the
mean ± SD of n=3 per group. Statistical analysis was performed
using unpaired t-tests. ****P<0.0001,
***P<0.001, **P<0.01,
*P<0.05, ns, non-significant vs. control group. IECs,
intestinal epithelial cells; DSS, dextran sulfate sodium salt;
2-NBDG, 2-deoxy-2-[(7-nitro-2,1,3-benzoxadiazol-4-yl)
amino]-D-glucose; BCECF, 2',7'-bis(carboxyethyl)-5(6)-carboxyfluorescein.](/article_images/ijmm/57/2/ijmm-57-02-05714-g00.jpg) | Figure 1Impaired autophagy and upregulated
glycolysis levels in IECs were observed under inflammatory
conditions. (A) Establishment of acute colitis mouse model and
chronic colitis mouse model. (B) The protein levels of P62 and LC3b
in colonic epithelial cells of acute DSS-induced mice (n=3) and
chronic DSS-induced mice (n=3) determined by western blot analysis.
(C) mRNA levels of PFKP, LDHA, HK2, PKM2, PFKFB3 in DSS-induced
mice epithelial cells. (D) Autophagic flux was measured by
transfecting cells with mRFP-GFP-LC3 dual-fluorescence adenovirus
(Ad-LC3), allowing differentiation between autophagosomes
(mRFP+/GFP+ fluorescence, appearing as yellow puncta) and
autolysosomes (mRFP+/GFP-fluorescence, appearing as red puncta).
TNF-α (200 ng/ml) induced epithelial cells for 48 h. Representative
immunofluorescence images were shown. (Original magnification,
×20). Quantification of LC3 puncta number of representative cells.
(E) Relative glucose content and lactate (Lac) production in
control vs. TNF-α induced epithelial cells. (F) 2-NBDG and (G)
BCECF fluorescent counter-staining in TNF-α induced epithelial
cells vs. control. Representative immunofluorescence images were
shown. (Original magnification, ×20). Quantitative fluorescence
intensity of 2-NBDG and BCECF (n=3). Data were presented as the
mean ± SD of n=3 per group. Statistical analysis was performed
using unpaired t-tests. ****P<0.0001,
***P<0.001, **P<0.01,
*P<0.05, ns, non-significant vs. control group. IECs,
intestinal epithelial cells; DSS, dextran sulfate sodium salt;
2-NBDG, 2-deoxy-2-[(7-nitro-2,1,3-benzoxadiazol-4-yl)
amino]-D-glucose; BCECF, 2',7'-bis(carboxyethyl)-5(6)-carboxyfluorescein. |
Meanwhile, TNF-α (200 ng/ml) was used to induce
inflammation in NCM460, one of the human IECs lines. Autophagic
flux was detected by transfecting mRFP-GFP-LC3 double fluorescence
adenovirus in IECs. Autophagosome with double limiting membrane
structure was marked by both mRFP and GFP, which appeared as yellow
puncta. GFP fluorescent protein was known to quench under acidic
conditions. Therefore, autolysosomes with low pH were marked by
only mRFP which appeared as red puncta. Quantification of LC3
puncta number of representative cells is shown in Fig. 1D. Compared with the control
group, the number of autophagosomes in the TNF-α group increased
while the number of autolysosomes decreased. This suggested that
the process of fusion of autophagosome and lysosome was blocked in
inflammatory IECs and the accumulation of autophagosome occurred in
inflammatory IECs. In vivo and in vitro models of
colitis both suggested impaired autophagy of colon epithelial cells
under inflammation. Subsequently, the glycolysis levels in model of
inflammatory IECs was further investigated. Intracellular glucose
content and lactic acid production were measured in TNF-α induced
IECs. Glucose content decreased markedly and lactic acid production
increased in inflammatory IECs, suggesting an enhanced glycolysis
level (Fig. 1E). A
2-deoxy-2-[(7-nitro-2,1,3-benzoxadiazol-4-yl) amino]-D-glucose
(2-NBDG) fluorescence probe was then used to detect the rate of
glucose uptake in IECs (Fig. 1F)
and a pH-sensitive dye 2',7'-Bis(2-carboxyethyl)-5(6)-carboxy-fluorescein BCECF
fluorescence probe to detect intracellular acidity (Fig. 1G). It was known that 2-NBDG
fluorescence density increased with the increased of cellular
glucose uptake rate, while BCECF fluorescence density increases
with the decreased of pH in IECs. Quantitative statistics of
fluorescence density showed that the density of 2-NBDG and BCECF
markedly increased in inflammatory IECs, suggesting that
inflammatory stimulation resulted in increasing glucose uptake rate
and cell acidity. These data indicated that the level of glycolysis
was increased under inflammation.
Autophagy negatively regulates glycolysis
in intestinal epithelial cells
Autophagy-related genes (ATGs) are core conserved
genes that coordinate and mediate the formation of the double
membrane structure of autophagosomes in eukaryotic cells and
transfer the contents of cytoplasm to lysosome degradation
(17). ATG7 protein encoded by
autophagy-related genes participates in the lipidation process of
autophagosome formation, driving phosphatidylethanolamine (PE) to
bind to LC3-I to generate LC3-II which promotes autophagy. ATG7
impairment classically results in autophagy defects in cells and
tissues (18). The present study
stably expressed retrovirus shRNA against ATG7 in IECs (Fig. 2A). In ATG7 knock-down cells,
glucose content decreased while lactate production increased
(Fig. 2B). In addition,
increased rate of glucose uptake (Fig. 2C) and intracellular acidity
(Fig. 2D) were observed in ATG7
knockdown cells. Furthermore, the enzyme activity of PFK-1, one of
the key rate-limiting enzymes in glycolysis was detected and it was
found that PFK-1 activity was enhanced in ATG7 knockdown cells
(Fig. 2E). This might be related
to the increased rate of glycolysis. Taken together, these data
suggested that impaired autophagy caused by ATG7 knockdown in IECs
lead to increased glycolysis levels.
![Knockdown of ATG7 in IECs resulted in
increased glycolysis levels. (A) mRNA levels of ATG7 in control vs.
sh-ATG7 epithelial cells. (B) Relative glucose content and lactate
(Lac) production in control vs. sh-ATG7 epithelial cells. (C)
2-NBDG and (D) BCECF fluorescent counter-staining in ATG7 knockdown
epithelial cells vs. control. Representative immunofluorescence
images were shown. (Original magnification, ×20). Quantitative
fluorescence intensity of 2-NBDG and BCECF. (E) Enzymatic
activities of PFK-1 in ATG7-knockdown epithelial cells vs. control
(n=3). P-values were calculated using an unpaired t-test. The
values were presented as the means ± SEM, n=3,
*P<0.05, **P<0.01,
***P<0.001, ****P<0.0001. ATG,
autophagy related gene; IECs, intestinal epithelial cells; sh,
short hairpin; si, small interfering; 2-NBDG,
2-deoxy-2-[(7-nitro-2,1,3-benzoxadiazol-4-yl) amino]-D-glucose;
BCECF, 2',7'-bis(carboxyethyl)-5(6)-carboxyfluorescein; PFK-1,
phosphofructokinase-1.](/article_images/ijmm/57/2/ijmm-57-02-05714-g01.jpg) | Figure 2Knockdown of ATG7 in IECs resulted in
increased glycolysis levels. (A) mRNA levels of ATG7 in control vs.
sh-ATG7 epithelial cells. (B) Relative glucose content and lactate
(Lac) production in control vs. sh-ATG7 epithelial cells. (C)
2-NBDG and (D) BCECF fluorescent counter-staining in ATG7 knockdown
epithelial cells vs. control. Representative immunofluorescence
images were shown. (Original magnification, ×20). Quantitative
fluorescence intensity of 2-NBDG and BCECF. (E) Enzymatic
activities of PFK-1 in ATG7-knockdown epithelial cells vs. control
(n=3). P-values were calculated using an unpaired t-test. The
values were presented as the means ± SEM, n=3,
*P<0.05, **P<0.01,
***P<0.001, ****P<0.0001. ATG,
autophagy related gene; IECs, intestinal epithelial cells; sh,
short hairpin; si, small interfering; 2-NBDG,
2-deoxy-2-[(7-nitro-2,1,3-benzoxadiazol-4-yl) amino]-D-glucose;
BCECF, 2',7'-bis(carboxyethyl)-5(6)-carboxyfluorescein; PFK-1,
phosphofructokinase-1. |
Subsequently, to further elucidate the regulation of
autophagy on glycolysis, IECs was treated by autophagy activator
rapamycin, or the autophagy inhibitor Baf A1. Glucose content and
lactate production were measured in rapamycin or Baf A1 treated
IECs (Fig. 3A and B). Data
showed that activation of autophagy inhibited the production of
glycolytic metabolites and reduced glycolysis level. Furthermore,
increased rate of glucose uptake and intracellular acidity were
observed in Baf A1 treated IECs, while decreased rate of glucose
uptake and intracellular acidity were observed in rapamycin treated
IECs (Fig. 3C and D). Moreover,
PFK-1 enzyme activity was detected in IECs treated with rapamycin
or Baf A1 (Fig. 3E). Similar to
ATG7 knockdown cells, activation of autophagy negatively regulated
PFK-1 enzyme activity. The aforementioned data indicated that
activation of autophagy promotes decreased of glycolysis level in
IECs and inhibition of autophagy resulted in elevated
glycolysis.
![Autophagy agonists and inhibitors
regulated glycolysis. (A) Relative glucose content and Lac
production in control vs. Baf A1 treated IECs. (B) Relative glucose
content and Lac production in control vs. rapamycin treated IECs.
(C and D) 2-NBDG and BCECF fluorescent counter-staining in
rapamycin or BafA1 treated IECs vs. control. Representative
immunofluorescence images were shown. (Original magnification,
×20). Quantitative fluorescence intensity of 2-NBDG and BCECF
(n=3). (E) Enzymatic activities of PFK-1 in rapamycin or BafA1
treated IECs vs. control (n=3). P-values were calculated using
One-way ANOVA followed by Tukey's post-hoc test. The values were
presented as the means ± SEM, *P<0.05,
**P<0.01, ***P<0.001,
****P<0.0001. Lac, lactate; Baf A1, bafilomycin A1;
IECs, intestinal epithelial cells; 2-NBDG,
2-deoxy-2-[(7-nitro-2,1,3-benzoxadiazol-4-yl) amino]-D-glucose;
BCECF, 2',7'-bis(carboxyethyl)-5(6)-carboxyfluorescein; PFK-1,
phosphofructokinase-1.](/article_images/ijmm/57/2/ijmm-57-02-05714-g02.jpg) | Figure 3Autophagy agonists and inhibitors
regulated glycolysis. (A) Relative glucose content and Lac
production in control vs. Baf A1 treated IECs. (B) Relative glucose
content and Lac production in control vs. rapamycin treated IECs.
(C and D) 2-NBDG and BCECF fluorescent counter-staining in
rapamycin or BafA1 treated IECs vs. control. Representative
immunofluorescence images were shown. (Original magnification,
×20). Quantitative fluorescence intensity of 2-NBDG and BCECF
(n=3). (E) Enzymatic activities of PFK-1 in rapamycin or BafA1
treated IECs vs. control (n=3). P-values were calculated using
One-way ANOVA followed by Tukey's post-hoc test. The values were
presented as the means ± SEM, *P<0.05,
**P<0.01, ***P<0.001,
****P<0.0001. Lac, lactate; Baf A1, bafilomycin A1;
IECs, intestinal epithelial cells; 2-NBDG,
2-deoxy-2-[(7-nitro-2,1,3-benzoxadiazol-4-yl) amino]-D-glucose;
BCECF, 2',7'-bis(carboxyethyl)-5(6)-carboxyfluorescein; PFK-1,
phosphofructokinase-1. |
PFKFB3 is required for autophagy to
regulate glycolysis in IECs
The present study next attempted to identify
possible key protein in the process of autophagy regulation of
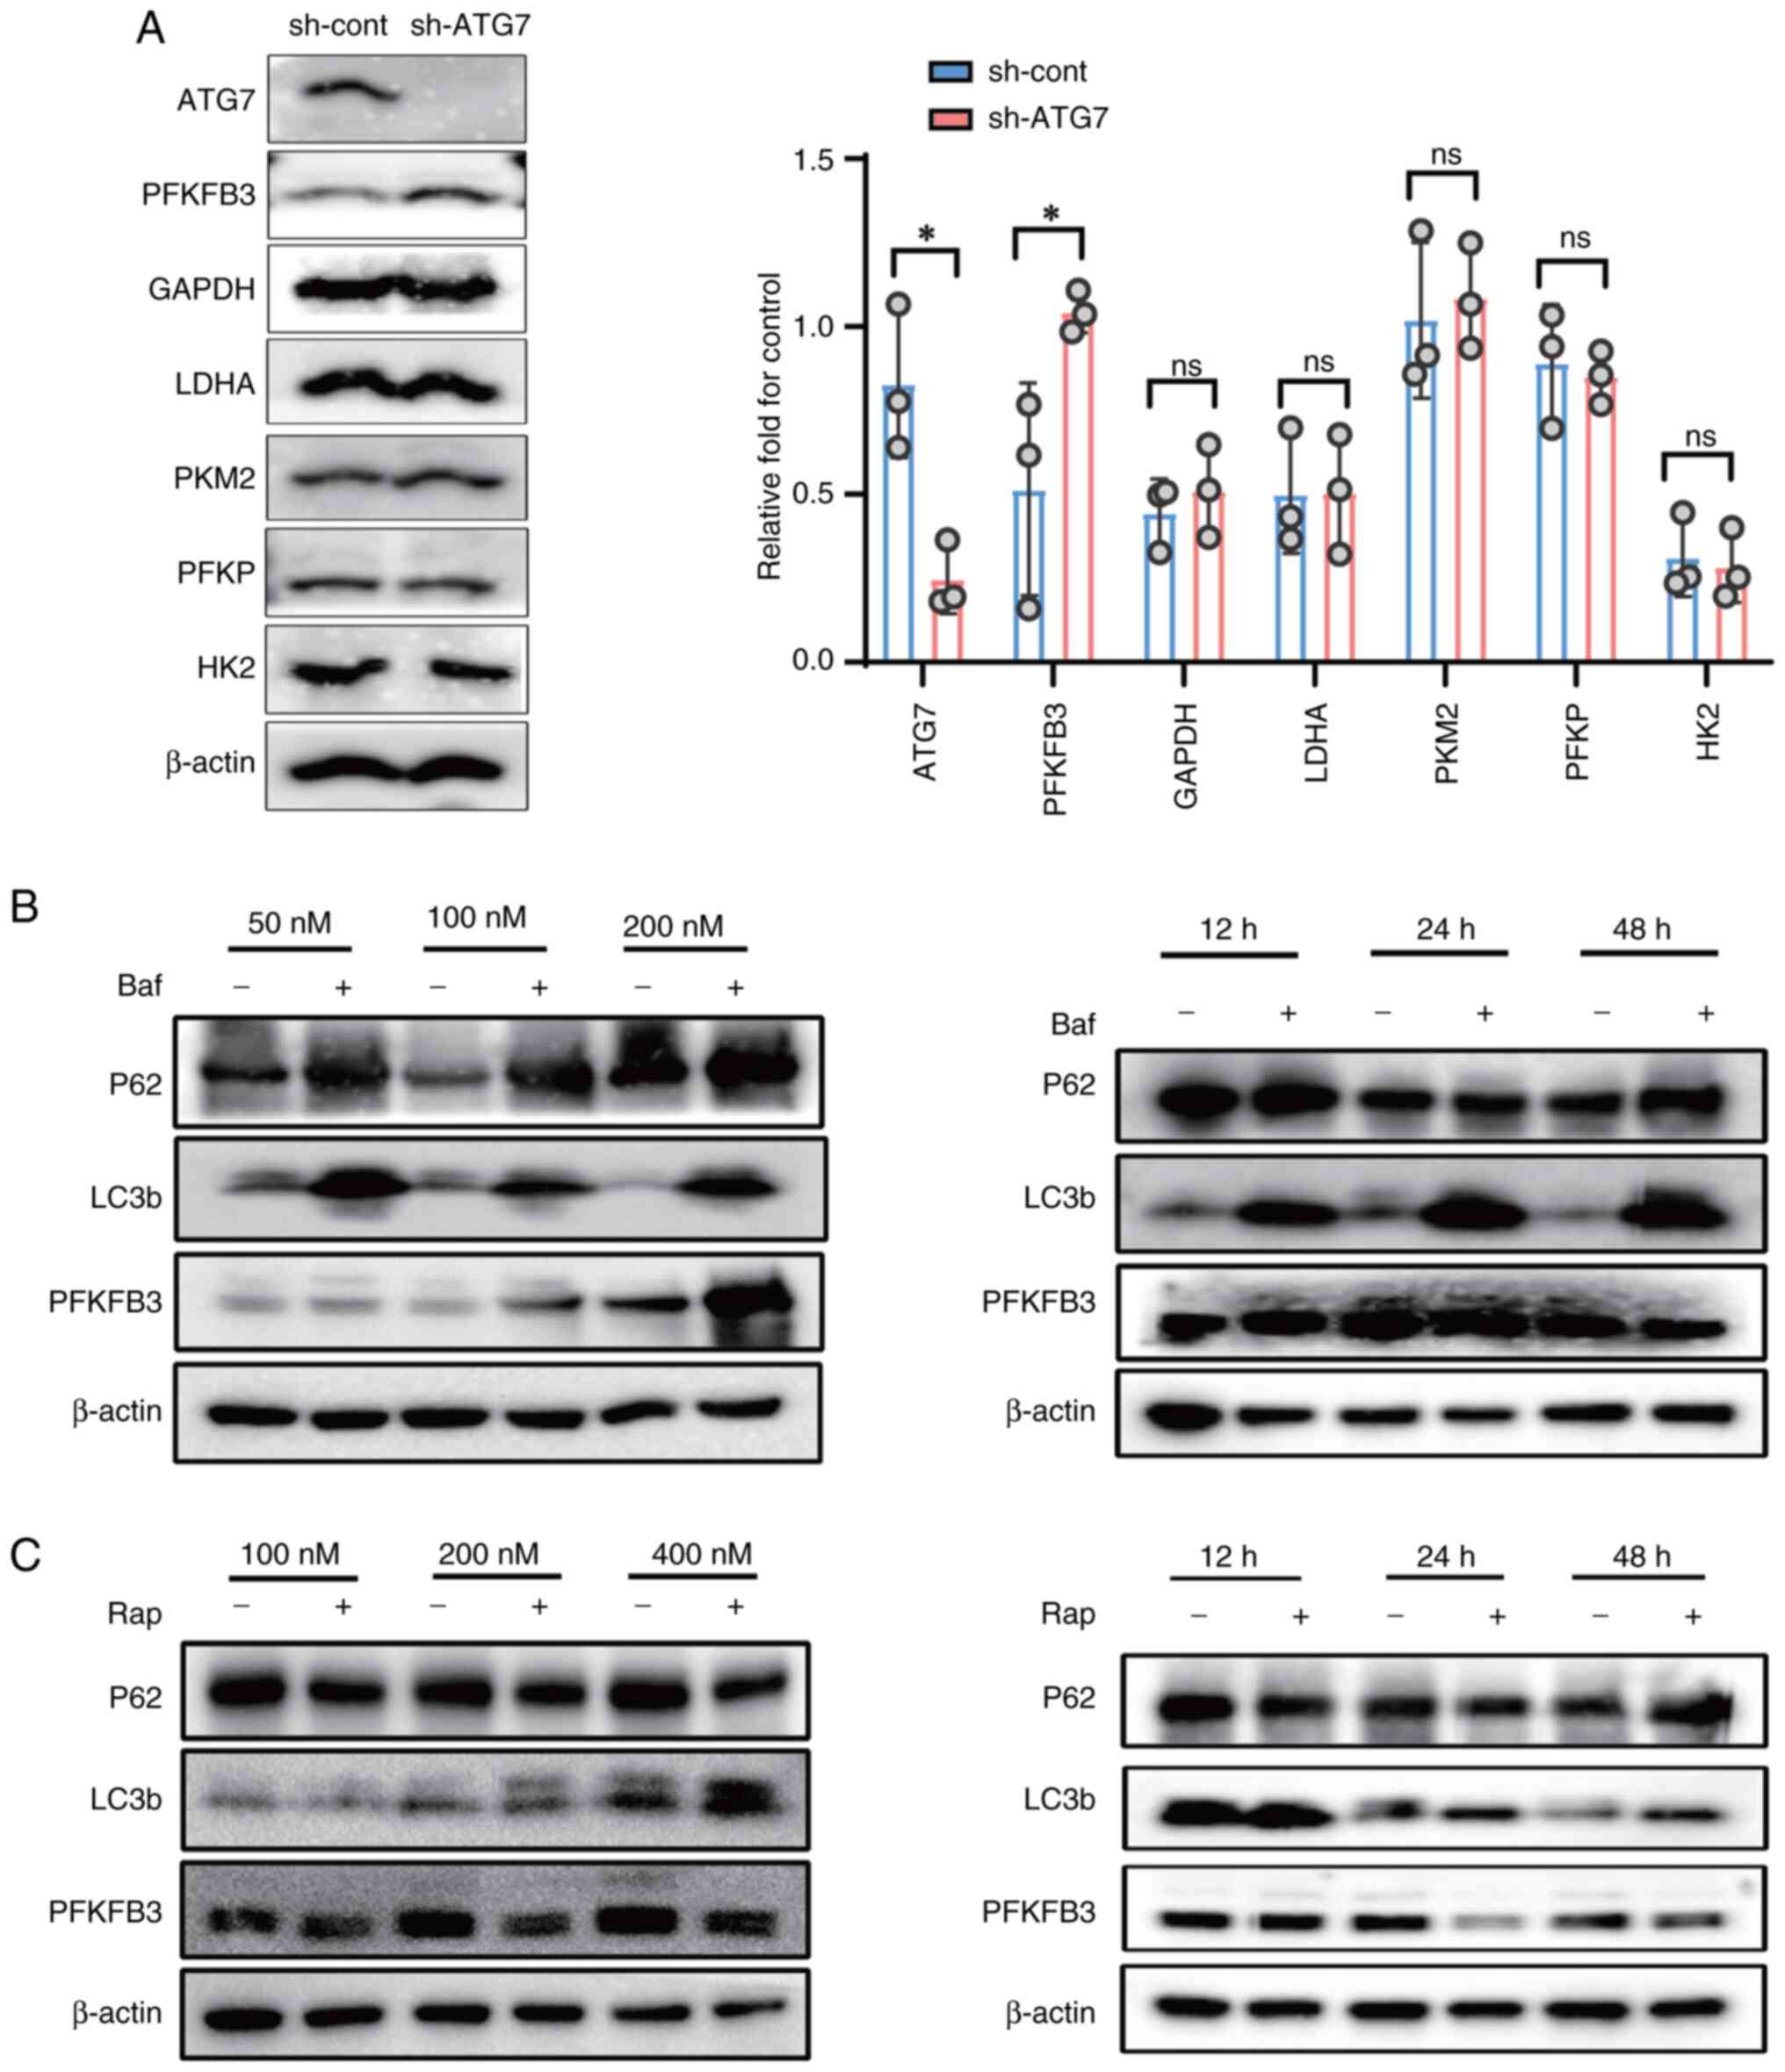
glycolysis. It examined the protein expression levels of six key
glycolytic enzymes, HK2, PKM2, LDHA, PFKP, GAPDH and PFKFB3 in
control group and autophagy deficient (ATG7 knockdown) cells group.
Notably, only PFKFB3 protein levels increased in ATG7 knockdown
IECs. There was no significant difference in the protein expression
of other key glycolytic enzymes in ATG7 knockdown IECs group and
control group (Fig. 4A). Base on
aforementioned results, it was next examined whether rapamycin or
Baf A1 regulated the protein expression of PFKFB3 in IECs. IECs
were treated with different concentrations (50, 100 and 200 nM) of
Baf A1 or different concentrations (100, 200 and 400 nM) of
rapamycin for 24 h. Meanwhile, IECs were treated with 200 nM Baf A1
or rapamycin for different times (12, 24 and 48 h). Western
blotting showed that Baf A1 inhibited autophagy and increased
expression of PFKFB3 protein. In contrast to the Baf A1, rapamycin
activated autophagy and reduced levels of PFKFB3 protein (Fig. 4B and C).
To further elucidate the importance of PFKFB3,
PFKFB3 knockdown and overexpression intestinal epithelial cells
were constructed (Fig. 5A).
PFKFB3 knockdown cells were treated with Baf A1 for 24 h. After
autophagy was inhibited in PFKFB3 knockdown cells, it was observed
that compared with normal epithelial cells treated with Baf A1, the
glucose content of PFKFB3 knockdown cells were markedly increased
and lactic acid production was decreased (Fig. 5B). Result of 2-NBDG and BCECF,
indicated that PFKFB3 knockdown reduced the rate of intracellular
glycolysis and impaired the ability of autophagy inhibitors to
promote glycolysis (Fig. 5C and
D). Moreover, compared with PFKFB3 knockdown cells without
rapamycin, the relative glucose content and lactic acid production
of PFKFB3 knockdown cells treated with rapamycin were not markedly
changed (Fig. 5E). Furthermore,
the results of 2-NBDG and BCECF also indicated that rapamycin has
no effect on the glycolysis rate following PFKFB3 knockdown
(Fig. 5F and G). All of these
results indicated that PFKFB3 plays a key role in autophagy
regulation of intestinal epithelial cells glycolysis. Subsequently,
the role of the autophagy activator rapamycin was validated in
PFKFB3-overexpressing NCM460 cells. Overexpression of PFKFB3
increased glucose content and decreased lactic acid production in
intestinal epithelial cells following treatment with rapamycin
(Fig. 5H). Flag-tagged PFKFB3
overexpression cells had shown high level of 2-NBDG and BCECF,
while rapamycin treatment reduced it (Fig. 5I and J). It suggested that PFKFB3
increased in intestinal epithelial cells induced high level of
glycolysis, while promoting autophagy can alleviate the level of
PFKFB3-induced glycolysis.
![PFKFB3 played a key role in autophagy
regulating of the glycolysis of IECs. (A) The verification of
PFKFB3 knockdown and overexpression by western blotting. Relative
glucose content and Lac production in PFKFB3 knockdown IECs treated
with (B) Baf A1 (200 nM) or (E) rapamycin (200 nM). (C and F)
2-NBDG and (D and G) BCECF fluorescent counter-staining in
rapamycin or BafA1 treated PFKFB3 knockdown IECs vs. control.
Representative immunofluorescence images are shown. (Original
magnification, ×20) with quantitative fluorescence intensity of
2-NBDG and BCECF (n=3). (H) Relative glucose content and Lac
production in PFKFB3 OE IECs treated with rapamycin (200 nM). (I)
2-NBDG and (J) BCECF fluorescent counter-staining in rapamycin
treated PFKFB3 OE IECs vs. control. Representative
immunofluorescence images are shown (Original magnification, ×20)
and quantitative fluorescence intensity of 2-NBDG and BCECF (n=3).
P-values were calculated using One-way ANOVA followed by Tukey's
post-hoc test. The values were presented as the means ± SEM,
*P<0.05, **P<0.01,
***P<0.001, ****P<0.0001. PFKFB3,
6-phosphofructo-2-kinase/fructose-2,6-bisphosphatase 3; Lac,
lactate; IECs, intestinal epithelial cells; Baf A1, bafilomycin A1;
2-NBDG, 2-deoxy-2-[(7-nitro-2,1,3-benzoxadiazol-4-yl)
amino]-D-glucose; BCECF, 2',7'-bis(carboxyethyl)-5(6)-carboxyfluorescein; OE,
overexpression.](/article_images/ijmm/57/2/ijmm-57-02-05714-g04.jpg) | Figure 5PFKFB3 played a key role in autophagy
regulating of the glycolysis of IECs. (A) The verification of
PFKFB3 knockdown and overexpression by western blotting. Relative
glucose content and Lac production in PFKFB3 knockdown IECs treated
with (B) Baf A1 (200 nM) or (E) rapamycin (200 nM). (C and F)
2-NBDG and (D and G) BCECF fluorescent counter-staining in
rapamycin or BafA1 treated PFKFB3 knockdown IECs vs. control.
Representative immunofluorescence images are shown. (Original
magnification, ×20) with quantitative fluorescence intensity of
2-NBDG and BCECF (n=3). (H) Relative glucose content and Lac
production in PFKFB3 OE IECs treated with rapamycin (200 nM). (I)
2-NBDG and (J) BCECF fluorescent counter-staining in rapamycin
treated PFKFB3 OE IECs vs. control. Representative
immunofluorescence images are shown (Original magnification, ×20)
and quantitative fluorescence intensity of 2-NBDG and BCECF (n=3).
P-values were calculated using One-way ANOVA followed by Tukey's
post-hoc test. The values were presented as the means ± SEM,
*P<0.05, **P<0.01,
***P<0.001, ****P<0.0001. PFKFB3,
6-phosphofructo-2-kinase/fructose-2,6-bisphosphatase 3; Lac,
lactate; IECs, intestinal epithelial cells; Baf A1, bafilomycin A1;
2-NBDG, 2-deoxy-2-[(7-nitro-2,1,3-benzoxadiazol-4-yl)
amino]-D-glucose; BCECF, 2',7'-bis(carboxyethyl)-5(6)-carboxyfluorescein; OE,
overexpression. |
P62 specifically targets FZR1/Cdh1
ubiquitination PFKFB3 and mediates its autophagic degradation in
IEC
The present authors have previously verified that
autophagy can regulate the expression of PFKFB3 protein. Foerster
et al (4) reported that
selective autophagy regulated intestinal environmental homeostasis
by degrading specific proteins. This implied that autophagy might
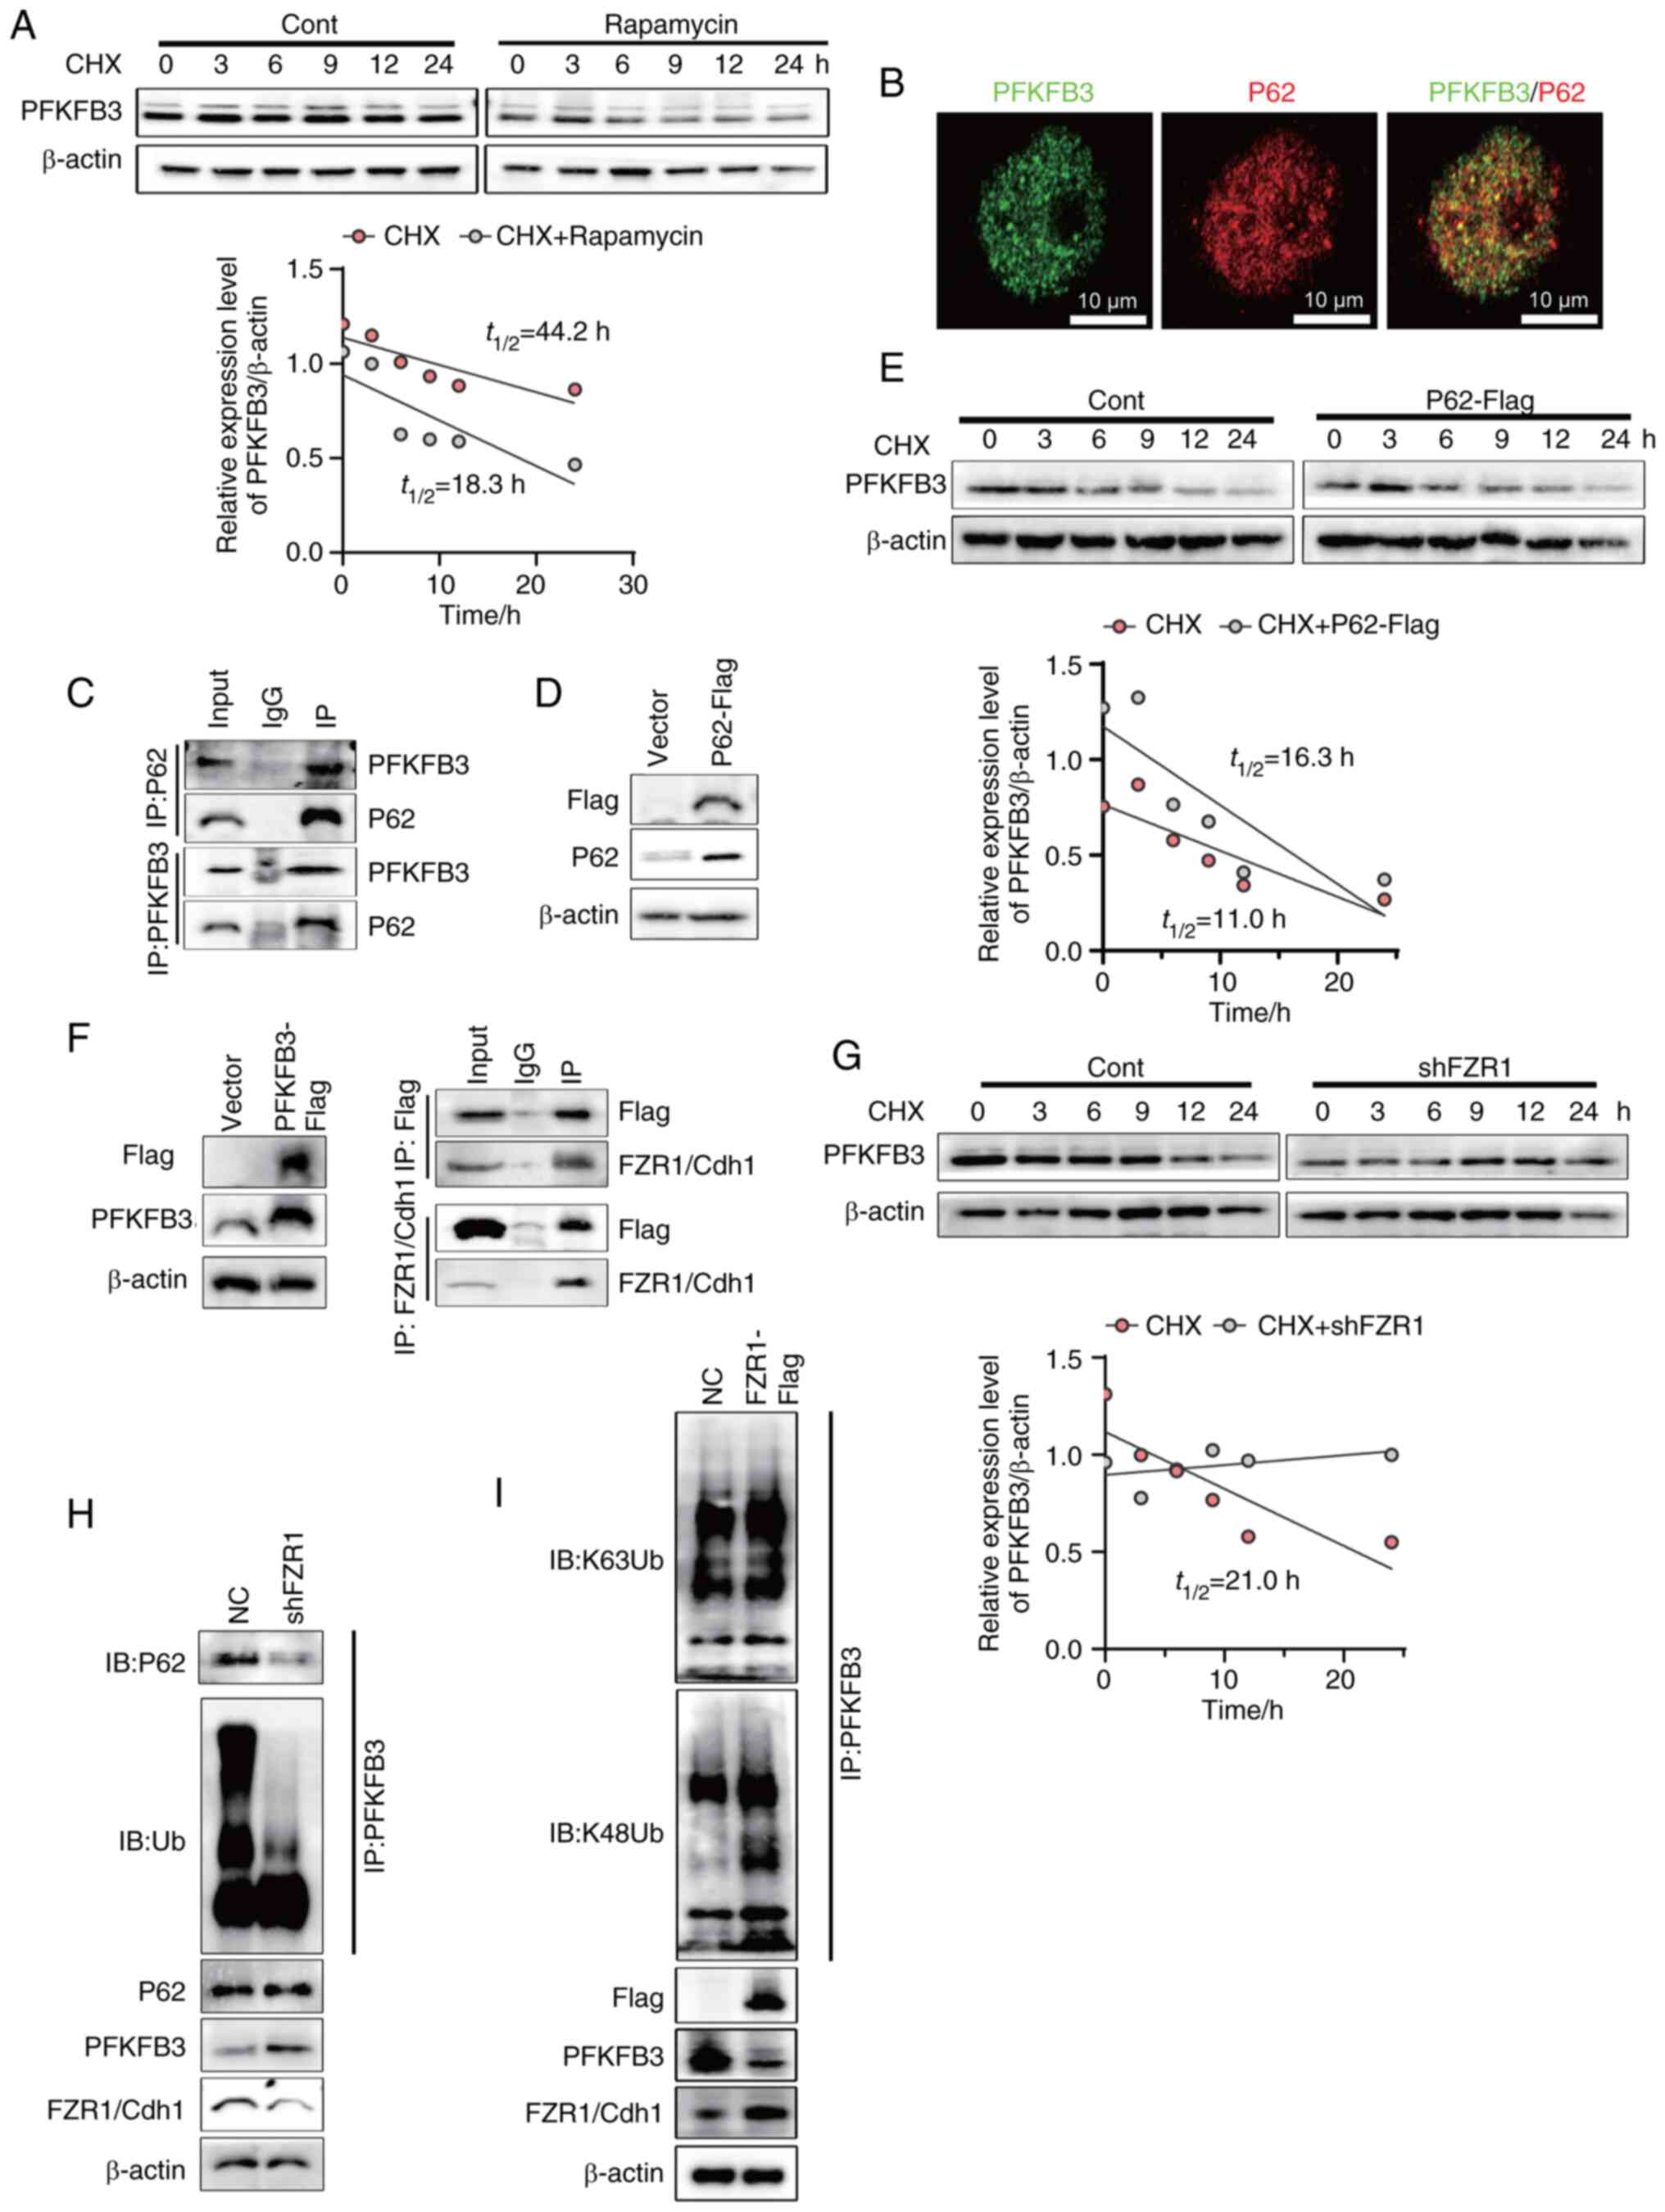
regulate PFKFB3 protein stability. To test this hypothesis, NCM460
cells with or without rapamycin were treated with cycloheximide
(CHX) to inhibit protein synthesis, followed by monitoring the
levels of remaining PFKFB3 at the indicated time points (Fig. 6A). The results indicated that
PFKFB3 protein stability was disrupted by rapamycin and the PFKFB3
degradation was mediated by autophagy. Selective autophagy is
mediated by autophagy receptors and P62/SQSTM1 is a common
autophagy receptor in mammals (19). It was hypothesized that P62
receptor mediated the degradation of PFKFB3 protein in intestinal
epithelial cells. First, PFKFB3 and P62 were labelled by
immunofluorescence, which showed that PFKFB3 and P62 were
co-localized (Fig. 6B). The
results indicated that PFKFB3 might interacted with P62.
Subsequently, the coimmunoprecipitation assays showed that P62
could interact with PFKFB3, suggesting that P62 played a key role
in PFKFB3 degradation (Fig. 6C).
To further elucidate the effect of P62 on the degradation of
PFKFB3, Flag-tagged P62 overexpression NCM460 was constructed
(Fig. 6D). NCM460 cells with or
without P62 overexpression were treated with CHX at indicated
times. The results showed that P62 overexpression promoted the
degradation of PFKFB3 (Fig. 6E).
P62 were characterized by the ubiquitin binding domains allowing
them to bridge cargo (20). It
was hypothesized that an E3 ubiquitin ligase mediated PFKFB3
ubiquitination which was recognized by P62. Using the UbiBrowser,
E3 ubiquitin ligase prediction website, it was found that FZR1/Cdh1
might be the E3 ubiquitin ligase of PFKFB3 in intestinal epithelial
cells. To verify this hypothesis, Flag-tagged PFKFB3 overexpression
cells were constructed and the interaction of PFKFB3 with FZR1/Cdh1
was analyzed by coimmunoprecipitation (Fig. 6F). Subsequently, to verify the
effect of E3 ubiquitin ligase FZR1/Cdh1 on the degradation of
PFKFB3, FZR1 knockdown NCM460 cells were constructed. With or
without FZR1 knockdown, NCM460 cells were treated with CHX at the
indicated times. FZR1 knockdown NCM460 cells and control group were
treated with CHX. The remaining PFKFB3 proteins were detected and
FZR1 knockdown inhibited the degradation of PFKFB3 (Fig. 6G). Finally, endogenous PFKFB3
ubiquitination levels were analyzed in FZR1 knockdown cells. FZR1
knockdown led to the decreased incorporation of ubiquitin.
Furthermore, FZR1 knockdown disrupted the interaction between P62
and PFKFB3. FZR1 knockdown increased the expression of PFKFB3 while
P62 was not affected (Fig. 6H).
The E3 ubiquitin ligase catalyzed the formation of eight potential
isomeric ubiquitin chains by conjugating ubiquitin to one of the
seven lysine residues or the N-terminal methionine of the
substrate. As specific molecular tags, these ubiquitin chains
directed the substrate toward distinct biological outcomes, a
concept referred to as the ubiquitin code. Of these, K48- and
K63-linked polyubiquitin chains are the two most prevalent types
(21). The E3 ubiquitin ligase
exhibits inherent selectivity in ubiquitin chain linkage formation
(22). To investigate this
specificity, an in vitro analysis of the ubiquitin chains
generated by FZR1 was performed, focusing on K48- and K63-linked
polyubiquitin chains. The results demonstrated that FZR1
predominantly promoted the assembly of K48-linked ubiquitin chains,
with minimal effect on the formation of K63-linked chains (Fig. 6I). These results indicated that
FZR1/Cdh1 mediated the formation of K48-linked ubiquitin chains on
PFKFB3, which were subsequently recognized by p62 and delivered via
autophagosomes to lysosomes in intestinal epithelial cells for
degradation.
Elevated PFKFB3 protein is observed in
the colonic epithelium of IBD
To clarify the key role of PFKFB3 in IBD, the
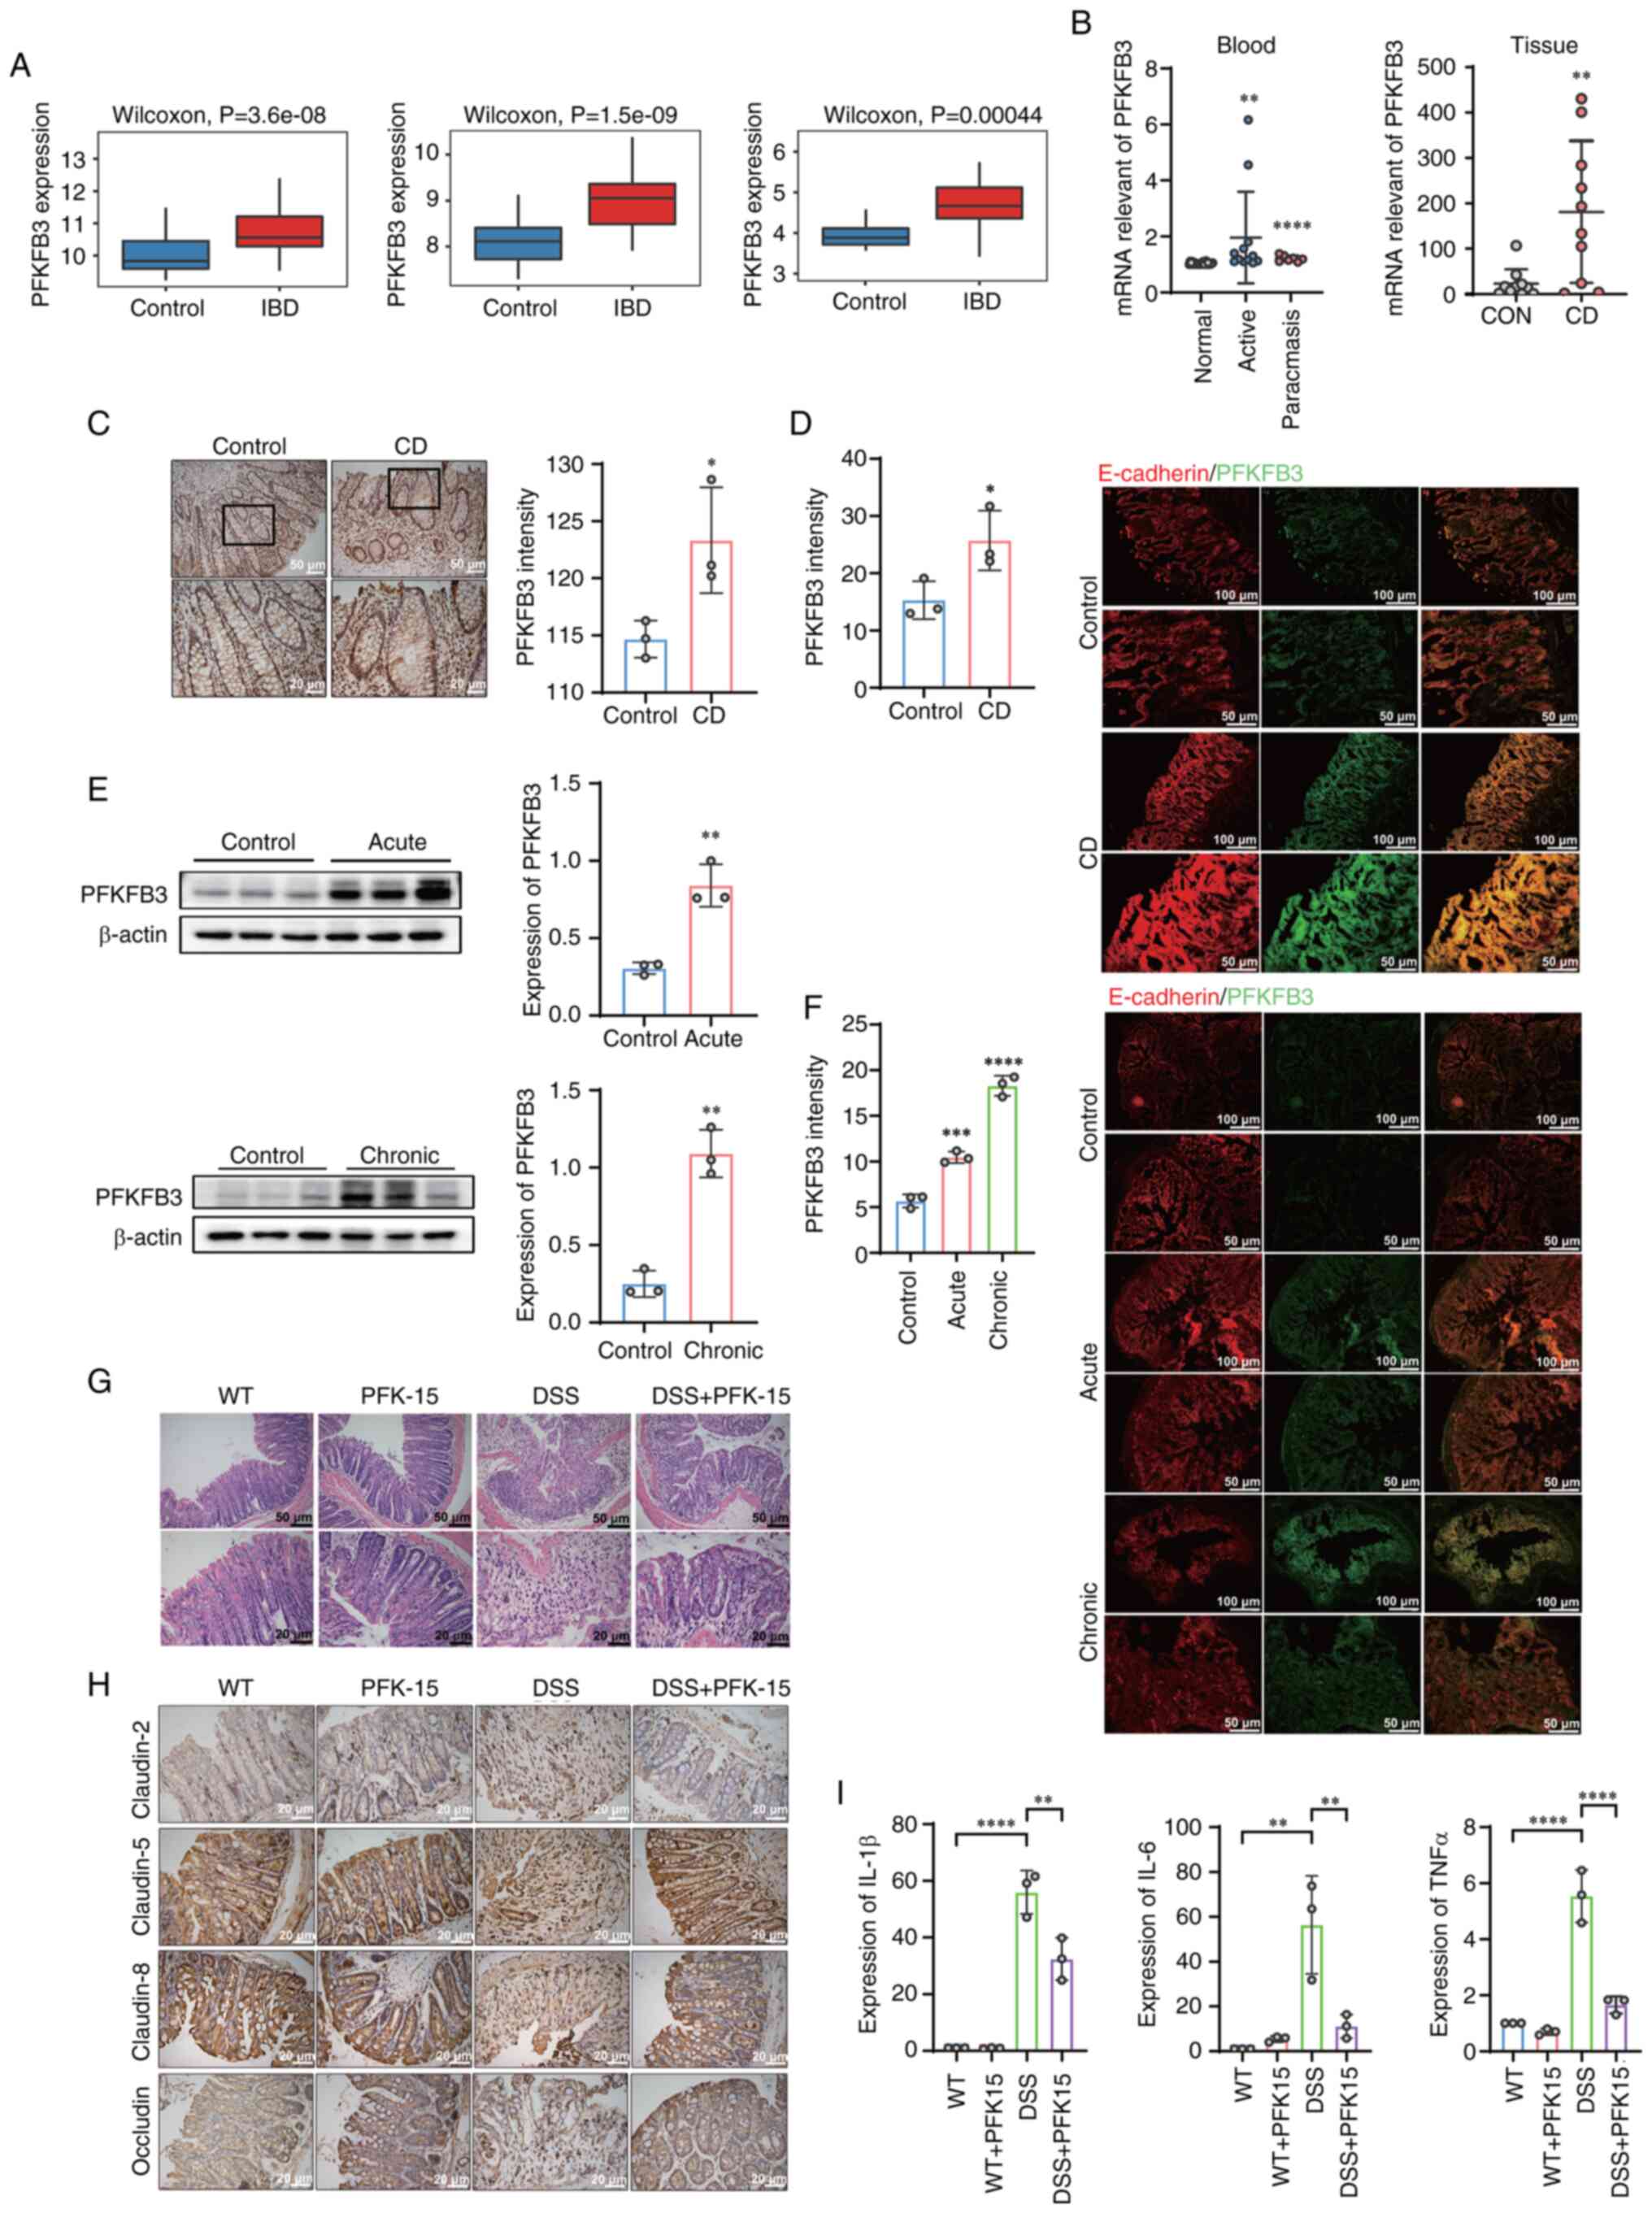
expression of PFKFB3 was investigated in IBD. The present study
evaluated PFKFB3 expression using RNA sequencing (RNA-seq) datasets
from Gene Expression Omnibus (GEO). Results indicated that PFKFB3
was upregulated in CD group, compared with normal tissues group
(Fig. 7A). PFKFB3 mRNA levels
were further detected in the blood and tissues of patients with CD.
The mRNA expression of PFKFB3 in the blood of patients with CD in
both active and remission stages were markedly higher than of
normal patients. In addition, the elevated mRNA expression of
PFKFB3 was also observed in the tissues of patients with CD
(Fig. 7B). The expression of
PFKFB3 is displayed by immunohistochemical staining of intestinal
epithelium of patients with CD (Fig.
7C). To further validate, PFKFB3 and E-cadherin fluorescence
staining in colon tissue of patients with CD were performed
(Fig. 7D). E-cadherin was one of
the epithelial marker proteins. The expression of PFKFB3 in
intestinal epithelium was elucidated by co-localization of PFKFB3
with E-cadherin. Semiquantitative analysis of immunohistochemical
staining and fluorescence intensity revealed that PFKFB3 highly
expression in patients with CD' colonic epithelium tissue.
 | Figure 7PFKFB3 was upregulated in IBD. (A)
Analysis of PFKFB3 mRNA expression in normal and Crohn's disease
tissues within public datasets (GSE119600, GSE126124, GSE112057).
(B) mRNA levels of PFKPFB3 in control (n=10) vs. tissue of patients
with Crohn's disease (n=10), control (n=26) vs. blood of patients
with Crohn's disease (active stage n=12; remission stage n=7). (C)
Immunohistochemical staining of PFKFB3 in tissue of patients with
Crohn's disease and semiquantitative analysis (n=3). (D)
Immunofluorescence images of PFKFB3 in colonic epithelial tissue of
patients with Crohn's disease and quantification of the
fluorescence intensity of PFKFB3 (n=3). (E) Protein levels of
PFKFB3 in control vs. colonic epithelium of DSS-induced mice (acute
n=3, chronic n=3). (F) Immunofluorescence images of PFKFB3 in
colonic epithelium of DSS-induced mice and quantification of the
fluorescence intensity of PFKFB3 (acute n=3, chronic n=3). (G)
Representative hematoxylin and eosin staining of the colon.
DSS-induced colitis mice were treated with intraperitoneal
injection of PFK-15 every three days. (H) Immunohistochemical
staining of claudin-5, claudin-8, claudin-2 and occludin in colon
tissue. (I) mRNA levels of IL-6, TNF-α and IL-1β. The P values for
all figures except B, F, and H were calculated using unpaired
t-tests, while one-way ANOVA followed by Tukey's multiple
comparisons test was used for B, F and H. The values were presented
as the means ± SEM, *P<0.05, **P<0.01,
***P<0.001, ****P<0.0001. PFKFB3,
6-phosphofructo-2-kinase/fructose-2,6-bisphosphatase 3; IBD,
inflammatory bowel disease; DSS, dextran sulfate sodium salt;
PFK-1, phosphofructokinase-1; CD, Crohn's disease; WT,
Wild-type. |
The expression of PFKFB3 was further observed in
colitis mouse model. First, colonic epithelial cells were extracted
from mouse model of DSS induced colitis and the PFKFB3 protein
level detected in IECs by western blotting. It showed that the
expression of PFKFB3 protein was elevated both in acute and chronic
colitis model (Fig. 7E). PFKFB3
and E-cadherin immunofluorescence staining were performed. The
result of fluorescence co-localization of PFKFB3 and E-cadherin in
colitis mouse model revealed that PFKFB3 expression was elevated in
colitis colonic epithelium (Fig.
7F). The above results suggested that PFKFB3 plays an important
role in inflammatory bowel disease.
PFKFB3 regulates tight junction proteins
and inflammatory factors in the intestinal epithelium
Given that the findings proved that the expression
of PFKFB3 increased in IBD. To verify whether PFKFB3 as a
therapeutic target could alleviate colitis in mice, the present
study established DSS-induced colitis mice and treated them with
PFK15, a PFKFB3 inhibitor. The colonic morphology of four groups
was observed by hematoxylin and eosin staining. Compared with the
normal group, the colon villi of mice in DSS colitis group were
destroyed and a large number of neutrophils were infiltrated.
However, the villus morphology of DSS-induced colitis mice markedly
recovered after treatment with PFK15 (Fig. 7G). Immunohistochemical staining
assays of claudin-5, claudin-8, claudin-2 and occludin were
performed in colons of four groups mice. Among them, claudin-5,
claudin-8 and occludin increased interepithelial resistance and
decreased barrier permeability, while claudin-2 was found to
increase paracellular barrier permeability. The results showed that
the expression of claudin-5, claudin-8 and occludin decreased in
DSS group, while the expression of claudin-2 increased. Following
PFK15 treatment, claudin-5, claudin-8, occludin and claudin-2
recovered (Fig. 7H). mRNA levels
of intestinal epithelial cells in four groups of mice were examined
and it was found that the inflammatory cytokines, including IL-6,
TNF-α and IL-1β, decreased markedly after PFK15 treatment (Fig. 7I).
Discussion
Autophagy is involved in intestinal homeostasis and
repair by mediating the recycling of organelles and protein
aggregates, as well as the destruction of intracellular pathogens
(23). Impaired intestinal
autophagy results in the disruption of intestinal epithelial
barrier, increased intestinal permeability, impaired antimicrobial
peptide secretion, promotion of apoptosis of intestinal epithelial
cells and excessive accumulation of ROS (24). Impaired autophagy is observed in
mouse colitis models, LPS-induced IEC inflammation models and IECs
inpatients with active CD (4,25,26). The present study also found
impaired autophagy both in colonic epithelial cells of DSS induced
colitis mice and TNF-α induced NCM460 cells.
Glycolysis is a metabolic process of glucose in the
cytoplasm to produce energy and metabolites for macromolecular
biosynthesis. Glycolysis involved the conversion of glucose to
pyruvate and the conversion of pyruvate to lactic acid (27). The mRNA levels of key glycolysis
enzymes are elevated in the blood of patients with IBD (12). Moreover, lactic acid production
is increased in mice with IL-10-deficient idiopathic colitis
(28). Khaloian et al
(15) also indicated that
inhibition of glycolysis was able to alleviate intestinal stem
cells damage caused by inflammation. Consistent with these, the
present study also found increased glycolysis level in the
inflammatory NCM460 cells. Furthermore, mRNA levels of key
glycolytic enzymes PFKFB3, LDHA and PFKP were elevated in colon
IECs from DSS-induced colitis.
Increasing evidence suggests a mutually regulatory
relationship between autophagy and glycolysis (29). For example, inhibition of PKM2
enzymatic activity activates autophagy in lung carcinoma cell lines
(30). Sorafenib-induced
autophagy promotes glycolysis by elevated glycolytic enzyme PKM2
activity in hepatocellular carcinoma cells (31). The present study found that
autophagy negatively regulated glycolysis by the degradation of
PFKFB3 in IECs. Therefore, the findings suggested a significant
correlation between autophagy in the intestinal epithelium and
metabolic processes.
PFKFB3 protein is one of the isoenzymes of
PFK-2/FBPase-2 and is mainly responsible for the conversion of
fructose-6-phosphat to fructose-2,6-bisphosphate. With the highest
kinase/phosphatase ratio among all PFK/FBPase-2 family members,
PFKFB3 promotes increased cellular glycolysis flux (32). The present study also
demonstrated that lactic acid production increased in an
PFKFB3-dependent manner in vitro.
To further elucidate the mechanism of PFKFB3
autophagic degradation, the present study first identified the
autophagy receptor for PFKFB3. Multiple autophagy receptors, such
as NDP52, OPTN, p62, and TAX1BP1, are capable of specifically
recognizing cargo proteins (20). PFKFB3 is reported as an autophagy
substrate bound to P62 in breast cancer stem cells (33). Consistently, the results of our
preliminary immunoprecipitation experiment also demonstrated P62
interacted with PFKFB3. For P62, it interacted with ubiquitinated
cargo due to its C-terminal UBA domain (19). Based on this, the present study
predicted and screened FZR1/Cdh1 as a PFKFB3 ubiquitination E3
ligase using the UbiBrowser website. PFKFB3 is degraded by
ubiquitination of FZR1/Cdh1 in astrocytes from rat brains (34). Notably, the present study also
found that FZR1/Cdh1 interacted with PFKFB3 in NCM460 cells and the
degradation of PFKFB3 was mediated by FZR1/Cdh1 ubiquitination.
Mechanistic analysis revealed that the K48-linked polyubiquitin
chain served as the specific ubiquitin code mediating
FZR1/Cdh1-induced degradation of PFKFB3 in intestinal epithelial
cells.
Subsequently, the present study investigated the
important effect of PFKFB3 on IBD. Inhibition of PFKFB3 activity
reduced inflammatory damage in DSS-induced colitis. Zhou et
al (35) also reported
increased stromal PFKFB3-mediated glycolysis contributed to
intestinal inflammation in IBD. In addition, inhibited PFKFB3
activity with PFK-15 prevented DSS induced reduction of claudin-5,
claudin-8 and occludin and increase of claudin-2 in colonic
epithelium. Claudin-5, claudin-8 and occludin are known as
'Sealing' tight junction proteins maintaining intestinal barrier
integrity. By contrast, the leaking protein claudin-2 is reported
to increase barrier permeability (36). The above results revealed that
inhibition of PFKFB3 expression could reduce inflammatory damage in
IBD and restored intestinal barrier function. In addition, the
present study underscored the critical interplay between intestinal
metabolism and inflammation, offering novel insights into the
regulation of intestinal epithelial metabolism in IBD and
suggesting potential avenues for therapeutic development.
A previous study demonstrated that urinary lactate
levels accurately reflect PFKFB3-mediated glycolytic abnormalities
and declining renal function in patients with chronic kidney
disease (CKD), suggesting their potential as a biomarker for
monitoring CKD progression (37). These findings raise an important
question: Could fecal lactate levels similarly reflect
PFKFB3-driven glycolytic dysregulation in IECs and serve as a
non-invasive biomarker for identifying IBD? At this stage, it was
recognized that the present study still had certain
limitations.
The present study demonstrated through both in
vivo and in vitro experiments that PFKFB3 intervention
exerted a significant therapeutic effect on intestinal damage
associated with IBD. Currently, the PFKFB3 small molecule inhibitor
has entered Phase I clinical trials and preliminary results have
demonstrated its favorable safety profile and promising anti-cancer
activity in patients with cancer (38). Accumulating evidence indicates
that PFKFB3 is closely linked to intestinal inflammatory responses,
suggesting the potential therapeutic utility of this inhibitor in
the clinical management of IBD. To facilitate the clinical
translation of PFKFB3 inhibitors, future research should prioritize
the development of advanced delivery systems, such as nanocarriers
or targeted encapsulation platforms, to minimize systemic toxicity
and improve tissue-specific targeting. Such an approach could
markedly accelerate the clinical application of PFKFB3-targeted
therapies for IBD treatment.
Based on the findings of the present study, a novel
strategy for combined autophagy and glycolysis-targeted therapy in
the treatment of IBD is proposed. Currently used clinical
therapeutics for IBD, such as corticosteroids and 5-aminosalicylic
acid, may exert part of their therapeutic effects through
inhibition of the glycolytic pathway (39). Meanwhile, a growing number of
studies have focused on developing therapeutic strategies for IBD
by modulating autophagy, with some promising advances achieved
(40-42). However, autophagy-based therapies
primarily aim to maintain the dynamic equilibrium of autophagic
activity in intestinal cells, rather than merely activating or
inhibiting the process. Consequently, precise control of drug
dosage remains a significant challenge (43). Although the dual-targeted
combined therapy strategy that simultaneously modulates autophagy
and glycolysis holds therapeutic potential, it may also give rise
to drug efficacy interference due to pharmacological interactions.
Moreover, the systemic physiological consequences of multi-pathway
interventions require thorough assessment. Therefore, precise
optimization of dosage regimens and temporal administration
schedules will be critical in determining the clinical viability of
this approach. It is noteworthy that recent studies have
demonstrated that specific dietary components can alleviate
intestinal symptoms of IBD by modulating intestinal autophagy
(44). These findings suggest
that combining pharmacological inhibition of abnormal intestinal
glycolysis with dietary interventions targeting autophagy
regulation may enhance the therapeutic efficacy of IBD
treatment.
In conclusion, increase of PFKFB3-mediated
glycolysis in IECs is involved in IBD intestinal inflammatory
damage and epithelial barrier breakdown. Autophagy in IECs could
inhibit glycolysis and maintain intestinal homeostasis by selective
degradation of PFKFB3. The present study indicated that PFKFB3 was
both a key glycolytic enzyme and an autophagy substrate,
establishing crosstalk between autophagy and glycolysis in IECs.
Combined therapy targeting autophagy and glycolysis might become a
new choice for clinical treatment of IBD.
Availability of data and materials
The data generated in the present study may be
requested from the corresponding author.
Authors' contributions
The project was designed and directed by MY, WX, TY
and HY. The experiments were performed by YP and FY. MY, YP and FY
analyzed the data. MY and YP wrote the manuscript. GD, LW and CX
collected clinical samples. MY, FY and YP confirm the authenticity
of all the raw data. All authors read and approved the final
manuscript.
Ethics approval and consent to
participate
All animal procedures were performed under the
guidelines of the Laboratory Animal Welfare and Ethics Committee of
the Third Military Medical University (approval no. AMUWEC20224496)
and was approved by the Laboratory Animal Welfare and Ethics
Committee of the Third Military Medical University (approval no.
AMUWEC20224496). Patient tissue collection followed the guidelines
and principles of the Helsinki Declaration and received approval
from the Ethics Committee of Second Affiliated Hospital of Army
Medical University (approval no. 2022-188-01). Written informed
consent was obtained from all study participants.
Patient consent for publication
Not applicable.
Competing interests
The authors declare that they have no competing
interests.
Abbreviations:
|
IBD
|
inflammatory bowel disease
|
|
CD
|
Crohn's disease
|
|
IECs
|
intestinal epithelial cells
|
|
PFKFB3
|
6-phosphofructo-2-kinase/fructose-2,6-bisphosphatase 3
|
|
DSS
|
dextran sulfate sodium salt
|
|
2-NBDG
|
2-deoxy-2-[(7-nitro-2,1,3-benzoxadiazol-4-yl) amino]-D-glucose
|
|
PFK-1
|
phosphofructokinase-1
|
|
FZR1/Cdh1
|
Fizzy and cell division cycle 20
related 1
|
|
Baf A1
|
bafilomycin A1
|
|
HK2
|
hexokinase 2
|
|
PKM2
|
phosphofructokinase, muscle 2
|
|
LDHA
|
lactate dehydrogenase A
|
|
PFKP
|
phosphofructokinase, platelet
|
|
CHX
|
cycloheximide
|
Acknowledgements
Not applicable.
Funding
The present study was supported in part by grants from Natural
Science Foundation of Chongqing (grant no. CSTB2023NSCQ-MSX0027 to
Min Yu), grants from the National Natural Science Foundation of
China (grant no. NSFC 81970468 to Min Yu), grants from the National
Natural Science Foundation of China (grant no. NSFC 82270585 to
Weidong Xiao) and grants from the Senior Medical Talents Program of
Chongqing for Young and Middle-aged (Min Yu).
References
|
1
|
Li S, Zhang F and Zhang Q: Pathological
features-based targeted delivery strategies in IBD therapy: A mini
review. Biomed Pharmacother. 151:1130792022. View Article : Google Scholar : PubMed/NCBI
|
|
2
|
Torres J, Mehandru S, Colombel JF and
Peyrin-Biroulet L: Crohn's disease. Lancet. 389:1741–1755. 2017.
View Article : Google Scholar
|
|
3
|
Mizushima N and Komatsu M: Autophagy:
Renovation of cells and tissues. Cell. 147:728–741. 2011.
View Article : Google Scholar : PubMed/NCBI
|
|
4
|
Foerster EG, Mukherjee T, Cabral-Fernandes
L, Rocha JDB, Girardin SE and Philpott DJ: How autophagy controls
the intestinal epithelial barrier. Autophagy. 18:86–103. 2022.
View Article : Google Scholar :
|
|
5
|
Saha K, Ganapathy AS, Wang A, Morris NM,
Suchanec E, Ding W, Yochum G, Koltun W, Nighot M, Ma T and Nighot
P: Autophagy reduces the degradation and promotes membrane
localization of occludin to enhance the intestinal epithelial tight
junction barrier against paracellular macromolecule flux. J Crohns
Colitis. 17:433–449. 2023. View Article : Google Scholar :
|
|
6
|
Aden K, Tran F, Ito G, Sheibani-Tezerji R,
Lipinski S, Kuiper JW, Tschurtschenthaler M, Saveljeva S,
Bhattacharyya J, Häsler R, et al: ATG16L1 orchestrates
interleukin-22 signaling in the intestinal epithelium via
cGAS-STING. J Exp Med. 215:2868–2886. 2018. View Article : Google Scholar : PubMed/NCBI
|
|
7
|
Zhou C, Li L, Li T, Sun L, Yin J, Guan H,
Wang L, Zhu H, Xu P, Fan X, et al: SCFAs induce autophagy in
intestinal epithelial cells and relieve colitis by stabilizing
HIF-1alpha. J Mol Med (Berl). 98:1189–1202. 2020. View Article : Google Scholar : PubMed/NCBI
|
|
8
|
Pral LP, Fachi JL, Corrêa RO, Colonna M
and Vinolo MAR: Hypoxia and HIF-1 as key regulators of gut
microbiota and host interactions. Trends Immunol. 42:604–621. 2021.
View Article : Google Scholar : PubMed/NCBI
|
|
9
|
Rath E, Moschetta A and Haller D:
Mitochondrial function-gatekeeper of intestinal epithelial cell
homeostasis. Nat Rev Gastroenterol Hepatol. 15:497–516. 2018.
View Article : Google Scholar : PubMed/NCBI
|
|
10
|
Ho GT and Theiss AL: Mitochondria and
inflammatory bowel diseases: Toward a stratified therapeutic
intervention. Ann Rev Physiol. 84:435–459. 2022. View Article : Google Scholar
|
|
11
|
Adolph TE, Meyer M, Schwärzler J, Mayr L,
Grabherr F and Tilg H: The metabolic nature of inflammatory bowel
diseases. Nat Rev Gastroenterol Hepatol. 19:753–767. 2022.
View Article : Google Scholar : PubMed/NCBI
|
|
12
|
Vermeulen N, Vermeire S, Arijs I, Michiels
G, Ballet V, Derua R, Waelkens E, Van Lommel L, Schuit F, Rutgeerts
P and Bossuyt X: Seroreactivity against glycolytic enzymes in
inflammatory bowel disease. Inflamm Bowel Dis. 17:557–564. 2011.
View Article : Google Scholar
|
|
13
|
Shimshoni E, Ghini V, Solomonov I,
Luchinat C, Sagi I and Turano P: Integrated metabolomics and
proteomics of symptomatic and early pre-symptomatic states of
colitis. bioRxiv. https://doi.org/10.1101/2020.03.22.002196.
|
|
14
|
Hamade H, Stamps JT, Stamps DT, More SK,
Thomas LS, Blackwood AY, Lahcene NL, Castanon SL, Salumbides BC,
Shimodaira Y, et al: BATF3 protects against metabolic syndrome and
maintains intestinal epithelial homeostasis. Front Immunol.
13:8410652022. View Article : Google Scholar : PubMed/NCBI
|
|
15
|
Khaloian S, Rath E, Hammoudi N, Gleisinger
E, Blutke A, Giesbertz P, Berger E, Metwaly A, Waldschmitt N, Allez
M and Haller D: Mitochondrial impairment drives intestinal stem
cell transition into dysfunctional Paneth cells predicting Crohn's
disease recurrence. Gut. 69:1939–1951. 2020. View Article : Google Scholar : PubMed/NCBI
|
|
16
|
Livak KJ and Schmittgen TD: Analysis of
relative gene expression data using real-time quantitative PCR and
the 2 (-Delta Delta C(T)) method. Methods. 25:402–408. 2001.
View Article : Google Scholar
|
|
17
|
Levine B and Kroemer G: Biological
functions of autophagy genes: A disease perspective. Cell.
176:11–42. 2019. View Article : Google Scholar : PubMed/NCBI
|
|
18
|
Collier JJ, Oláhová M, McWilliams TG and
Taylor RW: ATG7 safeguards human neural integrity. Autophagy.
17:2651–2653. 2021. View Article : Google Scholar : PubMed/NCBI
|
|
19
|
Lane JD, Korolchuk VI, Murray JT, Lamark
T, Svenning S and Johansen T: Regulation of selective autophagy:
The p62/SQSTM1 paradigm. Essays in Biochemistry. 61:609–624. 2017.
View Article : Google Scholar
|
|
20
|
Vargas JNS, Hamasaki M, Kawabata T, Youle
RJ and Yoshimori T: The mechanisms and roles of selective autophagy
in mammals. Nat Rev Mol Cell Biol. 24:167–185. 2022. View Article : Google Scholar : PubMed/NCBI
|
|
21
|
Ohtake F, Saeki Y, Ishido S, Kanno J and
Tanaka K: The K48-K63 branched ubiquitin chain regulates NF-κB
signaling. Mol Cell. 64:251–266. 2016. View Article : Google Scholar : PubMed/NCBI
|
|
22
|
Renz C, Asimaki E, Meister C, Albanèse V,
Petriukov K, Krapoth NC, Wegmann S, Wollscheid HP, Wong RP, Fulzele
A, et al: Ubiquiton-An inducible, linkage-specific
polyubiquitylation tool. Mol Cell. 84:386–400.e311. 2024.
View Article : Google Scholar
|
|
23
|
Telpaz S and Bel S: Autophagy in
intestinal epithelial cells prevents gut inflammation. Trends Cell
Biol. 33:817–819. 2023. View Article : Google Scholar : PubMed/NCBI
|
|
24
|
Larabi A, Barnich N and Nguyen HTT: New
insights into the interplay between autophagy, gut microbiota and
inflammatory responses in IBD. Autophagy. 16:38–51. 2020.
View Article : Google Scholar :
|
|
25
|
Zhou M, Xu W, Wang J, Yan J, Shi Y, Zhang
C, Ge W, Wu J, Du P and Chen Y: Boosting mTOR-dependent autophagy
via upstream TLR4-MyD88-MAPK signalling and downstream NF-kappaB
pathway quenches intestinal inflammation and oxidative stress
injury. EBioMedicine. 35:345–360. 2018. View Article : Google Scholar : PubMed/NCBI
|
|
26
|
Shi W, Peng K, Yu H, Wang Z, Xia S, Xiao
S, Tian D, Vallance BA and Yu Q: Autotaxin (ATX) inhibits autophagy
leading to exaggerated disruption of intestinal epithelial barrier
in colitis. Biochim Biophys Acta Mol Basis Dis. 1869:1666472023.
View Article : Google Scholar : PubMed/NCBI
|
|
27
|
Bian X, Jiang H, Meng Y, Li YP, Fang J and
Lu Z: Regulation of gene expression by glycolytic and gluconeogenic
enzymes. Trends Cell Biol. 32:786–799. 2022. View Article : Google Scholar : PubMed/NCBI
|
|
28
|
Martin FP, Rezzi S, Philippe D, Tornier L,
Messlik A, Hölzlwimmer G, Baur P, Quintanilla-Fend L, Loh G, Blaut
M, et al: Metabolic assessment of gradual development of moderate
experimental colitis in IL-10 deficient mice. J Proteome Res.
8:2376–2387. 2009. View Article : Google Scholar : PubMed/NCBI
|
|
29
|
Yang J, Zhou RM and Ma ZY: Autophagy and
energy metabolism. Autophagy: Biology and diseases: Basic Science.
1206:329–357. 2019. View Article : Google Scholar
|
|
30
|
Prakasam G, Singh RK, Iqbal MA, Saini SK,
Tiku AB and Bamezai RNK: Pyruvate kinase M knockdown-induced
signaling via AMP-activated protein kinase promotes mitochondrial
biogenesis, autophagy, and cancer cell survival. J Biol Chem.
292:15561–15576. 2017. View Article : Google Scholar : PubMed/NCBI
|
|
31
|
Yan X, Tian R, Sun J, Zhao Y, Liu B, Su J,
Li M, Sun W and Xu X: Sorafenib-induced autophagy promotes
glycolysis by upregulating the p62/HDAC6/HSP90 axis in
hepatocellular carcinoma cells. Front Pharmacol. 12:7886672022.
View Article : Google Scholar : PubMed/NCBI
|
|
32
|
Kotowski K, Rosik J, Machaj F, Supplitt S,
Wiczew D, Jabłońska K, Wiechec E, Ghavami S and Dzięgiel P: Role of
PFKFB3 and PFKFB4 in cancer: Genetic basis, impact on disease
development/progression, and potential as therapeutic targets.
Cancers (Basel). 13:9092021. View Article : Google Scholar : PubMed/NCBI
|
|
33
|
La Belle Flynn A, Calhoun BC, Sharma A,
Chang JC, Almasan A and Schiemann WP: Autophagy inhibition elicits
emergence from metastatic dormancy by inducing and stabilizing
Pfkfb3 expression. Nat Commun. 10:36682019. View Article : Google Scholar : PubMed/NCBI
|
|
34
|
Almeida A, Bolaños JP and Moncada S: E3
ubiquitin ligase APC/C-Cdh1 accounts for the Warburg effect by
linking glycolysis to cell proliferation. Proc Natl Acad Sci USA.
107:738–741. 2009. View Article : Google Scholar
|
|
35
|
Zhou Z, Plug LG, Patente TA, de
Jonge-Muller ESM, Elmagd AA, van der Meulen-de Jong AE, Everts B,
Barnhoorn MC and Hawinkels LJAC: Increased stromal PFKFB3-mediated
glycolysis in inflammatory bowel disease contributes to intestinal
inflammation. Front Immunol. 13:2022. View Article : Google Scholar
|
|
36
|
Pan YY, Deng Y, Su S, Yin JH, Chen YH,
Wang LC, Sun LH, Xiao WD and Du GS: Structure composition and
intracellular transport of clathrin-mediated intestinal
transmembrane tight junction protein. Inflammation. 46:18–34. 2022.
View Article : Google Scholar : PubMed/NCBI
|
|
37
|
Wang Y, Li H, Jiang S, Fu D, Lu X, Lu M,
Li Y, Luo D, Wu K, Xu Y, et al: The glycolytic enzyme PFKFB3 drives
kidney fibrosis through promoting histone lactylation-mediated
NF-κB family activation. Kidney Int. 106:226–240. 2024. View Article : Google Scholar : PubMed/NCBI
|
|
38
|
Shi L, Pan H, Liu Z, Xie J and Han W:
Roles of PFKFB3 in cancer. Signal Transduct Target Ther.
2:170442017. View Article : Google Scholar : PubMed/NCBI
|
|
39
|
Chen N, Xie QM, Song SM, Guo SN, Fang Y,
Fei GH and Wu HM: Dexamethasone protects against asthma via
regulating Hif-1α-glycolysis-lactate axis and protein lactylation.
Int Immunopharmacol. 131:1117912024. View Article : Google Scholar
|
|
40
|
Zhang H, Cui Z, Cheng D, Du Y, Guo X, Gao
R, Chen J, Sun W, He R, Ma X, et al: RNF186 regulates EFNB1 (ephrin
B1)-EPHB2-induced autophagy in the colonic epithelial cells for the
maintenance of intestinal homeostasis. Autophagy. 17:3030–3047.
2021. View Article : Google Scholar :
|
|
41
|
Yuan S, Liu BH, Cheng WW, Meng H, Hou XT,
Xue JC, Zhang HM and Zhang QG: Polyphyllin Ⅵ modulates macrophage
polarization through autophagy-NLRP3 inflammasome to alleviate
inflammatory bowel disease. Phytomedicine. 143:1566402025.
View Article : Google Scholar
|
|
42
|
Retnakumar SV and Muller S:
Pharmacological autophagy regulators as therapeutic agents for
inflammatory bowel diseases. Trends Mol Med. 25:516–537. 2019.
View Article : Google Scholar : PubMed/NCBI
|
|
43
|
Shao BZ, Yao Y, Zhai JS, Zhu JH, Li JP and
Wu K: The role of autophagy in inflammatory bowel disease. Front
Physiol. 12:6211322021. View Article : Google Scholar : PubMed/NCBI
|
|
44
|
Zhou M, Zhi J, Zhi J, Xiong Z, Wu F, Lu Y
and Hu Q: Polysaccharide from Strongylocentrotus nudus eggs
regulates intestinal epithelial autophagy through CD36/PI3K-Akt
pathway to ameliorate inflammatory bowel disease. Int J Biol
Macromol. 244:1253732023. View Article : Google Scholar : PubMed/NCBI
|