Introduction
Idiopathic pulmonary fibrosis (IPF) is a progressive
interstitial lung disease characterized by irreversible scarring of
lung tissue, posing a severe threat to middle-aged and elderly
populations globally. With a median survival of only 3-5 years
post-diagnosis, IPF presents a clinical challenge, offering few
effective treatment options (1,2).
Although treatments like pirfenidone and nintedanib can slow
disease progression, they do not provide a cure (3). This limitation highlights the
urgent need for the discovery of new molecular targets and
effective pharmacological strategies to halt or reverse the
progression of IPF.
The pathogenesis of IPF is driven by abnormal
extracellular matrix (ECM) accumulation, primarily regulated by the
transformation of fibroblasts into myofibroblasts. These
myofibroblasts excessively produce collagen and ECM proteins,
leading to gradual lung damage (4). Among ECM components, hyaluronic
acid (hyaluronan, HA), a prominent glycosaminoglycan, plays a
pivotal role in regulating cellular processes such as
proliferation, migration and differentiation (5,6).
Clinical studies have shown that HA is a critical factor in IPF: HA
concentrations are markedly elevated in the bronchoalveolar lavage
fluid of patients with IPF compared with healthy controls (7,8).
Furthermore, HA levels correlate inversely with lung function and
are higher in patients with progressive disease, linking HA to
disease severity and progression (7).
HA production is mediated by the hyaluronic acid
synthase (HAS) family, which includes three isoforms (HAS1, HAS2
and HAS3), using uridine diphosphate glucuronic acid (UDP-GlcA) and
uridine diphosphate N-acetylglucosamine (UDP-GlcNAc) as substrates
(9,10). Of these, HAS2 is the most
abundant and functionally significant variant, responsible for
synthesizing HA and controlling its distribution in tissues
(11). Given the elevated levels
of HA in IPF and the central role of HAS2 in HA production,
investigating the HAS2-HA pathway has emerged as a promising avenue
for understanding the mechanisms underlying IPF.
A significant knowledge gap exists in delineating
the specific roles of HAS2 and HA in the development of IPF. While
elevated HA levels are well-documented, the mechanistic links
between HAS2-driven HA production and key pathological processes in
IPF remain underexplored. Notably, macrophage polarization,
especially the shift toward the pro-fibrotic M2 subtype, is a major
contributor to IPF pathogenesis (12). However, the effect of HAS2 and HA
on this polarization process is not fully understood. Moreover,
despite the potential of HAS2 as a therapeutic target, no effective
interventions specifically targeting HAS2 have been developed,
leaving a critical gap in IPF treatment options.
The present study aimed to address these critical
gaps by investigating the role of HAS2 in the development of IPF
and evaluating the therapeutic potential of targeting HAS2 to
mitigate pulmonary fibrosis. Specifically, it was hypothesized that
HAS2-driven HA production exacerbated IPF progression by enhancing
myofibroblast activity and promoting macrophage M2 polarization. To
test this hypothesis, the present study employed a
multidisciplinary approach, combining in vitro cell models,
in vivo disease models, transcriptomic analysis and
high-throughput virtual screening. The primary objectives included:
Defining the mechanistic interactions between HAS2, HA and
macrophage M2 polarization in IPF; elucidating the effects of HAS2
inhibition on ECM deposition and fibroblast activation; and
assessing the therapeutic potential of novel HAS2-targeting
compounds in reducing pulmonary fibrosis.
Materials and methods
Cell culture
The NIH/3T3 mouse embryo fibroblast, HFL-1 human
fetal lung fibroblast and RAW264.7 mouse monocyte macrophage
leukemia cell lines were obtained from the National Collection of
Authenticated Cell Cultures. NIH/3T3 and RAW264.7 cells were
cultured in complete DMEM (Gibco; Thermo Fisher Scientific, Inc.),
while HFL-1 cells were maintained in complete Ham's F-12K medium
(Procell Life Science & Technology Co., Ltd.). All media were
supplemented with 10% fetal bovine serum and 1%
penicillin-streptomycin (Gibco; Thermo Fisher Scientific, Inc.).
The cultures were incubated at 37°C with 5% CO2.
Mining differential expression genes in
IPF lungs from the gene expression omnibus (GEO) database
A comprehensive analysis was performed using the GEO
database (13) to explore gene
expression differences between normal and IPF-affected lung
tissues. The focus was on the GSE110147 dataset, which includes
expression profiles from 11 normal lung tissue samples (age 52±18
years; Male/Female 7/4) and 22 samples from patients with IPF (age
62±6 years; Male/Female 14/5). Detailed patient information can be
found in the referenced literature (14). Differential expression analysis
was performed using GEO2R (13)
to compare gene expression across sample groups. A significance
threshold was set with a Log2 fold change of 1 and a
P-value of 0.05. The Benjamini and Hochberg method was applied to
adjust P-values for multiple comparisons, controlling the false
discovery rate. A volcano plot was generated using the
bioinformatics cloud platform (https://www.bioinformatics.com.cn) for data
visualization.
Transcriptome sequencing
For in vitro studies, NIH/3T3 fibroblasts
were treated with or without 5 ng/ml recombinant TGF-β1 (R&D
Systems, Inc.) for 12 h prior to RNA collection for transcriptomic
analysis (n=3 per group). Transcriptomic data for these samples
were derived from our prior study (15) and were re-analyzed in the context
of the present work. For in vivo studies, a total of six
specific pathogen-free (SPF) male C57BL/6J mice (aged 6-8 weeks,
weight 22-24 g) were used. Mice were purchased from Guangdong Vital
River Laboratory Animal Technology Co., Ltd. and housed in the
SPF-grade animal facility at the Shenzhen Institute of Technology,
Hong Kong Polytechnic University. Housing conditions were
maintained at a temperature of 22±2°C, a 12-h light/dark cycle and
a humidity of 50±10%. Mice were randomly assigned to either a
control group or a bleomycin (BLM)-induced fibrosis model group.
After anesthesia with 3-4% isoflurane, pulmonary fibrosis was
induced in the model group by intratracheal administration of 2.5
mg/kg BLM (Shanghai Macklin Biochemical Technology Co., Ltd.),
while control mice received an equivalent volume of sterile saline.
Three weeks post-treatment, lung tissues were harvested for
transcriptomic analysis (n=3 per group). Transcriptome sequencing
was conducted by Wekemo Tech Group using the Illumina platform
(Illumina, Inc.). Gene expression levels were quantified in
Fragments Per Kilobase of transcript per Million mapped reads and
differential expression analysis was performed using the DESeq2 R
package v1.26.0 (16). Genes
were considered differentially expressed if their adjusted P-values
were <0.05 and Log2 fold change >1.
Single-cell RNA sequencing
SPF male C57BL/6J mice were randomly assigned to
either a control group (saline; n=3) or a pulmonary fibrosis model
group (BLM 2.5 mg/kg intratracheal; n=3). Lungs were harvested 14
days post-exposure, preserved in sCelLive solution (Singleron
Biotechnologies GmbH), minced, and digested with sCelLive
dissociation solution using the PythoN™ System (Singleron
Biotechnologies GmbH). Cell suspensions were filtered through a 40
μm mesh, red blood cells were lysed using GEXSCOPE RCLB
(Singleron Biotechnologies GmbH), and cell viability was assessed
via Trypan Blue staining (Bio-Rad Laboratories, Inc.) at room
temperature for 2-3 min. Single-cell suspensions (2×10⁵
cells/ml) were processed on the Matrix System (Singleron
Biotechnologies GmbH) for barcoding, reverse transcription, cDNA
amplification, and library construction using GEXSCOPE Kits
(Singleron Biotechnologies GmbH). Libraries (4 nM) were sequenced
on an Illumina NovaSeq 6000 (150 bp PE; Illumina, Inc.). Raw reads
were trimmed using Cutadapt v1.17 (17), aligned to GRCm38 with STAR
v2.6.1a (18), and Unique
Molecular Identifier (UMI)/gene counts were generated using
featureCounts v2.0.1 (19).
Using Scanpy v1.8.2 (20), cells
were filtered based on gene count (<200 or top 2%), UMI count
(top 2%) and mitochondrial content (>50%); genes detected in
fewer than 5 cells were excluded, resulting in 76,995 cells
retained for analysis. Potential doublets were identified and
filtered using Scrublet v0.2.3 (21). Counts were normalized,
log-transformed, and the top 2000 variable genes were subjected to
Principal Component Analysis. Louvain clustering (resolution=1.2,
32 clusters) using the top 20 PCs was visualized via Uniform
Manifold Approximation and Projection (UMAP). Differentially
expressed genes (DEGs) were identified with Seurat's (v3.2.3)
FindMarkers (22) using the
Wilcoxon test (expressed in >10% of cluster cells, mean logFC
>0.25). Clusters were annotated using canonical markers
(DEGs/literature) and heatmaps. Cell types were assigned via the
SynEcoSys database (www.synecosys.com).
Western blotting
Total proteins were isolated from cells or tissue
samples using PIPA lysis buffer (Thermo Fisher Scientific, Inc.).
Protein concentration was determined using the Pierce BCA Protein
Assay Kit (Thermo Fisher Scientific, Inc.) according to the
manufacturer's instructions. Equal amounts of protein (20 μg
per lane) were separated by SDS-PAGE [Shenzhen Dakewe
Bio-engineering Co., Ltd.; cat. no. 8012011; suitable for the
separation and identification of (10~250) kDa proteins, without the
need to adjust the separation gel concentration based on protein
size]. Proteins were then transferred onto PVDF membranes
(MilliporeSigma). After blocking for 60 min at room temperature
with 5% non-fat milk, the membranes were incubated overnight at 4°C
with primary antibodies. Antibodies for Collagen type I α 1 chain
(COL1A1; cat. no. 72026; 1:1,000), Phospho-STAT6 (Tyr641; cat. no.
56554S; 1:1,000) and α-smooth muscle actin (α-SMA; cat. no. 19245;
1:1,000) were obtained from Cell Signaling Technology, Inc. The
HAS2 (cat. no. bs-11290R; 1:1,000) antibody was purchased from
BIOSS and HRP-conjugated β-tubulin (cat. no. HRP-66240: 1:20,000)
and STAT6 (cat. no. 51073-1-AP; 1:5,000) antibodies were obtained
from Proteintech Group, Inc. Membranes were incubated for 1 h at
room temperature with an HRP-conjugated secondary antibody (Cell
Signaling Technology, Inc.; 1:2,000) following TBS-T (containing
0.05% Tween-20) washing. Protein bands were detected using
Immobilon Western Chemiluminescent substrate (MilliporeSigma) and
imaged with a Tanon 5200 Multi automatic chemiluminescence system
(Tanon Science and Technology Co., Ltd.).
Reverse transcription-quantitative (RT-q)
PCR
RNA extraction, cDNA synthesis and qPCR were
performed according to the manufacturers' protocols. Total RNA was
extracted from cells (1-2×10⁶) or tissue samples using
the RNA extraction kit (Accurate Biology). RNA was then reverse
transcribed into cDNA using the First-Strand cDNA synthesis kit
(TransGen Biotech Co., Ltd.). The SYBR Green Premix qPCR Kit
(Accurate Biology) was used to set up the real-time PCR system, and
analysis was performed on the Roche LightCycler 480 II (Roche
Diagnostics, Ltd.). The thermal cycling conditions were as follows:
Initial denaturation at 95°C for 30 sec; followed by 40 cycles of
denaturation at 95°C for 5 sec, annealing/extension at 60°C for 30
sec. Data were analyzed using the 2−ΔΔCq method for
relative quantification (23),
with normalization to GAPDH mRNA levels. Primer sequences for the
target genes are provided in Table
SI.
Enzyme-linked immunosorbent assay
(ELISA)
Cell culture supernatants and mouse serum were
collected and analyzed using ELISA assay kits according to the
manufacturer's instructions. HA content was measured with the HA
ELISA kit (Beijing Solarbio Science & Technology Co., Ltd.;
cat. no. SEKH-0509), while TGF-β1 levels were assessed using the
Mouse TGF-β1 ELISA Kit (Proteintech Group, Inc.; cat. no.
KE10005).
Isolation and culture of primary mouse
lung fibroblasts
Primary lung fibroblasts were isolated from C57BL/6J
mice in both the control (saline-treated) and BLM-induced fibrosis
model groups, following an established protocol with minor
modifications (24). Briefly,
lung tissues were aseptically collected, minced, and subjected to
sequential enzymatic digestion with a collagenase/dispase cocktail
(1 mg/ml) followed by 0.25% Trypsin-EDTA. After RBC lysis, the cell
suspension was resuspended in fibroblast growth medium (DMEM with
10% FBS, 1% penicillin/streptomycin, and amphotericin B) and
plated. Explanted tissue fragments were retained in the culture
dish to facilitate fibroblast outgrowth. Cells were maintained in a
humidified incubator at 37°C with 5% CO2 and passaged
once they reached confluence. Fibroblasts at passage 2 were
harvested for protein analysis.
Flow cytometry analysis
HA was purchased from Shanghai Macklin Biochemical
Technology Co., Ltd. To generate low molecular weight HA, the HA
sample was subjected to sonication (60 W, 20 sec each time, a total
of 3 times) while kept on ice. The molecular size of the HA after
sonication was assessed by agarose gel electrophoresis as
previously described (25).
Briefly, samples alongside HA molecular weight standards (10-200,
400-800, 1,500-2,500 kDa) were separated on a 1% agarose gel,
followed by staining with StainsAll (MilliporeSigma) at room
temperature with gentle agitation overnight for visualization. To
assess macrophage polarization into M1 and M2 subtypes, RAW264.7
macrophages were stimulated with HA in vitro. After
stimulation for the indicated time period, RAW264.7 cells
(1-5×10⁶) were stained with fluorophore-conjugated
antibodies targeting canonical surface markers: Phycoerythrin
(PE)-labeled anti-CD86 (M1 marker; BioLegend, Inc.; cat. no.
159204) and fluorescein isothiocyanate (FITC)-labeled anti-CD206
(M2 marker; BioLegend, Inc.; cat. no. 141704). Cells were incubated
with antibodies in the dark on ice for 30 min, washed twice with
cold PBS, and analyzed using a Beckman CytoFlex flow cytometer
(Beckman Coulter, Inc.). FlowJo v10 software (BD Biosciences) was
used to calculate the percentage of
CD86+/CD206+ subpopulations and quantify
phenotypic shifts.
Overexpression and knockdown of HAS2 in
fibroblasts
To investigate the functional role of HAS2, the
present study employed both gain-of-function and loss-of-function
approaches in NIH/3T3 fibroblasts. The lentivirus for
overexpression and the shRNA plasmid for knockdown were both
designed, constructed and provided by Shanghai GeneChem Co., Ltd.
For HAS2 overexpression, a lentiviral construct (GV492 vector)
carrying the full-length mouse HAS2 coding sequence (GenBank:
NM_008216.3) was used. Lentiviral particles (titer:
2.00×10⁹ TU/ml) were transduced into cells at a
multiplicity of infection (MOI) of 50. After 16 h, the medium was
replaced with fresh culture medium. Stably transduced cells were
selected with 2 μg/ml puromycin starting 72 h
post-transduction. Following initial selection, the puromycin
concentration was reduced to a maintenance level of 1 μg/ml
for continued culture and expansion of the transduced population.
For HAS2 knockdown, a short hairpin RNA (shRNA) targeting the
sequence 5'-CCTGCCAAGATGTTTGCAATT-3' was cloned into a GV493
lentiviral vector. A non-targeting scramble shRNA
(5'-TTCTCCGAACGTGTCACGT-3') served as the negative control. Plasmid
(2.5 μg) was transfected into NIH/3T3 cells using
Lipofectamine® 3000 (Invitrogen; Thermo Fisher
Scientific, Inc.) according to the manufacturer's protocol. Cells
were processed for subsequent experiments 24 h
post-transfection.
High-throughput virtual screening
High throughput virtual screening was used to screen
natural products that can target HAS2 protein. Protein Preparation:
The three-dimensional structure of human HAS2 (AlphaFold ID:
AF-Q92819-F1) was downloaded from the AlphaFold database (26) and processed using the Protein
Preparation Wizard module of Schrödinger Maestro v11.4. The protein
was hydrogenated and energy-optimized. Compound Preparation: The 2D
structures of compounds from a Natural Product Library (3,995
compounds, MedChemExpress) were hydrogenated and energetically
optimized using the LigPrep module of Schrödinger Maestro v11.4 to
generate 3D structures for virtual screening. Virtual screening was
conducted with the Virtual Screening Workflow module for molecular
docking. The prepared compounds were imported for molecular docking
using the Glide module, which involved geometric and energetic
matching of receptor and ligand. The compounds were screened
against HAS2 using standard precision mode. The binding affinities
and structures of the top 200 compounds from the natural product
library were reviewed based on molecular docking scores for
output.
Selection of optimal compounds based on
ADME parameters
The top 200 compounds, based on docking scores, were
converted to SMILES format and analyzed for ADME parameters using
the SwissADME website (http://www.swissadme.ch/). Optimal compounds were
selected based on criteria such as lipophilicity (XLOGP3 between
−0.7 and +5.0), molecular weight (150-500 g/mol), polarity (TPSA
between 20 and 130 Å2), solubility (log S ≤-6),
saturation (at least 0.25 fraction of sp3 hybridized
carbons), and flexibility (maximum of 9 rotatable bonds).
Molecular dynamics simulation (MDS)
analysis
To elucidate the molecular binding mechanism between
OG and HAS2, including key interaction residues, dynamic stability
and binding free energy, molecular docking and MDS were conducted
using GROMACS v2023.1 (www.gromacs.org). The structures of OG (PubChem CID:
12315192) and HAS2 (PDB ID: Q92819) were retrieved from PubChem
(https://pubchem.ncbi.nlm.nih.gov/)
and AlphaFold (26),
respectively. The systems were solvated in a water box with a 1.0
nm cutoff, using the MMFF and Charmm36 force fields for the protein
and TIP3P for water. Electrostatic interactions were calculated
with PME, and covalent bonds were constrained using the LINCS
algorithm (27). Counter ions
(Na+/Cl−) were added to neutralize the
systems, and energy minimization was carried out using the steepest
descent method. After equilibration under NVT conditions, a 100 ps
position restraint MDS was performed before production runs in the
NPT ensemble with a 2 fsec timestep. Temperature and pressure
coupling were achieved using V-rescale and the Parrinello-Rahman
barostat. The trajectories were analyzed using VMD v1.9.3 (28), PyMOL v3.1.0 (29) and Origin v2024 (30). Hydrogen bonds were analyzed with
the VMD Hydrogen Bonds plugin (28), with stable hydrogen bonds defined
as having ≥50% occupancy. The ligand-protein binding free energy
was estimated using the MM/PBSA method in GROMACS (31).
Surface plasmon resonance (SPR)
To validate the binding affinity and kinetic
parameters of OG (MedChemExpress; Purity: 99.57%) to immobilized
HAS2, as predicted by computational simulations, SPR analysis was
performed using a Biacore T200 system (Cytiva). The CM5 sensor chip
(Fc2 channel) was activated with a 400 mM EDC/100 mM NHS mixture
(10 μl/min, 800 sec), followed by covalent immobilization of
recombinant human HAS2 (100 μg/ml in 10 mM NaAc, pH 4.0) to
achieve 10,993 response units. The chip was deactivated by
injecting 1 M ethanolamine hydrochloride into both sample channels
at 10 μl/min for 800 sec. The running buffer was prepared by
mixing PBS-P with 5% DMSO. OG was prepared in seven concentrations
(1,250, 625, 312.5, 156.3, 78.2, 39.1, 19.6 and 0 μM) and
introduced into the Fc1-Fc2 channels at 30 μl/min for 60 sec
to allow binding, followed by a 90-sec dissociation phase.
Cellular thermal shift assay (CETSA)
CETSA was performed on cell lysates following the
established protocol (32,33). CETSA was employed to confirm the
direct binding of OG to HAS2 via ligand-induced thermal
stabilization. NIH/3T3 cells were pretreated with 5 ng/ml TGF-β1
for 24 h to upregulate endogenous HAS2 expression, followed by cell
collection, washing with cold PBS, and lysis (with a proteinase
inhibitor) through three freeze-thaw cycles. Lysates were
centrifuged at 20,000 x g for 20 min at 4°C to isolate soluble
fractions, which were then adjusted to 4 μg/μl (as
determined by BCA assay). The lysates were divided into two groups:
100 μM OG treatment or DMSO control (1 h at room
temperature). Aliquots were heated at 3°C intervals (37-70°C) for 3
min, cooled for 3 min at room temperature, and re-centrifuged (4°C;
20,000 x g; 20 min). The supernatants were denatured with 5X
loading buffer (100°C for 10 min) and analyzed by western blotting
to assess protein stability.
CCK-8 assay
The effect of OG on NIH/3T3 and HFL-1 cell
proliferation was evaluated using the CCK-8 assay. Cells were
plated at 3,000 cells per well in a 96-well plate, treated with
eight drug concentration gradients (0-100 μM), and incubated
for 48 h. Afterward, 10 μl of CCK-8 solution (Biosharp Life
Sciences) was added to each well, followed by an incubation period
of 1-4 h. Absorbance at 450 nm was recorded using a microplate
reader.
Animal experimental protocol
Part 1: Time-course analysis of HAS2 and HA
dynamics. To delineate the temporal dynamics of HAS2 expression and
HA accumulation during fibrotic progression, a cohort of 35 SPF
male C57BL/6J mice (6-8 weeks old) was used. Mice were randomly
assigned to seven groups (n=5 per group): a saline control group
(Day 0) and BLM-treated groups sacrificed at 3, 5, 7, 10, 14, and
21 days post-instillation. Pulmonary fibrosis was induced via a
single intratracheal administration of BLM (2 mg/kg) under
isoflurane anesthesia (3-4% for induction, 1-1.5% for maintenance);
control mice received an equal volume of saline. At each designated
endpoint, mice were anesthetized with intraperitoneal injection of
pentobarbital sodium (50 mg/kg). After anesthesia induction,
sacrifice was performed by exsanguination. Death was confirmed by
the absence of spontaneous breathing, heartbeat, and corneal
reflex, along with pupillary dilation. Bronchoalveolar lavage fluid
(BALF) and lung tissues were then collected for subsequent
analysis.
Part 2: Therapeutic efficacy assessment of OG. SPF
male C57BL/6J mice (6-8 weeks old) were randomly assigned to six
groups (n=8/group) using a computer-generated sequence: i) naïve
control (saline vehicle), ii) BLM-induced fibrosis model
(untreated), iii) OG-Low (25 mg/kg/day OG), iv) OG-Medium (50
mg/kg/day OG), v) OG-High (100 mg/kg/day OG) and vi) positive
control (pirfenidone 100 mg/kg/day). The mice were housed in the
SPF-grade animal facility at Shenzhen Glorybay Biotech Co., Ltd.,
under controlled conditions maintained at a temperature of 22±2°C,
a 12-h light/dark cycle and a humidity of 50±10%. Pulmonary
fibrosis was induced in groups 2-6 via intratracheal administration
of BLM under isoflurane anesthesia, while control mice received an
equivalent volume of saline. Therapeutic interventions were
administered daily via oral gavage (0.1 ml/10 g body weight)
starting 24 h post-induction, and continued for 14 days, with
Groups 1 and 2 receiving volume-matched saline. After two weeks of
treatment, anesthesia was induced by an intraperitoneal injection
of sodium pentobarbital (50 mg/kg), followed by sacrifice via
exsanguination. Serum and lung tissues were then collected for
further analysis.
Histological analysis
The left lungs of the mice were preserved in 10%
formalin at room temperature for 24 h. The tissues were then
dehydrated through a graded ethanol series (70, 80, 95 and 100%),
cleared in xylene, and embedded in paraffin. Thin slices of ~4-5
μm were prepared for subsequent staining procedures. Lung
injury and inflammation were assessed using hematoxylin and eosin
(H&E) staining (performed at room temperature; hematoxylin for
5-8 min, eosin for 1-3 min) to visualize cellular morphology and
inflammation. Masson's trichrome staining was performed at room
temperature using a commercial kit (Solarbio, Beijing, China)
according to the manufacturer's instructions to evaluate collagen
deposition in lung tissue samples.
Quantification of OG exposure in serum
and lung tissues
To evaluate the systemic and pulmonary exposure of
OG following oral administration, OG concentrations in serum and
lung tissue homogenates were measured in BLM-induced fibrotic mice
treated with OG at three dose levels (25, 50 and 100 mg/kg/day).
After 14 days of treatment, blood samples were collected and
centrifuged at 2,000 x g for 15 min at 4°C to obtain serum. The
right lung lobes were excised, weighed and homogenized in ice-cold
saline using a tissue homogenizer with zirconia beads until a
uniform suspension was achieved. OG concentrations in serum and
lung homogenates were quantified using a validated ultra-high
performance liquid chromatography-tandem mass spectrometry
(UHPLC-MS/MS) method. Briefly, the samples were pretreated by
protein precipitation with acetonitrile, followed by nitrogen
evaporation and reconstitution in 20% methanol. Chromatographic
separation was performed on a Waters ACQUITY UPLC HSS T3 column
(2.1×100 mm ×1.8 μm; Waters China, Ltd.) with gradient
elution using acetonitrile and 0.1% formic acid in water. Mass
detection was conducted in negative electrospray ionization mode
with multiple reaction monitoring (MRM) of the transitions m/z
285.1-123.2 for OG and m/z 271.2-107.8 for the internal standard
(arbutin). The method demonstrated good linearity (0.0408-4.08
μg/ml), specificity, and recovery (85-120%) in both
matrices.
Statistical analysis
All data are presented as mean ± standard deviation
(SD). All reported replicates are independent biological
replicates. Statistical analysis was performed using GraphPad Prism
(Dotmatics) to identify significant differences. The normality of
data distribution was assessed with the Shapiro-Wilk test. For
comparisons between two groups, a two-tailed Student's t-test was
applied to normally distributed data; otherwise, an appropriate
nonparametric test was used. For comparisons among multiple groups,
one-way analysis of variance (ANOVA) followed by Tukey's post hoc
test was used when the data met normality and homogeneity of
variance assumptions; otherwise, the nonparametric Kruskal-Wallis
test followed by Dunn's post hoc test was applied. P<0.05 was
considered to indicate a statistically significant difference.
Results
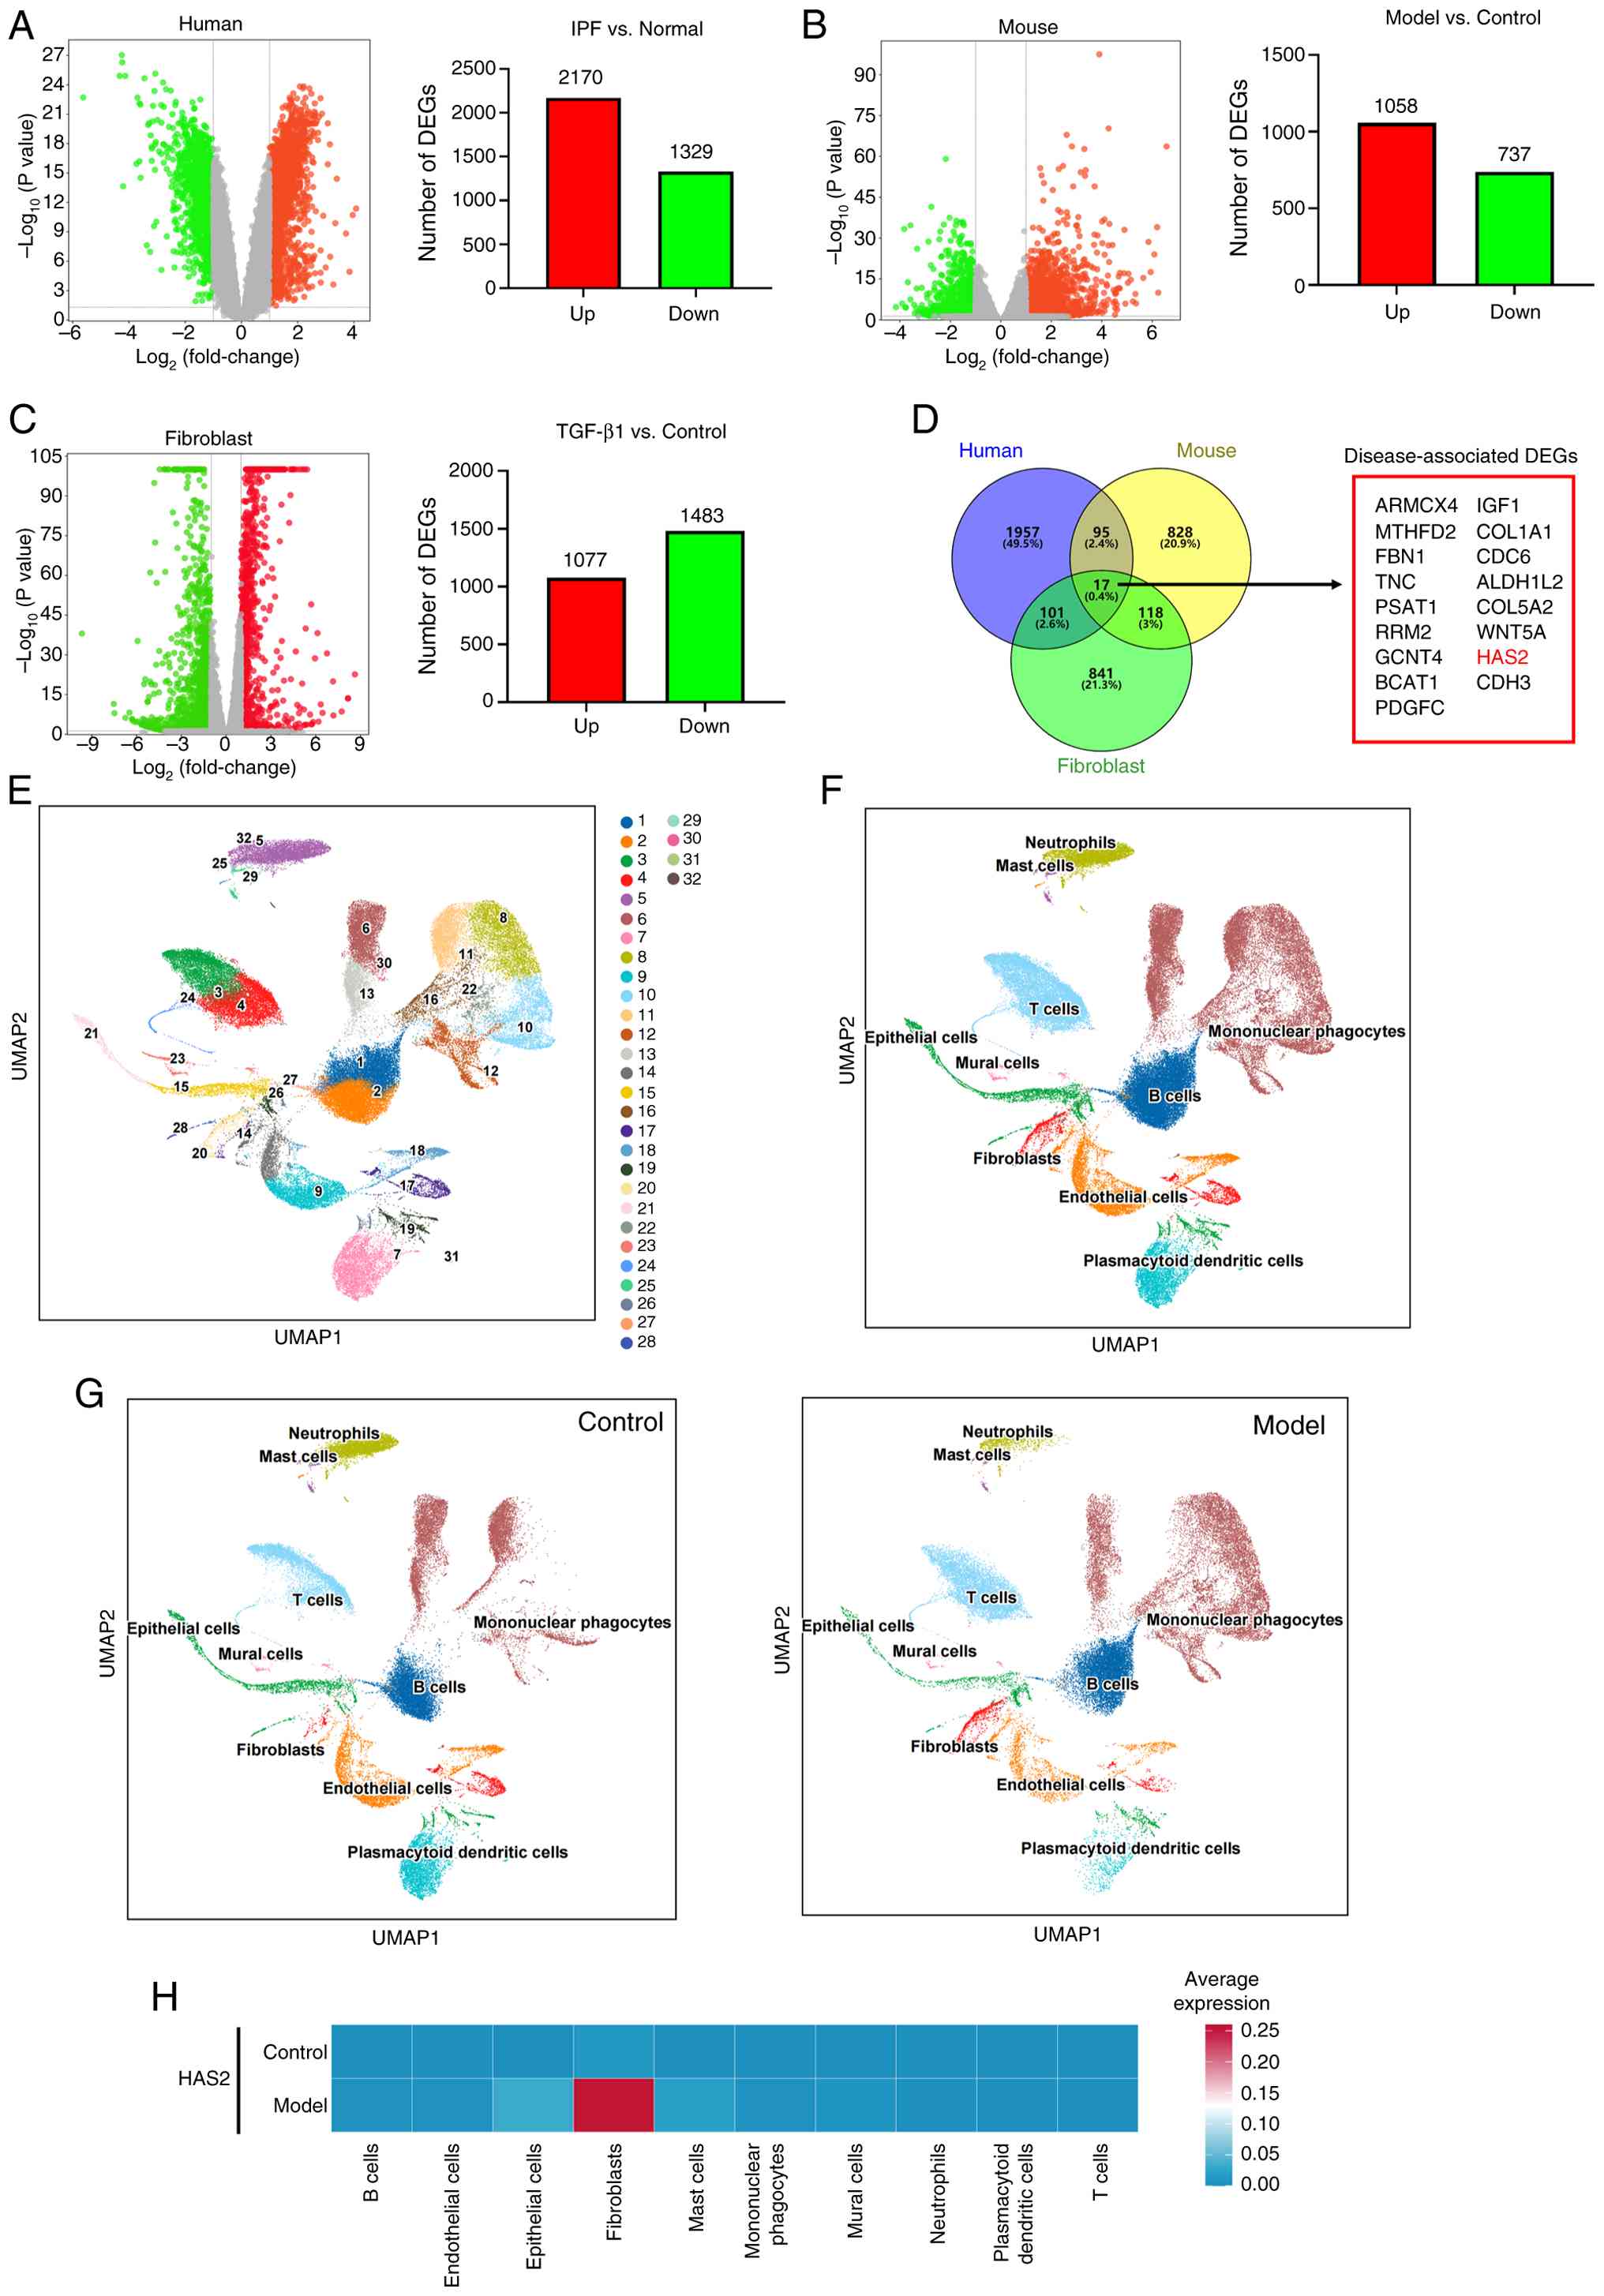
Cross-species transcriptomics and
single-cell resolution analysis reveal fibroblast-specific
elevation of HAS2 expression in pulmonary fibrosis
To systematically identify conserved molecular
signatures of IPF pathogenesis, comparative transcriptomic analyses
were performed across human clinical samples, animal models and
in vitro systems. Bioinformatic analysis of the GSE110147
dataset from the GEO database revealed significant dysregulation of
3,499 genes in patients with IPF compared with healthy controls,
with 2,170 genes upregulated and 1,329 downregulated (Fig. 1A). A parallel investigation of a
BLM-induced pulmonary fibrosis murine model showed similar
transcriptional alterations, with 1,058 genes markedly upregulated
and 737 downregulated in fibrotic lung tissues relative to healthy
controls (Fig. 1B). In
complementary cellular experiments, TGF-β1-stimulated myofibroblast
differentiation in NIH/3T3 cells resulted in substantial
transcriptomic remodeling, with 1,077 genes upregulated and 1,483
downregulated compared with untreated fibroblasts (Fig. 1C). Cross-species comparative
analysis identified 17 evolutionarily conserved genes that were
consistently upregulated across all three experimental systems
(human IPF samples, murine fibrosis models, and TGF-β1-activated
myofibroblasts). This core signature of 17 intersecting genes
(Fig. 1D) represents potential
conserved therapeutic targets for pulmonary fibrosis
intervention.
 | Figure 1Cross-species transcriptomics and
single-cell resolution analysis reveal fibroblast-specific
elevation of HAS2 expression in pulmonary fibrosis. (A) Analysis of
gene expression profiles from the GSE110147 dataset in the GEO
database identified DEGs in patients with IPF (n=22) compared with
healthy controls (n=11), with upregulated genes (red) and
downregulated genes (green) indicated. (B) Transcriptome sequencing
was conducted in a BLM-induced pulmonary fibrosis mouse model to
evaluate DEGs by comparing fibrotic mice with normal controls (n=3
for each group), with upregulated genes (red) and downregulated
genes (green) indicated. (C) NIH/3T3 cells were stimulated with
TGF-β1 to induce myofibroblast transition and transcriptome
sequencing was performed to assess DEGs, comparing myofibroblasts
to fibroblasts (n=3 for each group). (D) A comprehensive analysis
combining data from human, mouse, and cell models to identify key
upregulated genes markedly associated with IPF. (E) UMAP plot of
76,995 quality-filtered cells clustered into 32 distinct
populations. (F) UMAP visualization annotating clusters into 10
major cell types, with relative cell quantities displayed.
Populations include B cells, endothelial cells, epithelial cells,
fibroblasts, mast cells, mononuclear phagocytes, mural cells,
neutrophils, plasmacytoid dendritic cells, and T cells. (G)
Comparative UMAP plots demonstrating conserved spatial distribution
of annotated cell types across saline-treated controls and
BLM-induced fibrotic lungs (n=3 for each group). (H) Heatmap of
cell type-specific HAS2 expression, highlighting significant
upregulation exclusively in fibroblast populations of fibrotic
lungs. HAS2, hyaluronic acid synthase 2; GEO, Gene Expression
Omnibus; DEGs, differentially expressed genes; IPF, idiopathic
pulmonary fibrosis; BLM, bleomycin; UMAP, Uniform Manifold
Approximation and Projection. |
To explore cellular heterogeneity in fibrotic
pathogenesis, single-cell transcriptomic profiling was performed on
pulmonary tissues from BLM-challenged mice and saline-treated
controls. After quality filtering, 76,995 cells were retained and
clustered into 32 distinct cell populations (Fig. 1E). The per-sample UMAP
embeddings, shown in Fig. S1,
demonstrated consistent cell distribution patterns across
individual mice within each group. The marker genes defining each
of these 32 clusters are listed in Table SII. Cell type annotation was
validated through heatmap visualization of canonical marker gene
expression for each major cell type (Fig. S2). These clusters were
subsequently annotated into 10 major cell types (Fig. 1F), including B cells (15,558
cells), endothelial cells (7,238 cells), epithelial cells (4,383
cells), fibroblasts (2,430 cells), mast cells (368 cells),
mononuclear phagocytes (24,214 cells), mural cells (645 cells),
neutrophils (5,319 cells), plasmacytoid dendritic cells (4,551
cells) and T cells (12,289 cells). Comparative UMAP visualization
revealed conserved clustering patterns for all 10 annotated cell
types across control and fibrotic lungs (Fig. 1G). Cell type-specific
differential expression analysis identified significant HAS2
upregulation exclusively in the fibroblast populations of
BLM-treated mice (Fig. 1H),
while expression remained stable across other lineages. This cell
type-specific dysregulation corroborated prior bulk transcriptome
findings and localized HAS2 hyperactivity to pathogenic fibroblast
subsets.
HAS2 and its product HA elevation
confirmed in murine and cellular fibrosis models
Bulk transcriptomic and single-cell RNA sequencing
analyses clearly indicated that HAS2 is highly expressed in both
murine models of pulmonary fibrosis and myofibroblasts. To define
the dynamic profile of HAS2 and its product HA during fibrosis
development, the present study performed a longitudinal analysis in
BLM-challenged mice. Lung tissues and BALF were collected across a
time course encompassing the inflammatory and fibrotic phases
(Fig. 2A). Western blot analysis
revealed that the expression of the fibrotic marker COL1A1 was
markedly increased from day 7 onward, peaking at days 14 and 21.
HAS2 protein levels exhibited a parallel escalating trend,
demonstrating a strong temporal correlation with collagen
deposition (Fig. 2B). Notably,
HA levels in BALF increased sharply, reaching a peak at day 5 and
remained highly elevated throughout the subsequent observation
period until day 21 (Fig. 2C),
identifying HA as an early-sustained pathogenic component preceding
full fibrotic consolidation. To further validate the cellular
source of HAS2 upregulation and its association with fibrotic
activation, the present study isolated primary lung fibroblasts
from control and BLM-treated mice (Fig. 2D). Western blot analysis of these
primary cells demonstrated a significant concomitant increase in
the protein levels of both COL1A1 and HAS2 in fibroblasts derived
from fibrotic lungs compared with those from control lungs
(Fig. 2E). Similar results were
observed in the TGF-β1-induced myofibroblast model (Fig. 2F). Following stimulation with
TGF-β1, the expression of fibrotic markers COL1A1 and ACTA2 in
NIH/3T3 fibroblasts was markedly upregulated, indicating their
differentiation into myofibroblasts (Fig. 2G). Concomitantly, both HAS2
protein and mRNA levels were markedly increased (Fig. 2G and H). Furthermore, HA levels
were markedly increased in the culture medium of myofibroblasts,
further supporting the association of HAS2 activity with enhanced
HA production (Fig. 2I).
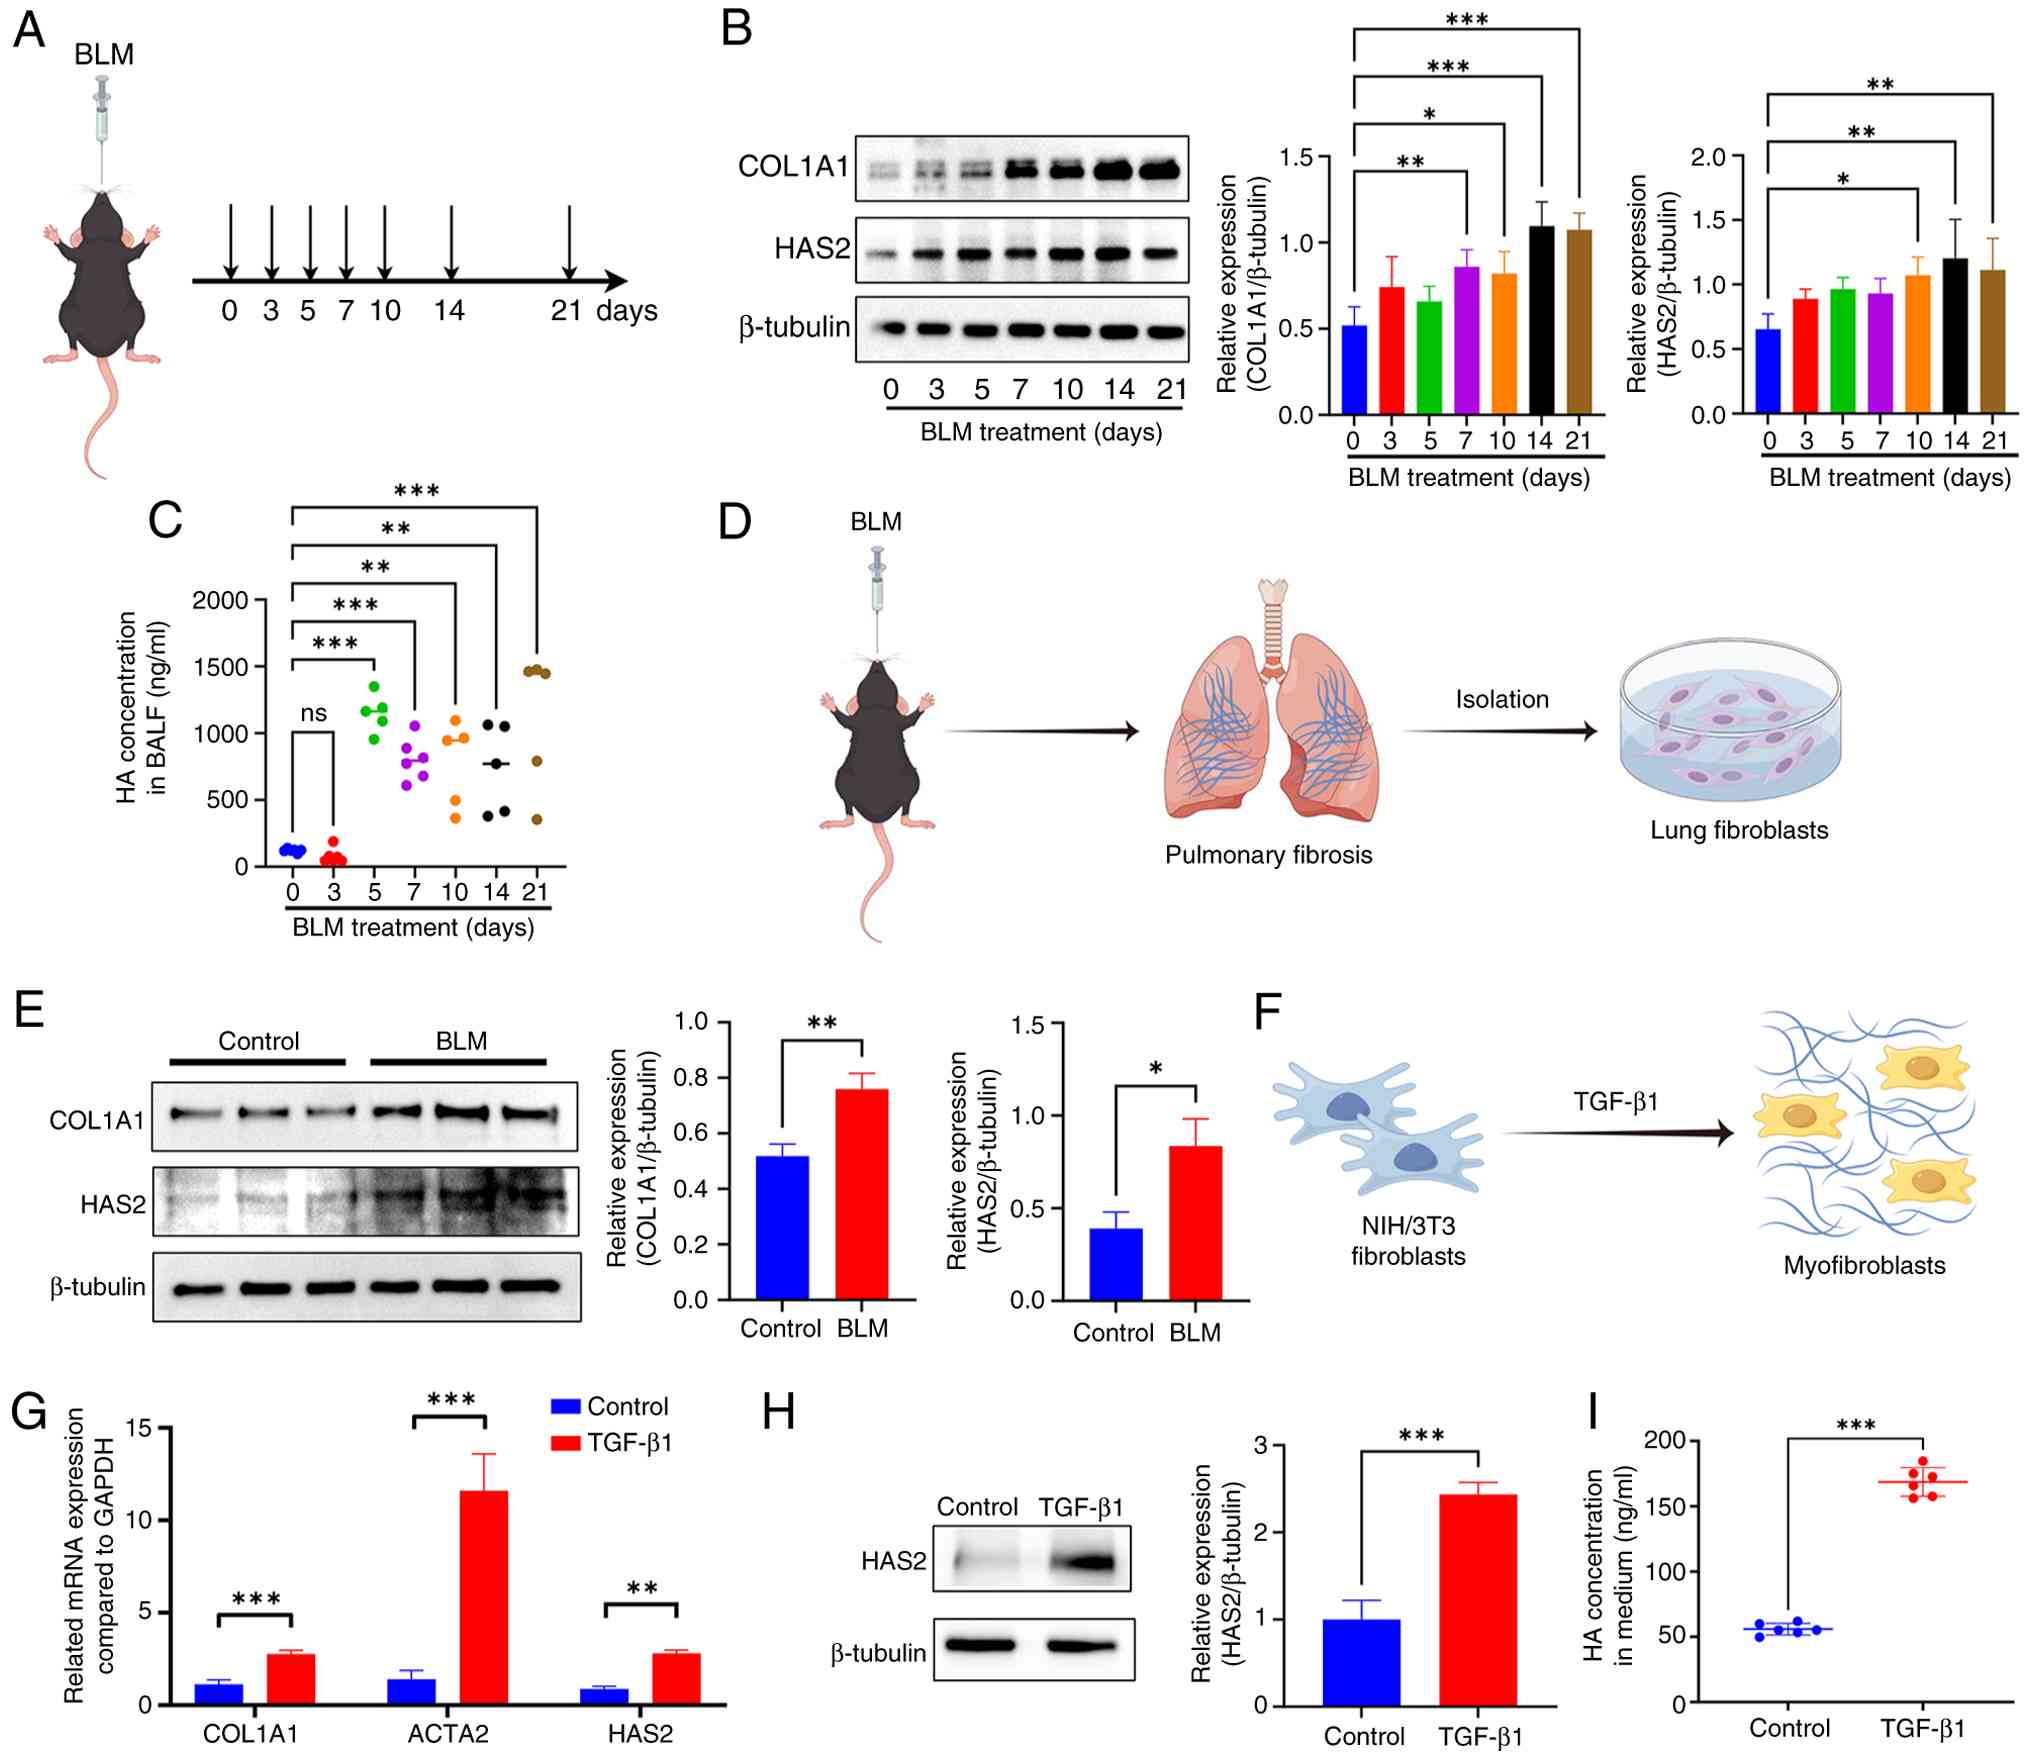 | Figure 2Elevated HAS2 expression and HA
accumulation in murine and cellular fibrosis models. (A) Schematic
of the experimental design for the time-course study. C57BL/6J mice
received a single intratracheal dose of BLM or saline and were
sacrificed at the indicated time points (days 0, 3, 5, 7, 10, 14
and 21) for sample collection (n=5 for per group). (B)
Representative western blot images (left panel) and densitometric
quantification (right panel) showing the protein expression levels
of COL1A1 and HAS2 in lung tissues across the time course.
β-tubulin served as the loading control (n=4 for per group). (C)
ELISA quantification of HA levels in BALF at different days
post-BLM injury (n=5 for per group). (D) Schematic diagram
illustrating the workflow for the isolation and culture of primary
mouse lung fibroblasts from BLM-treated fibrotic mice. (E) Western
blotting analysis of HAS2 and COL1A1 protein expression in primary
lung fibroblasts isolated from control (saline) and BLM-induced
fibrotic mice. Representative blot images (left panel) and
densitometric quantification of protein levels normalized to
β-tubulin are shown (n=3 for each group). (F) Schematic diagram
depicting TGF-β1-induced transition of NIH/3T3 fibroblasts into
myofibroblasts. (G) COL1A1, ACTA2, and HAS2 mRNA expression in
NIH/3T3 cells was detected using PCR after 5 ng/ml TGF-β1
administration for 12 h (n=3-4 for each group). (H) HAS2 protein
expression in NIH/3T3 was detected using western blotting after 5
ng/ml TGF-β1 administration for 24 h (n=3 for each group). (I)
ELISA was used to quantify HA concentrations in the culture media
of myofibroblasts (n=6 for each group). *P<0.05,
**P<0.01, ***P<0.001. HAS2, hyaluronic
acid synthase 2; HA, hyaluronic acid; BLM, bleomycin; BALF,
bronchoalveolar lavage fluid; COL1A1, Collagen type I α 1 chain;
ACTA2, actin alpha 2, smooth muscle. |
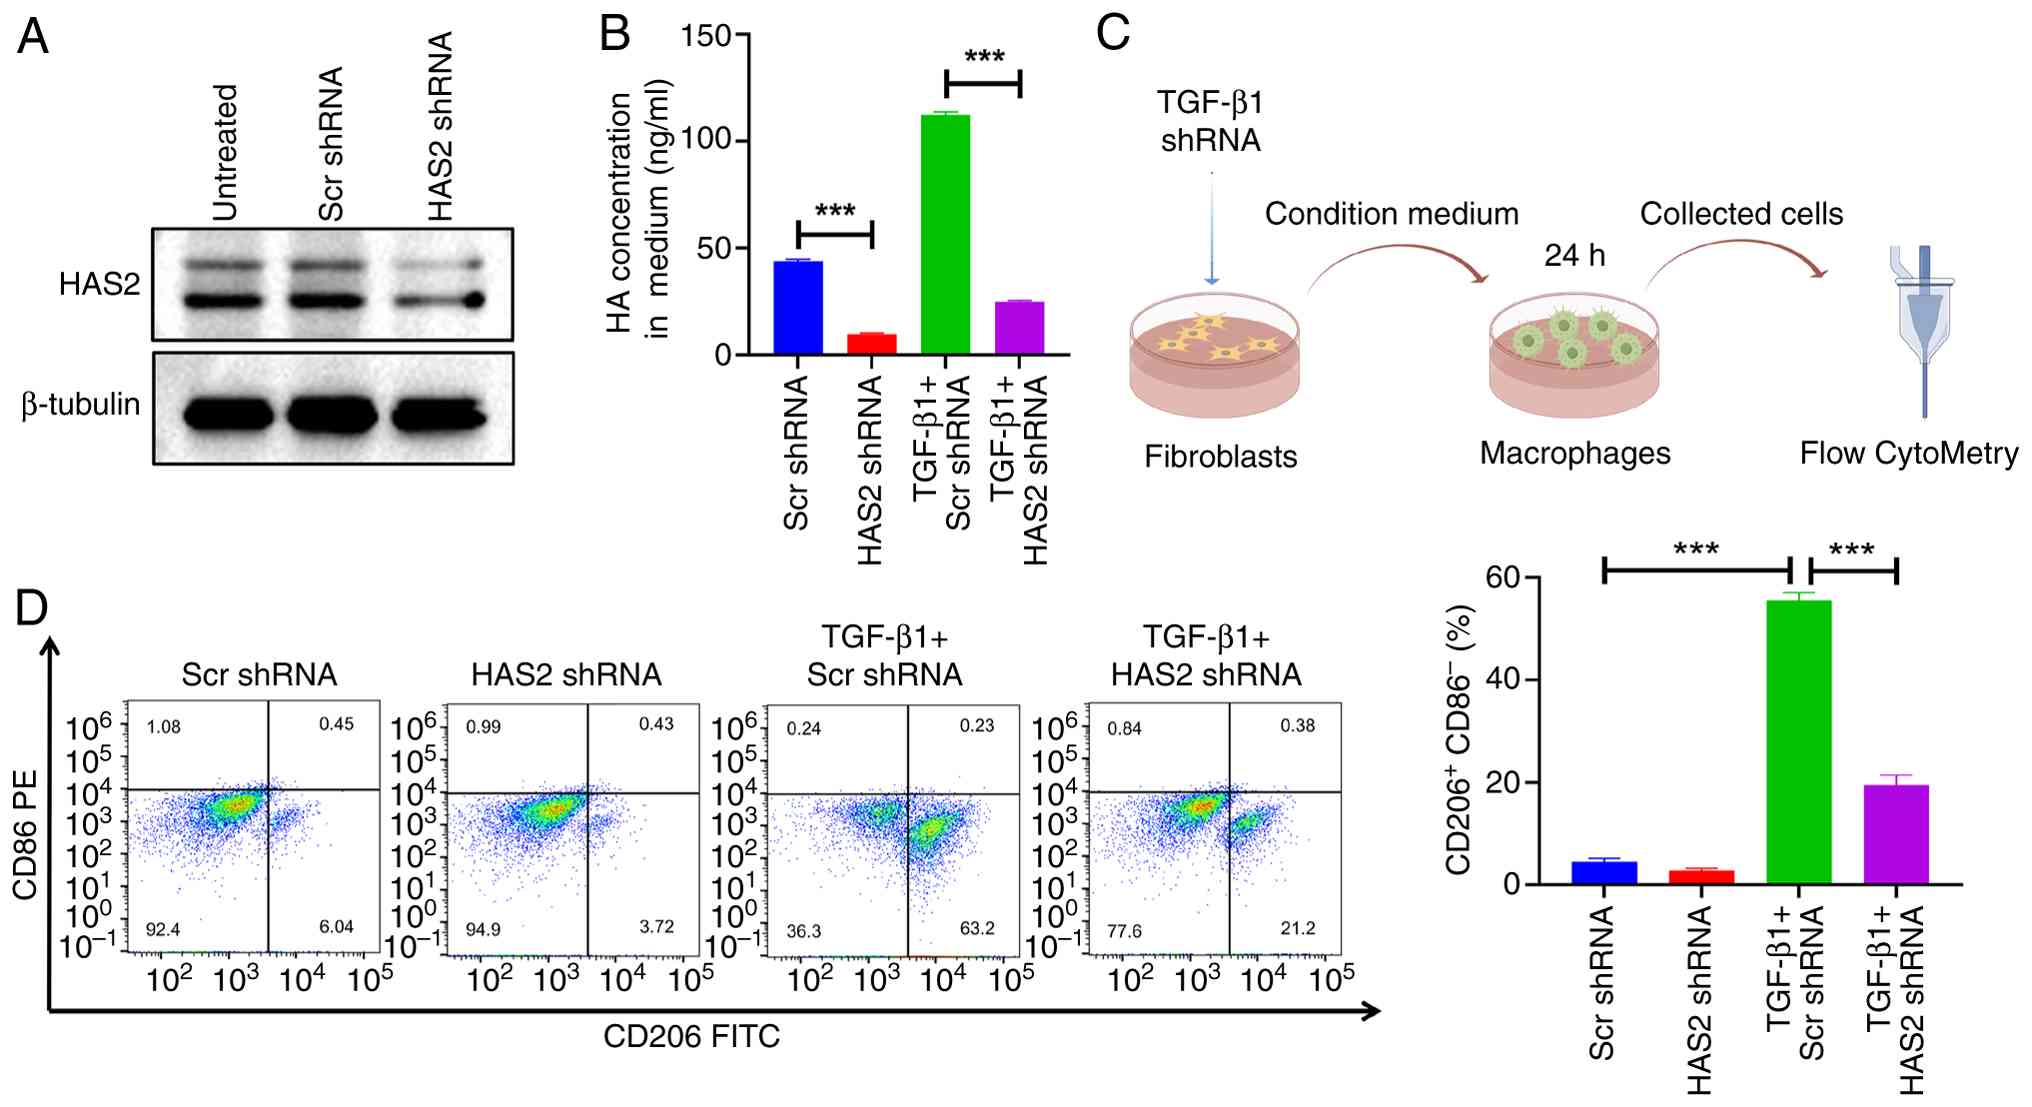
HAS2 in fibroblasts mediates macrophage
M2 polarization
To investigate the role of HAS2 in macrophage M2
polarization, shRNA was used to knock down the HAS2 gene in
fibroblasts (Fig. 3A). TGF-β1
stimulation markedly increased HA production in fibroblasts.
However, when HAS2 was knocked down, the TGF-β1-induced HA
production was notably inhibited (Fig. 3B). Subsequently,
TGF-β1-stimulated HAS2 knockdown fibroblasts were used to condition
the medium for macrophage cultures, followed by flow cytometric
analysis of the macrophages (Fig.
3C). The conditioned medium from TGF-β1-stimulated fibroblasts
markedly induced M2 polarization in macrophages; however, this
effect was markedly reduced when HAS2 was knocked down (Fig. 3D). These results suggested that
HAS2 is critical for HA synthesis in response to TGF-β1 stimulation
and that downregulating HAS2 impairs the ability of myofibroblasts
to induce macrophage M2 polarization.
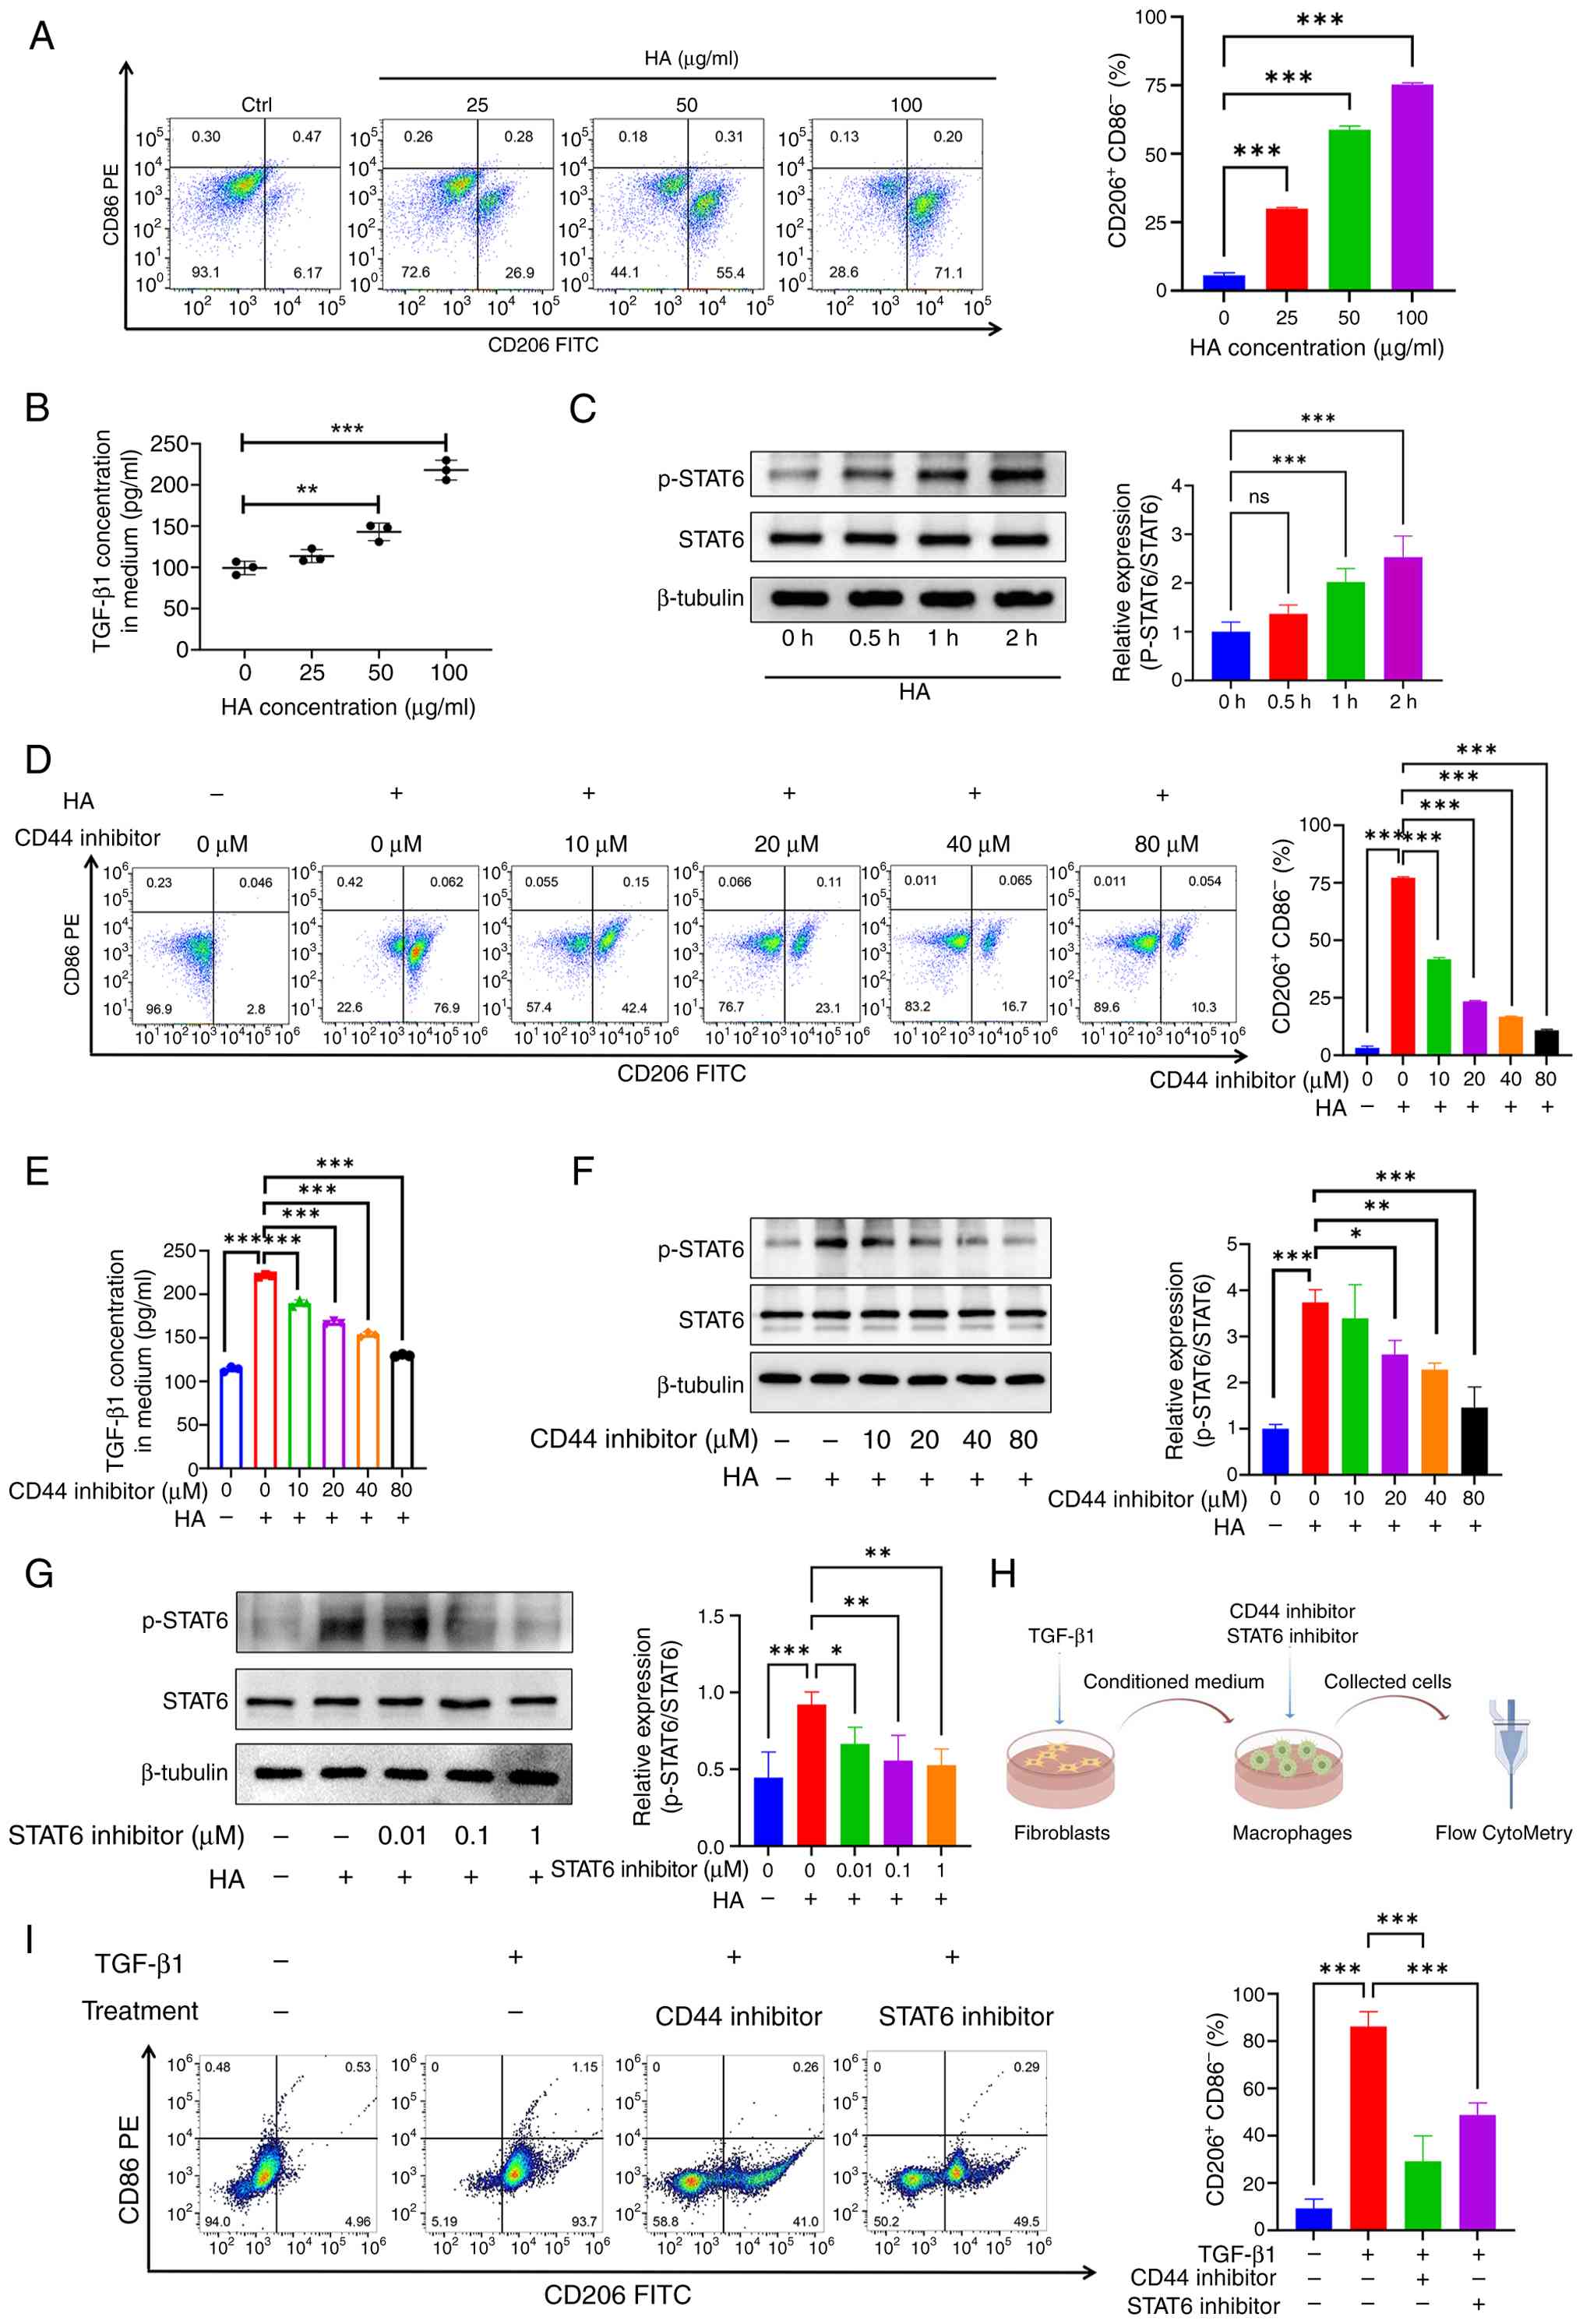
HA from myofibroblasts induces macrophage
M2 polarization via CD44/STAT6 axis
Given their critical role in the fibrotic response,
the influence of HA on macrophage polarization was investigated.
Agarose gel electrophoresis revealed that the molecular weight of
sonicated HA fell within the 10-200 kDa range, confirming it as
low-molecular-weight HA (Fig.
S3). This sonicated HA was then applied to RAW264.7 mouse
monocyte-macrophage cells, and flow cytometry was used to assess
macrophage polarization. The results indicated that HA treatment
promoted the polarization of RAW264.7 cells towards the M2
macrophage phenotype, as evidenced by increased CD206 expression
(Fig. 4A). HA also induced
TGF-β1 production in macrophages, further supporting its role in M2
polarization (Fig. 4B).
Following HA stimulation, phosphorylation levels of STAT6
progressively increased, suggesting that HA-induced macrophage M2
polarization occurs through the activation of the STAT6 signaling
pathway (Fig. 4C). CD44, the
receptor through which HA binds to cells, was implicated in this
process. Inhibition of CD44 markedly reduced HA-induced CD206
expression in macrophages (Fig.
4D), as well as suppressed TGF-β1 expression and STAT6
phosphorylation levels (Fig. 4E and
F). To confirm the necessity of STAT6 activation,
pharmacological inhibition of STAT6 (AS1517499) effectively blocked
HA-induced STAT6 phosphorylation (Fig. 4G). To validate this signaling
axis in a more physiologically relevant context, a
fibroblast-macrophage co-culture system was employed (Fig. 4H). Conditioned medium from
TGF-β1-stimulated NIH/3T3 fibroblasts strongly induced M2
polarization in RAW264.7 macrophages. This effect was substantially
diminished when macrophages were co-treated with either a CD44
inhibitor or a STAT6 inhibitor (Fig.
4I). These results demonstrate that HA induces macrophage M2
polarization by binding to CD44 on macrophages and activating the
STAT6 pathway.
High-throughput virtual screening and
target validation experiments identified OG as a natural HAS2
inhibitor
A high-throughput virtual screening of natural
compounds was conducted to identify small molecules that can bind
to the HAS2 protein (Fig. 5A and
B). After the initial screening, the top 200 compounds were
selected based on docking scores for further analysis. These
compounds were then evaluated using ADME parameters to identify
those with favorable drug-like properties. Among the 200 compounds,
only OG met all the ADME screening criteria, highlighting its
potential as a HAS2-targeting compound with favorable drug-like
properties (Fig. 5C). The
molecular formula of OG is shown in Fig. 5D and its docking score with HAS2
is-7.325. The physicochemical properties of OG include: XLOGP3
(-0.99), molecular weight (286.28 g/mol), TPSA (119.61
Å2), log S (-1.02), Fraction Csp3 (0.54), and 3
rotatable bonds. To assess the binding affinity between HAS2 and
OG, an SPR experiment was performed (Fig. 5E). The association rate constant
(Ka) was 20.66 M−1sec−1, and the dissociation
rate constant (Kd) was 0.006278 sec−1. The dissociation
constant was calculated to be 3.039×10⁻⁴ M, confirming a
direct binding interaction between HAS2 and OG. Further validation
using CETSA showed that OG enhanced HAS2 protein stability under
rising temperatures compared with the control group, reinforcing
the direct interaction between OG and HAS2 (Fig. 5F). The SPR and CETSA experiments
confirm that OG binds directly to the HAS2 protein.
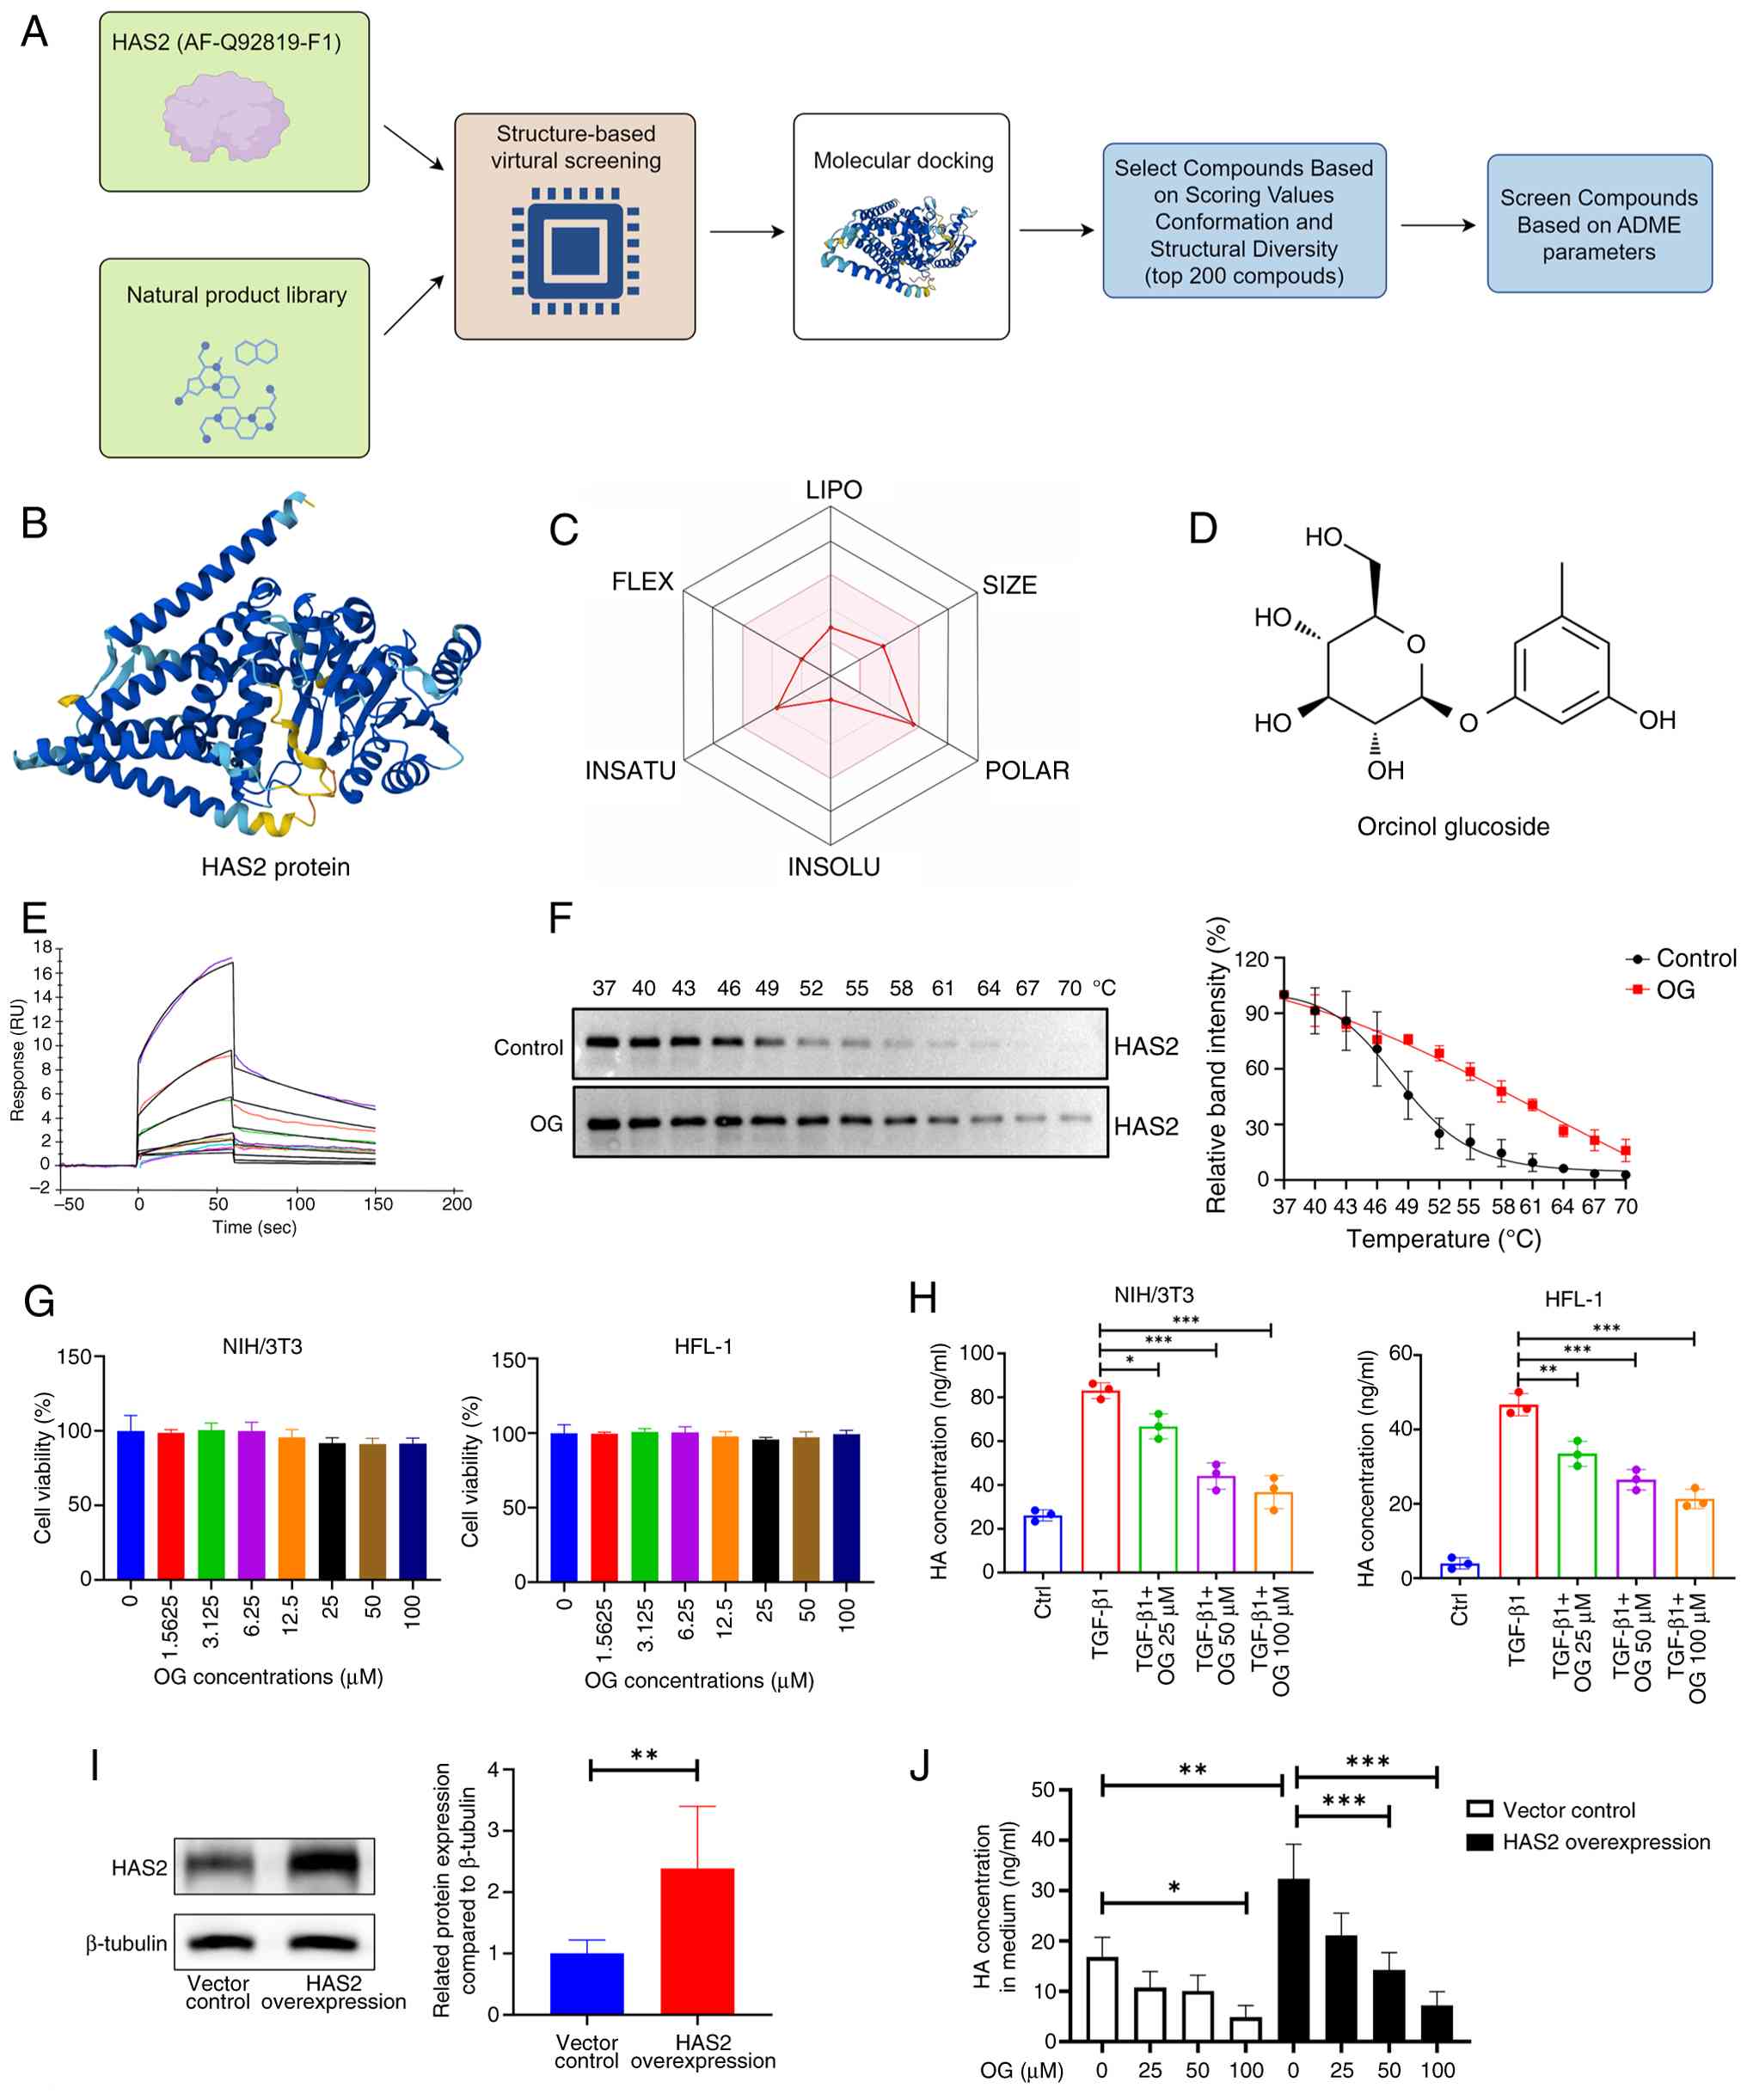 | Figure 5High-throughput virtual screening and
target validation experiments identifies OG as a natural HAS2
inhibitor. (A) Flowchart outlining the high-throughput virtual
screening process. (B) The three-dimensional structure of human
HAS2 was obtained from the AlphaFold database (AlphaFold ID:
AF-Q92819-F1). (C) The radar map shows that OG met the ADME
criteria. (D) The molecular formula of OG is illustrated. (E) SPR
experiment was conducted to determine the binding affinity of OG to
HAS2, providing quantitative data on binding kinetics. (F) CETSA
assay was performed to confirm the direct interaction between OG
and HAS2, showing enhanced protein stability upon OG treatment (n=3
for each group). (G) The cytotoxicity of OG was assessed using
CCK-8 assays on NIH/3T3 and HFL-1 cell lines following a 48-h
treatment at various concentrations (n=3-6 for each time point).
(H) ELISA assays were performed to quantify HA levels in the
supernatant of TGF-β1-stimulated NIH/3T3 and HFL-1 cells treated
with OG for 48 h (n=3 for each group). (I) Lentiviral vectors were
used to overexpress HAS2 in NIH/3T3 fibroblasts, with western
blotting conducted to confirm HAS2 expression levels (n=6 for each
group). (J) OG was administered to both HAS2-overexpressing NIH/3T3
cells and control cells without overexpression. After a 48-h
treatment with OG, ELISA was used to measure the HA content in the
culture medium (n=3 for each group). *P<0.05,
**P<0.01, ***P<0.001. OG, glucoside;
HAS2, hyaluronic acid synthase 2; ADME, absorption, distribution,
metabolism and excretion; SPR, surface plasmon resonance; CETSA,
cellular thermal shift assay. |
A CCK-8 assay was performed to assess the cytotoxic
effects of OG on murine NIH/3T3 and human HFL-1 fibroblast cell
lines. The results (Fig. 5G)
indicated that OG was non-toxic to these cell lines at
concentrations ranging from 0 to 100 μM. TGF-β1-stimulated
NIH/3T3 and HFL-1 cells were then treated with varying
concentrations of OG, and ELISA was performed to measure HA content
in the cell culture supernatant. The results showed that OG
effectively and concentration-dependently inhibited HA secretion,
with half-maximal inhibitory concentrations (IC50) of
28.19 μM and 31.11 μM for NIH/3T3 and HFL-1 cells,
respectively (Fig. 5H).
Additionally, lentiviral vectors were used to overexpress the HAS2
protein in NIH/3T3 cells (Fig.
5I). HAS2 overexpression markedly increased HA production,
whereas OG treatment effectively inhibited this increase (Fig. 5J). These results suggested that
OG targets HAS2 to suppress HA production.
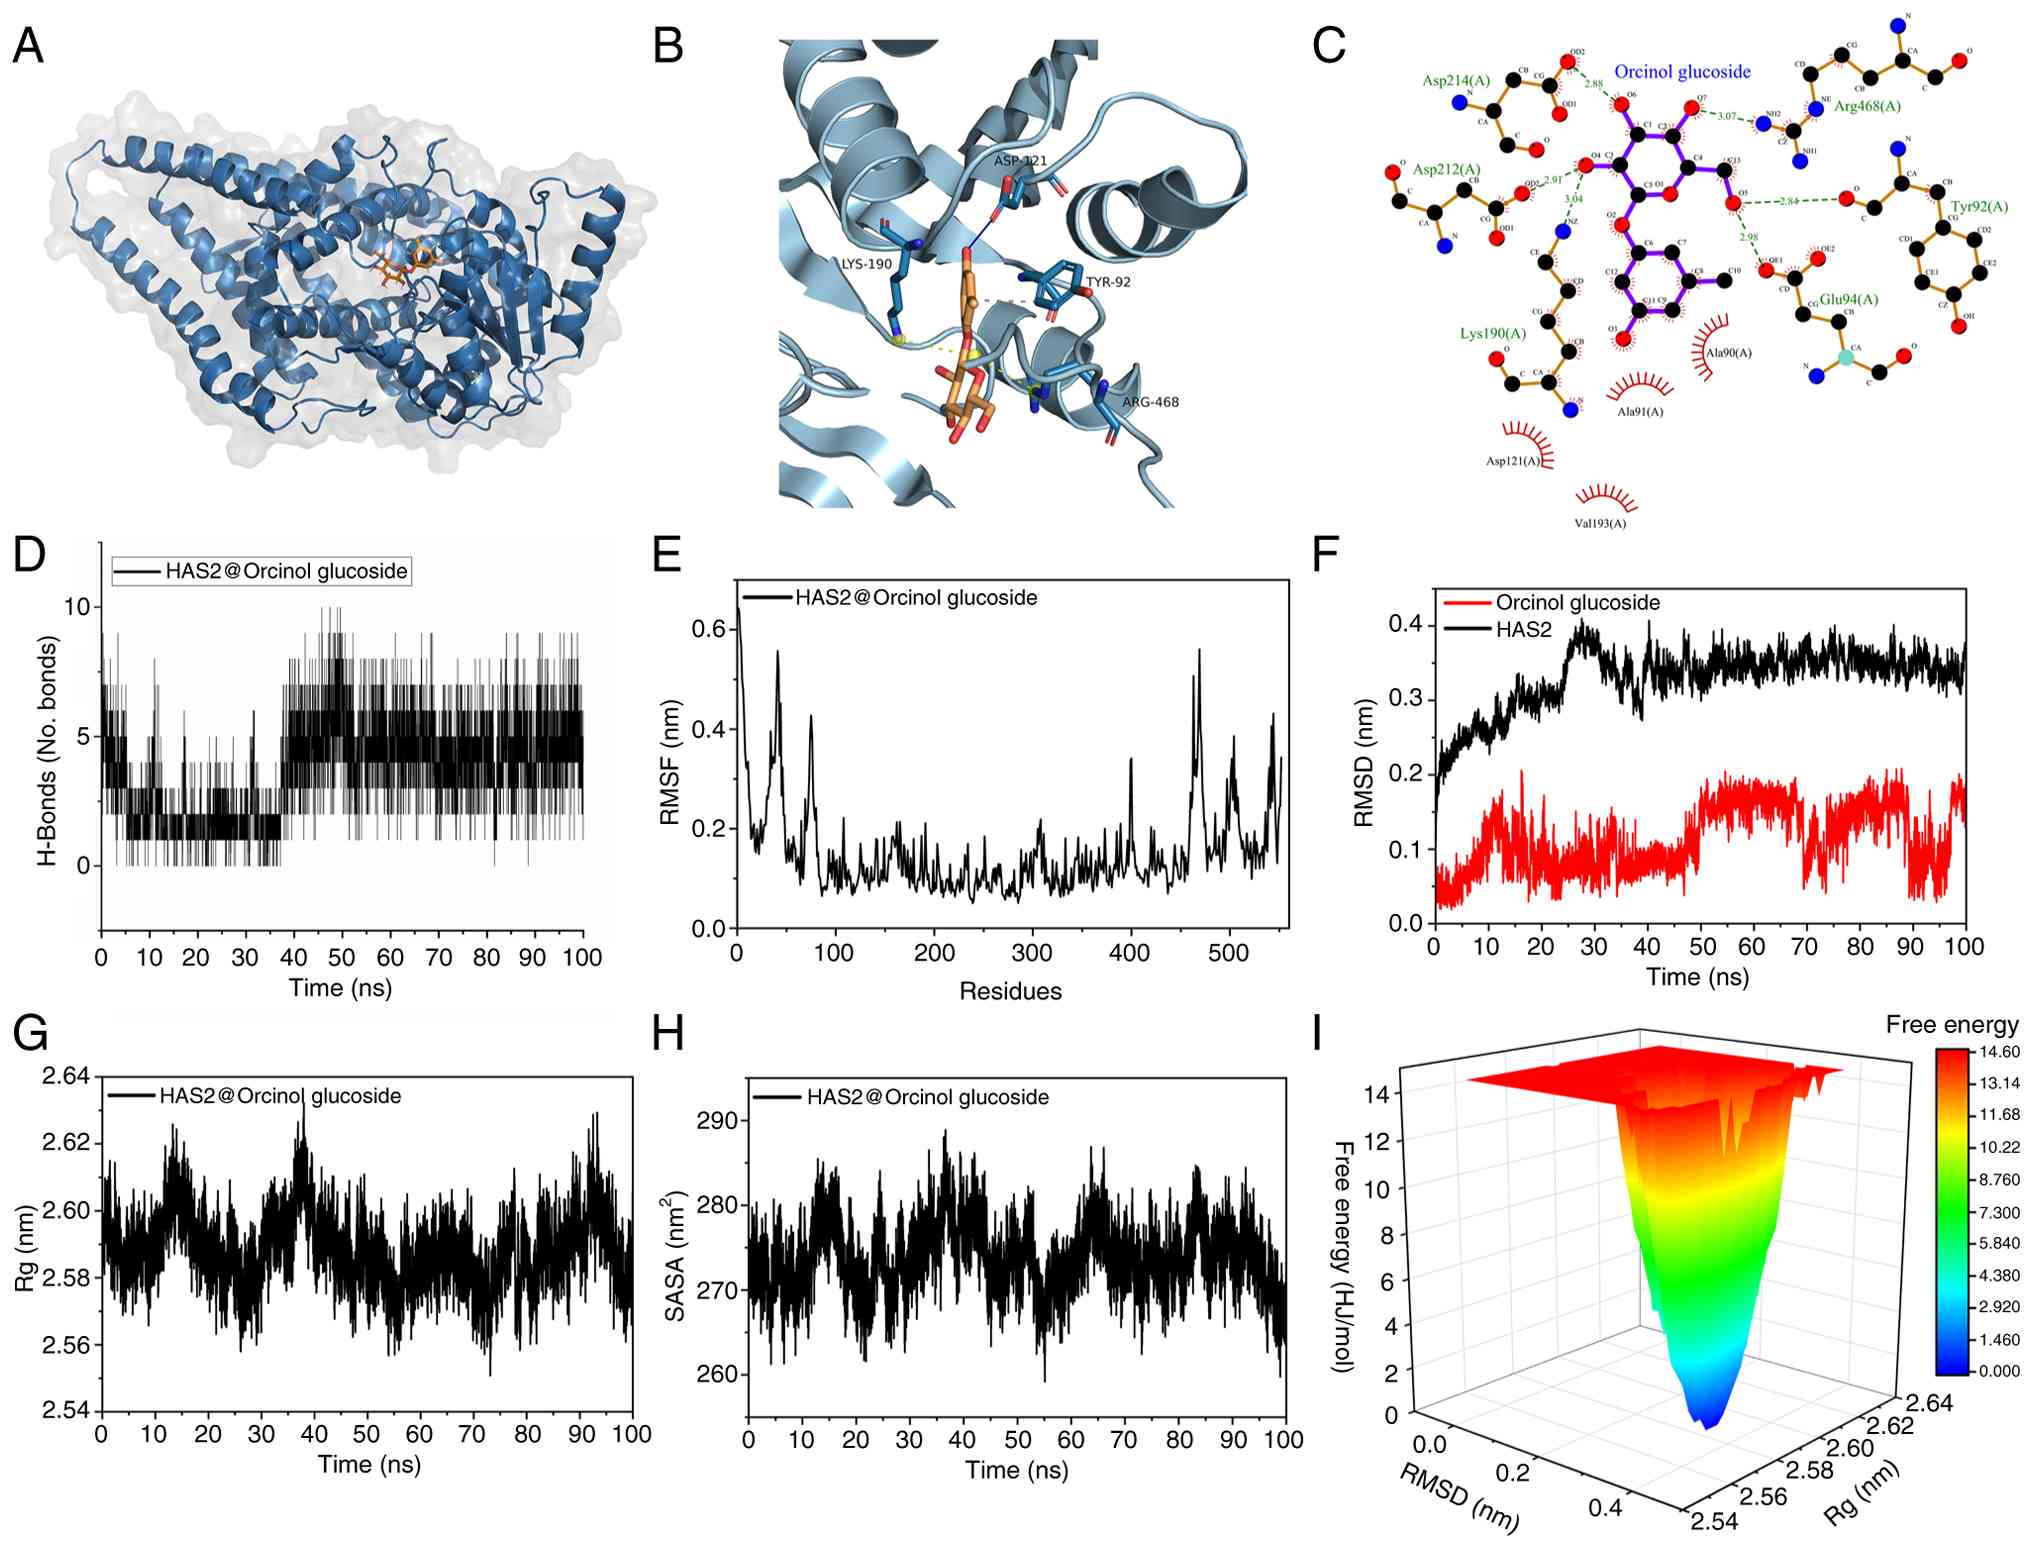
MDS indicated the binding stability of OG
and HAS2
MDS confirmed stable binding between OG and HAS2
(Fig. 6A), with hydrophobic
interactions and hydrogen bonds formed with key residues (Fig. 6B and C). Hydrogen bond occupancy
analysis identified ASP313 (137.60%) and ASP121 (110.10%) as
primary stable binding sites, with an average of five hydrogen
bonds maintained throughout the >40 nsec simulation (Fig. 6D). Hydrogen bond occupancy was
calculated as the percentage of simulation frames in which a
specific atom pair formed a hydrogen bond. Occupancies >100%
indicate that the residue formed multiple, concurrent hydrogen
bonds with the ligand within individual frames, reflecting a
high-density interaction interface. A complete list of hydrogen
bonds and a time-resolved occupancy heatmap are provided in
Table SIII and Fig. S4. Conformational stability was
confirmed by low root-mean-square fluctuations (RMSF) values across
100 nsec, indicating minimal protein flexibility, except for
residues near positions 30, 70, 400, 470 and 500 (Fig. 6E). Root-mean-square deviation
(RMSD) analysis showed stable binding conformations (0.1-0.4 nm)
after the initial 10 nsec, with consistent radius of gyration and
solvent-accessible surface area values, confirming no major
structural changes (Fig. 6F-H).
Free energy landscape analysis identified the lowest energy binding
conformation at 24.12 ns (39.954 kJ/mol), further supporting the
stable OG-HAS2 interaction (Fig.
6I).
OG exerts an anti-pulmonary fibrosis
effect by impairing myofibroblast-mediated macrophage M2
polarization
To further investigate the role of OG in macrophage
M2 polarization, fibroblasts were treated with OG during TGF-β1
stimulation. The conditioned medium was collected and used to
culture macrophages, followed by ELISA and flow cytometric analysis
(Fig. 7A). The results showed
that conditioned medium from TGF-β1-stimulated fibroblasts markedly
induced macrophage M2 polarization; however, this effect was
markedly reduced with OG treatment. Conditioned medium from
OG-treated fibroblasts showed markedly reduced capacity to induce
TGF-β1 release from macrophages (Fig. 7B). Similarly, the ability of this
conditioned medium to stimulate CD206 expression in macrophages was
substantially impaired (Fig.
7C). These results demonstrated that OG inhibited the ability
of myofibroblasts to induce macrophage M2 polarization.
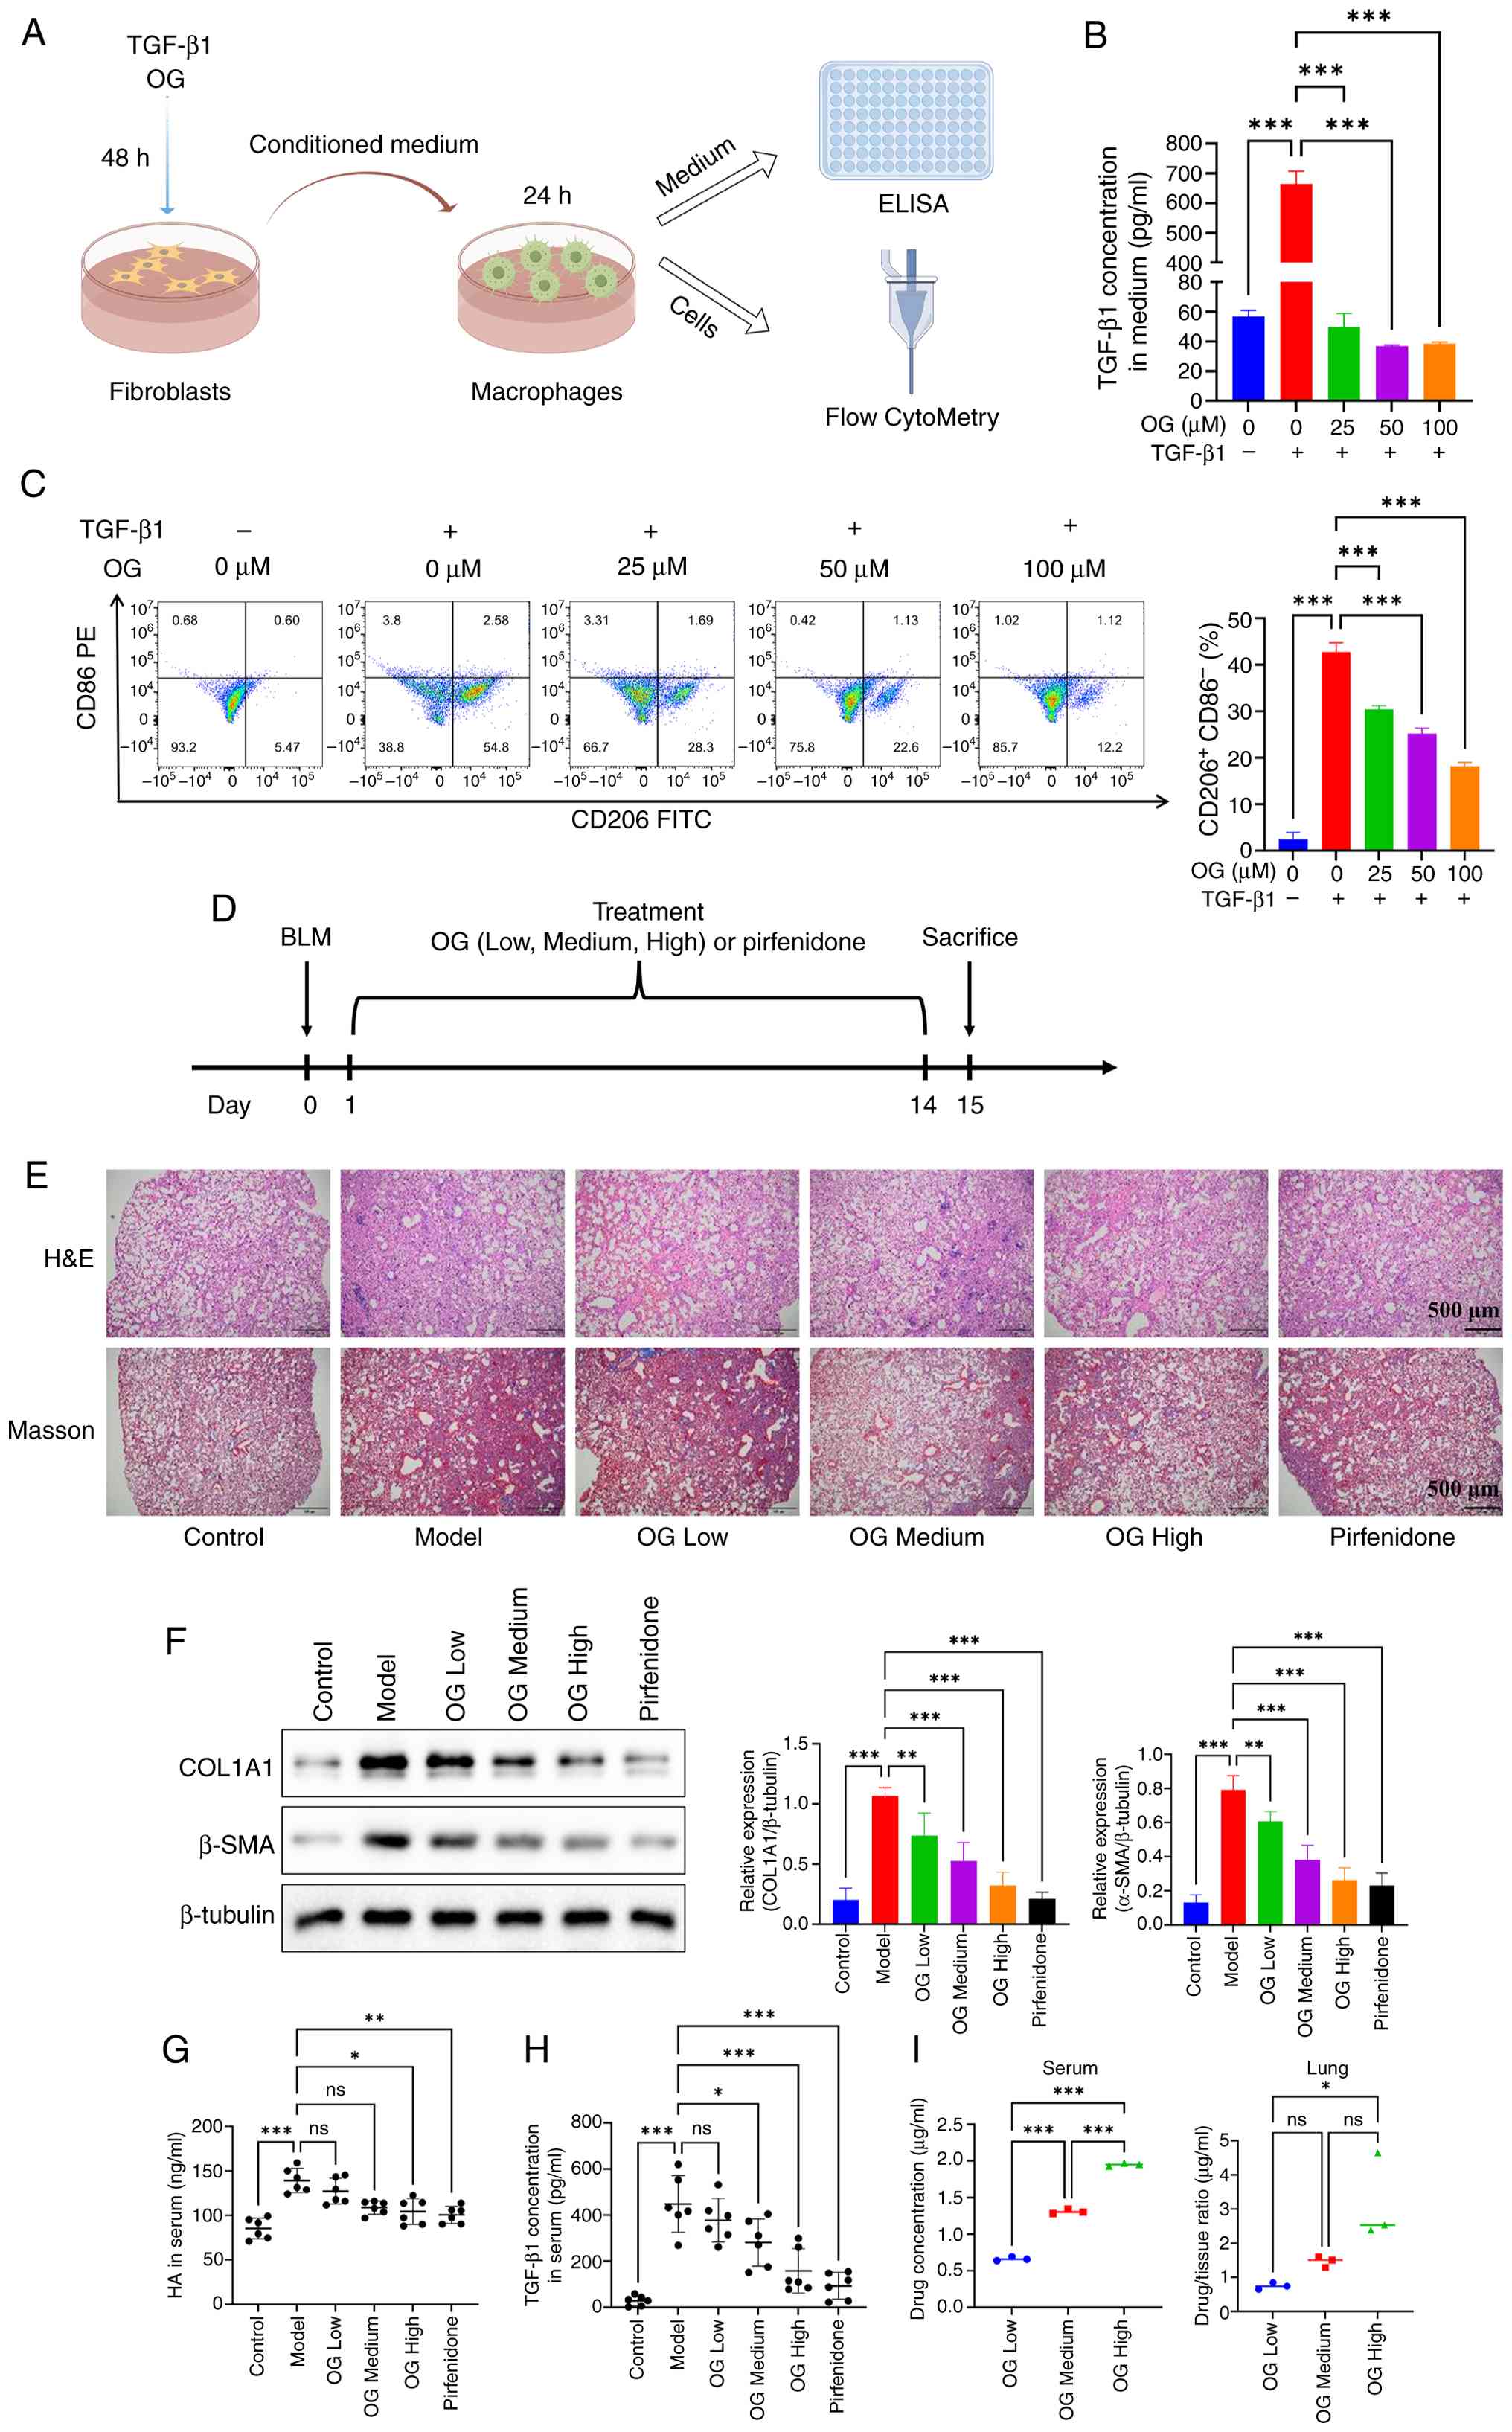 | Figure 7OG exerts an anti-pulmonary fibrosis
effect by impairing myofibroblast-mediated macrophage M2
polarization. (A) Schematic workflow: Fibroblast treatment with OG
during TGF-β1 stimulation, followed by conditioned medium
collection and macrophage culture for downstream assays. (B) TGF-β1
release from macrophages measured by ELISA (n=3 for each group).
(C) Flow cytometric analysis of CD206 and CD86 expression in
macrophages cultured in conditioned medium. The bar graph
quantifies the proportion of CD206+CD86−
cells (M2-like macrophage subpopulation; n=3 for each group). (D)
Animal experimental protocol. (E) A BLM-induced mouse model was
established to assess the anti-fibrotic effects of OG.
Histopathological alterations in lung tissues from different groups
were assessed using H&E and Masson's trichrome staining. Scale
bars: 500 μm; magnification, ×40. (F) Western blotting
analysis to measure the expression levels of fibrotic markers,
COL1A1 and α-SMA, in lung tissues (n=4 for each group). (G) The
levels of HA in mouse serum were quantified by ELISA. (H) The
levels of TGF-β1 in mouse serum were quantified by ELISA (n=6 for
each group). (I) OG concentrations in serum and lung tissues after
14-day oral administration. Left: serum concentrations of OG across
treatment groups. Right: lung tissue concentrations of OG,
expressed as a percentage of tissue weight (n=3 for each group).
*P<0.05, **P<0.01,
***P<0.001. OG, glucoside; BLM, bleomycin; COL1A1,
Collagen type I α 1 chain; α-SMA, α-smooth muscle actin; H&E,
hematoxylin and eosin. |
A BLM-induced mouse model was used to assess the
anti-fibrotic effects of OG on the lungs. Histological analysis
with H&E and Masson's trichrome staining showed that OG
treatment mitigated pulmonary inflammation and fibrosis progression
in the mouse model (Fig. 7E).
Immunoblotting of lung tissues demonstrated that OG inhibited the
expression of fibrotic markers, including COL1A1 and α-SMA
(Fig. 7F). Furthermore, OG
markedly reduced the levels of HA and TGF-β1 in the mice (Fig. 7G and H). Quantitative analysis of
OG concentrations in serum and lung tissues revealed
dose-proportional increases in both compartments (Fig. 7I). This dose-dependent tissue
distribution of OG paralleled its graded therapeutic efficacy,
establishing a clear exposure-response relationship across
treatment groups.
Discussion
The present study aimed to identify key pathogenic
factors in IPF and explore novel therapeutic strategies targeting
HA metabolism. The integrated findings highlighted HAS2 as a
central driver of IPF pathogenesis, promoting HA accumulation and
macrophage M2 polarization through a CD44-dependent STAT6
activation pathway. OG was identified as a natural product that
binds to HAS2 and alleviates pulmonary fibrosis by disrupting this
pathogenic axis in both in vitro and in vivo models.
These results position HAS2 as a promising therapeutic target and
OG as a potential candidate for IPF treatment.
Transcriptional landscape analyses of human IPF
samples, murine fibrosis models and TGF-β1-induced myofibroblasts
revealed that HAS2 is consistently upregulated, with single-cell
RNA sequencing localizing this elevation specifically to
fibroblasts. This cell type-specific dysregulation is biologically
significant, as fibroblasts are key mediators of ECM deposition in
IPF (34). The validation
experiments of the present study confirmed that HAS2 upregulation
is linked to increased HA production in fibrotic tissues and cells,
consistent with clinical observations that HA levels correlate with
IPF severity (35).
Mechanistically, fibroblast-derived HA induced macrophage M2
polarization through CD44 binding and subsequent STAT6
phosphorylation. This polarization is a critical event in the
maintenance of the fibrotic niche, shedding light on a previously
undefined crosstalk between stromal cells and immune cells in
fibrosis, where HAS2-mediated HA acts as a paracrine signal to
amplify pro-fibrotic inflammation (36,37). These findings are further
corroborated by complementary in vitro data. As shown in
Fig. S5, HA stimulation alone
effectively induced TGF-β1 release from macrophages, with a potency
comparable to that of the classical M2-polarizing cytokines
IL-4/IL-13. These results indicated that fibroblast-derived HA
itself acted as a potent M2-polarizing stimulus, functionally akin
to traditional immune cytokines, and can synergize with immune
signals in the pathological microenvironment to collectively drive
and sustain a pro-fibrotic macrophage phenotype.
The identified interaction is not unidirectional but
forms a self-amplifying positive feedback loop that drives fibrotic
progression. Activated fibroblasts, via HAS2-derived HA, polarize
macrophages toward a pro-fibrotic M2 phenotype in a
CD44/STAT6-dependent manner. In turn, these M2-polarized
macrophages release factors such as TGF-β1, further activating
fibroblasts, promoting their transition to myofibroblasts, and
driving excessive ECM deposition. This 'fibroblast-macrophage'
vicious cycle aligns with and extends the understanding of the
complex cellular crosstalk in pulmonary fibrosis. For instance,
work by Liu et al (38)
highlights the protective, multi-faceted role of the TWEAK-Fn14
signaling axis, which inhibits fibroblast activation and ECM
synthesis while recruiting and modulating macrophage subsets to
influence alveolar repair, highlighting the bidirectional and
multi-layered nature of stromal-immune interactions. Similarly, in
other fibrotic contexts such as silicosis, aberrant macrophage
activation (e.g., via the PRDX4-AKT/NF-κB or Lp-PLA2-mitophagy
pathways) has been shown to drive the aberrant transformation of
epithelial cells and fibroblasts (39,40). Targeting critical nodes within
this feedback loop, such as HAS2 in the present study, represents a
precise therapeutic strategy to disrupt the self-perpetuating cycle
of fibrosis.
Comparisons with existing literature highlight the
novelty of the present study. While HA elevation in IPF is
well-documented, a prior study has have primarily focused on total
HA levels without distinguishing the contributions of specific HAS
isoforms (7). The present study
identified HAS2 as the functionally dominant isoform in fibrotic
lungs, extending earlier reports that HAS2 is the most active
synthase in HA production (10).
Unlike 4-methylumbelliferone, a widely studied HA inhibitor that
depletes UDP-glucuronic acid and downregulates HAS2/3 expression
(41), OG binds directly to
HAS2, as evidenced by stable interactions with key residues (ASP313
and ASP121), confirmed by MDS and biophysical assays. This direct
binding mechanism may offer target selectivity, potentially
avoiding broader off-target effects associated with substrate
depletion. Computational molecular docking provided preliminary
support for this selectivity, predicting that OG exhibits the
strongest binding affinity for HAS2 (binding energy: −7.777
kcal/mol), compared with HAS1 (−6.715 kcal/mol) and HAS3 (-6.486
kcal/mol) (Fig. S6). In
silico, a binding energy below −7.0 kcal/mol is often
considered indicative of good binding affinity, suggesting OG
preferentially engages HAS2. However, comprehensive biochemical
profiling of its isoform selectivity and inhibition kinetics
remains a critical direction for future research. Furthermore,
while current IPF therapies such as pirfenidone and nintedanib
broadly inhibit fibrosis progression without targeting specific
pathogenic drivers (12), the
approach of the present study directly targeted a defined molecular
axis, offering a more precise therapeutic strategy. OG, a natural
phenol glycoside derived from Curculigo orchioides Gaertn.,
benefits from the extensive traditional medicinal use and
established safety profile of its source in treating
rheumatological and respiratory conditions, enhancing OG's
translational viability compared with novel synthetic compounds
(42-46). The present study also analyzed
the correlation between OG's tissue distribution and its in
vivo efficacy. Quantification confirmed that OG achieved
dose-dependent concentrations in systemic circulation and,
importantly, was detectable in lung tissue, the primary site of
pathology. This graded pulmonary exposure of OG corresponded with
the attenuation of fibrotic markers (COL1A1, α-SMA), collagen
deposition and key pro-fibrotic mediators (HA and TGF-β1).
The biological relevance of the present study
extended beyond pulmonary fibrosis. The HAS2-HA axis has also been
implicated in hepatic fibrosis, where HAS2 overexpression activates
hepatic stellate cells via CD44 and Notch1 signaling and genetic
ablation of HAS2 alleviates liver fibrosis in murine models
(47). This cross-organ
conservation suggests that HAS2-targeted therapies could have broad
applications in fibrotic disorders. Clinically, OG's favorable
safety profile in cellular models and its ability to reduce
collagen deposition and inflammatory markers in vivo support
its potential as a therapeutic agent. Additionally, the correlation
between serum HA levels and treatment response in our murine model
suggests that HA could serve as a pharmacodynamic biomarker,
facilitating clinical monitoring of therapeutic efficacy (35).
The present study had several limitations. First,
while the BLM-induced fibrosis model is widely used, it does not
fully replicate the chronic, progressive nature of human IPF and
lacks the pathological heterogeneity seen in clinical settings
(48). Future validation in
alternative models, such as TGF-β transgenic mice or precision-cut
lung slices from patients with IPF, would enhance clinical
relevance. Second, macrophage polarization states in lung tissues
of the mouse model were not directly evaluated. Future studies
employing detailed immunophenotyping of lung immune cells will
provide direct in vivo evidence to complement the functional
and biochemical data of the present study. Third, the in
vitro mechanistic studies of the present study relied on the
RAW264.7 murine cell line; validating key findings in primary
murine bone marrow-derived macrophages and human monocyte-derived
macrophages is essential for establishing the translational
relevance of the HA-CD44-STAT6 axis. Fourth, the present study did
not perform direct in vitro enzymatic inhibition assays
using recombinant HAS2 protein due to the technical challenge of
expressing and purifying functional full-length HAS2, a multi-pass
transmembrane enzyme. While SPR binding, CETSA target engagement
and cellular assays confirmed that OG suppresses HA synthesis by
targeting HAS2, novel strategies to assess HAS2 activity will
further validate our mechanistic conclusions. Lastly, the in
vivo therapeutic regimen of the present study focused on
preventive/early intervention (OG administered 24 h post-BLM
injury, prior to peak fibrosis) and did not model late-stage
fibrotic disease reversal. Future studies with dosing initiated
after full fibrosis establishment (such as 7 days post-injury) are
crucial to define the translational potential of OG and other
HAS2-targeting agents for IPF.
In conclusion, the present study identified HAS2 as
a critical regulator of fibroblast-immune crosstalk in IPF. OG
suppresses this pathway by targeting HAS2. These findings advance
our understanding of IPF pathogenesis and provide a preclinical
foundation for targeting HAS2 in fibrotic diseases. Future research
should focus on optimizing OG's pharmacokinetic properties,
evaluating its efficacy in clinically relevant models, and
exploring combination therapies with existing antifibrotic agents
to enhance therapeutic outcomes. By targeting the
HAS2-HA-macrophage axis, this work opens new avenues for developing
precision therapies for IPF and other fibrotic disorders.
Supplementary Data
Availability of data and materials
The data generated in the present study may be
requested from the corresponding author. The transcriptome
sequencing datasets generated in the present study are publicly
available in the NCBI Sequence Read Archive (SRA) under the
following accession numbers: PRJNA782761 (for TGF-β1-induced
myofibroblasts) and PRJNA1301583 (for the BLM-induced pulmonary
fibrosis mouse model). The single-cell RNA sequencing dataset is
available in the NCBI SRA under accession number PRJNA1392040. The
raw UHPLC-MS/MS data for quantitative analysis are available in the
MassIVE repository under accession number MSV000100304. The
persistent URLs for these datasets are: https://www.ncbi.nlm.nih.gov/bioproject/PRJNA782761;
https://www.ncbi.nlm.nih.gov/bioproject/PRJNA1301583;
https://www.ncbi.nlm.nih.gov/bioproject/PRJNA1392040;
ftp://massive-ftp.ucsd.edu/v11/MSV000100304.
Authors' contributions
CL, XT and XLu conceived and designed the study,
performed the experiments, analyzed the data and drafted the
manuscript. XLa, JY, ZX and GM performed the experiments, collected
data and assisted with data analysis. YX performed the formal
analysis and data interpretation. XH supervised the research,
acquired funding and critically reviewed and edited the manuscript.
HL administered the project, designed the methodology, drafted the
manuscript and acquired funding. XLa and HL confirm the
authenticity of all the raw data. All authors read and approved the
final manuscript.
Ethics approval and consent to
participate
The animal experiments were conducted at external
SPF-grade facilities due to the lack of such a facility at our
institution. All animal experiments were approved by the Ethics
Committee of the Animal Subjects Ethics Sub-committee of the Hong
Kong Polytechnic University (ethics number:
22-23/356-OTHERS-R-NSFC) and the Ethics Committee of Shenzhen
Glorybay Biotech Co., Ltd (approval nos. RW-IACUC-24-0037 and
RW-IACUC-25-0065).
Patient consent for publication
Not applicable.
Competing interests
The authors declare that they have no competing
interests.
Acknowledgements
Some figures (Figs.
2A, D, F, 3C, 4H, 5A and 7A) were created with Figdraw
(https://www.figdraw.com). The authors thank
Figdraw for providing the authorization to use these figures.
Funding
The present study was supported by the Guangdong Basic and
Applied Basic Research Foundation (grant no. 2023A1515011243);
Shenzhen Science and Technology Program (grant no.
JCYJ20240813153503005); Bao'an Traditional Chinese Medicine
Development Foundation (grant no. 2022KJCX-ZJZL-11); Health and
Medical Scientific Research Project of Shenzhen Bao'an Medical
Association (grant no. BAYXH2024017); Shenzhen Bao'an Traditional
Chinese Medicine Hospital Research Program (grant no.
BAZYY20220701); 2024 High-quality Development Research Project of
Shenzhen Bao'an Public Hospital (grant no. BAGZL2024137);
Discipline Construction Program of the University-Hospital
Collaborative Project in the Development of High-Level University
(grant no. GZYBA2024XKG02); and The Sanming Project of Medicine in
Shenzhen (grant no. SZZYSM202206013).
References
|
1
|
Strongman H, Kausar I and Maher TM:
Incidence, prevalence, and survival of patients with idiopathic
pulmonary fibrosis in the UK. Adv Ther. 35:724–736. 2018.
View Article : Google Scholar : PubMed/NCBI
|
|
2
|
Ma HY, Li Q, Wong WR, N'Diaye EN, Caplazi
P, Bender H, Huang Z, Arlantico A, Jeet S, Wong A, et al: LOXL4,
but not LOXL2, is the critical determinant of pathological collagen
cross-linking and fibrosis in the lung. Sci Adv. 9:eadf01332023.
View Article : Google Scholar : PubMed/NCBI
|
|
3
|
Mei Q, Yang Z, Xiang Z, Zuo H, Zhou Z,
Dong X, Zhang L, Song W, Wang Y, Hu Q, et al: Pharmacological
inhibition of MDM4 alleviates pulmonary fibrosis. Theranostics.
13:2787–2799. 2023. View Article : Google Scholar : PubMed/NCBI
|
|
4
|
Zhang X, Hu X, Zhang Y, Liu B, Pan H, Liu
Z, Yao Z, Zhu Q, Wu C and Shen T: Impaired autophagy-accelerated
senescence of alveolar type II epithelial cells drives pulmonary
fibrosis induced by single-walled carbon nanotubes. J
Nanobiotechnology. 21:692023. View Article : Google Scholar : PubMed/NCBI
|
|
5
|
Ma J, Cai H, Long X, Cheng K, Xu X, Zhang
D and Li J: Hyaluronic acid bioinspired polymers for the regulation
of cell chondrogenic and osteogenic differentiation. Int J Biol
Macromol. 161:1011–1020. 2020. View Article : Google Scholar : PubMed/NCBI
|
|
6
|
Carton F and Malatesta M:
Nanotechnological research for regenerative medicine: The role of
hyaluronic acid. Int J Mol Sci. 25:39752024. View Article : Google Scholar : PubMed/NCBI
|
|
7
|
Collum SD, Chen NY, Hernandez AM,
Hanmandlu A, Sweeney H, Mertens TCJ, Weng T, Luo F, Molina JG,
Davies J, et al: Inhibition of hyaluronan synthesis attenuates
pulmonary hypertension associated with lung fibrosis. Br J
Pharmacol. 174:3284–3301. 2017. View Article : Google Scholar : PubMed/NCBI
|
|
8
|
Bjermer L, Lundgren R and Hällgren R:
Hyaluronan and type III procollagen peptide concentrations in
bronchoalveolar lavage fluid in idiopathic pulmonary fibrosis.
Thorax. 44:126–131. 1989. View Article : Google Scholar : PubMed/NCBI
|
|
9
|
Yao ZY, Gong JS, Liu YR, Jiang JY, Zhang
YS, Su C, Li H, Kang CL, Liu L, Xu ZH and Shi JS: Genetic variation
reveals the enhanced microbial hyaluronan biosynthesis via
atmospheric and room temperature plasma. Carbohydr Polym.
312:1208092023. View Article : Google Scholar : PubMed/NCBI
|
|
10
|
Bart G, Vico NO, Hassinen A, Pujol FM,
Deen AJ, Ruusala A, Tammi RH, Squire A, Heldin P, Kellokumpu S and
Tammi MI: Fluorescence resonance energy transfer (FRET) and
proximity ligation assays reveal functionally relevant homo- and
heteromeric complexes among hyaluronan synthases HAS1, HAS2, and
HAS3. J Biol Chem. 290:11479–11490. 2015. View Article : Google Scholar : PubMed/NCBI
|
|
11
|
Yang J, Wang L, Zhang Z, Sun Q and Zhang
Y: Downregulation of HAS-2 regulates the chondrocyte cytoskeleton
and induces cartilage degeneration by activating the RhoA/ROCK
signaling pathway. Int J Mol Med. 52:572023. View Article : Google Scholar
|
|
12
|
Ge Z, Chen Y, Ma L, Hu F and Xie L:
Macrophage polarization and its impact on idiopathic pulmonary
fibrosis. Front Immunol. 15:14449642024. View Article : Google Scholar : PubMed/NCBI
|
|
13
|
Barrett T, Wilhite SE, Ledoux P,
Evangelista C, Kim IF, Tomashevsky M, Marshall KA, Phillippy KH,
Sherman PM, Holko M, et al: NCBI GEO: Archive for functional
genomics data sets-update. Nucleic Acids Res. 41(Database Issue):
D991–D995. 2013. View Article : Google Scholar :
|
|
14
|
Cecchini MJ, Hosein K, Howlett CJ, Joseph
M and Mura M: Comprehensive gene expression profiling identifies
distinct and overlapping transcriptional profiles in non-specific
interstitial pneumonia and idiopathic pulmonary fibrosis. Respir
Res. 19:1532018. View Article : Google Scholar : PubMed/NCBI
|
|
15
|
Li H, Zhao C, Muhetaer G, Guo L, Yao K,
Zhang G, Ji Y, Xing S, Zhou J and Huang X: Integrated
RNA-sequencing and network pharmacology approach reveals the
protection of Yiqi Huoxue formula against idiopathic pulmonary
fibrosis by interfering with core transcription factors.
Phytomedicine. 104:1543012022. View Article : Google Scholar : PubMed/NCBI
|
|
16
|
Love MI, Huber W and Anders S: Moderated
estimation of fold change and dispersion for RNA-seq data with
DESeq2. Genome Biol. 15:5502014. View Article : Google Scholar : PubMed/NCBI
|
|
17
|
Martin M: Cutadapt removes adapter
sequences from high-throughput sequencing reads. EMBnet J.
17:10–12. 2011. View Article : Google Scholar
|
|
18
|
Dobin A, Davis CA, Schlesinger F, Drenkow
J, Zaleski C, Jha S, Batut P, Chaisson M and Gingeras TR: STAR:
Ultrafast universal RNA-seq aligner. Bioinformatics. 29:15–21.
2013. View Article : Google Scholar
|
|
19
|
Liao Y, Smyth GK and Shi W: featureCounts:
An efficient general purpose program for assigning sequence reads
to genomic features. Bioinformatics. 30:923–930. 2014. View Article : Google Scholar
|
|
20
|
Wolf FA, Angerer P and Theis FJ: SCANPY:
Large-scale single-cell gene expression data analysis. Genome Biol.
19:152018. View Article : Google Scholar : PubMed/NCBI
|
|
21
|
Wolock SL, Lopez R and Klein AM: Scrublet:
Computational identification of cell doublets in single-cell
transcriptomic data. Cell Syst. 8:281–291.e9. 2019. View Article : Google Scholar : PubMed/NCBI
|
|
22
|
Satija R, Farrell JA, Gennert D, Schier AF
and Regev A: Spatial reconstruction of single-cell gene expression
data. Nat Biotechnol. 33:495–502. 2015. View Article : Google Scholar : PubMed/NCBI
|
|
23
|
Livak KJ and Schmittgen TD: Analysis of
relative gene expression data using real-time quantitative PCR and
the 2(-Delta Delta C(T)) method. Methods. 25:402–408. 2001.
View Article : Google Scholar
|
|
24
|
Fuentes-Mateos R, Santos E and
Fernández-Medarde A: Optimized protocol for isolation and culture
of murine neonatal primary lung fibroblasts. Methods Protoc.
6:142023. View Article : Google Scholar : PubMed/NCBI
|
|
25
|
Liang J, Jiang D, Jung Y, Xie T, Ingram J,
Church T, Degan S, Leonard M, Kraft M and Noble PW: Role of
hyaluronan and hyaluronan-binding proteins in human asthma. J
Allergy Clin Immunol. 128:403–411.e3. 2011. View Article : Google Scholar
|
|
26
|
Fleming J, Magana P, Nair S, Tsenkov M,
Bertoni D, Pidruchna I, Lima Afonso MQ, Midlik A, Paramval U, Žídek
A, et al: AlphaFold protein structure database and 3D-beacons: New
data and capabilities. J Mol Biol. 437:1689672025. View Article : Google Scholar : PubMed/NCBI
|
|
27
|
Hess B: P-LINCS: A parallel linear
constraint solver for molecular simulation. J Chem Theory Comput.
4:116–122. 2008. View Article : Google Scholar : PubMed/NCBI
|
|
28
|
Humphrey W, Dalke A and Schulten K: VMD:
Visual molecular dynamics. J Mol Graph. 14:33–38. 27–28. 1996.
View Article : Google Scholar : PubMed/NCBI
|
|
29
|
Rosignoli S and Paiardini A: Boosting the
full potential of PyMOL with structural biology plugins.
Biomolecules. 12:17642022. View Article : Google Scholar : PubMed/NCBI
|
|
30
|
Moberly JG, Bernards MT and Waynant KV:
Key features and updates for origin 2018. J Cheminform. 10:52018.
View Article : Google Scholar : PubMed/NCBI
|
|
31
|
Kumari R, Kumar R; Open Source Drug
Discovery Consortium; Lynn A: g_mmpbsa-a GROMACS tool for
high-throughput MM-PBSA calculations. J Chem Inf Model.
54:1951–1962. 2014. View Article : Google Scholar : PubMed/NCBI
|
|
32
|
Martinez Molina D, Jafari R,
Ignatushchenko M, Seki T, Larsson EA, Dan C, Sreekumar L, Cao Y and
Nordlund P: Monitoring drug target engagement in cells and tissues
using the cellular thermal shift assay. Science. 341:84–87. 2013.
View Article : Google Scholar : PubMed/NCBI
|
|
33
|
Tan BX, Brown CJ, Ferrer FJ, Yuen TY, Quah
ST, Chan BH, Jansson AE, Teo HL, Nordlund P and Lane DP: Assessing
the efficacy of Mdm2/Mdm4-inhibiting stapled peptides using
cellular thermal shift assays. Sci Rep. 5:121162015. View Article : Google Scholar : PubMed/NCBI
|
|
34
|
Selman M and Pardo A: Pathogenic
mechanisms in the development of diffuse pulmonary fibrosis. Braz J
Med Biol Res. 29:1117–1126. 1996.PubMed/NCBI
|
|
35
|
Rosser JI, Nagy N, Goel R, Kaber G,
Demirdjian S, Saxena J, Bollyky JB, Frymoyer AR, Pacheco-Navarro
AE, Burgener EB, et al: Oral hymecromone decreases hyaluronan in
human study participants. J Clin Invest. 132:e1579832022.
View Article : Google Scholar : PubMed/NCBI
|
|
36
|
Ghatak S, Markwald RR, Hascall VC, Dowling
W, Lottes RG, Baatz JE, Beeson G, Beeson CC, Perrella MA,
Thannickal VJ and Misra S: Transforming growth factor β1 (TGFβ1)
regulates CD44V6 expression and activity through extracellular
signal-regulated kinase (ERK)-induced EGR1 in pulmonary fibrogenic
fibroblasts. J Biol Chem. 292:10465–10489. 2017. View Article : Google Scholar : PubMed/NCBI
|
|
37
|
Qin W, Spek CA, Scicluna BP, van der Poll
T and Duitman J: Myeloid DNA methyltransferase3b deficiency
aggravates pulmonary fibrosis by enhancing profibrotic macrophage
activation. Respir Res. 23:1622022. View Article : Google Scholar : PubMed/NCBI
|
|
38
|
Liu L, Wu P, Wei Y, Lu M, Ge H, Wang P,
Sun J, Horng T, Liu X, Shen X, et al: TWEAK-Fn14 signaling protects
mice from pulmonary fibrosis by inhibiting fibroblast activation
and recruiting pro-regenerative macrophages. Cell Rep.
44:1152202025. View Article : Google Scholar : PubMed/NCBI
|
|
39
|
Zhou JW, Bai Y, Guo JQ, Li YY, Liu YF,
Liang C, Xing YR, Guo HL, Qi TX, Wu J and Hu D: Peroxiredoxin 4 as
a switch regulating PTEN/AKT axis in alveolar macrophages
activation. Signal Transduct Target Ther. 10:3522025. View Article : Google Scholar : PubMed/NCBI
|
|
40
|
Li S, Xu H, Liu S, Hou J, Han Y, Li C, Li
Y, Zheng G, Wei Z, Yang F, et al: Targeting Lp-PLA2 inhibits
profibrotic monocyte-derived macrophages in silicosis through
restoring cardiolipin-mediated mitophagy. Cell Mol Immunol.
22:776–790. 2025. View Article : Google Scholar : PubMed/NCBI
|
|
41
|
Kultti A, Pasonen-Seppänen S, Jauhiainen
M, Rilla KJ, Kärnä R, Pyöriä E, Tammi RH and Tammi MI:
4-Methylumbelliferone inhibits hyaluronan synthesis by depletion of
cellular UDP-glucuronic acid and downregulation of hyaluronan
synthase 2 and 3. Exp Cell Res. 315:1914–1923. 2009. View Article : Google Scholar : PubMed/NCBI
|
|
42
|
He XY, Zhao WL, Yao LP, Sun P, Cheng G,
Liu YL, Yu Y, Liu Y, Wang TJ, Zhang QY, et al: Orcinol glucoside
targeted p38 as an agonist to promote osteogenesis and protect
glucocorticoid-induced osteoporosis. Phytomedicine. 119:1549532023.
View Article : Google Scholar : PubMed/NCBI
|
|
43
|
Li J, He P, Zhang J and Li N: Orcinol
glucoside improves the depressive-like behaviors of perimenopausal
depression mice through modulating activity of
hypothalamic-pituitary-adrenal/ovary axis and activating
BDNF-TrkB-CREB signaling pathway. Phytother Res. 35:5795–5807.
2021. View Article : Google Scholar : PubMed/NCBI
|
|
44
|
Wang X, Li G, Li P, Huang L, Huang J and
Zhai H: Anxiolytic effects of orcinol glucoside and orcinol
monohydrate in mice. Pharm Biol. 53:876–881. 2015. View Article : Google Scholar
|
|
45
|
Nahak P, Gajbhiye RL, Karmakar G, Guha P,
Roy B, Besra SE, Bikov AG, Akentiev AV, Noskov BA, Nag K, et al:
Orcinol glucoside loaded polymer-lipid hybrid nanostructured lipid
carriers: potential cytotoxic agents against gastric, colon and
hepatoma carcinoma cell lines. Pharm Res. 35:1982018. View Article : Google Scholar
|
|
46
|
Nie Y, Dong X, He Y, Yuan T, Han T, Rahman
K, Qin L and Zhang Q: Medicinal plants of genus Curculigo:
Traditional uses and a phytochemical and ethnopharmacological
review. J Ethnopharmacol. 147:547–563. 2013. View Article : Google Scholar : PubMed/NCBI
|
|
47
|
Yang YM, Noureddin M, Liu C, Ohashi K, Kim
SY, Ramnath D, Powell EE, Sweet MJ, Roh YS, Hsin IF, et al:
Hyaluronan synthase 2-mediated hyaluronan production mediates
Notch1 activation and liver fibrosis. Sci Transl Med.
11:eaat92842019. View Article : Google Scholar : PubMed/NCBI
|
|
48
|
Klee S, Picart-Armada S, Wenger K, Birk G,
Quast K, Veyel D, Rist W, Violet C, Luippold A, Haslinger C, et al:
Transcriptomic and proteomic profiling of young and old mice in the
bleomycin model reveals high similarity. Am J Physiol Lung Cell Mol
Physiol. 324:L245–L258. 2023. View Article : Google Scholar : PubMed/NCBI
|