Introduction
Alzheimer's disease (AD), the most common
neurodegenerative disorder worldwide, imposes an increasing burden
on aging societies (1). Beyond
amyloid-β (Aβ) deposition and tau pathology, neuroimmune
inflammation is now recognized as a central driver of disease
progression (2,3). Activated microglia, particularly in
the M1 proinflammatory state, exacerbate neuronal injury by
releasing cytokines and reactive metabolites (4). Studies further indicate that the
metabolic state of microglia is tightly coupled to their functional
phenotypes (5). Nevertheless,
the upstream molecular determinants connecting microglial
polarization to metabolic dysregulation remain poorly defined.
Metabolic reprogramming, defined as the preferential
utilization of glycolysis for energy production even under normoxic
conditions, has recently attracted increasing attention because of
its critical role in the pathogenesis of AD (6). Microglia undergo marked metabolic
reprogramming during M1 polarization, leading to increased release
of proinflammatory cytokines and metabolic byproducts, thereby
contributing to AD progression (7). Lactylation, a newly recognized
post-translational modification (PTM), is a direct consequence of
metabolic reprogramming and plays a pivotal role in regulating
microglial function (8,9). Lactylation facilitates the
proinflammatory M1 phenotype and the secretion of associated
cytokines in microglia while simultaneously exerting a positive
feedback effect on glycolysis to further increase metabolic
activity (9). Moreover, it has
been previously reported elevated lactate levels and increased
lactylation in the hippocampal microglia of both AD mouse models
and patients (10). However, the
upstream signaling pathways regulating microglial lactylation
remain unclear.
Sirtuin 1 (SIRT1) belongs to the nicotinamide
adenine dinucleotide (NAD+)-dependent deacylase family
and represents one of the most extensively studied members of the
sirtuin family (11,12). As a critical metabolic sensor,
SIRT1 catalyzes the deacylation of a wide range of substrates and
thereby regulates diverse biological processes, including cellular
energy metabolism, genomic stability, inflammation and aging
(13). In the central nervous
system (CNS), SIRT1 is widely recognized as a key regulator of
neuroinflammation, aging and metabolic signaling, and its impaired
activity is associated with cognitive decline and neurodegeneration
(12,14). Several lines of evidence have
indicated that SIRT1 also exerts delactylase activity in the
regulation of protein lactylation. In gastric cancer cells,
overexpression of SIRT1 has been shown to reduce histone H3K18
lactylation levels (15). In the
context of heart failure, SIRT1 attenuates the development of heart
failure by reducing lactylation at lysine 1,897 of the α-myosin
heavy chain protein (16).
However, whether SIRT1 modulates lactylation in microglia and the
mechanism through which its upstream regulatory pathways are
organized remain unclear.
MicroRNAs (miRNAs or miRs), as potent
posttranscriptional regulators, have been increasingly implicated
in the modulation of neuroinflammation, energy metabolism and
neurodegeneration (17). Among
them, miR-223-3p has gained attention because of its established
role in inflammatory signaling and immune cell activation, and
studies have indicated that miR-223-3p expression is elevated in
patients with AD (18,19). Moreover, several studies have
demonstrated that miR-223-3p is also involved in the regulation of
glucose metabolism. Intracellular miR-223-3p accumulation perturbs
glucose and lipid metabolism in adipocyte models (20), and tumor glycolysis can be
facilitated through a circABCB10/miR-223-3p/PFN2 axis (21). However, the precise mechanisms by
which it contributes to microglial polarization and lactylation
remain to be fully elucidated.
Therefore, in the present study, it was aimed to
investigate the regulatory role of miR-223-3p in microglial
polarization by performing molecular, metabolic, and functional
assays. It was investigated how miR-223-3p modulates lactylation
and microglial polarization to identify potential therapeutic
targets for AD.
Materials and methods
RNA-seq data acquisition and
processing
The miRNA expression profiles of patients with AD
and cognitively normal controls were retrieved from the Gene
Expression Omnibus (GEO) database (datasets: GSE16759 (parietal
lobe tissues) (22) and GSE48552
(prefrontal cortex tissues) (23) https://www.ncbi.nlm.nih.gov/geo/). In addition, blood
and cerebrospinal fluid (CSF) expression data were obtained from
the GSE46579 (serum tissues) (24) and GSE212623 (25) datasets in the GEO and the
Alzheimer's Disease Neuroimaging Initiative (ADNI) databases
(https://adni.loni.usc.edu/).
Differentially expressed miRNAs were identified using the 'limma'
package in R software (version 4.2.1) (https://www.r-project.org/), applying thresholds of
P<0.05 and |log2-fold change (log2FC)|>1. The resulting
candidate miRNAs were retained for subsequent analyses.
Cell culture
The microglial cell line BV2 was purchased from
American Type Culture Collection. BV2 microglia were cultured in
Dulbecco's modified Eagle's medium (DMEM; high glucose; Gibco;
Thermo Fisher Scientific, Inc.) supplemented with 10% fetal bovine
serum (FBS; Gibco; Thermo Fisher Scientific, Inc.) and 1%
penicillin-streptomycin solution (100 U/ml penicillin and 100
μg/ml streptomycin). The cells were maintained at 37°C in a
humidified atmosphere containing 5% CO2.
Cell transfection
To modulate gene and miRNA expression, multiple
transfection strategies have been employed. Synthetic miR-223-3p
mimics and inhibitors were purchased from Shanghai GeneChem Co.,
Ltd. To upregulate miR-223-3p expression, 2×10⁵ cells
were transfected with synthetic miR-223-3p mimics (final
concentration: 50 nM), while a scrambled sequence served as the
negative control (NC, 50 nM). Conversely, miR-223-3p inhibitors
were applied to suppress endogenous expression (final
concentration: 100 nM). To overexpress SIRT1, the Notch1
intracellular domain (NICD1) and FBXW7, full-length cDNAs
were PCR-amplified and subcloned and inserted into the pcDNA3.1
backbone to construct the corresponding overexpression plasmids
[oe-Ubiquitination (Ub), oe-SIRT1, oe-NICD1 and oe-FBXW7)], with
the empty pcDNA3.1 vector used as the NC (oe-NC). All plasmids were
purchased from GEBERAL BIOL company. BV2 or 293T cells were
transfected with 2 μg plasmid DNA per well in 6-well plates,
with the empty pcDNA3.1 vector used as the negative control
(oe-NC). For RNA interference, small interfering RNA (siRNA)
transfection targeting mouse Hes1 was purchased from GEBERAL BIOL
company and transfected at a final concentration of 50 nM using
Lipofectamine siRNA Transfection Reagent, and transfection
efficiency was assessed by measuring protein levels 72 h
post-transfection. All plasmid transfections were carried out using
X-tremeGENE HP DNA Transfection Reagent (Roche Diagnostics)
according to the manufacturer's protocol.
Liquid chromatography coupled with tandem
mass spectrometry (LC-MS/MS) analysis
For metabolomic analysis of metabolites using
LC-MS/MS, data were acquired in both positive and negative ion
modes to ensure comprehensive coverage of the metabolic network.
For metabolomic profiling, chromatographic separation was performed
on a Shimadzu Nexera X2 LC-30AD ultrahigh-performance liquid
chromatography (UHPLC) system equipped with an XBridge BEH C18
column. The column was maintained at 40°C, with a mobile phase
consisting of (A) water containing 5% acetonitrile and 10 mM
ammonium acetate (pH 9.0) and (B) water containing 95% acetonitrile
and 10 mM ammonium acetate (pH 9.0). The gradient program was set
as follows: 0-2 min, 95% B; 2-9 min, linear decrease to 70% B; 9-10
min, further decrease to 30% B; 10-11 min, hold at 30% B; 11-11.5
min, return to 95% B; and 11.5-15 min, re-equilibration. The flow
rate was 300 μl/min, the injection volume was 5 μl,
and the autosampler was kept at 4°C. Mass spectrometric detection
was performed on a triple quadrupole linear ion trap system
operated in multiple reaction monitoring (MRM) mode, with optimized
parent-product ion transitions for targeted metabolites. The
collision energy and declustering potential were adjusted on the
basis of preliminary optimization. Data acquisition and processing
were carried out using Analyst TF 1.7.1 software (Shanghai AB SCIEX
Analytical Instrument Trading Co.), with chromatographic peaks
integrated via the Macleod algorithm and a minimum signal-to-noise
ratio of 3:1 as the cutoff for detection. Intracellular lactate
concentration was measured with a Lactate Content Assay kit (cat.
no. AKAC001-1M-50S; Beijing Boxbio Science & Technology, Co.,
Ltd.), following the manufacturers' protocols.
Extracellular acidification rate
(ECAR)
The ECAR was assessed using the Seahorse XF
Glycolysis Stress Test (Agilent Technologies, Inc.). Briefly, cells
(4×10⁴ per well) were seeded into XF24 microplates and
cultured overnight. On the day of measurement, the cells were
equilibrated in Seahorse assay medium, and the ECAR was monitored
at baseline, followed by sequential injections of 10 mM glucose, 1
μM oligomycin (cat. no. HY-N6782; MedChemExpress) and 50 mM
2-deoxy-D-glucose (2-DG; cat. no. HY-13966; MedChemExpress). Basal
glycolysis and glycolytic capacity were determined according to the
manufacturer's protocol.
Oxygen consumption rate (OCR)
For the OCR assessment, the culture medium was
replaced 1 h prior to the assay with mitochondrial stress test
buffer consisting of Seahorse XF Base Medium supplemented with 10
mM glucose, 2 mM glutamine and 1 mM pyruvate. The microplates were
subsequently incubated at 37°C in a CO2-free chamber. In
accordance with the manufacturer's instructions, an XF sensor
cartridge sequentially delivered respiratory modulators to reach
final concentrations of oligomycin (1.5 μM), FCCP (0.5
μM) and rotenone/antimycin A (0.5 μM).
Reverse transcription-quantitative PCR
(RT-qPCR)
Total RNA was isolated using SteadyPure Universal
RNA Extraction Kit II (cat. no. AG21022; Hunan Accurate Bio-Medical
Co., Ltd.), and complementary DNA was synthesized with Evo M-MLV RT
Mix Kit with gDNA Clean for qPCR Ver. 2 (cat. no. AG1728; Hunan
Accurate Bio-Medical Co., Ltd.) following the manufacturer's
protocol. RT-qPCR was subsequently conducted with SYBR Green Premix
Pro Taq HS qPCR Kit (cat. no. AG11701; Hunan Accurate Bio-Medical
Co., Ltd.) on Light Cycler@480 System (Roche Diagnostics). The
thermocycling conditions were as follows: Initial denaturation at
95°C for 30 sec; followed by 40 cycles of denaturation at 95°C for
5 sec and annealing/extension at 60°C for 30 sec. β-actin was used
as an internal control to standardize relative mRNA levels.
miR-223-3p expression was quantified using stem-loop reverse
transcription followed by qPCR. Briefly, a miRNA-specific stem-loop
RT primer was used to selectively reverse transcribe mature miRNA,
and RT-qPCR was performed using a miRNA-specific forward primer and
a universal reverse primer. The U6 gene was used as an internal
control. All PCR primers were designed and synthesized by GENERAL
BIOL Biotech and are listed in Table SI.
Western blotting
For cellular lysate, cells were washed with 1X PBS
and then lysed in RIPA buffer (cat. no. G2002; Wuhan Servicebio
Technology Co., Ltd.) supplemented with Halt protease inhibitor
(cat. no. G2008; Wuhan Servicebio Technology Co., Ltd.) for 20 min
at 4°C. The lysate was subsequently centrifuged at 14,000 × g for 5
min at 4°C to pellet insoluble material. Protein concentrations in
the extracts were determined using the bicinchoninic acid (BCA)
assay (cat. no. P0012; Beyotime Institute of Biotechnology) against
a bovine serum albumin standard curve. Protein samples (10
μl per lane) were loaded into Bolt 10-12% Tris-Glycine Plus
gels and subsequently transferred onto polyvinylidene difluoride
membranes. After blocking with an appropriate reagent, the
membranes were incubated with the indicated primary antibodies
overnight at 4°C, followed by incubation with horse-radish
peroxidase-conjugated secondary antibodies for 1 h at room
temperature. The membranes were rinsed three times with TBST (0.1%
Tween, 10 min each), and protein signals were detected using an
enhanced chemiluminescence (ECL) system (cat. no. KF8001; Affinity
Biosciences). Detailed information on the primary and secondary
antibodies employed is summarized in Table SII. The band intensities were
quantified using ImageJ software (version 1.54g; National
Institutes of Health) and normalized to the β-actin.
Co-immunoprecipitation (Co-IP) assay
293T and BV2 cells were lysed in 500 μl of IP
lysis buffer (cat. no. P70100; New Cell & Molecular Biotech)
containing phenyl-methyl sulfonyl fluoride. The lysates were
centrifuged at 12,000 × g for 10 min at 4°C, and the clarified
supernatants were incubated overnight at 4°C with the indicated
antibody and Protein A/G agarose beads (20 μl; cat. no.
sc-2003; Santa Cruz Biotechnology, Inc.) under gentle rotation.
After six washes with the designated buffer, the bound proteins
were eluted and subjected to western blot analysis as
aforementioned.
Functional enrichment analysis
The functional characterization of differentially
expressed genes (DEGs) was conducted through Kyoto Encyclopedia of
Genes and Genomes (KEGG) pathway enrichment analysis. KEGG
enrichment was implemented using the R package clusterProfiler to
identify biologically relevant signaling pathways (26). In addition, gene set enrichment
analysis (GSEA) was performed with hallmark gene sets retrieved
from the Molecular Signatures Database (MSigDB; http://www.gsea-msigdb.org/gsea/downloads.jsp)
(27,28).
Receiver operating characteristic (ROC)
analysis
ROC curve analysis was performed to evaluate the
diagnostic performance of miR-223-3p in patients with AD. ROC
curves were constructed by plotting sensitivity (true positive
rate) against 1-specificity (false positive rate) across a range of
cutoff values. The area under the ROC curve (AUC) was calculated as
a quantitative measure of diagnostic accuracy. An AUC of 0.5
indicates no discriminative ability, whereas an AUC of 1.0
represents perfect diagnostic performance; therefore, values closer
to 1 indicate improved diagnostic accuracy. Sensitivity,
specificity, and the corresponding 95% confidence intervals (CIs)
were calculated to further assess diagnostic reliability.
Reactive oxygen species (ROS) assay
BV2 microglia in the logarithmic growth phase were
plated in six-well plates at a density of 3×10⁵ cells
per well. For detection, cells were incubated with 5 μM
C11-BODIPY (Thermo Fisher Scientific, Inc.) at 37°C for 30 min,
followed by washing and flow cytometric analysis using a Beckman
Coulter CytoFLEX S (Beckman Coulter, Inc.) according to the
manufacturer's instructions. ROS levels were quantified in the FITC
channel.
Drug treatment
To inhibit glycolytic activity, BV2 microglia were
incubated for 24 h with oxamate (10 mM; cat. no. HY-W013032A;
MedChemExpress) and 2-DG (10 mM; cat. no. HY-13966;
MedChemExpress). The SIRT1 inhibitor EX527 (10 μM;
49843-98-3; TargetMol) and the SIRT1 activator SRT1720 (5
μM; 1001645-58-4; TargetMol) were added separately and
incubated for 24 h. The γ-secretase inhibitor DAPT (20 nM; cat. no.
HY-13027; MedChemExpress) was administered in parallel experiments,
while DMSO served as the vehicle control.
Cell Counting Kit-8 (CCK-8) assay
To determine the half-maximal inhibitory
concentration (IC50) values, BV2 cells were seeded at
10,000 cells per well into 96-well plates and treated with
increasing concentrations of oxamate or 2-DG for 24 h. The medium
was then replaced, 10 μl of CCK-8 solution (Beijing LABLEAD,
Inc.) was added to each well, and the absorbance at 450 nm was
measured using a microplate reader (Multiskan FC; Thermo Fisher
Scientific, Inc.). Cell viability was assessed according to the
manufacturer's instructions, and the IC50 values were
calculated based on dose-response curves.
Cycloheximide (CHX) chase assay
BV2 cells were plated in 12-well culture plates at a
density of 3×10⁵ cells per well. After attachment, they
were exposed to 2 μM CHX (66-81-9; TargetMol) for the
designated time periods, followed by cell lysis and protein
extraction for western blotting.
Ubiquitylation assay
293T cells were transfected with Ub, Myc-FBXW7 and
His-NICD1 expression plasmids for 48 h, followed by exposure to
MG132 (10 μM; cat. no. 133407-82-6, TargetMol) for 4 h.
After treatment, the cells were rinsed with PBS and lysed, and
immunoprecipitation was performed using 20 μl of proteinA/G
beads (cat. no. sc-2003; Santa Cruz Biotechnology, Inc.). The
precipitated proteins were then subjected to western blotting, and
Notch1 ubiquitination was detected with an anti-Ub antibody.
Dual-luciferase reporter assay
Complementary oligonucleotide pairs containing
either the wild-type (WT) or the mutant (MUT) sequence of the
FBXW7 target region were designed and synthesized by
Shanghai GenePharma Co., Ltd. The annealed fragments were
subsequently cloned and inserted into the pmirGLO Dual-Luciferase
miRNA Target Expression Vector (Promega Corporation). For the
reporter assay, cells were seeded in 24-well plates and
co-transfected with 100 ng of the FBXW7 reporter plasmid (WT or
MUT) and 50 nM miR-223-3p mimics or negative control using
Lipofectamine 3000 (Thermo Fisher Scientific, Inc.). A total of 48
h after transfection, luciferase activity was determined using a
dual-luciferase assay system (cat. no. E1910; Promega Corporation)
and normalized to Renilla luciferase activity.
Statistical analysis
Data distribution was first examined with normality
tests. Comparisons between two groups with normally distributed
variables were performed with unpaired t-tests, whereas one-way
ANOVA was applied for analyses involving three groups, followed by
Bonferroni's post hoc test to adjust for multiple comparisons. When
the data deviated from normality, Wilcoxon rank-sum and
Kruskal-Wallis tests were used for two- and three-group
comparisons, respectively. The results are expressed as the mean ±
standard deviation (SD), and all analyses were two-tailed, with
statistically significant difference set at P<0.05. All the
statistical analyses and data visualization were performed using
GraphPad Prism (version 8.0; Dotmatics) and R software (version
4.2.1).
Results
miR-223-3p is dysregulated in patients
with AD
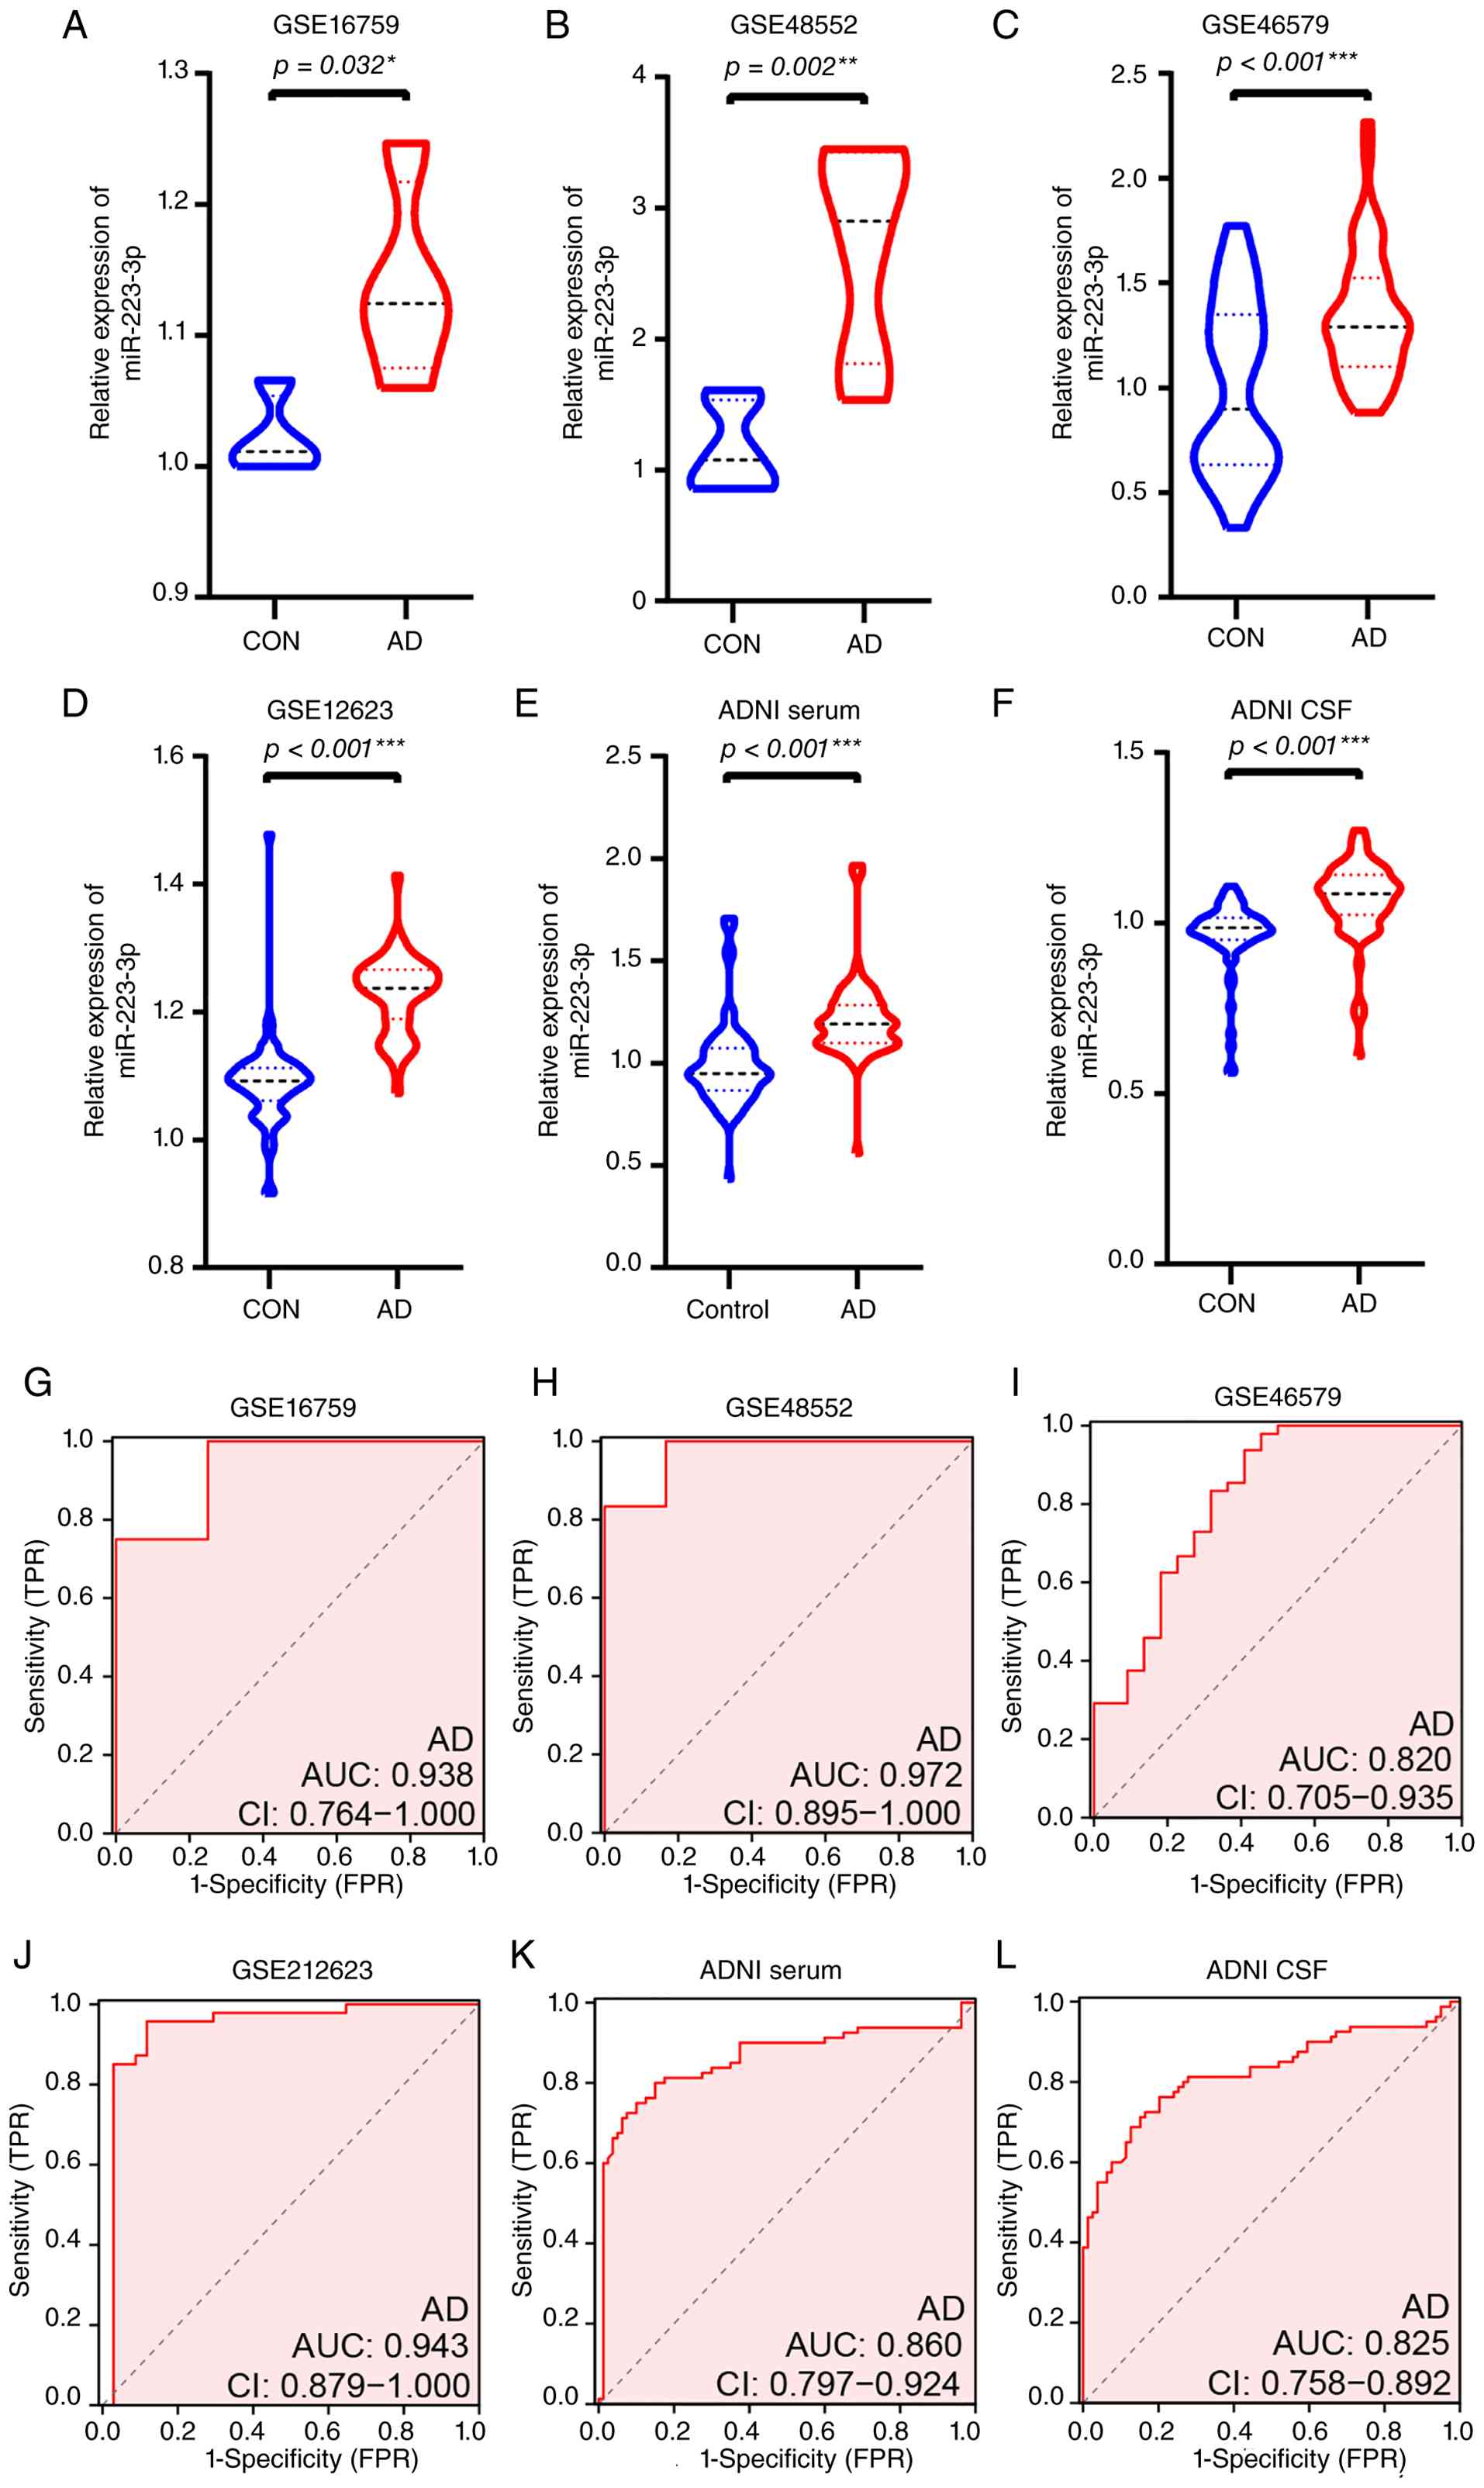
miR-223-3p expression was significantly altered in
patients with AD across multiple brain regions and biofluids. In
the GEO datasets, miR-223-3p levels were significantly increased in
the parietal lobe tissues of patients with AD compared with
controls (GSE16759, P=0.032; Fig.
1A). A similar upregulation was observed in the prefrontal
cortex (GSE48552, P=0.002; Fig.
1B). Consistently, peripheral samples also showed elevated
miR-223-3p levels in AD. In the GEO dataset GSE46579, both serum
and CSF from patients with AD exhibited significantly higher
miR-223-3p levels than those from controls (both P<0.001;
Fig. 1C and D). These findings
were further validated using the ADNI cohort. Compared with
controls, patients with AD demonstrated significantly increased
miR-223-3p levels in both serum and CSF samples (P<0.001 for
both comparisons; Fig. 1E and
F), confirming the consistent dysregulation of miR-223-3p
across independent datasets and sample types.
To evaluate the diagnostic performance of miR-223-3p
for AD, ROC curve analyses were performed. In brain tissues from
the GEO dataset, miR-223-3p showed excellent discriminative
ability, with an AUC of 0.938 (95% CI: 0.764-1.000) in the parietal
lobe (Fig. 1G) and 0.972 (95%
CI: 0.895-1.000) in the prefrontal cortex (Fig. 1H). In peripheral samples, the AUC
was 0.820 (95% CI: 0.705-0.935) for serum (Fig. 1I) and 0.943 (95% CI: 0.879-1.000)
for CSF in the GEO dataset (Fig.
1J). Similar diagnostic performance was observed in the ADNI
cohort, with AUC values of 0.860 (95% CI: 0.797-0.924) for serum
(Fig. 1K) and 0.825 (95% CI:
0.758-0.892) for CSF (Fig. 1L).
Taken together, these results indicate that miR-223-3p is
consistently upregulated in both brain tissues and biofluids of AD
patients and exhibits promising diagnostic value for distinguishing
AD from controls.
miR-223-3p promotes microglial M1
polarization
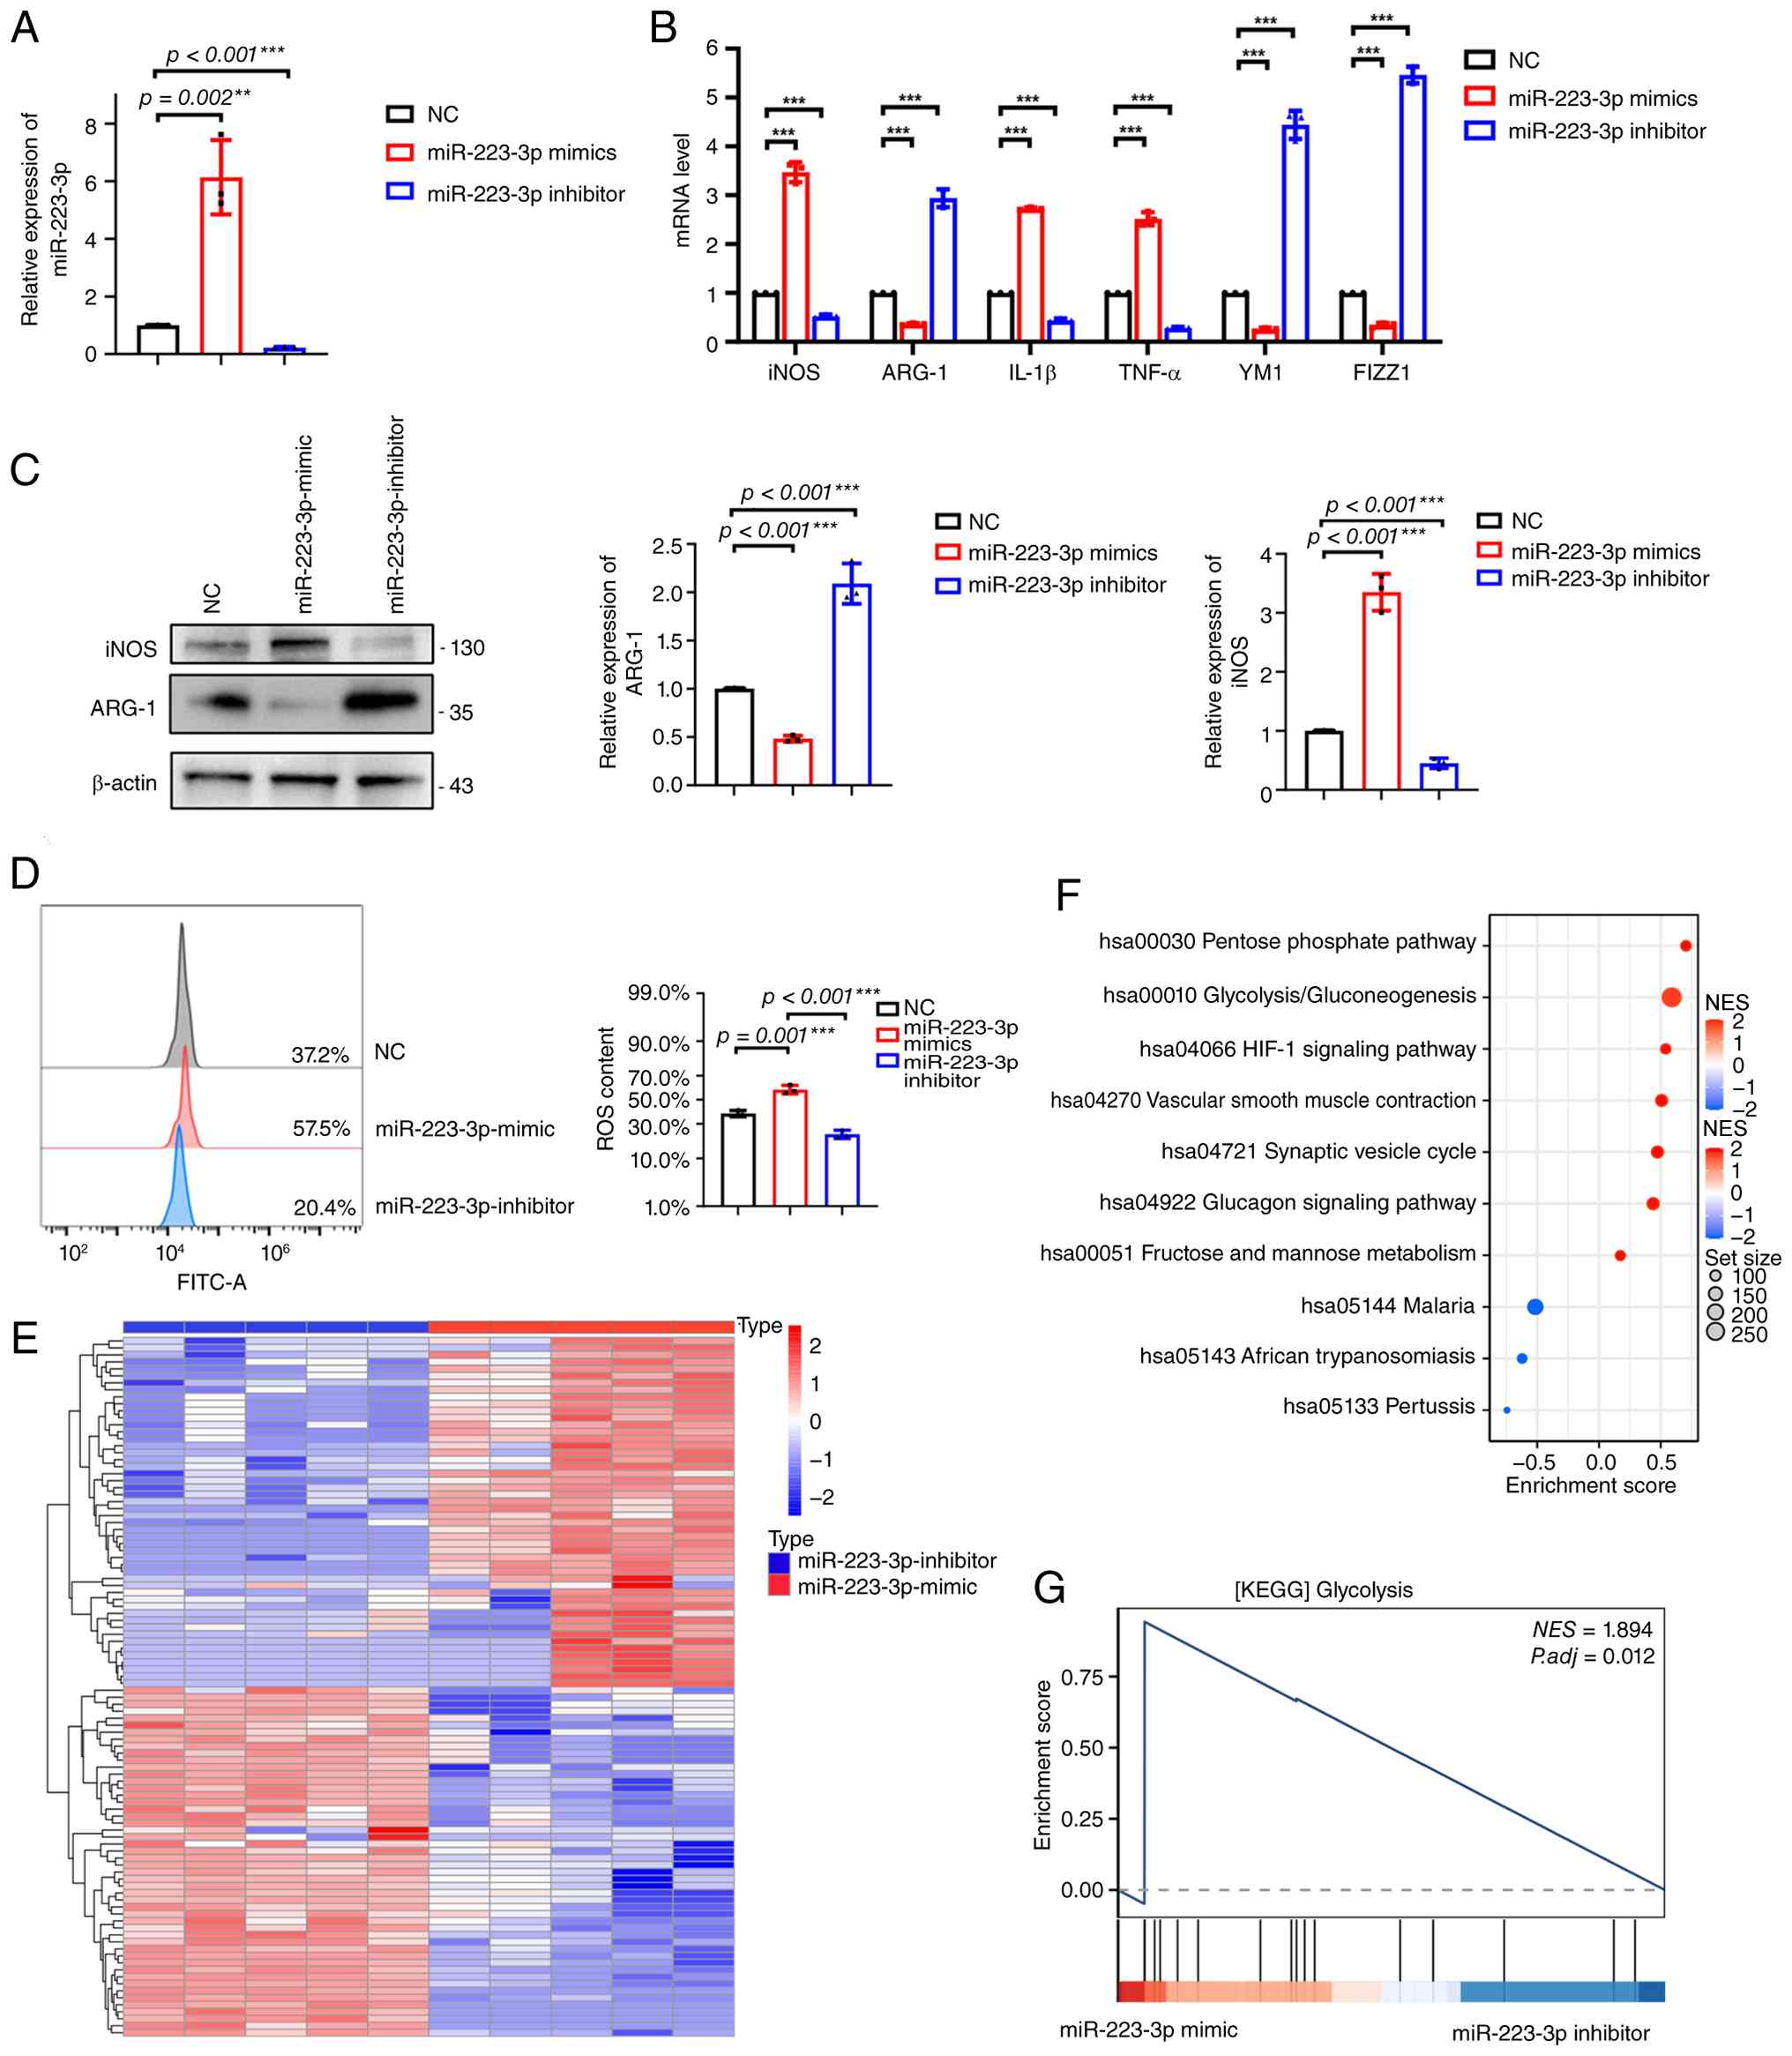
To explore the role of miR-223-3p in microglial
functions, in vitro microglial polarization experiments were
designed. BV2 microglia were used to establish three experimental
conditions: NC, miR-223-3p mimic and miR-223-3p inhibitor. RT-qPCR
verified the efficient modulation of miR-223-3p expression among
the groups (Fig. 2A).
Functionally, miR-223-3p overexpression increased the transcription
of M1-associated markers [iNOS (inducible nitric oxide synthase),
IL-1β and TNF-α] but suppressed M2-associated markers (Arg-1, YM-1
and FIZZ1) (Fig. 2B). Western
blotting further demonstrated elevated iNOS protein levels and
reduced Arg-1 levels in miR-223-3p-overexpressing cells (Fig. 2C). In addition, flow cytometry
revealed a pronounced increase in ROS levels following miR-223-3p
overexpression (Fig. 2D).
Collectively, these findings suggest that miR-223-3p drives
microglial polarization toward the proinflammatory M1
phenotype.
To elucidate the molecular basis of this phenotype,
two groups of microglia were subjected to transcriptome sequencing
(Fig. 2E). KEGG pathway
enrichment revealed that glycolysis/gluconeogenesis and HIF-1
signaling were significantly altered (Fig. 2F). GSEA further confirmed the
enrichment of glycolysis in the miR-223-3p mimic group (Fig. 2G). These results illustrated that
the M1 proinflammatory phenotype may be associated with increased
aerobic glycolysis.
miR-223-3p promotes microglial M1
polarization through glycolysis-linked lysine lactylation
To assess whether miR-223-3p reshapes microglial
glucose metabolism, LC-MS/MS-based metabolomics were performed on
BV2 cells transduced with NC, a miR-223-3p mimic, or a miR-223-3p
inhibitor. A heatmap revealed robust, group-dependent shifts in
metabolite profiles (Fig. 3A).
Targeted quantification revealed that miR-223-3p overexpression
increased the levels of lactate (Fig. 3B) and pyruvate (Fig. 3C), reduced the level of
NADP+ (Fig. 3D), and
increased the level of NADPH (Fig.
3E). Seahorse assays further demonstrated that miR-223-3p
increased the ECAR, increasing both basal and compensatory
glycolysis (Fig. 3F and G), and
increased the OCR, increasing basal, maximal and spare respiratory
capacity (Fig. 3H and I).
Consistent with the metabolomics data, lactate content was greater
in the miR-223-3p mimic group (Fig.
3J). Western blotting confirmed a concomitant increase in
global protein lactylation (Fig.
3K).
To evaluate the potential cytotoxic effects of
glycolytic inhibition, BV2 cells were treated with increasing
concentrations of oxamate or 2-DG, and cell viability was assessed
using a CCK-8 assay. The calculated IC50 values were
31.70 mM for oxamate and 26.56 mM for 2-DG (Fig. S1A and B). Based on these
results, 10 mM oxamate and 10 mM 2-DG, which are well below their
respective IC50 values, were selected for subsequent
experiments to suppress lactylation (Fig. 3L). Inhibiting protein lactylation
attenuated the miR-223-3p-induced transcription of M1 markers
(iNOS, IL-1β and TNF-α) while restoring the expression of M2
markers (Arg-1, YM-1 and FIZZ1) (Fig. 3M). Lactylation inhibition also
reduced intracellular ROS levels (Fig. 3N and O). These results indicate
that miR-223-3p promotes microglial M1 polarization through
glycolysis-associated lysine lactylation.
miR-223-3p enhances microglial
lactylation via SIRT1 suppression, ultimately contributing to M1
polarization
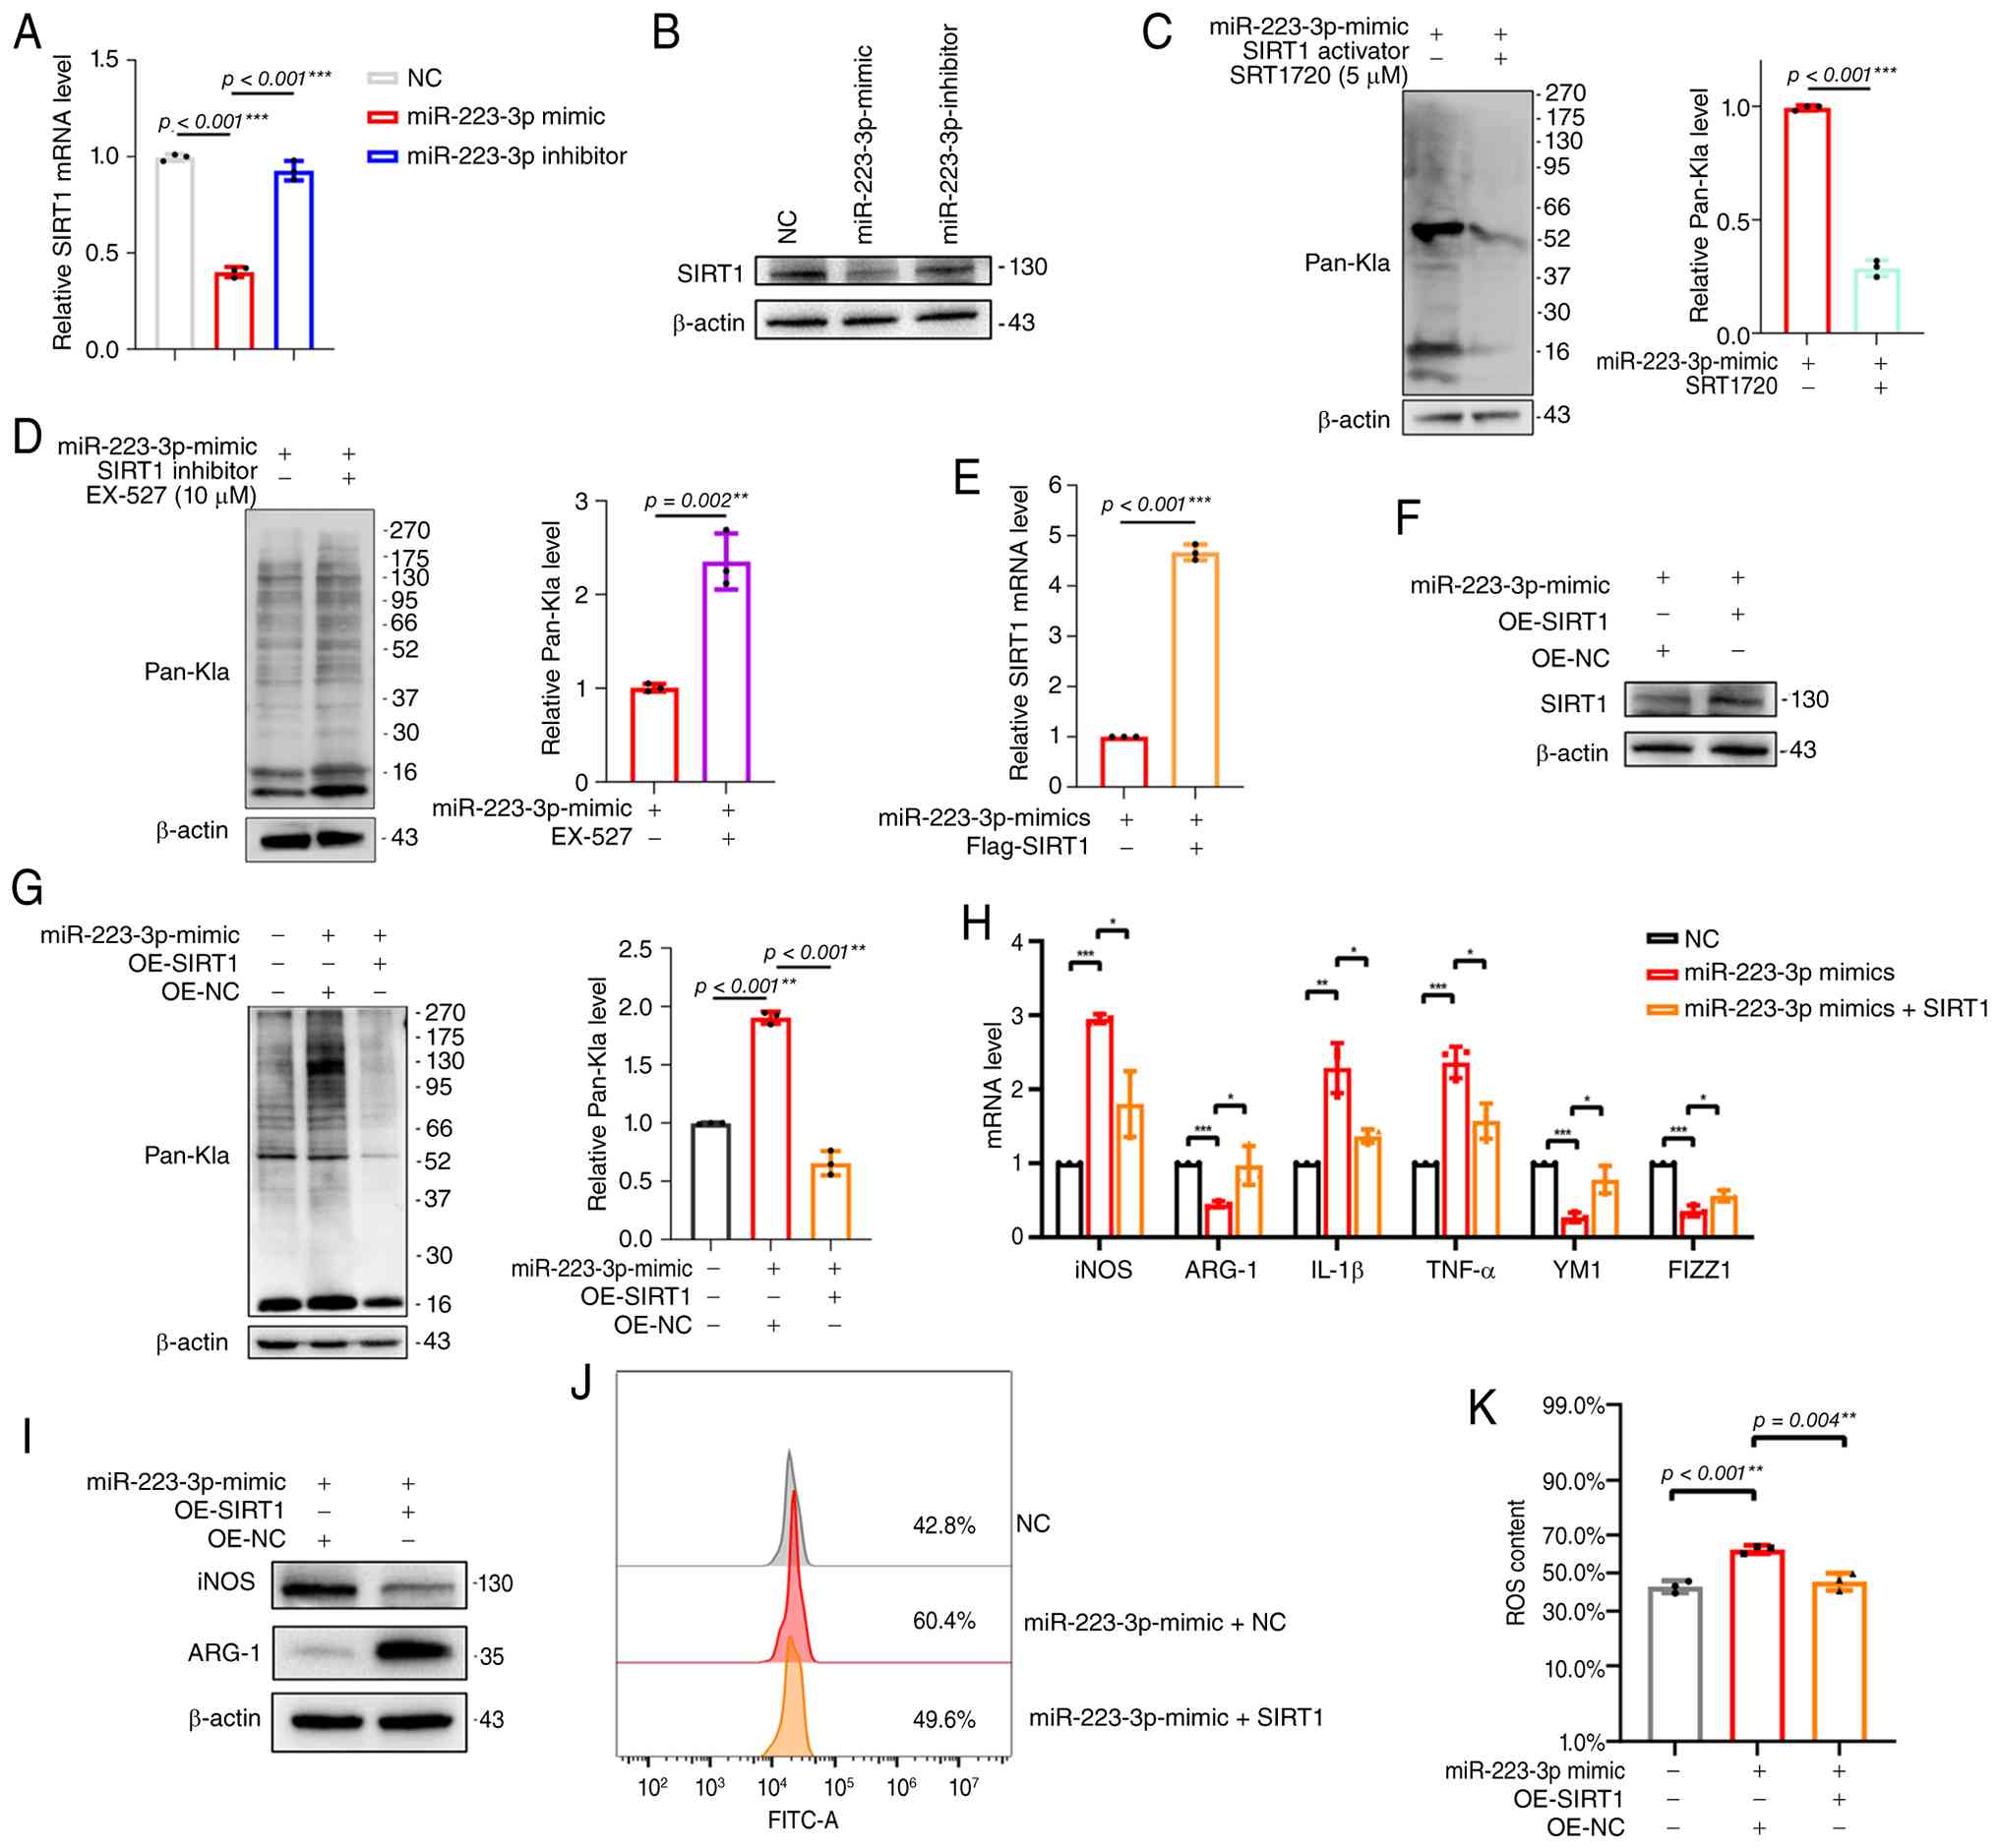
SIRT1 is a known delactylase that regulates protein
lactylation. RT-qPCR and western blotting revealed that miR-223-3p
suppressed both the transcription and translation of SIRT1
(Fig. 4A and B). To explore the
potential mechanism underlying miR-223-3p-mediated regulation of
lactylation, it was examined whether SIRT1 influences protein
lactylation levels. The western blot results showed that treatment
with the SIRT1 activator SRT1720 significantly decreased the
overall Pan-Kla signal compared with the control group (Fig. 4C). By contrast, inhibition of
SIRT1 with EX-527 resulted in a clear increase in Pan-Kla levels
(Fig. 4D). To confirm causality,
SIRT1 was reintroduced into wild-type and miR-223-3p
mimic-transfected BV2 cells (Fig.
S2A; Fig. 4E and F). Western
blotting revealed that SIRT1 overexpression attenuated the increase
in lactylation induced by miR-223-3p (Fig. 4G). Consistently, both RT-qPCR and
western blotting demonstrated that restoring SIRT1 expression
reduced the expression of M1 polarization markers (iNOS, IL-1β and
TNF-α) (Fig. 4H and I).
Furthermore, while miR-223-3p elevated ROS levels in microglia,
SIRT1 overexpression diminished ROS accumulation (Fig. 4J and K).
miR-223-3p promotes microglial
lactylation and M1 polarization by repressing SIRT1 transcription
through the Notch1/Hes1 signaling pathway
The Notch1/Hes1 signaling axis has been reported to
repress SIRT1 transcription by directly binding to its promoter
(29). However, whether
miR-223-3p utilizes this pathway to regulate SIRT1 remains unclear.
The present RT-qPCR analysis revealed that miR-223-3p significantly
upregulated Hes1 mRNA levels but had no effect on
Notch1 transcription (Fig.
5A). However, western blotting revealed that miR-223-3p
increased the protein expression of both Hes1 and NICD1 (Fig. 5B), suggesting that miR-223-3p may
promote NICD1 protein stability or translation through indirect
mechanisms. To further investigate the role of Hes1 in regulating
microglial lactylation and inflammatory activation, siRNA-mediated
knockdown of Hes1 was performed in BV2 cells. Western blot
analysis confirmed that Hes1 silencing significantly increased
SIRT1 expression compared with the control group (Fig. 5C). Consistently, the global level
of Pan-Kla was significantly reduced following Hes1 knockdown
(Fig. 5D). In addition, the
expression of M1-associated inflammatory markers was significantly
decreased (Fig. 5E). To test
functional involvement, the Notch1 inhibitor DAPT was applied. It
was found that Notch1 inhibition also restored SIRT1 expression at
both the transcript and protein levels (Fig. 5F and G). The inhibition of Notch1
attenuated the ability of miR-223-3p to increase lactylation
(Fig. 5H) and drive microglial
M1 polarization (Fig. 5I and J).
Flow cytometry further confirmed that blocking Notch1 reduced the
increase in ROS levels induced by miR-223-3p (Fig. 5K). These findings indicate that
miR-223-3p activates the Notch1/Hes1 pathway to suppress
SIRT1 transcription, thereby promoting lactylation and
skewing microglia toward the proinflammatory M1 phenotype.
miR-223-3p reduces NICD1 ubiquitination
and degradation by targeting FBXW7
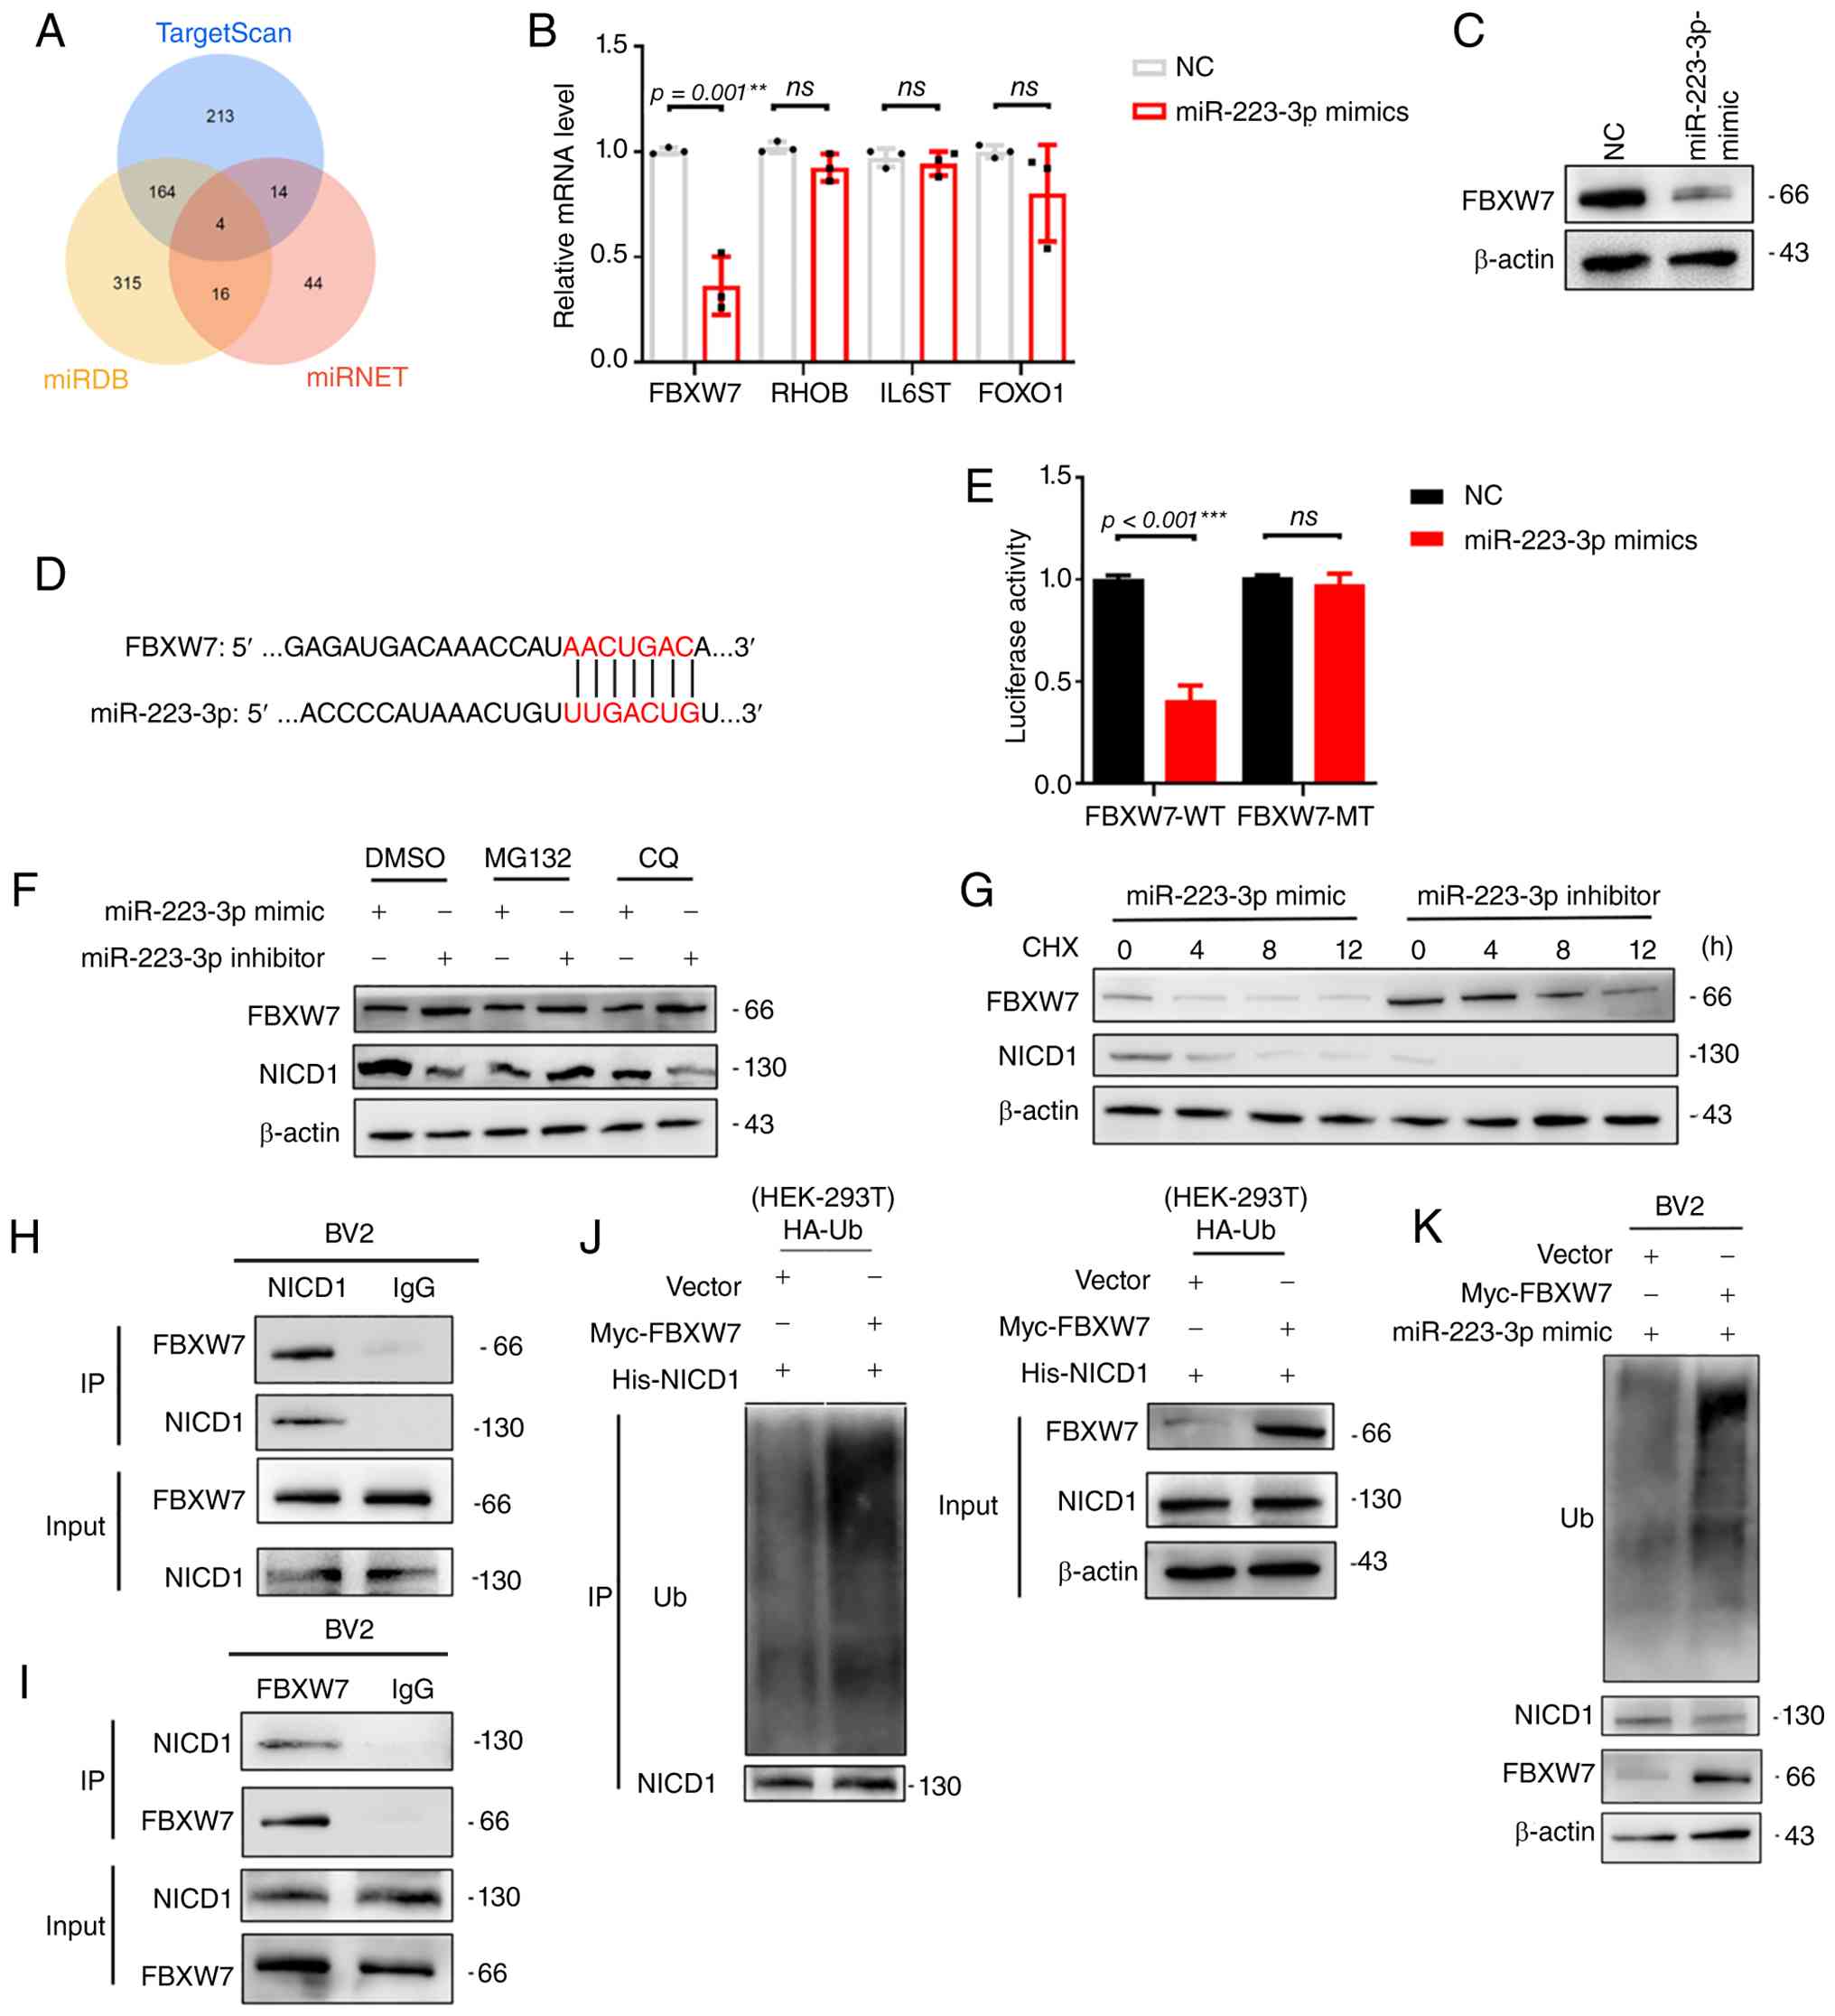
To elucidate how miR-223-3p regulates the
Notch1/Hes1 signaling pathway, target prediction databases were
first used and FBXW7 was identified as a potential
downstream target of miR-223-3p (Fig. 6A). RT-qPCR and western blot
analyses confirmed that miR-223-3p suppressed FBXW7
expression in microglia (Fig. 6B and
C). The predicted binding site of miR-223-3p within the
FBXW7 3' untranslated region is shown in Fig. 6D, and a dual-luciferase reporter
assay confirmed the direct binding of miR-223-3p to FBXW7
(Fig. 6E).
Next, it was explored whether miR-223-3p affects
NICD1 degradation pathways. When proteasomal degradation was
blocked, inhibition of miR-223-3p modestly increased NICD1 levels,
whereas blocking lysosomal degradation reduced NICD1 expression
(Fig. 6F). These results
suggested that miR-223-3p promotes proteasome-dependent degradation
of NICD1 via FBXW7 while stabilizing NICD1. Indeed, inhibiting
miR-223-3p increased FBXW7 expression, increased NICD1
degradation, and accelerated NICD1 turnover following CHX treatment
(Fig. 6G). Interactions between
FBXW7 and NICD1 were verified by co-IP assays (Fig. 6H and I). Moreover, FBXW7
overexpression promoted the ubiquitination and degradation of NICD1
in both 293T and BV2 cells (Fig.
S2B-D; Fig. 6J and K). These
findings demonstrate that miR-223-3p directly targets and represses
FBXW7, thereby reducing NICD1 ubiquitination and proteasomal
degradation, which stabilizes NICD1 and facilitates downstream
Notch1/Hes1 signaling.
Discussion
In the present study, the results of transcriptomic
analyses indicated that the expression of miR-223-3p was
upregulated in the brain tissue, blood and CSF of individuals with
AD and exhibited potential diagnostic value. The results of
functional assays, including the assessment of microglial
polarization markers, metabolomic profiling and metabolic flux
measurements, suggested that miR-223-3p facilitates M1 microglial
polarization through the increase in protein lactylation.
Mechanistic investigations and rescue experiments further
demonstrated that miR-223-3p suppressed FBXW7 expression, thereby
attenuating the ubiquitin-proteasome-mediated degradation of NICD1.
The stabilization of NICD1 consequently activated the Notch1/Hes1
signaling cascade, leading to reduced SIRT1 transcription and
increased lactylation (Fig.
7).
Neuroimmune inflammation is considered a central
mechanism in the pathogenesis of AD and is characterized by
heightened immune cell activation and elevated levels of
proinflammatory mediators (30).
It has been shown that M1-polarized microglia further exacerbate
neuronal injury through the release of inflammatory cytokines,
thereby facilitating AD progression (31). Moreover, accumulating evidence
has indicated that the metabolic states of microglia under
different activation conditions are closely associated with their
functional phenotypes (5).
Similarly, in the present study, inhibition of glycolysis led to a
reduction in the expression of M1 polarization markers in
microglia, further supporting the notion that the metabolic state
is critically associated with their phenotypic functions.
Lactylation was recently identified as a novel form
of PTM in which lactate, a key metabolite of glycolysis, served as
the substrate to directly regulate cellular metabolism, function
and signaling pathways (8).
Glycolysis, as a central pathway of energy metabolism, plays a
critical role in microglial activation and functional regulation
(32). When exposed to
pathological stimuli such as Aβ deposition, trauma, or infection,
microglia undergo pronounced metabolic reprogramming, shifting
their metabolic profile from oxidative phosphorylation to aerobic
glycolysis (33,34). This metabolic shift was
particularly prominent in proinflammatory microglia (33). In the present study, a concurrent
increase was observed in ECAR and OCR following miR-223-3p
overexpression, suggesting that miR-223-3p enhances overall
metabolic activity in microglia. This metabolic state may promote
glycolysis-driven lactate production and protein lactylation while
maintaining mitochondrial respiration to meet the increased
energetic demands during inflammatory activation. Meanwhile, it was
observed that miR-223-3p promoted M1 microglial polarization, which
was accompanied by increased lactylation. The inhibition of
microglial lactylation by glycolysis inhibitors, including oxamate
and 2-DG, also suppressed M1 polarization. These findings suggest
that lactylation may represent an important mechanism through which
miR-223-3p drives microglial M1 polarization.
SIRT1, an NAD+-dependent deacetylase,
plays pivotal roles in energy metabolism, transcriptional
regulation and cellular homeostasis and is regarded as an important
modulator of cognitive function and the progression of
neurodegenerative disorders (35,36). Experimental studies have
demonstrated that activation of the NAD+/SIRT1 pathway
in AD animal models alleviated Aβ burden and improved cognitive
impairment (37,38). Conversely, deletion of the SIRT1
gene markedly reduced neuronal mitochondrial biogenesis, leading to
insufficient energy supply and excessive Aβ deposition, thereby
accelerating AD pathology (39).
Previous research further indicated that SIRT1 exerted
anti-inflammatory effects in microglia, where increased activity
suppressed the release of proinflammatory cytokines and promoted
the maintenance of an anti-inflammatory phenotype (40). The present findings suggest that
the protein lactylation observed in the present study is dependent
on SIRT1 enzymatic activity. Reduced SIRT1 expression may limit its
delactylase function, leading to the accumulation of lactylation
and enhanced inflammatory gene expression.
The Notch1/Hes1 signaling pathway is a highly
conserved intercellular communication mechanism that plays
important roles in regulating cell proliferation, differentiation
and metabolism. Recent studies have demonstrated that Notch1
signaling is closely linked to glycolysis. Specifically, NICD1 is
localized to the mitochondrial matrix and directly activates
pyruvate dehydrogenase, thereby promoting glycolysis in cardiac
endothelial cells (41). Hes1, a
classical downstream target of Notch1 signaling, functions as a
transcriptional repressor by binding to gene promoters and
suppressing transcriptional activity. Evidence has indicated that
the Notch1/Hes1 axis markedly enhances aerobic glycolysis and
promotes tumor progression in colorectal cancer cells (42). Notably, the role of Notch1 in the
CNS has received increasing attention. It has been suggested that
Notch1 modulates microglial cytokine secretion, phenotypic
transformation and metabolic states, thereby contributing to the
maintenance of brain homeostasis and the regulation of
neuroinflammation (43). In the
present study, it was observed that miR-223-3p activated the
Notch1/Hes1 pathway, which significantly suppressed SIRT1
expression. Treatment with the Notch1 inhibitor DAPT restored SIRT1
levels, further supporting the central role of the Notch1/Hes1 axis
in regulating SIRT1 expression and the downstream process of
protein lactylation. Consistently, silencing Hes1 also restored
SIRT1 expression, indicating that Hes1 acts as a key
transcriptional repressor of SIRT1 in this pathway.
The activity of the Notch1 receptor is tightly
regulated by the ubiquitin-proteasome system (44). It has been demonstrated that the
E3 ubiquitin ligase FBXW7 plays a critical role in the
ubiquitination and degradation of Notch1. Specifically, FBXW7
recognized phosphorylated motifs within NICD1 and promoted its
ubiquitin-mediated degradation, thereby negatively regulating the
activity of the Notch1 signaling pathway (45). These findings indicated that
FBXW7 functioned as an essential suppressor of the maintenance of
Notch1 protein homeostasis. Consistent with earlier findings, the
present study revealed that miR-223-3p targeted and suppressed
FBXW7 expression, which attenuated Notch1 ubiquitination and
degradation, leading to increased Notch1 protein stability and
increased Notch1/Hes1 signaling activity. In line with previous
studies that highlighted the significance of the interaction of
miR-223-3p and FBXW7 in various inflammatory and tumor
models (46,47), the current results further
revealed the critical role of this regulatory pathway in microglial
lactylation and M1 polarization.
The present study revealed that miR-223-3p activated
microglial lactylation and M1 polarization by targeting the
FBXW7/Notch1/Hes1/SIRT1 signaling axis. These findings were
consistent with previous evidence showing that aerobic glycolysis
was markedly enhanced in M1-polarized microglia. Nevertheless,
several limitations should be acknowledged. First, the experiments
relied on the BV2 microglial cell line, which differs from primary
human microglia and therefore might not fully reflect the in
vivo state. Although BV2 cells serve as a well-established
in vitro model for determining microglial signaling
mechanisms, immortalized microglial lines may not fully reflect the
physiological state of primary microglia in the brain
microenvironment. Future studies using primary microglia and in
vivo AD models will be needed to further validate the role of
the miR-223-3p/FBXW7/Notch1/Hes1/SIRT1 regulatory axis identified
in this study. Second, although the current findings suggested that
miR-223-3p regulated microglial lactylation via the
FBXW7/Notch1/Hes1/SIRT1 axis, the underlying mechanisms require
further validation in animal models to establish their
physiological relevance. Further validation in animal models and
mechanistic experiments will be needed to confirm causality. Third,
the present study did not investigate the broader neuroinflammatory
network or potential crosstalk between miR-223-3p and other
metabolic or signaling pathways that may also contribute to AD
progression. Future research should employ integrative approaches,
such as multi-omics and systems biology analyses, to provide a more
comprehensive understanding.
In conclusion, the present study revealed that
miR-223-3p promoted microglial lactylation-mediated M1 polarization
through the FBXW7/Notch1/Hes1/SIRT1 signaling axis. These findings
expand the current understanding of lactylation in
neuroinflammation and provide new insights into the interplay
between microglial metabolism and inflammatory responses. Moreover,
miR-223-3p may represent a potential therapeutic target for AD.
Supplementary Data
Availability of data and materials
The data generated in the present study may be
requested from the corresponding author.
Authors' contributions
XYW conceptualized the study, conducted formal
analysis, investigation, data curation, statistical analysis and
data visualization, provided resources and wrote the original draft
of the manuscript. LS conceptualized and supervised the study,
performed data visualization, and wrote, reviewed, and edited the
manuscript. JFW and QQX conducted formal analysis, investigation
and statistical analysis, and wrote, reviewed and edited the
manuscript. YW and CYL conducted investigation and data
visualization and reviewed and edited the manuscript. TQW and YFD
conceptualized and supervised the study, performed data
visualization, and wrote, reviewed and edited the manuscript. All
the authors had access to and verified the data used in the present
study. All authors read and approved the final version of the
manuscript and confirm the authenticity of all the raw data.
Ethics approval and consent to
participate
Not applicable.
Patient consent for publication
Not applicable.
Competing interests
The authors declare that they have no competing
interests.
Acknowledgements
Not applicable.
Funding
The present study was supported by the STI2030-Major Project
(grant nos. 2021ZD0201808 and 2022ZD0211600), the Academic
Promotion Program of Shandong First Medical University (grant nos.
2019QL020 and 2020RC009), the Natural Science Foundation of
Shandong (grant no. ZR2024MH225) and the Taishan Scholar Program of
Shandong (grant nos. ts20190977 and Tsqn201909182).
References
|
1
|
Lanctôt KL, Hviid Hahn-Pedersen J,
Eichinger CS, Freeman C, Clark A, Tarazona LRS and Cummings J:
Burden of illness in people with Alzheimer's disease: A systematic
review of epidemiology, comorbidities and mortality. J Prev
Alzheimers Dis. 11:97–107. 2024. View Article : Google Scholar : PubMed/NCBI
|
|
2
|
Heneka MT, van der Flier WM, Jessen F,
Hoozemanns J, Thal DR, Boche D, Brosseron F, Teunissen C,
Zetterberg H, Jacobs AH, et al: Neuroinflammation in Alzheimer
disease. Nat Rev Immunol. 25:321–352. 2025. View Article : Google Scholar
|
|
3
|
Young-Pearse TL, Lee H, Hsieh YC, Chou V
and Selkoe DJ: Moving beyond amyloid and tau to capture the
biological heterogeneity of Alzheimer's disease. Trends Neurosci.
46:426–444. 2023. View Article : Google Scholar : PubMed/NCBI
|
|
4
|
Gao C, Jiang J, Tan Y and Chen S:
Microglia in neurodegenerative diseases: Mechanism and potential
therapeutic targets. Signal Transduct Target Ther. 8:3592023.
View Article : Google Scholar : PubMed/NCBI
|
|
5
|
Orihuela R, McPherson CA and Harry GJ:
Microglial M1/M2 polarization and metabolic states. Br J Pharmacol.
173:649–665. 2016. View Article : Google Scholar
|
|
6
|
Ward PS and Thompson CB: Metabolic
reprogramming: A cancer hallmark even warburg did not anticipate.
Cancer Cell. 21:297–308. 2012. View Article : Google Scholar : PubMed/NCBI
|
|
7
|
Zhang Y, Chen JC, Zheng JH, Cheng YZ, Weng
WP, Zhong RL, Sun SL, Shi YS and Pan XD: Pterosin B improves
cognitive dysfunction by promoting microglia M1/M2 polarization
through inhibiting Klf5/Parp14 pathway. Phytomedicine.
135:1561522024. View Article : Google Scholar : PubMed/NCBI
|
|
8
|
Zhang D, Tang Z, Huang H, Zhou G, Cui C,
Weng Y, Liu W, Kim S, Lee S, Perez-Neut M, et al: Metabolic
regulation of gene expression by histone lactylation. Nature.
574:575–580. 2019. View Article : Google Scholar : PubMed/NCBI
|
|
9
|
Wang L, Cai Z, Gu Q and Xu C: cGAS
deficiency regulates the phenotypic polarization and glycolysis of
microglia through lactylation in hypoxic-ischemic encephalopathy
cell model. Biochem Genet. 62:3961–3976. 2024. View Article : Google Scholar : PubMed/NCBI
|
|
10
|
Pan RY, He L, Zhang J, Liu X, Liao Y, Gao
J, Liao Y, Yan Y, Li Q, Zhou X, et al: Positive feedback regulation
of microglial glucose metabolism by histone H4 lysine 12
lactylation in Alzheimer's disease. Cell Metab. 34:634–648.e6.
2022. View Article : Google Scholar : PubMed/NCBI
|
|
11
|
Chang HC and Guarente L: SIRT1 and other
sirtuins in metabolism. Trends Endocrinol Metab. 25:138–145. 2014.
View Article : Google Scholar : PubMed/NCBI
|
|
12
|
Herskovits AZ and Guarente L: SIRT1 in
neurodevelopment and brain senescence. Neuron. 81:471–483. 2014.
View Article : Google Scholar : PubMed/NCBI
|
|
13
|
Rahman S and Islam R: Mammalian Sirt1:
Insights on its biological functions. Cell Commun Signal. 9:112011.
View Article : Google Scholar : PubMed/NCBI
|
|
14
|
Lian B, Zhang J, Yin X, Wang J, Li L, Ju
Q, Wang Y, Jiang Y, Liu X, Chen Y, et al: SIRT1 improves lactate
homeostasis in the brain to alleviate parkinsonism via
deacetylation and inhibition of PKM2. Cell Rep Med. 5:1016842024.
View Article : Google Scholar : PubMed/NCBI
|
|
15
|
Tsukihara S, Akiyama Y, Shimada S, Hatano
M, Igarashi Y, Taniai T, Tanji Y, Kodera K, Yasukawa K, Umeura K,
et al: Delactylase effects of SIRT1 on a positive feedback loop
involving the H19-glycolysis-histone lactylation in gastric cancer.
Oncogene. 44:724–738. 2025. View Article : Google Scholar
|
|
16
|
Zhang N, Zhang Y, Xu J, Wang P, Wu B, Lu
S, Lu X, You S, Huang X, Li M, et al: α-myosin heavy chain
lactylation maintains sarcomeric structure and function and
alleviates the development of heart failure. Cell Res. 33:679–698.
2023. View Article : Google Scholar : PubMed/NCBI
|
|
17
|
Li S, Lei Z and Sun T: The role of
microRNAs in neurodegenerative diseases: A review. Cell Biol
Toxicol. 39:53–83. 2023. View Article : Google Scholar
|
|
18
|
Jiao P, Wang XP, Luoreng ZM, Yang J, Jia
L, Ma Y and Wei DW: miR-223: An effective regulator of immune cell
differentiation and inflammation. Int J Biol Sci. 17:2308–2322.
2021. View Article : Google Scholar : PubMed/NCBI
|
|
19
|
La Rosa F, Mancuso R, Agostini S, Piancone
F, Marventano I, Saresella M, Hernis A, Fenoglio C, Galimberti D,
Scarpini E and Clerici M: Pharmacological and epigenetic regulators
of NLRP3 inflammasome activation in Alzheimer's disease.
Pharmaceuticals (Basel). 14:11872021. View Article : Google Scholar : PubMed/NCBI
|
|
20
|
Sánchez-Ceinos J, Rangel-Zuñiga OA,
Clemente-Postigo M, Podadera-Herreros A, Camargo A, Alcalá-Diaz JF,
Guzmán-Ruiz R, López-Miranda J and Malagón MM: miR-223-3p as a
potential biomarker and player for adipose tissue dysfunction
preceding type 2 diabetes onset. Mol Ther Nucleic Acids.
23:1035–1052. 2021. View Article : Google Scholar : PubMed/NCBI
|
|
21
|
Zhao Y, Zhong R, Deng C and Zhou Z: Circle
RNA circABCB10 modulates PFN2 to promote breast cancer progression,
as well as aggravate radioresistance through facilitating
glycolytic metabolism Via miR-223-3p. Cancer Biother Radiopharm.
36:477–490. 2021.
|
|
22
|
Nunez-Iglesias J, Liu CC, Morgan TE, Finch
CE and Zhou XJ: Joint genome-wide profiling of miRNA and mRNA
expression in Alzheimer's disease cortex reveals altered miRNA
regulation. PLoS One. 5:e88982010. View Article : Google Scholar : PubMed/NCBI
|
|
23
|
Lau P, Bossers K, Janky R, Salta E,
Frigerio CS, Barbash S, Rothman R, Sierksma AS, Thathiah A,
Greenberg D, et al: Alteration of the microRNA network during the
progression of Alzheimer's disease. EMBO Mol Med. 5:1613–1634.
2013. View Article : Google Scholar : PubMed/NCBI
|
|
24
|
Leidinger P, Backes C, Deutscher S,
Schmitt K, Mueller SC, Frese K, Haas J, Ruprecht K, Paul F, Stähler
C, et al: A blood based 12-miRNA signature of Alzheimer disease
patients. Genome Biol. 14:R782013. View Article : Google Scholar : PubMed/NCBI
|
|
25
|
Wiedrick JT, Phillips JI, Lusardi TA,
McFarland TJ, Lind B, Sandau US, Harrington CA, Lapidus JA, Galasko
DR, Quinn JF and Saugstad JA: Validation of MicroRNA biomarkers for
Alzheimer's disease in human cerebrospinal fluid. J Alzheimers Dis.
67:875–891. 2019. View Article : Google Scholar : PubMed/NCBI
|
|
26
|
Yu G, Wang LG, Han Y and He QY:
clusterProfiler: An R package for comparing biological themes among
gene clusters. OMICS. 16:284–287. 2012. View Article : Google Scholar : PubMed/NCBI
|
|
27
|
Liberzon A, Subramanian A, Pinchback R,
Thorvaldsdóttir H, Tamayo P and Mesirov JP: Molecular signatures
database (MSigDB) 3.0. Bioinformatics. 27:1739–1740. 2011.
View Article : Google Scholar : PubMed/NCBI
|
|
28
|
Liberzon A, Birger C, Thorvaldsdóttir H,
Ghandi M, Mesirov JP and Tamayo P: The molecular signatures
database (MSigDB) hallmark gene set collection. Cell Syst.
1:417–425. 2015. View Article : Google Scholar
|
|
29
|
Duan JL, Ruan B, Song P, Fang ZQ, Yue ZS,
Liu JJ, Dou GR, Han H and Wang L: Shear stress-induced cellular
senescence blunts liver regeneration through Notch-sirtuin
1-P21/P16 axis. Hepatology. 75:584–599. 2022. View Article : Google Scholar
|
|
30
|
Kinney JW, Bemiller SM, Murtishaw AS,
Leisgang AM, Salazar AM and Lamb BT: Inflammation as a central
mechanism in Alzheimer's disease. Alzheimers Dement (N Y).
4:575–590. 2018. View Article : Google Scholar : PubMed/NCBI
|
|
31
|
Kang YJ, Tan HY, Lee CY and Cho H: An air
particulate pollutant induces neuroinflammation and
neurodegeneration in human brain models. Adv Sci (Weinh).
8:e21012512021. View Article : Google Scholar : PubMed/NCBI
|
|
32
|
McIntosh A, Mela V, Harty C, Minogue AM,
Costello DA, Kerskens C and Lynch MA: Iron accumulation in
microglia triggers a cascade of events that leads to altered
metabolism and compromised function in APP/PS1 mice. Brain Pathol.
29:606–621. 2019. View Article : Google Scholar : PubMed/NCBI
|
|
33
|
Kong E, Li Y, Ma P, Zhang Y, Ding R, Hua
T, Yang M and Yuan H: Lyn-mediated glycolysis enhancement of
microglia contributes to neuropathic pain through facilitating IRF5
nuclear translocation in spinal dorsal horn. J Cell Mol Med.
27:1664–1681. 2023. View Article : Google Scholar : PubMed/NCBI
|
|
34
|
Baik SH, Kang S, Lee W, Choi H, Chung S,
Kim JI and Mook-Jung I: A breakdown in metabolic reprogramming
causes microglia dysfunction in Alzheimer's disease. Cell Metab.
30:493–507.e6. 2019. View Article : Google Scholar : PubMed/NCBI
|
|
35
|
Thapa R, Moglad E, Afzal M, Gupta G, Bhat
AA, Hassan Almalki W, Kazmi I, Alzarea SI, Pant K, Singh TG, et al:
The role of sirtuin 1 in ageing and neurodegenerative disease: A
molecular perspective. Ageing Res Rev. 102:1025452024. View Article : Google Scholar : PubMed/NCBI
|
|
36
|
Razick DI, Akhtar M, Wen J, Alam M, Dean
N, Karabala M, Ansari U, Ansari Z, Tabaie E and Siddiqui S: The
role of sirtuin 1 (SIRT1) in neurodegeneration. Cureus.
15:e404632023.PubMed/NCBI
|
|
37
|
Yang X, Zhou P, Zhao Z, Li J, Fan Z, Li X,
Cui Z and Fu A: Improvement effect of mitotherapy on the cognitive
ability of Alzheimer's disease through
NAD+/SIRT1-mediated autophagy. Antioxidants (Basel).
12:20062023. View Article : Google Scholar
|
|
38
|
Zhao W, Yang R, Meng X, Xu SQ, Li MM, Hao
ZC, Wang SY, Jiang YK, Naseem A, Chen QS, et al: Panax
quinquefolium saponins protects neuronal activity by promoting
mitophagy in both in vitro and in vivo models of Alzheimer's
disease. J Ethnopharmacol. 340:1192502025. View Article : Google Scholar
|
|
39
|
Li B, Chen Y, Zhou Y, Feng X, Gu G, Han S,
Cheng N, Sun Y, Zhang Y, Cheng J, et al: Neural stem cell-derived
exosomes promote mitochondrial biogenesis and restore abnormal
protein distribution in a mouse model of Alzheimer's disease.
Neural Regen Res. 19:1593–1601. 2024. View Article : Google Scholar :
|
|
40
|
Cho SH, Chen JA, Sayed F, Ward ME, Gao F,
Nguyen TA, Krabbe G, Sohn PD, Lo I, Minami S, et al: SIRT1
deficiency in microglia contributes to cognitive decline in aging
and neurodegeneration via epigenetic regulation of IL-1β. J
Neurosci. 35:807–818. 2015. View Article : Google Scholar : PubMed/NCBI
|
|
41
|
Wang J, Zhao R, Xu S, Zhou XY, Cai K, Chen
YL, Zhou ZY, Sun X, Shi Y, Wang F, et al: NOTCH1 mitochondria
localization during heart development promotes mitochondrial
metabolism and the endothelial-to-mesenchymal transition in mice.
Nat Commun. 15:99452024. View Article : Google Scholar : PubMed/NCBI
|
|
42
|
Wang J, Zhu M, Zhu J, Li J, Zhu X, Wang K,
Shen K, Yang K, Ni X, Liu X, et al: HES1 promotes aerobic
glycolysis and cancer progression of colorectal cancer via
IGF2BP2-mediated GLUT1 m6A modification. Cell Death Discov.
9:4112023. View Article : Google Scholar : PubMed/NCBI
|
|
43
|
Shi L, Liu S, Chen J, Wang H and Wang Z:
Microglial polarization pathways and therapeutic drugs targeting
activated microglia in traumatic brain injury. Neural Regen Res.
21:39–56. 2026. View Article : Google Scholar
|
|
44
|
Mo JS, Kim MY, Han SO, Kim IS, Ann EJ, Lee
KS, Seo MS, Kim JY, Lee SC, Park JW, et al: Integrin-linked kinase
controls Notch1 signaling by down-regulation of protein stability
through Fbw7 ubiquitin ligase. Mol Cell Biol. 27:5565–5574. 2007.
View Article : Google Scholar : PubMed/NCBI
|
|
45
|
Bellon M and Nicot C: Increased
H19/miR-675 expression in adult T-cell leukemia is associated with
a unique notch signature pathway. Int J Mol Sci. 25:51302024.
View Article : Google Scholar : PubMed/NCBI
|
|
46
|
Wu S, Wang Z, Zhu Y, Zhu X, Guo L, Fu Y,
Zhang Q, Mou X and Liu Y: MiR-223-3p regulates the eosinophil
degranulation and enhances the inflammation in allergic rhinitis by
targeting FBXW7. Int Immunopharmacol. 118:1100072023. View Article : Google Scholar : PubMed/NCBI
|
|
47
|
Chen S, Lin J, Zhao J, Lin Q, Liu J, Wang
Q, Mui R and Ma L: FBXW7 attenuates tumor drug resistance and
enhances the efficacy of immunotherapy. Front Oncol.
13:11472392023. View Article : Google Scholar : PubMed/NCBI
|